


Abstract
The fundamental unit of chromatin is the nucleosome that consists of a protein octamer composed of the four core histones (Hs; H3, H4, H2A, and H2B) wrapped by 147 bp of DNA. Nucleosome occupancy and positioning have proven to be dynamic and have a critical impact on expression, regulation, and evolution of eukaryotic genes. We developed nucleosome occupancy and positioning data sets using leaf tissue of rice (Oryza sativa) and both leaf and flower tissues of Arabidopsis (Arabidopsis thaliana). We show that model plant and animal species share the fundamental characteristics associated with nucleosome dynamics. Only 12% and 16% of the Arabidopsis and rice genomes, respectively, were occupied by well-positioned nucleosomes. The cores of positioned nucleosomes were enriched with G/C dinucleotides and showed a lower C→T mutation rate than the linker sequences. We discovered that nucleosomes associated with heterochromatic regions were more spaced with longer linkers than those in euchromatic regions in both plant species. Surprisingly, different nucleosome densities were found to be associated with chromatin in leaf and flower tissues in Arabidopsis. We show that deep MNase-seq data sets can be used to map nucleosome occupancy of specific genomic loci and reveal gene expression patterns correlated with chromatin dynamics in plant genomes.
Nucleosome occupancy and positioning have a critical impact on the expression and regulation of eukaryotic genes, because nucleosome formation can inhibit the access of regulatory proteins to DNA sequences (Struhl and Segal, 2013). Genome-wide maps of nucleosome occupancy and positioning have been developed in several model animal species, including yeast (Saccharomyces cerevisiae; Yuan et al., 2005; Lee et al., 2007), Drosophila melanogaster (Mavrich et al., 2008b), Caenorhabditis elegans (Johnson et al., 2006; Valouev et al., 2008), and humans (Schones et al., 2008; Valouev et al., 2011). These studies revealed that only small proportions of the nucleosomes are specifically positioned in the animal genomes. Most importantly, nucleosomes are depleted at promoter, enhancer, and terminator regions, which allows access of transcription factors (TFs) and other regulatory proteins (Struhl and Segal, 2013). Some TFs can bind to their target sites in the context of nucleosomal DNA by recruiting chromatin remodelers to open up nucleosomes, thereby facilitating the binding of regulatory proteins (Zaret and Carroll, 2011).
Nucleosome positioning is strongly affected by DNA sequences, because more bendable sequences are favorable for wrapping around the nucleosome core. Some sequences, such as the poly(dA:dT) sequences, which are intrinsically stiff, are enriched in linker sequences (Mavrich et al., 2008a, 2008b; Locke et al., 2010; Valouev et al., 2011) and nucleosome-depleted regions, such as promoters (Segal and Widom, 2009; Raveh-Sadka et al., 2012). However, several factors can override the sequence-based nucleosome positioning, including RNA Polymerase II (Pol II) transcription, recruitment of ATP-dependent chromatin remodelers, and the presence of histone variants and histone modifications (Bell et al., 2011; Struhl and Segal, 2013; Li et al., 2014). Therefore, nucleosome occupancy and positioning are dynamic processes during development as well as in response to environmental cues. Therefore, nucleosome positioning and occupancy are determined by combined action of DNA sequence features, TFs, chromatin remodelers, and histone modifiers (Bell et al., 2011).
Compared with model animal species, there has been only limited research on nucleosome occupancy and positioning in plants. Most plant materials, including leaf, root, and flower, are complex tissues that consist of multiple distinct cell types. Thus, nucleosome positions can only be analyzed on the averages of the different cell types and/or cells at various developmental stages. Nevertheless, several recent plant nucleosomal studies have showed the potential to map nucleosome positions using complex plant tissues (Li et al., 2014; Vera et al., 2014; Wu et al., 2014). Typical features of nucleosomal dynamics, such as positioned nucleosomal arrays associated with highly expressed genes, were clearly revealed using complex plant tissues, especially in species with relatively small genomes, including Arabidopsis (Arabidopsis thaliana; Li et al., 2014) and rice (Oryza sativa; Wu et al., 2014). Therefore, we anticipated that application of data sets with significantly improved sequence read depth will likely reveal more details of nucleosome occupancy and positioning in plant genomes. We developed large sequencing data sets of mononucleosomal DNA samples from both rice and Arabidopsis. We show that model plant and animal species share the fundamental characteristics associated with nucleosome occupancy and positioning. Such data sets can be used to map nucleosome occupancy of specific genomic loci and reveal gene expression and evolution associated with nucleosome dynamics.
RESULTS
Global Patterns of Positioning and Spacing of Nucleosomes in Arabidopsis and Rice
We isolated nuclei from leaf tissue of rice and both leaf and flower tissues from Arabidopsis. Chromatin was nearly completely digested by micrococcal nuclease (MNase) into mononucleosome size. The mononucleosome-sized DNA fragments were collected for library preparation and sequenced (MNase-seq). We generated 318, 154, and 132 million paired-end reads from rice leaf (RL), Arabidopsis leaf (AL), and Arabidopsis flower (AF) tissue, respectively. These sequence data sets were equivalent to 63× coverage of the rice genome and 133× (AL) and 114× (AF) coverages of the Arabidopsis genome. We first analyzed the global patterns of nucleosome size and spacing in the Arabidopsis and rice genomes. MNase preferentially digests the linker DNA between nucleosomes. Thus, the lengths of the paired-end MNase-seq reads reflect the sizes of completely cleaved core particles of the nucleosomes. Our measurements revealed the average lengths of 147 bp for RL, 148 bp for AL, and 147 bp for AF (Fig. 1, A–C), which are close to the 147 bp required to wrap canonical nucleosomes (Richmond and Davey, 2003).
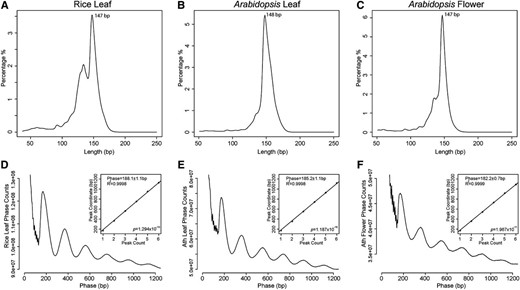
Size and phasing of nucleosomes in Arabidopsis and rice. A to C, Distributions of lengths of MNase-digested mononucleosomal DNA fragments derived from RL (A), AL (B), and AF tissues (C). The x axes represent the lengths of the MNase-seq sequence reads, and the y axes represent the percentages for each length. D to F, Phasograms of nucleosomes. The x axes show the ranges of recorded phases, and the y axes represent the frequencies of distance between the midpoints of two fragments from RL (D), AL (E), and AF tissue (F). Insets in D to F, Linear fit to the positions of the phase peaks.
Phasograms can be used to reveal the spacing of nucleosomes, which is the distance between neighboring nucleosome cores (Valouev et al., 2008, 2011). We measured the length between the midpoints of two neighboring paired-end reads. We then used the fitting linear model to estimate the spacing, which was estimated to be 188.1 ± 1.1 bp (R 2 = 0.9998, P < 1.294 × 10⁻¹⁰) for nucleosomes in RL, 185.1 ± 1.1 bp (R 2 = 0.9998, P < 1.187 × 10⁻¹⁰) in AL, and 182.2 ± 0.7 bp (R 2 = 0.9999, P < 1.967 × 10⁻¹¹) in AF. Given the nucleosome core covering 147 bp, the average size of linker DNA between two-neighbored nucleosome is 41.1 bp in RL, 38.1 bp in AL, and 35.2 bp in AF (Fig. 1, D–F).
We were intrigued by the fact that the average linker length from the flower data set is 3 bp shorter than that from the leaf data set in Arabidopsis. We identified a total of 118 Arabidopsis histone coding genes (Supplemental Table S1) from the Uniprot database (http://www.uniprot.org). The expression of these genes was analyzed by using RNA-sequencing (RNA-seq) data developed in our laboratory (Zhang et al., 2012) as well as publicly available genomic tiling array data (Iida et al., 2011). We found that the average expression levels of these genes were higher in flower (1,150 in tilling array; 88.7 fragments per kilobase of transcript per million mapped reads [FPKM] in RNA-seq) than in leaf (703 in tilling array; 43.9 FPKM in RNA-seq; Supplemental Fig. S1; Wilcox rank sum test, RNA-seq data P < 0.005, genomic tiling array data P < 0.05). A total of 109 (92%) and 94 (80%) of the 118 genes showed a higher expression level in flower than in leaf as revealed by the RNA-seq and genomic tilling data, respectively. Thus, shorter linker sequences between neighboring nucleosomes may implicate a higher average nucleosome density that could result from the higher expression levels of the histone coding genes in flower tissue.
Nucleosome Spacing Associated with Euchromatin and Heterochromatin in Plant Genomes
Nucleosomes in the human genome show different spacing in regions associated with promoters, gene bodies, or heterochromatin (Valouev et al., 2011). We examined if different nucleosome spacing patterns are associated with chromatin status in plant genomes. We first examined spacing between adjacent nucleosomes by integrating MNase-seq data with histone modification data sets developed in our laboratory or from other groups, including euchromatic marks H3K4me2 (for double methylation of histone H3 at lysine 4), H3K4me3, H3K36me3, H3K27me3, H3K9ac (for acetylation of histone H3 at lysine 9), H3K18ac, and H4K12ac and heterochromatic marks H3K27me1, H3K27me3, and H3K9me2 (Fig. 2). We found that nucleosomes associated with heterochromatic histone modification marks have larger spacing than those associated with euchromatic histone modification marks (Fig. 2). These results agreed with the similar patterns described in humans (Valouev et al., 2011). Interestingly, this differential nucleosome spacing was more distinct in Arabidopsis than in rice (Fig. 2). Cytologically visible heterochromatin is almost exclusively located in the pericentromeric regions of the five Arabidopsis chromosomes and appears as distinct heterochromatic foci (or chromocenters) in interphase nuclei (Fransz et al., 2002). In contrast, small heterochromatic domains are distributed throughout most rice chromosomes (Cheng et al., 2001). Interphase heterochromatin and euchromatin in rice are not as distinguishable as those in Arabidopsis. Therefore, heterochromatin is better isolated from euchromatin in Arabidopsis than in rice, and it is also more distinctly different from euchromatin at the nucleosome level in Arabidopsis.
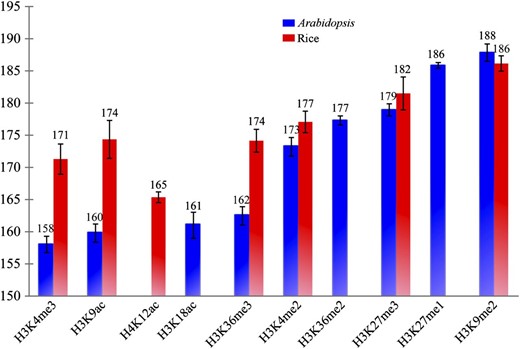
Spacing of nucleosomes associated with specific histone modification markers. The x axis shows different histone modification markers. The y axis represents the average distance between two adjacent nucleosomes. All histone modification data were derived from leaf tissues in both species. H3K27me1, H3K27me3, and H3K9me2 are histone modification marks that are considered to be associated with heterochromatin. The rest of the histone modification marks are associated with euchromatin.
We predicted that heterochromatin is likely more resistant to MNase digestion than euchromatin. Thus, heterochromatic regions may generate relatively longer MNase-seq reads. To test this hypothesis, we divided the MNase-seq reads into three subgroups based on length: >152, 147 ± 5, and <142 bp. We then mapped the reads from the three groups separately along individual chromosomes. Reads from the >152-bp group were significantly enriched in the heterochromatic regions in both species, which were clearly visible in the pericentromeric domains of all five Arabidopsis chromosomes (Fig. 3; Supplemental Fig. S2) and the short arms of rice chromosomes 4 and 10 (Fig. 3; Supplemental Fig. S3), the two most heterochromatic chromosomal arms in the rice genome (Cheng et al., 2001). By contrast, the reads from the other two groups were depleted in the heterochromatic regions and enriched in the genic regions. These results support that nucleosome spacing is different between heterochromatic and euchromatic regions in plant genomes.
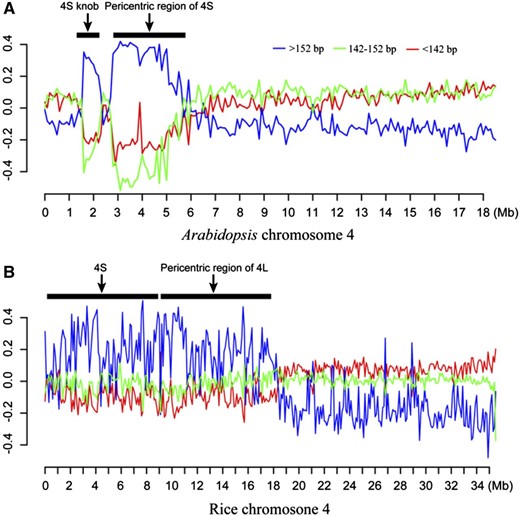
Chromosomal distribution of three groups of MNase-seq reads in lengths of >152, 147 ± 5, and <142 bp. A, Distribution of MNase-seq reads (data from leaf tissue) along chromosome 4 of Arabidopsis. The two horizontal bars represent the positions of the pericentromeric region and a knob located in the short arm of the chromosome (both are highly heterochromatic; Fransz et al., 2000). B, Distribution of MNase-seq reads along chromosome 4 of rice. The short arm and pericentromeric region of the long arm, both highly heterochromatic (Cheng et al., 2001), are marked by two horizontal bars. The x axes show DNA positions along the chromosomes. The y axes represent the normalized DNA fragment count ratio (“Materials and Methods”) of a specific group within 100-kb windows. Heterochromatic regions are enriched with reads >152 bp in both species.
DNA Sequence Features Associated with Positioned Nucleosomes
We identified a set of well-positioned nucleosomes and a set of loosely positioned nucleosomes in the rice and Arabidopsis genomes using the methods developed in humans (Valouev et al., 2011; Fig. 4; Table I). The sequences of well-positioned nucleosomes only accounted for approximately 12% and 16% of the Arabidopsis and rice genomes, respectively (Table I). We aligned the sequences of these nucleosomes and analyzed the distribution of dinucleotides within ±150 bp from the dyad of each nucleosome (Fig. 4). The nucleosome cores were clearly enriched with SS (G/C) dinucleotides. By contrast, WW (A/T) dinucleotides were enriched in approximately 90 bp far away from dyads, which are considered as linkers connecting two neighbored nucleosomes (Fig. 4). These results agreed with the sequence preference in nucleosome formation reported in animal species (Mavrich et al., 2008b; Valouev et al., 2011).
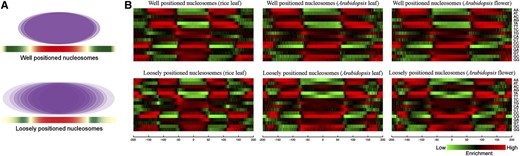
Sequence features associated with well-positioned and loosely positioned nucleosomes. A, Models of a well-positioned nucleosome and a loosely positioned nucleosome (“Materials and Methods”). B, Heat map of different dinucleotides located ±200 bp from the dyad of nucleosomes.
Number of well-positioned and loosely positioned nucleosomes in Arabidopsis and rice genomes
| Tissue | Well-Positioned Nucleosomes | Genome Covered by Well-Positioned Nucleosomesa | Loosely Positioned Nucleosomes | Genome Covered by Loosely Positioned Nucleosomesa | Total Nucleosomes | Genome-Covered Nucleosomesa |
|---|---|---|---|---|---|---|
| % | % | % | ||||
| AL | 110,170 | 13.59 | 414,593 | 51.15 | 524,763 | 64.74 |
| AF | 96,000 | 11.84 | 437,906 | 54.03 | 533,906 | 65.87 |
| RL | 401,470 | 15.81 | 1,252,808 | 49.34 | 1,654,278 | 65.15 |
The genome coverage is calculated by combining sequences from all nucleosomes (147 bp per nucleosome). The genome sizes of Arabidopsis (The Arabidopsis Information Resource 10) and rice (The Institute for Genomic Research 7) are 119.1 and 373.2 Mb, respectively.
| Tissue | Well-Positioned Nucleosomes | Genome Covered by Well-Positioned Nucleosomesa | Loosely Positioned Nucleosomes | Genome Covered by Loosely Positioned Nucleosomesa | Total Nucleosomes | Genome-Covered Nucleosomesa |
|---|---|---|---|---|---|---|
| % | % | % | ||||
| AL | 110,170 | 13.59 | 414,593 | 51.15 | 524,763 | 64.74 |
| AF | 96,000 | 11.84 | 437,906 | 54.03 | 533,906 | 65.87 |
| RL | 401,470 | 15.81 | 1,252,808 | 49.34 | 1,654,278 | 65.15 |
The genome coverage is calculated by combining sequences from all nucleosomes (147 bp per nucleosome). The genome sizes of Arabidopsis (The Arabidopsis Information Resource 10) and rice (The Institute for Genomic Research 7) are 119.1 and 373.2 Mb, respectively.
Impact of Nucleosome Positioning and Occupancy on Gene Expression
It has been documented in several model animal species that nucleosomes are well positioned around the transcription start sites (TSSs; Yuan et al., 2005; Lee et al., 2007; Mavrich et al., 2008b; Schones et al., 2008; Sasaki et al., 2009; Zhang et al., 2009; Valouev et al., 2011; Hughes et al., 2012). To analyze the transcription-dependent nucleosome positioning around TSSs, we sorted the rice and Arabidopsis genes based on their expression levels using RNA-seq data sets. We used the same plant tissues to develop both RNA-seq and MNase-seq data sets in both rice and Arabidopsis. Because these data sets were developed from tissues at the same developmental stages, it allowed a correlated study between gene expression and nucleosome dynamics. We aligned MNase-seq reads to 500 bp upstream and 1,000 bp downstream of the TSS of each gene. Promoters of highly expressed genes were generally associated with larger nucleosome-depleted regions than the low-expressed genes (Fig. 5). In addition, phased nucleosome arrays were found to follow the TSSs of genes with medium to high levels of expression but not in low- or nonexpressed genes (Fig. 5; Supplemental Fig. S4). These results were in agreement with two recent reports on the relationship between nucleosome positioning and gene expression in rice (Wu et al., 2014) and Arabidopsis (Li et al., 2014).
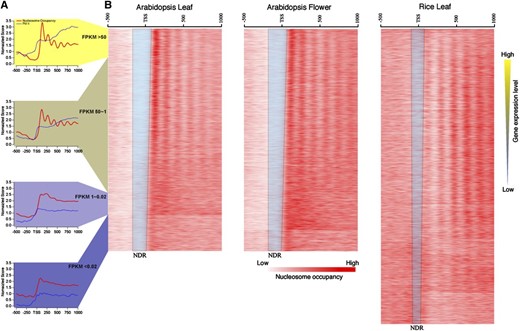
Relationship between gene expression and nucleosome positioning. A, Profiles of nucleosome positioning and Pol II occupancy (Chodavarapu et al., 2010) grouped based on the expression levels of all Arabidopsis genes in leaf tissue. The red lines show the nucleosome occupancy, and the blue lines represent the Pol II occupancy. B, Heat maps of nucleosome occupancy associated with rice and Arabidopsis genes sorted based on levels of expression. The blue trapezoids include nucleosome-depleted regions (NDRs) of the genes. Note that RNA-seq data from rice and Arabidopsis were obtained from same tissues used for MNase-seq.
We next investigated if the MNase-seq data sets can be used to examine the nucleosome occupancy of individual genomic loci and its relationship with tissue-specific gene expression. We predicted that the nucleosome occupancy of a specific DNA locus will be correlated with its level of sensitivity to DNase I digestion, because tight wrapping of the sequences around the nucleosome core will enhance its resistance to DNase I digestion through creating physical hindrance to the access of DNase I. We first examined the change of DNase I hypersensitivity of chromatin from leaf and flower tissues of Arabidopsis (Zhang et al., 2012) by calculating and mapping the ratio of DNase-sequencing (DNase-seq) reads derived from the two tissues. We then examined the change of nucleosome occupancy by calculating and mapping the ratio of MNase-seq reads from the two tissues (Fig. 6). As we predicted, the DNase I hypersensitivity level change between leaf and flower was negatively correlated with nucleosome occupancy change (Fig. 6).
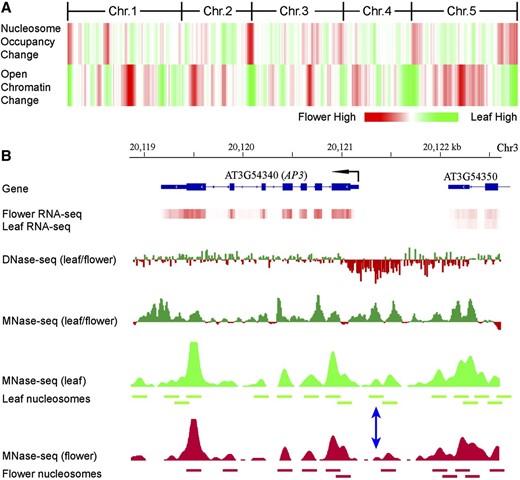
Relationship between nucleosome occupancy and chromatin sensitivity to DNase I digestion. A, Heat map of nucleosome occupancy and open chromatin change. Red represents higher nucleosome occupancy or sensitivity to DNase I digestion in flower than in leaf. Green represents higher nucleosome occupancy or sensitivity to DNase I digestion in leaf than in flower. Chr., Chromosome. B, Nucleosome occupancy and open chromatin dynamics associated with expression of the AP3 gene. Positioned nucleosomes were identified based on MNase-seq data sets and are presented as horizontal bars. The blue double arrow indicates a nucleosome that is detectable in leaf but not detectable in flower.
We next performed similar comparative analysis within specific genomic regions. The APETALA3 (AP3) gene plays a key role in flower development (Krizek and Fletcher, 2005). AP3 is repressed by polycomb proteins before flower formation and activated by the switch2/sucrose nonfermentable2 chromatin remodeling adenosine triphosphatases at the onset of flower patterning (Wu et al., 2012). The expression level of the AP3 gene is significantly higher in flower tissue (FPKM = 103.67) than in leaf tissue (FPKM = 0.32). The promoter region of the AP3 gene showed a significantly increased number of DNase-seq reads in flower tissue compared with leaf tissue, which is correlated with the high level of expression of this gene in flowers. In contrast, the AP3 sequence showed a higher level of nucleosome occupancy in leaf than in flower tissue (Fig. 6). Individual nucleosomes can be identified in this region based on the MNase-seq data sets from both tissues. Two well-positioned nucleosomes were detected in the promoter region in leaf tissue, but at least one of the two nucleosomes was not detectable in the flower tissue (blue double arrow in Fig. 6B). These results showed that MNase-seq data sets together with the DNase-seq data set can be used to monitor chromatin/nucleosome status and its impact on gene expression of individual genomic loci.
Tissue-Specific Nucleosome Occupancy Is Negatively Correlated with Tissue-Specific TF Binding in Arabidopsis
A large number of DNA sequence motifs associated with cis-regulatory DNA elements has been identified in Arabidopsis (Higo et al., 1999; Yilmaz et al., 2011). These DNA motifs were predicted to be binding sites of TFs and other regulatory proteins. If a TF binding site, represented by a specific DNA motif, is occupied by a nucleosome, then it will not be accessible to binding of regulatory proteins (Bell et al., 2011; Chen et al., 2014). Thus, we predicted that tissue-specific nucleosome occupancy in a motif-spanning genomic region would prevent binding of a specific TF in the same tissue. To test this prediction, we identified a total of 211,801 genomic regions in which the nucleosome occupancy was significantly higher in leaf tissue than in flower tissue based on position and occupancy analyses using DANPOS (Chen et al., 2013). Similarly, we identified 149,541 genomic regions that were more occupied by nucleosomes in flower tissue than in leaf tissue. We downloaded 99 annotated TF binding motifs from the Arabidopsis Gene Regulatory Information Server (http://Arabidopsis.med.ohio-state.edu/AtcisDB/bindingsites.html). We then identified flower- and leaf-specific nucleosomes that contain one of these motifs.
The tissue-specific nucleosomes associated with 75 motifs were further analyzed. At least 11 of these 75 motifs were annotated to be associated with regulation of flower development (Fig. 7). As we expected, tissue-specific nucleosomes containing these 11 motifs were more frequently present in leaf tissue (Fig. 7). These results indicate that these genomic regions are free of nucleosomes and likely bound to TFs in flower tissue but are occupied by nucleosomes in leaf tissue. For example, AGAMOUS-LIKE3 (AGL3) is an MADS domain protein and plays a key role in flower development (Huang et al., 1995). The Arabidopsis genome includes a total of 111 regions that contain the AGL3 binding motif TT(A/T)C(C/T)A(A/T)(A/T)(A/T)(A/T)T(A/G)G(A/T)AA. We found that 22 of these motif-spanning regions were occupied by leaf-specific nucleosomes. By contrast, none of these 111 regions were occupied by a flower-specific nucleosome. Flower-specific nucleosomes were more frequently associated with 12 of the 75 motifs, suggesting that these motifs may play regulatory roles in leaf development (Fig. 7).
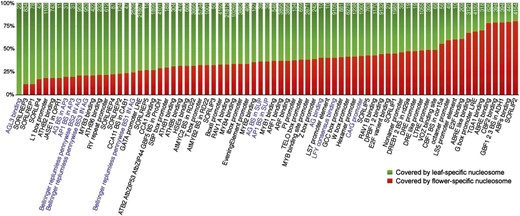
Tissue-specific nucleosomes spanning a protein binding DNA motif. The y axis is the percentage of motif covered by tissue-specific nucleosome. Purple highlights DNA motifs related to flower development.
Single-Nucleotide Polymorphisms around Dyads of Positioned Nucleosomes
Cytosine is known to be subjected to hydrolytic deamination, which leads to the C→T mutation. The C→T change is a major source of DNA sequence mutation during evolution (Lynch et al., 2008). A recent study in yeasts showed that nucleosomal DNA has an approximately 50% decrease of the C→T mutation compared with linker DNA (Chen et al., 2012). Both positive and negative selections were found to be linked to human nucleosome positioning (Prendergast and Semple, 2011). Thus, nucleosome positioning can impact the evolution of the underlying DNA sequences (Prendergast and Semple, 2011; Chen et al., 2012; Langley et al., 2014). Specifically, selection seems to maintain optimum GC compositions in nucleosome core and linker regions, including unexpectedly elevated rates of C→T substitutions at linker regions, but significant depletion of the same substitutions in nucleosome cores during recent human evolution (Prendergast and Semple, 2011). Thus, nucleosome dyads seem to suppress the C→T mutation.
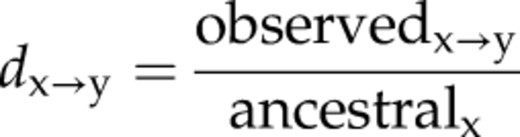
We wanted to test if similar C→T mutation patterns are associated with the well-positioned and loosely positioned nucleosomes identified in rice and Arabidopsis genomes. We aligned nucleosome dyads of all well-positioned and loosely positioned nucleosomes from RL, AL, and AF. We then mapped previously identified single-nucleotide polymorphisms (SNPs) associated with these sequences. These SNPs were generated from 80 Arabidopsis accessions (Cao et al., 2011) and 950 rice varieties (Huang et al., 2012). The x→y mutation rate at each nucleotide position was calculated by dividing the observed number of base changes by the total number of matching ancestral bases (Prendergast and Semple, 2011). We found that the C→T mutation rates in the linker regions were higher than those in nucleosome core regions in both well-positioned and loosely positioned nucleosomes (Fig. 8).
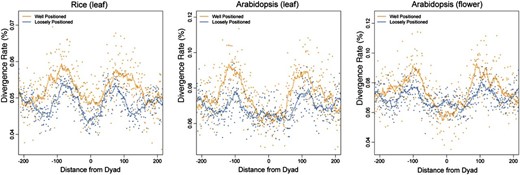
C→T mutation rate around nucleosome dyads. Dots represent the C→T mutation rate. Lines correspond to 15-bp sliding averages. Gold represents well-positioned nucleosomes, and blue represents loosely positioned nucleosomes.
We next calculated the average mutation rate of each position around ±125 bp from the dyad. The average mutation rate in the linker regions (approximately −125 to −75 bp and approximately 75–125 bp away from dyad) or the core regions (approximately −75–75 bp from dyad) from well-positioned nucleosomes was used to subtract the average mutation rate in the linker regions from loosely positioned nucleosomes. These values represent the mutation rate variance between the two types of nucleosomes. We found that the C→T mutation rate variance in the linkers is significantly higher than that in the cores (RL, P < 5.9 × 10⁻³; AL, P < 6.2 × 10⁻¹²; AF, P < 7.8 × 10⁻⁹; Kolmogorov-Smirnov tests). In addition, we observed that the G→A mutation rate within linkers and cores shows a similar pattern with that of C→T mutation. In contrast, the A→G and T→C mutation rates were opposite to the C→T mutation pattern (Supplemental Fig. S5). Therefore, well-positioned nucleosomes were clearly better adapted to accumulate A→G or T→C mutation in the cores and C→T or G→A mutation in the linkers than loosely positioned nucleosomes.
DISCUSSION
We show that model plant and animal species share the fundamental characteristics associated with nucleosome occupancy and positioning. Well-positioned nucleosomes occupy approximately 12% and 16% of the Arabidopsis and rice genomes, respectively (Table I). Similarly, only 20% of the human genome is occupied by preferentially positioned nucleosomes (Valouev et al., 2011). The cores of well-positioned nucleosomes in plants are enriched with SS (G/C) dinucleotides, whereas WW (A/T) dinucleotides are enriched in linker sequences (Fig. 4). The same pattern was well documented in animal species (Mavrich et al., 2008b; Valouev et al., 2011). The nucleosome depletion and nucleosome phasing patterns surrounding active genes in Arabidopsis and rice are similar to those reported in animal species (Figs. 5 and 6).
SNP data sets generated from a large number of genotypes of both Arabidopsis and rice allowed us to analyze the mutation patterns of sequences associated with nucleosome cores and linkers. We confirmed the C→T and A→G mutation patterns associated with positioned nucleosomes reported in animal genomes (Prendergast and Semple, 2011; Chen et al., 2012). In addition, we discovered that these specific mutation patterns are more distinct in well-positioned nucleosomes than those associated with loosely positioned nucleosomes (Fig. 8). Our results further support the concept that nucleosome positioning can have evolutionary consequences, because mutations in genes, which are often associated with phased nucleosomes (Fig. 5), can potentially be dictated by these unique C→T and A→G mutation patterns.
Differential spacing of nucleosomes associated with different genomic regions was reported in the human genome (Valouev et al., 2011). Genomics regions associated with active promoters/enhancers, marked by H3K4me1 and H3K27ac, contained the shortest spacing of 178 to 187 bp. By contrast, heterochromatic regions, marked by H3K9me3 and H3K27me3, contained the largest spacing of 205 bp in the human genome (Valouev et al., 2011). We observed a similar differential spacing associated with chromosomal regions marked by various histone modifications in both rice and Arabidopsis (Fig. 2). We further confirmed this differential spacing by mapping MNase-seq reads of different lengths along the chromosomes. Both rice and Arabidopsis contain distinct heterochromatic domains that can be visualized at the cytological level (Fransz et al., 2000; Cheng et al., 2001). The heterochromatic regions in both species are clearly enriched with longer MNase-seq reads (Fig. 3). Our results suggest that nucleosomes associated with heterochromatin contain longer linkers than those associated with euchromatin. The longer linkers may be favorable for more compact folding of the nucleosome fibers, which would result in more condensed chromatin.
Significantly different average nucleosome spacing was detected in different cell types in humans. The wave peaks in Phasograms were 196 bp apart in human granulocytes. By contrast, the wave peaks were 203 bp apart in human T cells (Valouev et al., 2011). This difference was explained by the variation of linker histone (H1) gene expression, which was 2.4 times higher in T cells compared with granulocytes (Valouev et al., 2011). Although both leaf and flower contain many different cell types, we observed a surprising difference in the average nucleosome spacing between these two tissues in Arabidopsis. We speculated that regulation in the expression of a single H1 gene may not be sufficient to alter genome-wide nucleosome spacing in a complex plant tissue. Instead, we found that the expression levels of most histone coding genes were higher in flower than in leaf (Supplemental Fig. S1), which would generate more histone proteins and may contribute to the higher nucleosome density in flower tissue. However, the relative expression levels of the histone coding genes could be impacted by potentially different proportions of terminally differentiated cells in the two tissues. Thus, additional research will be required to explain the different levels of nucleosome spacing in leaf and flower tissues in Arabidopsis.
MATERIALS AND METHODS
Materials
Rice (Oryza sativa) ‘Nipponbare’ and Arabidopsis (Arabidopsis thaliana) ecotype Columbia were used in this study. Rice seeds were pregerminated at room temperature for 3 d. The germinated seeds were sown in soil for continuing growth under greenhouse conditions for 2 weeks. Arabidopsis seeds were germinated in one-half-strength Murashige and Skoog medium, and Arabidopsis seedlings either continued to grow in the same Murashige and Skoog medium or were transferred to the soil for growing until the flowering stage in the greenhouse. Two-week-old seedlings of both species and closed flower buds of Arabidopsis were collected for nuclei isolation.
Identification of Positioned Nucleosomes
Collection of mononucleosome-sized DNA for library preparation and sequencing was performed as described previously (Schones et al., 2008; Zhang et al., 2013). Intact chromatin wasdigested by MNase to produce approximately 80% mononucleosomes plus 20% dinucleosomes. Mononucleosome-sized DNA fragments were selected and gel purified for library preparation. The gel-purified DNA fragments were ligated to paired-end adaptors after blunt-ended treatment. The MNase-seq libraries were sequenced by the Illumina GAII or Hiseq2000 platform. Well-positioned and loosely positioned nucleosomes were identified using nucleR (Flores and Orozco, 2011). All paired-end sequence reads were mapped to rice (The Institute for Genomic Research 7) and Arabidopsis (The Arabidopsis Information Resource 10) genomes using Bowtie (Langmead et al., 2009) and imported to R. We used the filterFFT function of nucleR to remove noise and smooth the read count score of each position along chromosomes with the parameter pcKeepComp = 0.01. After noise removal, nucleosome peaks and centers/dyads were determined using the peakDetection function (threshold = 25%, score = true, width = 140). Overlapped peaks were merged into longer regions, which were defined as loosely positioned nucleosomes, and distinct individual peaks were defined as well-positioned nucleosomes. If the length of merged peaks is longer than 150 bp, this region is considered to contain more than two nucleosome dyads and thus, contains loosely positioned nucleosomes. If the length of merged peaks is shorter than 150 bp, this region is considered to contain a well-positioned nucleosome.
The phasogram and average distance between two adjacent nucleosomes were calculated using our previously reported methods (Zhang et al., 2013). The nucleosome occupancy change scores were calculated by DANPOS (Chen et al., 2013). Analyses of dinucleotide frequency followed previously published methods (Locke et al., 2010; Valouev et al., 2011).
Data Analysis
Data Deposition
The MNase-seq data sets from this article can be found in the National Center for Biotechnology Information database Sequence Read Archive under accession number SRP045236.
Supplemental Data
The following supplemental materials are available.
Supplemental Figure S1. Box plots of expression of histone coding genes in Arabidopsis.
Supplemental Figure S2. Chromosomal distribution of three groups of MNase-seq reads in lengths of >152, 147 ± 5, and <142 bp in Arabidopsis.
Supplemental Figure S3. Chromosomal distribution of three groups of MNase-seq reads in lengths of >152, 147 ± 5, and <142 bp in rice.
Supplemental Figure S4. Nucleosome occupancy associated with genes that were grouped based on their expression levels.
Supplemental Figure S5. Mutation rate around nucleosome dyads.
Supplemental Table S1. Expression of histone coding genes in Arabidopsis.
ACKNOWLEDGMENTS
We thank the Dale Bumpers National Rice Research Center for providing the cv Nipponbare seeds.
Glossary
- AF
Arabidopsis flower
- AL
Arabidopsis leaf
- DNase-seq
DNase sequencing
- MNase
micrococcal nuclease
- MNase-seq
micrococcal nuclease sequencing
- RL
rice leaf
- RNA-seq
RNA sequencing
- SNP
single-nucleotide polymorphism
- TF
transcription factor
- TSS
transcription start site
LITERATURE CITED
Author notes
This work was supported by the National Science Foundation (grant nos. MCB0923640 and MCB1412948).
These authors contributed equally to the article.
Address correspondence to [email protected].
The author responsible for distribution of materials integral to the findings presented in this article in accordance with the policy described in the Instructions for Authors (www.plantphysiol.org) is: Jiming Jiang ([email protected]).
W.Z. performed the experiments; T.Z. performed the bioinformatic analyses; J.J. conceived the research and wrote the article with contributions of all authors.
Articles can be viewed without a subscription.
