


Abstract
Plants have developed a variety of mechanisms to cope with abiotic and biotic stresses. In a previous subcellular localization study of hydrogen peroxide-responsive proteins, two peptides with an unknown function (designated ARACIN1 and ARACIN2) have been identified. These peptides are structurally very similar but are transcriptionally differentially regulated during abiotic stresses during Botrytis cinerea infection or after benzothiadiazole and methyl jasmonate treatments. In Arabidopsis (Arabidopsis thaliana), these paralogous genes are positioned in tandem within a cluster of pathogen defense-related genes. Both ARACINs are small, cationic, and hydrophobic peptides, known characteristics for antimicrobial peptides. Their genes are expressed in peripheral cell layers prone to pathogen entry and are lineage specific to the Brassicaceae family. In vitro bioassays demonstrated that both ARACIN peptides have a direct antifungal effect against the agronomically and economically important necrotrophic fungi B. cinerea, Alternaria brassicicola, Fusarium graminearum, and Sclerotinia sclerotiorum and yeast (Saccharomyces cerevisiae). In addition, transgenic Arabidopsis plants that ectopically express ARACIN1 are protected better against infections with both B. cinerea and A. brassicicola. Therefore, we can conclude that both ARACINs act as antimicrobial peptides.
During biotic and abiotic stresses, the cellular metabolic status is perturbed, producing a variety of reactive oxygen species (ROS) as a consequence (Van Breusegem et al., 2008; Mittler et al., 2011). In addition to being toxic byproducts of aerobic metabolism, ROS and, more particularly, hydrogen peroxide (H2O2) are considered as signaling molecules that trigger signal transduction pathways involved in defense responses and cell death (Apel and Hirt, 2004; Gadjev et al., 2006; Van Breusegem and Dat, 2006). Transcriptome analyses revealed an important enrichment of ROS-responsive genes during biotic and abiotic stresses, including many defense-related genes such as the pathogenesis-related genes (Broekaert et al., 2000; Apel and Hirt, 2004; Torres and Dangl, 2005; Torres et al., 2006; van Loon et al., 2006; Queval et al., 2012). Among them, antimicrobial peptides (AMPs) are considered to play a key role in plant defense, acting both as permanent and inducible defense barriers (García-Olmedo et al., 1998).
Plant AMPs are generally small (12–50 amino acids), cationic, hydrophobic, and secreted peptides that are widespread throughout the plant kingdom and include plant defensins, lipid transfer proteins, hevein- and knottin-type peptides, cyclotides, snakins, maize (Zea mays) basic peptide1, and polyprotein precursor AMPs from both Macadamia integrifolia and Impatiens balsamina (Broekaert et al., 1995; García-Olmedo et al., 1998; Theis and Stahl, 2004; Sels et al., 2008). Due to their amphipathic nature, AMPs are able to permeabilize the pathogen’s membrane by both specific and nonspecific electrostatic and hydrophobic interactions with cell surface groups (Shai, 2002; Thevissen et al., 2003; Aerts et al., 2008). However, increasing evidence shows that the antimicrobial action of some AMPs can be based on more targeted mechanisms, including the interaction with microbe-specific sphingolipids that act as a plant defensin interaction site (Thevissen et al., 2000, 2003, 2004; Wilmes et al., 2011). In addition, AMPs can act as protein translation or enzyme inhibitors, such as α-amylase and protease inhibitors (Broekaert et al., 1997; Lay and Anderson, 2005; Carvalho and Gomes, 2009), or they can inhibit ion channels (Kushmerick et al., 1998; Spelbrink et al., 2004). Interestingly, roles other than antimicrobial activity have been identified (Franco, 2011), i.e. redox regulation (Huang et al., 2008) and development (Takayama et al., 2001; Stotz et al., 2009; Amien et al., 2010).
Overexpression of AMPs has been proposed as a promising strategy to increase disease resistance in transgenic plants (Carvalho and Gomes, 2009, 2011; Visser et al., 2012) thanks to their small size, broad-spectrum activity targeting the pathogen’s membrane, and a mode of action that is difficult to develop resistance against (Bulet et al., 2004; Marcos et al., 2008; Eggenberger et al., 2011; Sarika et al., 2012). Overexpression of the radish (Raphanus sativus) antifungal peptide RsAFP2 in transgenic Nicotiana tabacum plants increased resistance against the fungus Alternaria longipes (Terras et al., 1995), while overexpression of an alfalfa (Medicago sativa) defensin (alfAFP) in transgenic potato (Solanum tuberosum) provided high levels of field resistance against Verticillium dahliae, the causative agent of the agronomically important early dying disease (Gao et al., 2000). A more advanced and durable approach is to engineer transgenic plants that synthesize chimeras of two or more AMPs with different modes of action to develop a broad-spectrum resistance. For example, overexpression of a chimeric cleavable polyprotein precursor containing the mature domains of the plant defensins Dahlia merckii AMP1 (DmAMP1) and RsAFP2 resulted in the efficient release of both bioactive antifungal peptides (François et al., 2002; Thevissen et al., 2004).
AMP overexpression can also confer enhanced tolerance to abiotic stresses (Mirouze et al., 2006; Tamaoki et al., 2008; Lee and Hwang, 2009). For instance, overexpression of the Capsicum annuum AMP1 (CaAMP1) gene in Arabidopsis (Arabidopsis thaliana) increased not only resistance against both bacterial and fungal pathogens, but also tolerance to high salt and drought stresses (Lee et al., 2008; Lee and Hwang, 2009). Another example demonstrating the involvement of AMPs in abiotic stress is the zinc stress tolerance in transgenic Arabidopsis lines obtained by overexpression of PLANT DEFENSIN (PDF) genes of Arabidopsis halleri (Mirouze et al., 2006).
Here, we characterized two Arabidopsis AMPs, designated ARACIN1 and ARACIN2, that are transcriptionally regulated by both biotic and abiotic stresses. We demonstrate their antifungal activities in vitro against the broad-host necrotrophic plant fungus Botrytis cinerea, the causing agent of gray mold disease, and Alternaria brassicicola, which causes black spot disease on members of the Brassicaceae family (Neergaard and Andersen, 1945; Braverman, 1971; Lawrence et al., 2008). Furthermore, in planta overexpression of ARACIN1 significantly improved resistance against both pathogens.
RESULTS
Stress and Hormone Responsiveness of ARACIN1 and ARACIN2
Previously, we compiled a comprehensive list of H2O2-responsive genes using catalase-deficient Arabidopsis plants exposed to high-light irradiation. Reduced catalase levels, together with high-light exposure, leads to the accumulation of photorespiratory H2O2 that, in turn, affects the expression of more than 700 genes (Vanderauwera et al., 2005, 2011; Inzé et al., 2012). ARACIN1 (At5g36925), a peptide of unknown function, was previously identified as nucleocytosolic in a subcellular localization study of H2O2-induced proteins (Inzé et al., 2012). The expression of ARACIN1 and the highly similar paralog ARACIN2 (At5g36920) was induced (22-fold and 1.35-fold, respectively) by increased levels of photorespiratory H2O2.
Due to the absence of representative probe sets on the Affymetrix ATH1 microarray platform, the array-derived expression data on both genes were rather scarce and limited to publicly available data sets that had been obtained from Agilent Arabidopsis V3 arrays and diverse tiling array platforms. From these data sets, we could deduce a down-regulation of ARACIN1 by abscisic acid and heat stress (Zeller et al., 2009) and an up-regulation in response to Agrobacterium tumefaciens infection (Ditt et al., 2006). To complement these array-based abiotic stress-related data, we performed a detailed expression analysis with quantitative PCR on RNA from salt-, cold-, and heat-stressed plants (see “Materials and Methods”). Transcripts of ARACIN1 were transiently up-regulated by cold stress (5.92-fold after 13 h; Fig. 1A), whereas ARACIN2 expression remained unaffected. During heat stress, transcripts of ARACIN1 were substantially down-regulated after 6 and 12 h at 37°C, whereas ARACIN2 was up-regulated (Fig. 1B).
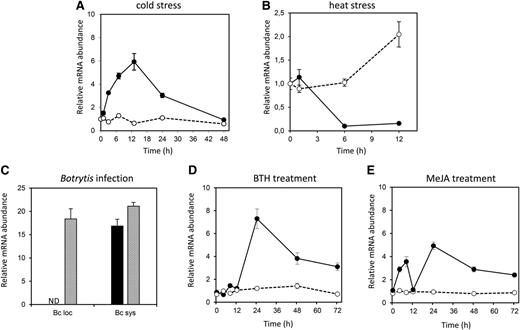
Transcriptional regulation of ARACIN1 and ARACIN2. Relative abundance of ARACIN1 and ARACIN2 transcripts after cold stress (A), heat stress (B), B. cinerea infection (C), BTH treatment (D), and MeJA treatment (E) represented as fold change relative to wild-type/unstressed or mock-treated values and normalized against ARP7 (A, B, D, and E) or ELONGATING FACTOR1-α (EF1-α; C; see “Materials and Methods”). Data are the means ± se (n = 3). ARACIN1 and ARACIN2 transcript levels are represented by black bars/lines and gray bars/dotted lines, respectively. Bc loc, Local B. cinerea infection; Bc sys, systemic B. cinerea infection; ND, not detected.
To investigate the transcriptional regulation of ARACIN1 and ARACIN2 during biotic stress, we assessed their transcript levels after infection with the necrotrophic fungus B. cinerea. Therefore, 4-week-old Arabidopsis plants were inoculated with B. cinerea, and locally and systemically infected leaves were collected 48 h postinoculation. Only ARACIN2 was strongly induced (16.8-fold) in locally infected leaves, and both genes were induced in systemically infected leaves (Fig. 1C). Further, we assessed their responsiveness toward the defense hormones salicylic acid (SA) and methyl jasmonate (MeJA). Plants were treated with MeJA and benzothiadiazole (BTH), which has an analogous effect to SA and activates the plant’s natural defense mechanisms (Lawton et al., 1996; Thomma et al., 2000). After 24 h, the expression of ARACIN1 was 7-fold higher in BTH-treated plants than in mock-treated plants and decreased to 3-fold after 72 h (Fig. 1D). By contrast, the expression of ARACIN2 was not affected by BTH (Fig. 1D). The MeJA response of ARACIN1 was biphasic: after 4 h, the expression of ARACIN1 increased almost 3-fold and reached its first maximum after 8 h, returned to basal levels after 12 h, and reached a second maximum after 24 h (Fig. 1E). Again, the expression of ARACIN2 remained unaffected.
Distinct Spatial Expression of ARACIN1 and ARACIN2 Promoters
Expression characteristics were further explored by GUS histochemical staining of three independent transgenic plant lines containing constructs in which the ARACIN1/ARACIN2 promoters (intergenic regions; 1,343 and 841 bp, respectively) were transcriptionally fused to GUS (Karimi et al., 2007). The expression patterns of ARACIN1 and ARACIN2 were spatially distinct (Fig. 2, top). The expression of promARACIN1:GUS was mainly detected in young developing leaves (Fig. 2A), hydathodes (Fig. 2B), immature flowers (Fig. 2C), and elongating pollen tubes (Fig. 2D), whereas abundant expression levels of promARACIN2:GUS occurred in young and mature trichomes, hydathodes, the shoot apical meristem, leaf primordia, the hypocotyl (Fig. 2E), stomatal guard cells (Fig. 2F), and emerging lateral roots (Fig. 2G). In flowers, promARACIN2:GUS expression was found in the anther-filament junction region and female gametophytes and likely in the embryo sac and the stigma (Fig. 2, H and I). Subsequently, expression analyses, in which both locally infected leaves and noninfected systemic leaves were harvested 3 d post infection (dpi) and incubated with GUS-staining solution, were performed. From this experiment, we could deduce that ARACIN1 is barely expressed in locally infected leaves around the site of infection, whereas it is highly expressed in systemically infected leaves (Fig. 2, bottom left). ARACIN2 expression could be shown in both locally and systemically infected leaves (Fig. 2, bottom right). The staining patterns observed are typical for the three independent transgenic plant lines.

Tissue- and cell-specific expression of ARACIN1 and ARACIN2 visualized by histochemical GUS staining without (top) or with (bottom) local infection of B. cinerea. A to D, promARACIN1:GUS expression was mainly found in young developing leaves (A), hydathodes indicated by arrow head 1 (B), young developing flowers (C), and in the pollen tube indicated by arrow head 2 (D). E to I, promARACIN2:GUS displayed a strong expression in leaf trichomes (arrow head 3), hydathodes, the shoot apical meristem (arrow head 4), leaf primordia (arrow head 5), the hypocotyl (E), stomata (F, arrow head 6), and emerging lateral roots (G, arrow head 7). In flowers, promARACIN2:GUS expression was found in the junction region between anther and filament (H, arrow head 8) and female gametophytes and likely in the embryo sac (H and I, arrow head 9) and the stigma (H). Bottom left, promARACIN1:GUS expression was mainly detected in systemically infected leaves 3 dpi with B. cinerea. Bottom right, promARACIN2:GUS expression could be observed in both locally and systemically infected leaves 3 dpi with B. cinerea. Ctrl, No infection; Bc loc, local B. cinerea infection; Bc sys, systemic B. cinerea infection.
ARACIN Genes Are Brassicaceae-Specific Paralogs
ARACIN1 and ARACIN2 are positioned in tandem on the complement strand of chromosome 5 and are organized as two exons separated by one intron (The Arabidopsis Information Resource [TAIR], http://www.arabidopsis.org/; Fig. 3A). According to the current genome annotation (TAIR10), the open reading frames (ORFs) of ARACIN1 and ARACIN2 are short (192 and 249 nucleotides [nt], respectively) and share 80% coding sequence (CDS) identity (Fig. 3B). However, a misannotation is assumed, because preceding the annotated CDS of ARACIN1 (designated Ɗ ARACIN1), a sequence was found that was highly similar to the first 54 nt of the CDS of ARACIN2, containing a start codon (Fig. 3B) preceded by an adequate Kozak consensus sequence. This was confirmed by 5′ RACE (data not shown), and as such, we can assume that ARACIN1 and ARACIN2 encode peptides of 76 (8.2 kD) and 82 amino acids (8.9 kD), respectively (Fig. 3C).
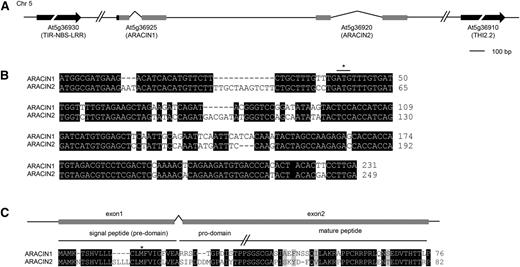
Sequence characteristics of ARACIN1 and ARACIN2. A, Genomic position and gene organization of ARACIN1 and ARACIN2. The 5′ region upstream of ARACIN1 that has a high sequence identity with the 5′ CDS of ARACIN2 is depicted by a black box. B, Sequence alignment of ARACIN1 and ARACIN2 revealing a 54-nt sequence upstream of the annotated start codon (asterisk) of ARACIN1 that is highly similar to the 5′ CDS of ARACIN2. C, Sequence alignment of the translated full-length ARACIN1 with the protein sequence of ARACIN2. The predicted signal peptide (SignalP 3.0; Emanuelsson et al. ,2007), the first Met according to the TAIR annotation (asterisk), the prodomain, and the highly conserved C-terminal domain (see further) are indicated, as well as the first and second exon. Identical and similar residues are shaded black and gray, respectively. Sequence data were retrieved from TAIR (TAIR10; http://www.arabidopsis.org/). TIR, Toll/Interleukin1 receptor; NBB, nucleotide-binding site; LRR, Leu-rich repeat.
We assessed the presence of ARACIN1 and ARACIN2 in other plant genomes by using the PLAZA comparative genomics tool (Proost et al., 2014; http://bioinformatics.psb.ugent.be/plaza/) and blasting National Center for Biotechnology Information (http://www.ncbi.nlm.nih.gov/blast/) and Uniprot databases (http://uniprot.org/blast/), as well as the Camelina sativa (http://www.camelinadb.ca/), Brassica rapa, and Brassica oleracea genomes using the Brassica Database (http://brassicadb.org/brad/index.php/). PLAZA 3.0 integrates structural and functional annotations of 31 species. Comparative analysis revealed orthologs of ARACIN1 and ARACIN2 in Arabidopsis lyrata (Al7g33690 and Al7g33670, respectively), and orthologs for ARACIN1 could be found further in Eutrema salsugineum, C. sativa, B. rapa, and B. oleracea. For ARACIN2, an ortholog could be detected in Capsella rubella (Supplemental Fig. S1, A and B).
Analysis of the 5′ sequence upstream of the ARACIN1 CDS for cis-acting regulatory elements revealed one putative MYC2-binding site (a CACATG sequence located at 849 nt upstream of the ARACIN1 start codon) that is absent in the ARACIN2 promoter. MYC2 differentially regulates jasmonic acid-responsive pathogen defense (including PDF1.2a) and wound response genes (Lorenzo et al., 2004). Whereas the promoter of ARACIN1 contains four clustered W-box elements (-255, -227, -208, and -149), the promoter of ARACIN2 has only two dispersed W-box elements (-718 and -246). These W-box elements are bound with high affinity by WRKY transcription factors known to be involved in SA signaling and plant immunity (Pandey and Somssich, 2009). The presence of multiple MYC2 and W-box elements in the promoter of ARACIN1 could explain its up-regulation by MeJA and BTH.
ARACIN1 and ARACIN2 Are Targeted to the Endoplasmic Reticulum
Previously, we demonstrated that the N-terminal GFP fusion of Ɗ ARACIN1, as indicated in TAIR10, localizes to the nucleus and cytosol (Inzé et al., 2012). Constitutive overexpression of this GFP-tagged nucleosolic version of ARACIN1 led to a drastic phenotype characterized by a severe loss in apical dominance, resulting in a small bushy stature, thick and contorted leaves, and a delayed flowering time (Supplemental Fig. S2, A–D).
In silico prediction with SignalP3.0 (Emanuelsson et al., 2007) deduced the presence of a signal peptide in ARACIN2 for targeting to the secretory pathway (Fig. 3C), whereas Ɗ ARACIN1 was predicted to be cytosolic. However, adding the sequence that was found highly similar to the first 54 nt of the CDS of ARACIN2 also indicated the presence of an intact N-terminal signal peptide in ARACIN1 for targeting to the secretory pathway (Fig. 3C; Emanuelsson et al., 2007).
To determine the subcellular localization of full-length ARACIN1 and ARACIN2, their ORFs were fused in frame with GFP at the C terminus and placed under the control of the constitutive Cauliflower mosaic virus 35S (CaMV35S) promoter (Fig. 4A). The subcellular localization of ARACIN1 was assessed in at least two independent and stable transgenic Arabidopsis lines. In the case of ARACIN2-GFP overexpression, only one GFP-positive transgenic Arabidopsis line could be obtained. Strikingly, this line showed a similar phenotype as the GFP-∆ ARACIN1OE (Supplemental Fig. S2, E and F) and ARACIN2OE lines (see further).
![Subcellular targeting and processing of ARACIN1 and ARACIN2. A, Schematic representations of the expressed GFP-tagged peptides with their putative prepropeptide structure used to determine the subcellular localization and processing of ARACIN1 and ARACIN2 in transgenic Arabidopsis lines. The first Met (M) of ARACIN1 according to the TAIR10 annotation (TAIR; http://www.arabidopsis.org/) is indicated with an asterisk. B, Subcellular localizations of the GFP-tagged ARACIN peptides in 2-week-old transgenic Arabidopsis ARACIN1-GFPOE (1 and 2) and ARACIN2-GFPOE (3 and 4) lines. GFP fluorescence (1 and 3) and bright-field images (2 and 4) are depicted. Perinuclear ring is indicated with a white arrow head. C, Coexpression of the GFP-tagged ARACIN peptides and ER-mCherry marker in 3-week-old agroinfiltrated N. benthamiana leaf epidermal cells. ARACIN1-GFP (1–3) or ARACIN2-GFP (4–6) lines with an ER-mCherry marker. GFP fluorescence (1 and 4), red fluorescent protein fluorescence (2 and 5), and merged images (3 and 6) are depicted. D, Western-blot analysis of leaf extracts of 2-week-old independent (1 and 2) and stable transgenic ARACIN1-GFPOE (above), ARACIN2-GFPOE (below), and GFPOE lines using an anti-GFP antibody. The different forms (prepropeptide [prepro], propeptide [pro], and mature [m]) are indicated. Bars = 10 µm.](https://oup.silverchair-cdn.com/oup/backfile/Content_public/Journal/plphys/167/3/10.1104_pp.114.255505/2/m_plphys_v167_3_1017_f4.jpeg?Expires=1750370737&Signature=4dluMqqpPZWejRajmhgnpaIS4VkVkYZ9hpxXUrXUoOX2yzMy6T4Q1xDmeuTX4bPhORgT3RTO8bxu0ZPs3FmSa9gvMwswYR7DEXl9uVmZH31wheBjELGzXSOJQLu7bDm48ErHu~80rAX7zqqLoStq02q-TTtZ5mgKf7KkxuxBvG2PV4kssJPSAhsWiE45sgldQfFotxNgSWBQ2AVa3vknwJBKIdjpaXWngKWmRgSDmha3nAYe6TO0rcG0vsW7uHyjtQPc4az~V6Y~30tjAGNkJ~sIC5yYZwahjGDUXtfphKAcPGmB8ASxmDb2SFFjf~VXkc-ag827nIkQu9fw-xWPug__&Key-Pair-Id=APKAIE5G5CRDK6RD3PGA)
Subcellular targeting and processing of ARACIN1 and ARACIN2. A, Schematic representations of the expressed GFP-tagged peptides with their putative prepropeptide structure used to determine the subcellular localization and processing of ARACIN1 and ARACIN2 in transgenic Arabidopsis lines. The first Met (M) of ARACIN1 according to the TAIR10 annotation (TAIR; http://www.arabidopsis.org/) is indicated with an asterisk. B, Subcellular localizations of the GFP-tagged ARACIN peptides in 2-week-old transgenic Arabidopsis ARACIN1-GFPOE (1 and 2) and ARACIN2-GFPOE (3 and 4) lines. GFP fluorescence (1 and 3) and bright-field images (2 and 4) are depicted. Perinuclear ring is indicated with a white arrow head. C, Coexpression of the GFP-tagged ARACIN peptides and ER-mCherry marker in 3-week-old agroinfiltrated N. benthamiana leaf epidermal cells. ARACIN1-GFP (1–3) or ARACIN2-GFP (4–6) lines with an ER-mCherry marker. GFP fluorescence (1 and 4), red fluorescent protein fluorescence (2 and 5), and merged images (3 and 6) are depicted. D, Western-blot analysis of leaf extracts of 2-week-old independent (1 and 2) and stable transgenic ARACIN1-GFPOE (above), ARACIN2-GFPOE (below), and GFPOE lines using an anti-GFP antibody. The different forms (prepropeptide [prepro], propeptide [pro], and mature [m]) are indicated. Bars = 10 µm.
As expected, the addition of the 5′ sequence altered the subcellular localization of ARACIN1 (Fig. 4B). Both localization patterns of ARACIN1-GFP (Fig. 4B, 1 and 2) and ARACIN2-GFP (Fig. 4B, 3 and 4) showed characteristic features of endoplasmic reticulum (ER) localization, such as a reticular pattern and the perinuclear ring (Fig. 4B, 3 and 4), indicating that both ARACIN1 and ARACIN2 are presumably targeted to the ER. This reticular pattern could be further strengthened by coinfiltration in Nicotiana benthamiana of ARACIN1-GFP (Fig. 4C, 1–3) or ARACIN2-GFP (Fig. 4C, 4–6) with an ER-mCherry marker created by Nelson et al. (2007).
Interestingly, while expression of the nucleocytosolic-targeted GFP-∆ ARACIN1 drastically perturbed normal growth and development (Supplemental Fig. S2, A–D), constitutive ER-localized ARACIN1-GFP overexpression plants looked phenotypically similar to the wild type (data not shown). Mistargeting of ARACIN1 could perturb the cellular homeostasis, which, in turn, could lead to pleiotropic defects in normal growth and development.
ARACINs Are Typical AMPs
Both ARACINs strikingly share general characteristics of plant AMPs. First, ARACIN1 and ARACIN2 are small (8.2 and 8.9 kD), hydrophobic (39% and 40% total hydrophobic ratios), and cationic (+4 and +2 total net charge) peptides. These features are a prerequisite for the antimicrobial activity of most AMPs that is mainly based on their ability to disturb the pathogen’s membrane via electrostatic and hydrophobic interactions (Shai, 2002; Thevissen et al., 2003). Like nearly all AMPs, ARACIN1 and ARACIN2 have a defined exon/intron structure, with the first exon encoding the signal peptide for targeting to the secretory pathway and the second exon coding for the mature peptide (Silverstein et al., 2005; Fig. 3, A and B).
AMPs are often produced as prepropeptides in which the predomain functions as a signal peptide that is removed during secretion. The prodomain is often acidic and thought to neutralize and, thus, inactivate the basic mature peptide when it is still intracellular. Once secreted, this propeptide is proteolytically removed, thereby activating the mature peptide (García-Olmedo et al., 1998). As the C-terminal regions of both ARACIN peptides were highly conserved (Fig. 3C), they could represent the mature domains necessary for antimicrobial activity. The putative prodomains of ARACIN1 and ARACIN2, which are flanked by their predomain (signal peptide) and mature domain, are acidic (pI 5.96 and 3.42, respectively), and thus these regions could function in the neutralization of the cationic mature domain (pI 8.96 and 9.38, respectively). The biochemical properties of these putatively different forms are given in Supplemental Table S1.
To assess whether ARACINs are processed in vivo, we immunodetected GFP-tagged peptides in two independent transgenic Arabidopsis ARACIN1-GFPOE plants and one ARACIN2-GFPOE plant (Fig. 4D). In the case of ARACIN1-GFP, the anti-GFP antibody recognized four protein bands that correspond in size with the putative preproARACIN1-GFP (approximately 35 kD), the proARACIN1-GFP (approximately 30 kD), the mature ARACIN1-GFP (approximately 31 kD), and free GFP (approximately 27 kD). This was also the case for ARACIN2-GFP. The mature ARACIN1 and ARACIN2 domains had an estimated size of approximately 4 kD, of which the size is similar to that of the conserved C-terminal region (Fig. 4D; Supplemental Table S1).
In Vitro Antifungal Activity against A. brassicicola and B. cinerea
Next, we assessed the potential antifungal activity of ARACIN1 and ARACIN2 by an in vitro antifungal bioassay. Mature forms of ARACIN1 and ARACIN2 produced by chemical synthesis (Supplemental Table S1) were tested against A. brassicicola, B. cinerea, Fusarium graminearum, Sclerotinia sclerotiorum, and yeast (Saccharomyces cerevisiae) by means of a microtiter broth dilution assay (Fig. 5; Supplemental Figure S3). Whereas the mature form of ARACIN1 (mARACIN1) efficiently inhibited the growth of A. brassicicola starting at a concentration of 1 µg mL–1, with a 50% growth inhibitory concentration (IC50) value of 5.46 µg mL–1, the growth of the B. cinerea was almost completely inhibited (95.7%) at a concentration of 10 µg mL–1 mARACIN1 with an IC50 value of 3.05 µg mL–1. In the case of mARACIN2, the IC50 value against A. brassicicola was significantly lower (1.55 µg mL–1). Likewise, the antifungal activity of mARACIN2 against F. graminearum and yeast (IC50 values of 9.06 and 0.76 µg mL–1, respectively) was remarkably increased in comparison with mARACIN1 (IC50 values of 28.17 and 6.41 µg mL–1, respectively; Fig. 5). Subsequently, antifungal activity of both ARACIN peptides against S. sclerotiorum was similar, with efficient IC50 values of 0.73 µg mL–1 (mARACIN1) and 0.49 µg mL–1 (mARACIN2).
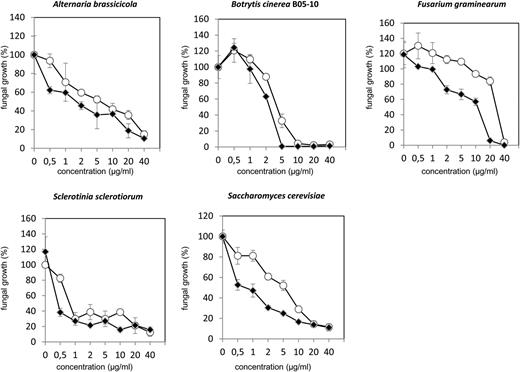
Inhibitory effects of mARACIN1 and mARACIN2 on growth of A. brassicicola, B. cinerea strain B05-10, F. graminearum, S. sclerotiorum, and yeast. Data are represented as a mean (n = 3). The antifungal assays were done in triplicate, with similar results. ARACIN1 and ARACIN2 are depicted with white and black dots, respectively.
ARACIN1 Overexpression Leads to a Decreased Sensitivity to A. brassicicola and B. cinerea Infections
To assess the effect of ARACIN overexpression on plant development, we made constitutive overexpression lines with the CaMV35S promoter. Northern-blot analysis revealed that several independent transgenic lines contained elevated levels of the ARACIN1/ARACIN2 transcripts (Fig. 6B). Whereas all ARACIN1OE lines were phenotypically similar to wild-type plants, overexpression of ARACIN2 drastically affected growth and development (Fig. 6A). After normal seed germination and cotyledon expansion, ARACIN2OE plants showed a severely retarded growth, curled dark leaves, and delayed flowering (Fig. 5B), resembling the observed phenotype of the ARACIN2-GFPOE line (Supplemental Fig. S2, E and F).
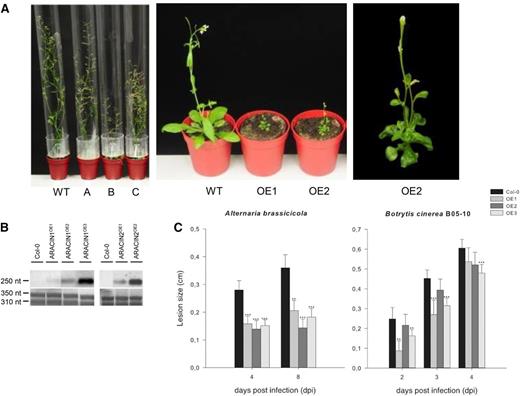
Expression analysis and phenotypes of the ARACINOE lines. A, Representative images of the ARACIN1OE and ARACIN2OE lines. Left, One 1-month-old wild-type (WT), one ARACIN1OE (A), and two ARACIN2OE (B and C) lines. Middle, One 4-week-old wild-type and two independent ARACIN2OE lines. Right, Enlarged image of a 4-week-old ARACIN2OE plant. B, Northern-blot analysis of the ARACIN1OE and ARACIN2OE lines. Top, ARACIN1 expression. Bottom, ACTIN expression level. C, Lesion sizes on leaves of wild-type plants and three independent ARACIN1OE lines measured several days after inoculation with A. brassicicola and B. cinerea strain B05-10. Data presented are the means of at least 50 lesions. Error bars represent 95% confidence intervals (n = approximately 50). For each assay, the average lesion diameter of wild-type and mutant plants were compared with a Student’s t test (*P < 0.05, **P < 0.01, and ***P < 0.001). The disease assays were done in duplicate, with similar results. Col-0, Ecotype Columbia; OE, overexpression.
To assess the effect of increased ARACIN levels on the plant susceptibility to fungal infection, we performed disease assays with the two necrotrophic pathogens A. brassicicola and B. cinerea. Because of the drastic phenotype of the ARACIN2OE lines, no accurate scoring of disease symptoms was possible. Therefore, homozygous ARACIN1OE plants from three independent transgenic events (Fig. 6B) were assayed with A. brassicicola and B. cinerea by drop inoculation (5 × 10⁵ spores mL–1) of 4-week-old Arabidopsis plants. Compared with the wild type, ARACIN1OE lines had an increased resistance phenotype after inoculation with A. brassicicola. A drastic reduction of disease symptoms was visible 4 d after infection: the mean lesion size on ARACIN1OE leaves was 50% smaller than that on wild-type leaves (Fig. 6C). Moreover, a statistically significant reduction in B. cinerea lesion size was observed in the ARACIN1OE lines (Fig. 6C).
DISCUSSION
Gene Expression and Genome Organization
Here, we have identified two unique cationic and hydrophobic AMPs. Detailed expression analyses showed that the ARACIN genes are differentially regulated by abiotic and biotic stress conditions. It is well known that abiotic stresses, such as high light, high salinity, drought, low and high temperature, or wounding, can also modulate the expression of biotic defense-related genes, including plant AMPs (Hon et al., 1995; Broekaert et al., 2000; Zeier et al., 2004; van Loon et al., 2006; Seo et al., 2008). ARACIN1 and ARACIN2 are induced by photorespiratory H2O2, a signaling molecule produced during abiotic and biotic stresses (Fujita et al., 2006). Interestingly, ARACIN1 is significantly induced by cold stress. The induction of plant AMPs during cold acclimation has been reported previously in winter cereals to confer disease resistance in addition to freezing tolerance (Nakajima and Abe, 1996; Gaudet et al., 1999).
In addition, the cell- and tissue-specific expression patterns of both genes are quite distinct. The differential transcriptional regulation of the ARACIN genes could be attributed to their divergent promoters that have a low incidence and small overlap of cis-regulatory elements, and thus these genes are probably under the control of different transcriptional regulators. Duplicated genes (i.e. paralogs) are only retained in the genome when they have acquired different or complementary functions (Tiffin and Moeller, 2006). Therefore, paralogs have often different expression patterns due to changes in the regulatory elements of their promoter region (Force et al., 1999; Altschmied et al., 2002; Prince and Pickett, 2002).
Recently, 1,789 Brassicaceae-specific genes (including the ARACIN genes) have been identified by a stepwise BLAST filtering approach and are characterized by their short peptide length (77 amino acids), few introns, low guanine-cytosine content, unknown function, few paralogs, enrichment for secretory peptides, and increased evolutionary rates. Remarkably, these Brassicaceae-specific genes are enriched for defensin-like genes and other Cys-rich peptides, such as thionins. These defensin-like genes show higher frequencies of tandem duplications, the major mechanism for the generation of lineage-specific genes. Furthermore, these genes are often responsive to biotic and abiotic stimuli (Donoghue et al., 2011).
Within the Arabidopsis genome, both genes are positioned in tandem and are flanked by pathogen defense-related genes. The gene encoding a disease resistance protein belonging to the Toll/Interleukin1 receptor-nucleotide-binding site-Leu-rich repeat class is positioned upstream of ARACIN1, and a thionin gene (THIONIN2.2) is positioned downstream of ARACIN2. Nucleotide-binding site-Leu-rich repeat resistance genes are part of a large multigene family that might be involved in the first line detection of pathogens (McHale et al., 2006). Defense-related genes are often positioned in gene clusters, allowing a coordinated expression when plant defense is activated (Eckardt, 2007). Moreover, genes that are up-regulated during biotic stress, including Cys-rich AMPs, did expand largely by tandem duplications (Silverstein et al., 2005; Hanada et al., 2008).
Molecular Properties
ARACIN1 and ARACIN2 encode small, cationic, and hydrophobic peptides and are expressed in peripheral cell layers, such as stomata, hydathodes, and roots tissues, representing the primary entry points for pathogens. In addition, both genes are expressed in reproductive tissues that are known to be enriched in AMPs (Jones-Rhoades et al., 2007; Punwani et al., 2007). As pollen grains are often coated with bacterial and fungal spores, AMPs are suggested to protect the female gametophyte during the fertilization phase (Cordts et al., 2001). In addition, an alternative role for plant AMPs has been demonstrated in Torenia fournieri and Arabidopsis, in which secreted defensin-like, Cys-rich polypeptides act as pollen tube attractants (Okuda et al., 2009; Takeuchi and Higashiyama, 2012). In this respect, it is interesting to note that ARACIN1 and ARACIN2 are expressed in the pollen tube and in the female gametophyte, respectively.
We could further demonstrate that ARACIN1 and ARACIN2 are produced as prepropeptides, which is often the case for AMPs (García-Olmedo et al., 1998). However, the exact cleavage sites and hence the exact nature of the different domains of the ARACIN peptides still need to be determined by amino acid sequencing of the bands observed in the ARACIN1-GFP and ARACIN2-GFP overexpression lines.
Both localization patterns of ARACIN1-GFP and ARACIN2-GFP (Fig. 4B) showed characteristic features of ER localization. However, because both peptides lack ER retention signals, they are presumably targeted to the extracellular space. As the fluorescent properties of GFP are lost in the apoplast due to an acidic pH, we could not directly confirm that the ARACIN-GFP peptides are secreted into the extracellular matrix. To circumvent the problems associated with the detection of GFP-tagged proteins in the apoplastic space, fusions with the yellow fluorescent protein Venus, a pH-insensitive variant of GFP, and with the red fluorescent protein were made and are currently being investigated.
Secondary structure prediction with the Protein/Homology/analogY Recognition Engine (PHYRE) Web server (Bennett-Lovsey et al., 2008; Kelley and Sternberg, 2009), which uses template-based homology modeling to construct structural predictions, revealed the presence of two α-helices at the C terminus of ARACIN1 (Supplemental Fig. S4A) and α and β contents in ARACIN2 (Supplemental Fig. S4C). Moreover, homology-based three-dimensional models of ARACIN1 and ARACIN2 were constructed with PHYRE2.0 (intensive mode; Supplemental Fig. S4, D and E). Although no structural matches with a high confidence level could be detected, most predictions had a fold occurring in proteins with a putative defense role. AMPs are rapidly evolving molecules due to pressure imposed by competition among phytopathogens (Silverstein et al., 2005). In other words, the sequence conservation between AMPs is rather limited and, therefore, may explain why only structural matches were retrieved with a low confidence level. Nevertheless, ARACIN1 showed an approximately 42% similarity (best hit; confidence level of 11%) with the 48-amino acid residue neurotoxin-I of sea anemone (Stichodactyla heliantus; Structural Classification of Proteins code d2sh1a; Protein Data Bank code 2SH1; Fogh et al., 1990; Wilcox et al., 1993) that belongs to the defensin superfamily and acts on neuronal voltage-gated sodium channels of Crustaceae (Supplemental Fig. S4, B and D). ARACIN2 predominantly retrieved matches with protease inhibitors (data not shown). This is not surprising, because several AMPs have been reported to act as protease inhibitors (Kim et al., 2009). Moreover, in response to pathogen attack, plants secrete inhibitory peptides that inactivate the proteinases produced by phytopathogenic microorganisms (Ryan, 1990).
We further assessed the potential of both ARACIN peptides to protect plants against necrotrophic pathogens. Transgenic Arabidopsis plants with constitutive ARACIN1 overexpression displayed enhanced resistance against the necrotrophs A. brassicicola and B. cinerea. Although A. brassicicola is considered an incompatible fungal pathogen of Arabidopsis, the molecular basis behind the restriction of the A. brassicicola infection is of great interest. An incompatible Arabidopsis-A. brassicicola interaction triggers a strong systemic response, inducing the up-regulation of the defense genes PATHOGENESIS RELATED-1 and PDF1.2a (Penninckx et al., 1996). The current knowledge of the molecular mechanisms underlying the interaction between A. brassicicola and members of the Brassicaceae family remains rather limited. Several studies have identified important players of the incompatible interaction of the Arabidopsis-Alternaria spp. pathosystem, including antimicrobial compounds (Thomma et al., 1999; Schenk et al., 2003; Oh et al., 2005; Schuhegger et al., 2006; Nafisi et al., 2007). In addition, in vitro antifungal bioassays with chemically synthesized mARACIN1 and mARACIN2 revealed their antifungal activities against A. brassicicola, B. cinerea strain B05-10, F. graminearum, and S. sclerotiorum.
Several examples of AMP overexpression conferring enhanced tolerance to abiotic stresses are known (Mirouze et al., 2006; Lee and Hwang, 2009). As ARACIN1 is transcriptionally regulated by abiotic stresses, we assessed whether the ARACIN1OE lines displayed an improved tolerance against salt stress (50 and 100 mm NaCl) and oxidative stress (2 µm methyl viologen). However, no statistical significant differences between ARACIN1OE lines and appropriate controls (scored by measuring root growth and leaf area) were found (data not shown).
CONCLUSION
Here, we characterized two unique Brassicaceae-specific peptides displaying antifungal activities against necrotrophic pathogens. Both ARACIN1 and ARACIN2 are typical AMPs but are structurally unrelated to known plant AMPs. In planta modulation of ARACIN1 expression levels enhanced the resistance against these pathogens. As plant diseases caused by A. brassicicola and B. cinerea infections result in major crop losses, the use of ARACIN peptides in transgenic Brassicaceae species could be an alternative strategy to improve disease resistance.
MATERIALS AND METHODS
Plant Growth Conditions and Treatments
For in vitro experiments, Arabidopsis (Arabidopsis thaliana) ecotype Columbia plants (wild type) were, unless stated otherwise, grown until stage 1.04 (fourth leaf 1 mm in size; Boyes et al., 2001) on one-half-strength Murashige and Skoog medium (Duchefa Biochemie; http://www.duchefa.com/), 1% (w/v) Suc, and 0.7% (w/v) agar, pH 5.7, at 21°C and under a 16-h-light/8-h-dark photoperiod, 150 μmol m–2 s–1 light intensity, and 50% relative humidity. For the cold stress treatment, 3-week-old plants were transferred to 4°C in a controlled environment chamber (Weiss technik; http://www.weiss-gallenkamp.com/) and a pool of 10 plants was harvested at each time point, whereas for the heat stress experiment, plants were transferred to a thermostat cabinet (Lovibond; http://www.lovibond.com/) at 37°C, and three pools of 35 plants were harvested at each time point. For the BTH treatment, plants were sprayed with 350 μm BTH (BION 50 WG, a gift from Syngenta Agro S.A. Spain) or with water (mock), whereas for the MeJA treatment, plants were sprayed with 100 μm MeJA containing 0.001% (v/v) Triton X-100 or with 0.001% (v/v) Triton X-100 in water (mock). A pool of 32 plants was harvested at each time point for each treatment. Two independent experiments were carried out for all treatments (independent sets of plants sown and treated on different dates).
5′ RACE
Total RNA was extracted from wild-type plants with TRI Reagent (Molecular Research Center; http://www.mrcgene.com/). 5′ RACE-ready complementary DNA (cDNA) was made with the supplied Smart II oligo and Powerscript reverse transcriptase (BD SMART RACE cDNA Amplification Kit, BD Biosciences; http://www.bdbiosciences.com/), and the reaction was run with the gene-specific primers (Supplemental Table S1) and the supplied universal primer mix. Nested PCR reaction products were gel purified with the Nucleospin gel extraction kit (Macherey and Nagel; http://www.mn-net.com/) and sequenced after cloning into the pENTR/D-TOPO vector (Invitrogen; http://www.invitrogen.com/).
Production of Transgenic Lines
Full-length ORFs (with and without stop codon) were PCR amplified from first strand cDNA of wild-type plants with the high-fidelity Phusion DNA polymerase (Finnzymes OY; http://www.finnzymes.fi/) with gene-specific primers extended with attB sites for subsequent Gateway cloning into pDONR221 (Invitrogen; Supplemental Table S1). GFP fusions were constructed within the binary destination vector pK7FWG2 (Karimi et al., 2007), resulting in a C-terminal GFP fusion under the control of the CaMV35S promoter. Overexpression clones were generated within the binary destination vector pK7WG2 (Karimi et al., 2007). To obtain promoter-GUS fusion constructs, the intergenic regions of ARACIN1 (1,343 bp) and ARACIN2 (841 bp) were PCR amplified from genomic DNA with promoter-specific primers extended with attB sites for subsequent Gateway cloning (Supplemental Table S1). PCR fragments were cloned into Gateway entry vectors and subcloned into the binary destination vector pKGWFS7 (Karimi et al., 2007). All constructs were transformed into the Agrobacterium tumefaciens strain C58C1 harboring the virulence plasmid MP90. Arabidopsis wild-type plants were transformed via A. tumefaciens floral dip (Clough and Bent, 1998). Homozygous lines with a single transfer DNA locus were selected via segregation analysis for hygromicine resistance, and transgene expression was monitored via northern analysis and quantitative reverse transcription (qRT)-PCR analysis for the overexpression lines, GFP fluorescence for the GFP fusion lines, or GUS staining for the promoter-GUS lines.
Fluorescence Microscopy
The localization in Nicotiana benthamiana as well as in stable transformed Arabidopsis was analyzed as described previously (Inzé et al., 2012). In addition to the GFP constructs (see above), an ER-targeted mCherry (Nelson et al., 2007) was used.
For fluorescence microscopy, a confocal microscope 100M with software package LSM 510 version 3.2 was used (Zeiss; http://www.zeiss.com/), equipped with a 63× water-corrected objective (numerical aperture, 1.2) to scan the leaf epidermis and underlying cell layers. GFP fluorescence was imaged in a single-channel setting with 488 nm for GFP excitation, whereas mCherry fluorescence was imaged in a single-channel setting with 543 nm for mCherry excitation.
Promoter GUS Analyses
Transgenic 2-week-old seedlings grown in vitro on one-half-strength Murashige and Skoog plates or organs from mature plants grown in soil were harvested and incubated overnight in 90% (v/v) acetone at 4°C. Acetone was removed, and samples were washed with nullisomic-tetrasomic (NT) buffer (100 mm Tris and 50 mm NaCl, pH 7.0). Next, the NT buffer was replaced with a ferricyanide solution (0.2 mm ferricyanide in NT buffer), and samples were incubated in the dark at 37°C for at least 1 h. Afterward, the ferricyanide solution was replaced with the GUS-staining solution containing 0.02 mm 5-bromo-4-chloro-3-indolyl-d-glucuronide in ferricyanide solution. Samples were placed in the dark at 37°C, incubated for 6 h or overnight, and stored in 100% lactic acid. Samples were photographed with a stereomicroscope (Stemi SV11; Zeiss) or with a Nomarski differential interference contrast microscope BX51 (Olympus; http://www.olympus.com/).
qRT-PCR Analyses
For the abiotic stress expression analyses, RNA isolation, cDNA synthesis, and qRT-PCR analyses were carried out as described in Vanderauwera et al. (2007) with gene-specific primers (Supplemental Table S2). For ARACIN1 and ARACIN2, gene-specific primers were designed with the Beacon Designer software (PremierBiosoft; http://www.premierbiosoft.com/; Supplemental Table S2). ARP7, encoding an actin-related protein (At3g60830), was used as a reference gene. The primers for this gene were designed with the Universal ProbeLibrary Assay Design center ProbeFinder software (Roche; https://www.roche-applied-science.com/; Supplemental Table S1). For the qRT-PCR analyses on Botrytis cinerea-infected leaves, RNA extraction, DNase treatment, cDNA synthesis, and qRT-PCR experiments were done as described by Mirouze et al. (2006), and EF1-α was used as a reference gene. Relative transcript abundance of ARACIN1 and ARACIN2 was determined using the Roche LightCycler 480 system and the LC480 SYBR Green I Master kit (Roche Diagnostics). Measurements were taken for three biological and three technical repeats. The amplification data were analyzed using the second derivative maximum method, and resulting crossing point values were converted into relative expression values using the comparative cycle threshold method.
Protein Extraction and Western-Blot Analyses
Total protein extracts were prepared by grinding leaf material (100 mg) in 200 μL of extraction buffer (100 mm HEPES [pH 7.5], 1 mm EDTA, 10 mm β-mercaptoethanol, and 1 mm phenylmethanesulfonylfluoride) and a protease inhibitor cocktail (COMPLETE; Roche). Insoluble debris was removed by centrifugation at 20,800g for 15 min at 4°C. Protein concentrations were determined with the Bradford method (Zor and Selinger, 1996). Proteins (10 μg) were separated on a 12.5% SDS-PAGE gel and transferred to a P membrane (Millipore; http://www.millipore.com/). Filters were blocked in 3% (v/v) milk powder in 25 mm Tris-Cl (pH 8), 150 mm NaCl, and 0.05% Tween 20 for at least 1 h at room temperature and incubated overnight at 4°C with anti-GFP (1:5,000) antibody in blocking buffer (JL-8; Clontech Laboratories; http://www.clontech.com/). Antigen-antibody complexes were detected with horseradish peroxidase-conjugated IgG diluted 1:10,000 (Amersham Biosciences) by means of the Western Lightning kit (GE Healthcare; http://gehealthcare.com/). Images were taken using the Biorad Image Lab 3.0 software.
In Vitro Antifungal Activity Assays
Chemically synthesized mARACIN1and mARACIN2 peptides were purchased (greater than 98% purity) from Genscript (http://www.genscript.com/). Stock solutions of 2 × 10⁷ spores mL–1 of Alternaria brassicicola, B. cinerea strain B05-10, and Fusarium graminearum were diluted in one-half-strength potato dextrose broth (PDB) to a final concentration of 2 × 10⁴ spores mL–1. In the case of Sclerotinia sclerotiorum, fragments from the edges of the mycelium lawns were transferred to 50 mL of one-half-strength PDB and incubated for 24 to 48 h at 21°C with continuous shaking. Aliquots (500 μL) of these cultures were transferred to 2-mL polypropylene microcentrifuge tubes with o-ringed screw caps, each containing five glass beads (1-mm diameter). The mycelium was fragmented by high-speed reciprocal shaking using a Phastprep apparatus (Bio 101/Savant). The obtained mycelium fragment suspensions were 100-fold diluted for use in antifungal activity assays. For yeast (Saccharomyces cerevisiae), cell cultures (5 × 10⁴ cells mL–1) were prepared in POTATO DEXTROSE BROTH:YEAST PETONE DEXTROSE medium (95:5) as described previously. After addition of 196-µL aliquots of these spore/cell suspension dilutions or fragmented mycelium to 4 µL of 2-fold dilution series of mARACIN1and mARACIN2 in dimethyl sulfoxide (DMSO; starting from a 100 µg mL–1 stock solution) in microtiter plates, the plates were incubated at 23°C for 48 to 72 h or at 30°C for 48 h in the case of yeast. DMSO was used as a negative control. Fungal growth was evaluated both microscopically and by measuring the optical density at 600 nm. Each fungus was tested in duplicate in the microtiter plates, and each assay was repeated twice. For each assay, the average background-corrected optical density at 600 nm of each dilution and the DMSO control were compared with a Student’s t test. Dose response curves were calculated to obtain IC50 values. To this end, average background-corrected optical densities were converted to percent inhibition, whereas doses were log transformed. Then, either a four-parameter logistic model or a simple linear model was fitted to the data using the drc package in R. The choice of the model was determined by the shape of the dose response curve.
Disease Assays
Mutant and wild-type Arabidopsis plants were grown in soil (DCM Zaai-en stekgrond; De Ceuster Meststoffen N.V.; http://www.dcm.com/) in a growth chamber with at 21°C/18°C day/night temperature and 75% relative humidity under a 12-h-light/12-h-dark photoperiod with a light intensity of approximately 120 µmol m–2 s–1. Four-week-old plants were inoculated with A. brassicicola strain MUCL20297 (Mycothèque Université Catholique de Louvain) or B. cinerea strain B05-10. To this end, a 2 × 10⁷ spores mL–1 solution of the pathogen was diluted in one-half-strength (12 g L–1) PDB in water to a final concentration of 5 × 10⁵ spores mL–1. After spotting 5 µL of the diluted spore solution on two leaves per plant, the plants were placed in a humid chamber (100% relative humidity).
For the B. cinerea infection expression analyses, eight leaves from noninoculated plants (control) and eight leaves from systemically or locally infected leaves of inoculated plants were collected 48 h post infection. For each treatment, four replicas were harvested and frozen in liquid nitrogen.
For the disease assay, symptoms were scored by measuring and calculating average diameters of the necrotic lesions on various days after pathogen inoculation. This disease assay was repeated twice with an average of 220 plants per assay. For each assay, the average lesion diameter on leaves of wild-type and mutant plants was compared with a Student’s t test.
Sequence data from this article can be found in the GenBank/EMBL data libraries under accession numbers 833660 and 833661.
Supplemental Data
The following supplemental materials are available.
Supplemental Figure S1. Presence of ARACIN1 and ARACIN2 in other plant genomes.
Supplemental Figure S2. Several independent GFP-positive transgenic lines that constitutively express GFP-Ɗ ARACIN1 or ARACIN2-GFP and displayed severe abnormal morphologies.
Supplemental Figure S3. Antifungal activities of mARACIN1 and mARACIN2 against A. brassicicola, B. cinerea strain B05-10, F. graminearum, and S. sclerotiorum.
Supplemental Figure S4. Secondary and tertiary structure predictions of ARACIN peptides.
Supplemental Table S1. Peptide characteristics of the putatively different forms of ARACIN1 and ARACIN2.
Supplemental Table S2. PCR primers used in this study.
ACKNOWLEDGMENTS
We thank Dr. Martine De Cock and Dr. Annick Bleys for help in preparing the article, Dr. Cindy Martens for the comparative analysis in Brassica rapa, and Dr. Matyá¡ Fendrĭch for help in performing the confocal microscopy.
Glossary
- ROS
reactive oxygen species
- H2O2
hydrogen peroxide
- AMP
antimicrobial peptide
- MeJA
methyl jasmonate
- SA
salicylic acid
- BTH
benzothiadiazole
- dpi
days post infection
- ORF
open reading frame
- nt
nucleotide
- CDS
coding sequence
- ER
endoplasmic reticulum
- CaMV35S
Cauliflower mosaic virus 35S
- IC50
50% growth inhibitory concentration
- qRT
quantitative reverse transcription
- NT
nullisomic-tetrasomic
- PDB
potato dextrose broth
- DMSO
dimethyl sulfoxide
- TAIR
The Arabidopsis Information Resource
- cDNA
complementary DNA
LITERATURE CITED
Author notes
This work was supported by Ghent University (Multidisciplinary Research Partnership Biotechnology for a Sustainable Economy project no. 01MRB510W), the Research Foundation-Flanders (FWO; predoctoral fellowship G.0414.09N to A.I. and postdoctoral fellowship 12A7213N to B.D.C), the Katholieke Universiteit Leuven (Geconcerteerde Onderzoeksacties research funding, project no. GOA/2008/11), the Agentschap voor Innovatie door Wetenschap en Technologie (postdoctoral fellowship to J.N.), FWO-Vlaanderen (postdoctoral fellowships FWO/12A7213N to B.D.C. and G.0414.09 to B.P.A.C.), and Bijzonder Onderzoeksfonds Katholieke Universiteit Leuven (project no. GOA/2008/11 to B.P.A.C.).
These authors contributed equally to the article.
Address correspondence to [email protected] and [email protected].
The author responsible for distribution of materials integral to the findings presented in this article in accordance with the policy described in the Instructions for Authors (www.plantphysiol.org) is: Frank Van Breusegem ([email protected]).
J.N. and A.I. designed most of the experiments, performed the majority of the experiments (physiology, phytopathology, and comparative genomics), and wrote the paper; B.v.d.C. provided technical assistance to A.I. for western-blot analyses; J.M. designed and performed the initial phytopathology tests with A. brassicicola and B. cinerea; B.D.C. assisted in analyzing and interpreting the phytopathology data and completing the writing; F.V.B. conceived the project and supervised the work; B.P.A.C. conceived the phytopathology project and supervised the work.
Articles can be viewed without a subscription.
