


Abstract
Diacylglycerol (DAG) is an intermediate in metabolism of both triacylglycerols and membrane lipids. Probing the steady-state pools of DAG and understanding how they contribute to the synthesis of different lipids is important when designing plants with altered lipid metabolism. However, traditional methods of assaying DAG pools are difficult, because its abundance is low and because fractionation of subcellular membranes affects DAG pools. To manipulate and probe DAG pools in an in vivo context, we generated multiple stable transgenic lines of Arabidopsis (Arabidopsis thaliana) that target an Escherichia coli DAG kinase (DAGK) to each leaflet of each chloroplast envelope membrane. E. coli DAGK is small, self inserts into membranes, and has catalytic activity on only one side of each membrane. By comparing whole-tissue lipid profiles between our lines, we show that each line has an individual pattern of DAG, phosphatidic acid, phosphatidylcholine, and triacylglycerol steady-state levels, which supports an individual function of DAG in each membrane leaflet. Furthermore, conversion of DAG in the leaflets facing the chloroplast intermembrane space by DAGK impairs plant growth. As a result of DAGK presence in the outer leaflet of the outer envelope membrane, phosphatidic acid accumulation is not observed, likely because it is either converted into other lipids or removed to other membranes. Finally, we use the outer envelope-targeted DAGK line as a tool to probe the accessibility of DAG generated in response to osmotic stress.
Diacylglycerol (DAG) is a central metabolite in plant lipid metabolism. Its glycerol backbone is modified with two acyl chains. If a third acyl chain is added, triacylglycerol (TAG) is formed, whereas if a head group is added, it is converted into polar lipids such as a galactolipid. In green tissues, the majority of DAG is used as an intermediate in galactolipid synthesis, because the extensive thylakoid membrane system consists of approximately 85% galactolipids (Block et al., 1983). Although under normal conditions the galactolipids are exclusively chloroplastic, in Arabidopsis (Arabidopsis thaliana), the DAG used to make galactolipids is derived from assembly pathways in both the chloroplast and the endoplasmic reticulum (ER; Benning, 2009). In both pathways, the bulk of the fatty acids are synthesized in the chloroplast stroma (Browse et al., 1986) in the following order of abundance: 18:1, 16:0, and 18:0 (Wallis and Browse, 2002).
In the chloroplast pathway, these fatty acids are directly attached to a glycerol-3-P, generating first lyso-phosphatidic acid (l-PtdOH) and then phosphatidic acid (PtdOH) in the inner leaflet of the chloroplast inner envelope (Fig. 1; Frentzen et al., 1983). The acyltransferases involved are specific to the extent that the sn-2 position of the glycerol backbone predominantly receives a 16:0 fatty acid. PtdOH is then used directly for phosphatidylglycerol (PtdGro) synthesis (Babiychuk et al., 2003) or converted to DAG by a PtdOH phosphatase (Joyard and Douce, 1977). The PtdOH phosphatase activity is known to be associated with the inner envelope, though which leaflet is obscured by the fact that DAG can efficiently flip across membranes (Hamilton et al., 1991) and the actual enzyme has not been unambiguously identified and located (Nakamura et al., 2007). However, the leaflet associations of two other enzymes that use DAG in the inner envelope have been established. MGD1, which uses DAG to synthesize the most abundant galactolipid, monogalactosyldiacylglycerol (MGDG), is on the outer leaflet of the inner envelope membrane (Xu et al., 2005), while SQD2, which uses DAG to generate the less abundant sulfolipid, sulfoquinovosyldiacylglycerol (SQDG), is located on the inner leaflet of the inner envelope membrane (Tietje and Heinz, 1998). Also associated with the inner envelope membrane are a number of fatty acid desaturases, including FAD4, FAD5, FAD6, FAD7, and FAD8 (Joyard et al., 2010). Two of these are specific, generating lipids with signature desaturations: FAD4 desaturates only the 16:0 fatty acid of PtdGro, giving plastidic PtdGro a distinct 16:1 Ɗ3 trans moiety (Browse et al., 1985; Gao et al., 2009), and FAD5 desaturates primarily the 16:0 fatty acid of MGDG, producing 16:1 Ɗ7 cis (Kunst et al., 1989). The remaining desaturases are less specific, with little preference for head group or acyl tail. They further desaturate 16:1 or 18:1 in the cis conformation to 16:2 or 18:2 (FAD6; Browse et al., 1989) and on to 16:3 or 18:3 (FAD7 and FAD8; Wallis and Browse, 2002). The combined actions of these FADs result in the highly desaturated fatty acid profiles seen for most chloroplast lipids.
![Overview of DAG pools in the chloroplast envelope membranes. Processes that are known to have activity feeding into or withdrawing from DAG pools in the chloroplast envelope membranes are shown. Enzymes are indicated, and their substrates and products are connected with black arrows. However, for space reasons, not all reactants are shown. Membrane leaflets are indicated, and enzymes with known membrane topology are displayed correctly, while those without known topology are displayed in the center of the appropriate membrane. The acyl group preferred by each l-PtdOH acyltransferase is given in parentheses. Proposed processes transporting lipids from the ER to the chloroplast are shown with dashed arrows. Enzymes are as follows: 1, ATS1; 2, ATS2; 3, lipid phosphate phosphatase γ; 4, MGD1; 5, SQD2; 6, cytosolic phospholipases; 7, MGD2 or MGD3; 8, SFR2; 9, acyl-CoA:glycerol-3-P acyltransferase; 10, l-PtdOH acyltransferase; 11, PtdOH phosphatase; 12, cytidine diphosphate-choline:DAG cholinephosphotransferase; 13, TGD4; and 14, TGD1, TGD 2, TGD3 lipid transport complex. OE, Chloroplast outer envelope membrane; IE, chloroplast inner envelope membrane; ACP, acyl carrier protein. [See online article for color version of this figure.]](https://oup.silverchair-cdn.com/oup/backfile/Content_public/Journal/plphys/163/1/10.1104_pp.113.222513/4/m_plphys_v163_1_61_f1.jpeg?Expires=1750412462&Signature=tJA7hzeVd9dZ7jEmHWveEv50uTRN9gx82NNwLK3KDSsludz3yt6A3dU0TQL9zc8XCGW36EbNDxuaV-QUlSgWpD3orR7njzOI3lddWYhxLcyaDQCytCvhW9MpQ3tH8WOB16Z3J-vQuB0cWZsypfT~AGsEX7NiDPMEvlHheJFL3tNJ0yIc~c5~61BtY7MMpeNkzrp7swmT8F9mSWnLitMb8D5~CmCmgWR3ik7M3esM3ZtVBsrmJ10mMDTZcBMcAyx-a3C1vL14nzADkGe8LVQFf2pSAcvsnI23eja07E87zxd3p8VTDrYDeHbZ~b9qTNlYnw7hKgUOGuRbup6uPw-1WA__&Key-Pair-Id=APKAIE5G5CRDK6RD3PGA)
Overview of DAG pools in the chloroplast envelope membranes. Processes that are known to have activity feeding into or withdrawing from DAG pools in the chloroplast envelope membranes are shown. Enzymes are indicated, and their substrates and products are connected with black arrows. However, for space reasons, not all reactants are shown. Membrane leaflets are indicated, and enzymes with known membrane topology are displayed correctly, while those without known topology are displayed in the center of the appropriate membrane. The acyl group preferred by each l-PtdOH acyltransferase is given in parentheses. Proposed processes transporting lipids from the ER to the chloroplast are shown with dashed arrows. Enzymes are as follows: 1, ATS1; 2, ATS2; 3, lipid phosphate phosphatase γ; 4, MGD1; 5, SQD2; 6, cytosolic phospholipases; 7, MGD2 or MGD3; 8, SFR2; 9, acyl-CoA:glycerol-3-P acyltransferase; 10, l-PtdOH acyltransferase; 11, PtdOH phosphatase; 12, cytidine diphosphate-choline:DAG cholinephosphotransferase; 13, TGD4; and 14, TGD1, TGD 2, TGD3 lipid transport complex. OE, Chloroplast outer envelope membrane; IE, chloroplast inner envelope membrane; ACP, acyl carrier protein. [See online article for color version of this figure.]
In unstressed plants, DAG seems to be used primarily in the inner chloroplast envelope. However, several conditions are known to cause extensive DAG use in the chloroplast outer envelope. During phosphate deprivation, MGD2 and MDG3 synthesize MGDG from DAG on the outer leaflet of the outer envelope membrane (Kobayashi et al., 2009). The DAG backbones are probably supplied from the phosphatidylcholine (PtdCho) pool by phospholipase activity, which was shown to be simultaneously up-regulated (Andersson et al., 2004; Nakamura et al., 2005). DAG is also generated during freezing stress by a galactolipid:galactolipid galactosyltransferase named Sensitive to FReezing2 (SFR2). This enzyme transfers the galactosyl head group of MGDG onto another MGDG, giving rise to digalactosyldiacylglycerol (DGDG) and DAG (Moellering et al., 2010). The DAG is subsequently sequestered into a lipid droplet by formation of TAG by an as yet unidentified enzyme.
In the ER pathway, fatty acids synthesized in the chloroplast stroma are exported through a still poorly defined mechanism to the ER and activated to acyl-CoAs. Acyltransferases sequentially catalyze formation of l-PtdOH and PtdOH from glycerol-3-P and acyl-CoAs. Again, the acyltransferase working on the sn-2 position of the glycerol backbone is specific, but unlike the chloroplast isoform, it prefers an 18:1 carbon fatty acid (Frentzen et al., 1983). Newly generated PtdOH can be converted to PtdGro or phosphatidyl inositol (PtdIns) (Collin et al., 1999) or hydrolyzed to DAG (Shimojima et al., 2009). DAG can then be further metabolized to TAG and PtdCho. PtdCho acyl groups (18:1/18:1 and 18:1/16:0) are desaturated sequentially by desaturases FAD2 (Okuley et al., 1994) and FAD3 (Browse et al., 1993). These desaturases prefer PtdCho as substrate. The acyl chains modified on PtdCho are transferred to other ER lipids, including DAG, as a result of continual acyl editing of the PtdCho pool (Bates et al., 2012). Furthermore, PtdOH and many of the other extraplastidic phospholipids can be converted to DAG by action of phospholipases (Shimojima et al., 2009). These have as yet partially defined roles in response to stress or recycling of membrane lipids (Testerink and Munnik, 2005).
Glycerolipid precursors generated by de novo synthesis, acyl editing, and possibly stress conditions in the ER are transported to the chloroplast by a mechanism that is likely to involve at least two putative lipid transporters: trigalactosyldiacylglycerol4 (TGD4) in the chloroplast outer envelope membrane and the TGD1, TGD2, and TGD3 complex in the inner envelope membrane (Wang and Benning, 2012). The actual lipid species transported remains unclear, but PtdCho, lyso-phosphatidylcholine, PtdOH, and DAG have been discussed in the literature (Andersson and Dörmann, 2009). The DAG moieties are then fully incorporated into all plastidic lipids except PtdGro, presumably using the same pathways that metabolize plastidic DAG, described above. Because of the preference of chloroplast and ER sn-2 acyltransferases for 16 or 18 carbon fatty acids, respectively, the origin of the DAG moieties can be distinguished by positional analysis of the acyl groups on the glycerol backbone (Roughan and Slack, 1982). In Arabidopsis, the chloroplast and ER lipid synthesis pathways contribute nearly equally to mature chloroplast lipids (Browse et al., 1986; Mongrand et al., 1998). Thus, the DAG pools described so far in the chloroplast inner and outer envelope membranes are each of dual origin.
A challenge for the analysis of the different DAG pools is that this compound is not a bilayer-forming lipid and thus does not accumulate stably to high levels. Furthermore, during any lengthy fractionation procedure, its levels can be expected to alter, as DAG-modifying enzymes exist in multiple membranes. Moreover, because DAG is quickly metabolized and may have efficient transport systems (Dong et al., 2012), it is difficult to confirm whether metabolizing enzymes are accessing the same or separate DAG pools.
To probe different DAG pools of chloroplast membranes in vivo, we have generated a series of stable transgenic Arabidopsis lines in which we target an Escherichia coli DAG kinase (DAGK) to each leaflet of the chloroplast envelope membranes. The basic utility of this approach was previously shown by targeting a DAGK to the chloroplast in tobacco (Nicotiana tabacum) using a single construct fusing the bacterial protein to the Rubisco small subunit N-terminal peptide (Fritz et al., 2007). Here, we present a full phenotypic analysis of these lines, determining which chloroplast membranes show steady-state alterations of DAG and PtdOH levels predicted by ectopic DAGK activity. We further determine the accessibility of DAG pools generated on the outer leaflet of the chloroplast outer envelope membrane during osmotic stress. Having this system established in Arabidopsis will allow characterization of DAG pools in multiple lipid mutant lines.
RESULTS
Construction and Verification of Targeted DAGK Fusion Proteins
To investigate accessibility of DAG pools in each chloroplast membrane, we took advantage of a small, 121-amino acid DAGK from E. coli that spontaneously inserts itself into membranes (Sanders et al., 1996). DAGK converts DAG into PtdOH and was shown to be able to access DAG when inserted into the inside of the inner chloroplast envelope in tobacco (Fritz et al., 2007). DAGK fusion constructs were generated that incorporated a C-terminal hemagglutinin (HA) tag and did or did not include chloroplast-specific N-terminal targeting information, as diagrammed in Figure 2A.
![DAGK fusion proteins remain functional. A, Construction of targeted DAGK fusion proteins. All proteins contain the full E. coli DAGK protein with HA tag. These are fused with N-DGD1, tpTOC75, and tpATS1. Numbers of the first and last residue of the targeting sequence or DAGK are given. B, Bacterial strain FB21625 (dgkA −)-producing proteins indicated below after overnight growth on agar-solidified medium containing isopropyl β-d-1-thiogalactopyranoside and antibiotics and with or without arbutin as indicated at right. (–) indicates spotting of the untransformed strain. PDV1 is a construct without a DAGK fusion in the same pDEST24 vector as the DAGK constructs and is used as a vector control. The vertical white bar separates different sections from the same plate. [See online article for color version of this figure.]](https://oup.silverchair-cdn.com/oup/backfile/Content_public/Journal/plphys/163/1/10.1104_pp.113.222513/4/m_plphys_v163_1_61_f2.jpeg?Expires=1750412462&Signature=vgq7L21IxhIhbPwXD5PYbfH8aa-KZ7YsdYPcPGXHlchGhwyDC1xz~GaP3caJA4fW6w7-02zVKHfEoMRp39N30x99Dy-aOUlHmJ2u961dQ~eMqi3~uEKClrAtLcqDThEsW32ROgeOH1dQD9xJA8b8SNdzFa6F9XJiCDau9tLjWcHJqmE4i2ctJZ55agOfjY3vN1RQo0nMg9~afC~b8LL78rxkITMkWjIcgU6FXyEcXWxeUD7uE9ZCV5i1rxHLony7fpRDcVH1h7Ix1aslfBTHNyXTiYu7v5y6kd5KVeK4FCAjCgAZdNef0lRhTX0LnBfsscLzOB2o0wVpPxvNEyZ4gA__&Key-Pair-Id=APKAIE5G5CRDK6RD3PGA)
DAGK fusion proteins remain functional. A, Construction of targeted DAGK fusion proteins. All proteins contain the full E. coli DAGK protein with HA tag. These are fused with N-DGD1, tpTOC75, and tpATS1. Numbers of the first and last residue of the targeting sequence or DAGK are given. B, Bacterial strain FB21625 (dgkA −)-producing proteins indicated below after overnight growth on agar-solidified medium containing isopropyl β-d-1-thiogalactopyranoside and antibiotics and with or without arbutin as indicated at right. (–) indicates spotting of the untransformed strain. PDV1 is a construct without a DAGK fusion in the same pDEST24 vector as the DAGK constructs and is used as a vector control. The vertical white bar separates different sections from the same plate. [See online article for color version of this figure.]
To ensure that fusion of targeting peptides and HA tags did not disrupt DAGK function, the constructs were introduced into an E. coli strain lacking DAGK (dgkA −). E. coli lacking DAGK are sensitive to growth on hydroquinone β-d-glucopyranoside (arbutin; Miller et al., 1992; Jerga et al., 2007). Arbutin is an alternative substrate for phosphoglycerol transferase I, which can transfer the head group of PtdGro to arbutin. When added to the media, arbutin essentially allows bulk conversion of PtdGro to DAG (Jackson and Kennedy, 1983). Accordingly, in dgkA − strains, DAG accumulates and prevents growth. However, dgkA − strains producing DAGK proteins with or without targeting peptides grew successfully on arbutin complementing the mutation, while the knockout strain producing a control vector did not (Fig. 2B). Therefore, all DAGK fusion proteins retained activity.
E. coli DAGK inserts directionally into membranes and is only active on one face of the membrane (Sanders et al., 1996; Van Horn and Sanders, 2012). Therefore, to test all envelope membranes of the chloroplast, it was targeted to each leaflet of each chloroplast envelope membrane. As a control, untargeted DAGK was used. Because it has no targeting sequence, it is expected to integrate into any membrane accessible to the cytosol, including the chloroplast outer envelope (Fig. 3A).
![DAGK fusion proteins are targeted to all compartments of the chloroplast. A, Expected locations of DAGK proteins based on targeting information and self insertion of DAGK into the nearest membranes. EPM, Extraplastidic membranes; OE, chloroplast outer envelope membrane; IMS, inter membrane space; IE, inner envelope membrane; Th, thylakoid membranes. B, Radiolabeled precursors of proteins as indicated at left were incubated with pea chloroplasts. After import, chloroplasts were incubated with or without Thermolysin or trypsin and were then reisolated and separated into membrane pellet (P) and soluble (S) fractions as indicated at top. Ten percent of the total precursor (TP) before chloroplast incubation is shown as a reference for precursor size. Locations of precursor (pr) and mature (m) proteins are indicated at right; asterisks indicate protease resistant protein fragments. A dashed line separates controls from DAGK fusion proteins. Results are representative of three repeats. [See online article for color version of this figure.]](https://oup.silverchair-cdn.com/oup/backfile/Content_public/Journal/plphys/163/1/10.1104_pp.113.222513/4/m_plphys_v163_1_61_f3.jpeg?Expires=1750412462&Signature=YUyyAv11tOxNfvjdPj3sb~6UD8nWCoWqK26~4xqOhSeIrgQ~pR4ZClbpgtMMzVZLRKrw7cmJJhsfFzZ6C9KY~q8sXfVY6-SDY5onooeS0gEjAdUOo46u1qunL1yBJPc3JZQPhtMOo04WK6YAblJRh32GZTciVeMcaIait9KvmLH5y69IWFRSREVZUSJjcDIl4mkjIH1t~L1SYo3W2wsM3l~MF6nCg0zPK92ac0hlW5a3SPkc52uglCR~~rIOlAMRPNMtAq--HBp2bwANiZpyB38oQCHeacC7oBDHu3E~r~U6uJs-89zAIMOkdGI3KD4TvEr7bXHjHzlCpODc1M4jAw__&Key-Pair-Id=APKAIE5G5CRDK6RD3PGA)
DAGK fusion proteins are targeted to all compartments of the chloroplast. A, Expected locations of DAGK proteins based on targeting information and self insertion of DAGK into the nearest membranes. EPM, Extraplastidic membranes; OE, chloroplast outer envelope membrane; IMS, inter membrane space; IE, inner envelope membrane; Th, thylakoid membranes. B, Radiolabeled precursors of proteins as indicated at left were incubated with pea chloroplasts. After import, chloroplasts were incubated with or without Thermolysin or trypsin and were then reisolated and separated into membrane pellet (P) and soluble (S) fractions as indicated at top. Ten percent of the total precursor (TP) before chloroplast incubation is shown as a reference for precursor size. Locations of precursor (pr) and mature (m) proteins are indicated at right; asterisks indicate protease resistant protein fragments. A dashed line separates controls from DAGK fusion proteins. Results are representative of three repeats. [See online article for color version of this figure.]
To specifically target DAGK to the outer leaflet of the outer envelope of the chloroplast, the N terminus of digalactosyl diacylglycerol1 (DGD1; N-DGD1) was used, as it was previously shown to be responsible for targeting of DGD1 and interacts directly with the outer envelope membrane (Froehlich et al., 2001). Because of its membrane interaction, DAGK targeted with N-DGD1 is expected to insert only in the chloroplast outer envelope and to face the cytosol (Fig. 3A).
To target DAGK simultaneously to the inner leaflet of the outer envelope membrane and the outer leaflet of the inner envelope membrane, it was fused with the transit peptide of the translocon at the outer envelope membrane of chloroplasts, 75 kD (tpTOC75). TOC75 is unique among chloroplast outer envelope membrane proteins in that it has cleavable targeting information, which is removed in two parts (Inoue et al., 2005). The first part is a stroma targeting sequence (Inoue et al., 2001), and the second part, which is necessary to sort TOC75 to the outer envelope membrane, was hypothesized to keep TOC75 from traversing the inner membrane (Baldwin and Inoue, 2006). In a preliminary experiment, tpTOC75 was shown to target soluble GFP to the intermembrane space (R.L. Roston and K. Inoue, unpublished data). When targeted with tpTOC75, DAGK is expected to be able to self insert into inner and outer envelope membranes facing the intermembrane space (Fig. 3A).
Targeting of E. coli DAGK to both the inner leaflet of the inner chloroplast membrane and the outer leaflet of the thylakoid membranes was already shown to be possible in tobacco using the stromal targeting transit peptide of the small subunit of Rubisco (SSU; Fritz et al., 2007). A similar approach with the stromal targeting transit peptide of acyltransferase1 (ATS1; tpATS1) was used here (Fig. 3A).
In vitro chloroplast protein import and subsequent protease digestion and chloroplast fractionation was used to confirm the expected locations of targeted DAGK proteins. Thermolysin is a protease that digests proteins not protected by the outer envelope membrane (Cline et al., 1984), while Trypsin can digest proteins not protected by the inner envelope membrane of the chloroplast (Jackson et al., 1998). Untargeted DAGK was not recovered with any chloroplast fraction, similar to nonchloroplast control luciferase and unlike our prediction that it would insert into the chloroplast outer envelope (Fig. 3, A and B, compare lanes 1, 2, and 3). By contrast, all of the DAGK fusion proteins were recovered with the chloroplast membrane pellet after fractionation, showing that DAGK inserted itself into chloroplast membranes in each case (Fig. 3B, compare lanes 2 and 3). N-DGD1-DAGK was completely susceptible to Thermolysin treatment (Fig. 3B, compare lanes 2 and 4), similar to control outer envelope protein TOC34. This confirms its location on the outer leaflet of the outer envelope membrane. tpTOC75-DAGK was partially digested by Thermolysin, retaining both protein fragments and some full-length mature protein, in a pattern distinct from TOC34 and control inner envelope protein Accumulation and Replication of Chloroplasts6 (ARC6; Fig. 3B, compare lanes 2 and 4). Existence of tpTOC75-DAGK fragments is consistent with DAGK facing the inner leaflet of the outer envelope membrane, allowing only the small DAGK transmembrane region to be accessed by the protease. Note that no degradation products are seen in the N-DGD1-DAGK Thermolysin digestion, corroborating evidence that tpTOC75-DAGK is in a different position in the outer envelope than that of N-DGD1-DAGK. The mature-length tpTOC75-DAGK (lane 4) is completely protected from Thermolysin and therefore must be inside of the outer envelope membrane. Trypsin digestion of tpTOC75-DAGK does not show any protease-protected fragment (Fig. 3B, compare lanes 7 and 9), indicating that the Thermolysin-resistant regions of tpTOC75-DAGK are not protected by the inner envelope membrane. Therefore, tpTOC75-DAGK must be on the outer face of the inner envelope membrane as well as the inner face of the outer envelope membrane, as predicted. Mature tpATS1-DAGK was recovered with the membrane pellet and protected from both Thermolysin and Trypsin digestion (Fig. 3B), consistent with the protease-protected, stromal region of ARC6. It has potentially inserted into either the inner leaflet of the inner envelope or the outer leaflet of the thylakoid membranes. When DAGK was similarly targeted in tobacco with the transit peptide of SSU (Fritz et al., 2007), it was found to be inserted in both inner envelope and thylakoid membranes; therefore, this is the most likely conclusion here. Together with bacterial complementation, these data show that the DAGK fusion proteins are active and specifically targeted to relevant locations throughout the chloroplast.
Phenotypes of Arabidopsis Producing DAGK Proteins
The DAGK constructs were transferred into wild-type Arabidopsis and expressed under the control of the Cauliflower mosaic virus 35S promoter. For simplicity, from this point onward, Arabidopsis plants producing DAGK will be referred to by their targeting information only, i.e. tpATS1 for tpATS1-DAGK-producing Arabidopsis, N-DGD1 for N-DGD1-DAGK-producing Arabidopsis, etc. The majority of resulting plants did not show a growth phenotype, including multiple lines of untargeted DAGK, N-DGD1, and tpATS1 (representative examples, Fig. 4A). In all plant lines, the overall level and species of fatty acids were similar to the wild type (Fig. 4, B and C). Similarly, in all lines tested, the DAGK-encoding construct was expressed, because DAGK-encoding mRNA was detectable in all lines, as assayed by reverse transcription (RT)-PCR (Fig. 4D).
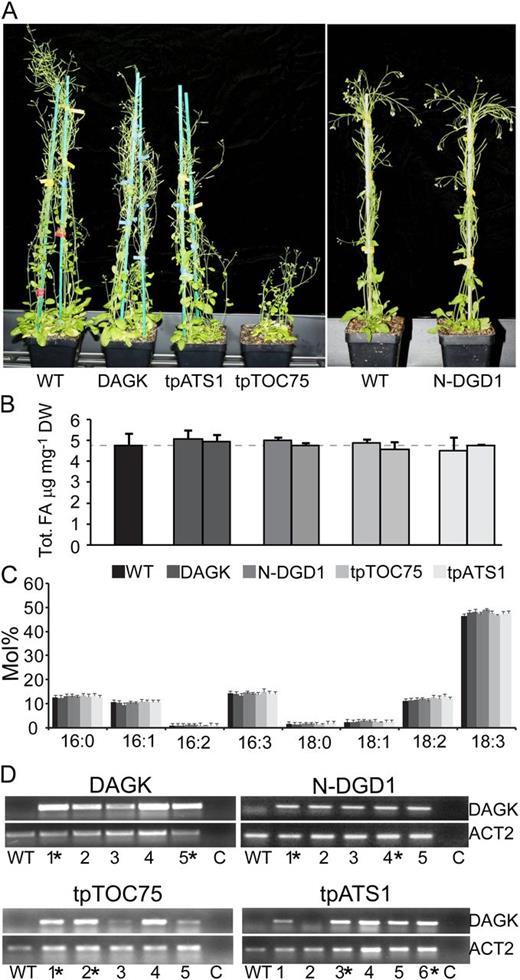
Phenotypic effects of disrupting chloroplastic DAG pools. A, Twelve-week-old wild-type (WT) Arabidopsis or lines producing DAGK or DAGK fused to the respective targeting peptides are shown. A vertical white bar indicates plants grown at a separate time. B, Levels of total fatty acids (FA) are given as micrograms per milligram of dry weight (DW) in the wild type or plants producing DAGK fused to the respective targeting peptides. C, Fatty acid profiles are given as mole percentage of total in the wild type or plants producing DAGK with the respective targeting peptide. Error bars are sds calculated from three or more biological replicates for all graphs. D, RT-PCR results showing levels of DAGK or ACT2 (At3g18780) mRNA in multiple independent lines of untargeted DAGK, N-DGD1, tpTOC75, or tpATS1 or an individual wild-type Arabidopsis. A PCR control (indicated with C) has no template DNA added. Plant lines from which lipid analyses are shown are indicated with an asterisk.
In the previous tobacco study by Fritz et al. (2007), stromally targeted DAGK caused severe growth phenotypes, including loss of chlorophyll and reduced shoot size. Thus, the wild-type appearance of the tpATS1 and N-DGD1 lines was unexpected given that the respective DAGK transcripts were present and shown to encode functional enzyme in the bacterial complementation assay (Fig. 2B). Therefore, DAGK activity in N-DGD1 and tpATS1 chloroplasts was directly measured by incubating solubilized chloroplasts with [γ-32P]ATP and quantifying [32P]PtdOH produced. To establish DAGK assays for isolated chloroplasts, we first validated the assay conditions with commercially available E. coli DAGK. The DAGK was serially diluted and added to wild-type Arabidopsis chloroplasts under assay conditions following those used by Fritz et al. (2007; Fig. 5A). Radiolabel recovered in PtdOH indicated that the assay was robust and in a linear range below 100 ng of DAGK. Using these conditions, chloroplast-associated DAGK activity was then assayed in the wild type, tpATS1, and N-DGD1. Surprisingly, the major product of the assay was not PtdOH, but l-PtdOH, presumably from activity of a phospholipase A. Furthermore, tpATS1 lines appeared to have distinctly more phospholipase A activity than the wild type, as more radioactivity was found in l-PtdOH than in PtdOH in these chloroplasts (Fig. 5B). Increased phospholipase A activity in tpATS1 lines was confirmed by an additional test in which excess commercial E. coli DAGK was added to tpATS1 and wild-type chloroplasts before the assay. Because the exogenous DAGK activity added exceeds the endogenous levels, if phospholipase activity was identical, the relative labeling of PtdOH and l-PtdOH in wild-type and tpATS1 plastid preparations should be similar. However, it was observed that tpATS1chloroplasts had less label in PtdOH (45.1 ± 5.4%) and more in l-PtdOH (125 ± 6.1%) compared with wild-type chloroplasts, consistent with an increased turnover of PtdOH in tpATS1. To reduce the affect of increased phospholipase A activity on the accuracy of DAGK activity measurements, both labeled PtdOH and l-PtdOH were considered products. Assaying DAGK in this manner for both N-DGD1 and tpATS1 lines indicated that both N-DGD1 and tpATS1 have increased radioactivity in PtdOH and l-PtdOH compared with the wild type (Fig. 5C). However, statistical confidence levels were only above 95% for one of the two N-DGD1 lines (other line confidence level, 70.5%), and tpATS1 confidence levels were even lower (68.5% and 55.1%). A time course DAGK assay of the wild type and two independent tpATS1 lines showed a consistent increase of radiolabel in PtdOH and l-PtdOH in tpATS1 compared with the wild type (Fig. 5D). Considering the increase in phospholipase A activity observed in these lines (Fig. 5B), it seems reasonable to suggest that both N-DGD1 and tpATS1 lines have an active DAGK but that tpATS1 plants have compensated for this increase in DAGK activity by concurrently increasing activity of PtdOH-degrading enzymes, including that of at least one phospholipase A.
![Targeted DAGK lines without physical phenotypes show increased DAGK activity. A, Incorporation of label into PtdOH produced by various amounts of E.coli DAGK added directly to wild-type Arabidopsis chloroplasts are presented as a percentage of total radioactivity. Data are fit with a Hill equation. B, Autoradiogram (left) or iodine staining (right) of lipids separated by TLC. On the left, lipids extracted from chloroplasts isolated from the wild type or plants producing tpATS1-DAGK and incubated with [γ-32P]ATP (DAGK assay). Identity of lipid standards generated by partial PtdOH digestion with R. arrhizus lipase are given at right. C, DAGK assays with chloroplasts isolated from the wild type or plants producing DAGK indicated by their respective targeting peptide with label in both PtdOH and l-PtdOH quantified together as percentage of total radioactivity. Results statistically different from the wild type at a 95% confidence level are indicated by an asterisk. D, Time course of l-PtdOH and PtdOH labeling during DAGK assay quantified together as percentage of total radioactivity using chloroplasts isolated from the wild type or two tpATS1-DAGK lines.](https://oup.silverchair-cdn.com/oup/backfile/Content_public/Journal/plphys/163/1/10.1104_pp.113.222513/4/m_plphys_v163_1_61_f5.jpeg?Expires=1750412462&Signature=CuUEXE51QejT5l3iFqEnI3PjrW3LqqKC8ijbvSodoCmZ5tBp4DG~5s~kUZ-OEWYz8rNV-Dxwt9IjO2RN3l8znSEDxhnVoBTCQ93N5qwGnD-~nDXAEv9gipMeeDUqrttO98EldWQWixb4z~6Y63AqYO6zgAp3i1Vn~VuchoGHx~FPBI2dVdLgAIpT9jT3mSKAteqlm0frHOS27MsoDnvekndMBYNyrC9a999qlltLSuo75V~K6ca~zu17zrLthQaNPEAIJk9efR7CCk3esT~n-7--z0P4~yleRrM6G1ltRuAwmpZxL74mBxiWUqE6~vavYA5ciYJkS6MARwnNsehRYA__&Key-Pair-Id=APKAIE5G5CRDK6RD3PGA)
Targeted DAGK lines without physical phenotypes show increased DAGK activity. A, Incorporation of label into PtdOH produced by various amounts of E.coli DAGK added directly to wild-type Arabidopsis chloroplasts are presented as a percentage of total radioactivity. Data are fit with a Hill equation. B, Autoradiogram (left) or iodine staining (right) of lipids separated by TLC. On the left, lipids extracted from chloroplasts isolated from the wild type or plants producing tpATS1-DAGK and incubated with [γ-32P]ATP (DAGK assay). Identity of lipid standards generated by partial PtdOH digestion with R. arrhizus lipase are given at right. C, DAGK assays with chloroplasts isolated from the wild type or plants producing DAGK indicated by their respective targeting peptide with label in both PtdOH and l-PtdOH quantified together as percentage of total radioactivity. Results statistically different from the wild type at a 95% confidence level are indicated by an asterisk. D, Time course of l-PtdOH and PtdOH labeling during DAGK assay quantified together as percentage of total radioactivity using chloroplasts isolated from the wild type or two tpATS1-DAGK lines.
Unlike N-DGD1 and tpATS1, lines of tpTOC75 did have growth phenotypes, including reduced growth (Fig. 4A), as well as delayed and reduced seed set. These phenotypes were unlikely to be due to the location of genomic insertion, as multiple independent lines showed similar phenotypes. Because tpTOC75 lines were the only ones showing growth phenotypes, the possibility that expression of the native TOC75 gene was sense suppressed was investigated. RT-PCR specific to TOC75 or to control gene ACTIN2 showed that TOC75 was expressed in all five tpTOC75 lines tested. In corroboration, Arabidopsis RNA interference knockdowns of TOC75 are severely pale (Huang et al., 2011), while tpTOC75 lines were not (Figs. 4A and 6, B and C). Instead, tpTOC75 lines grew more slowly than the wild type on soil (Fig. 4A) and plates (Fig. 6B), developing smaller mature rosettes, as indicated by rosette leaf size (Fig. 6B) and fewer bolts, but they had normal chlorophyll levels. Total chlorophyll level in wild-type plants was 2.19 ± 0.06 mg g–1 fresh weight, while in tpTOC75-1, it was 2.41 ± 0.33 and in tpTOC75-2, 2.10 ± 0.19. Based on our previous experience with chloroplast lipid mutants (Dörmann et al., 1995), the fact that chlorophyll levels remain unchanged indirectly suggests that there are no secondary effects on chloroplast lipid levels per se due to perturbation of photosynthesis. Therefore, we concluded that observed phenotypic effects were directly due to DAGK activity and proceeded with lipid analysis.
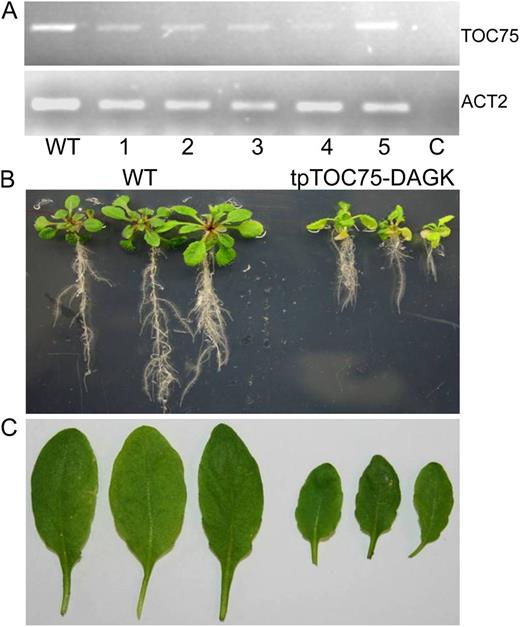
The strong phenotype of tpTOC75-DAGK-producing lines is not due to reduction of TOC75 expression. A, RT-PCR results showing levels of TOC75 (At3g46740) or ACT2 (At3g18780) mRNA in five independent tpTOC75-DAGK lines (1–5) or wild-type (WT) plants. The control (C) has no template DNA added. B, Four-week-old seedlings of the wild type or tpTOC75-DAGK grown on 1% Suc-supplemented Murashige and Skoog medium. C, Full rosette leaves of the 6-week-old wild type or tpTOC75-DAGK grown on soil.
Direct Effects on Levels of DAG and PtdOH
Lipids were analyzed from leaves of 6-week-old, soil-grown wild-type Arabidopsis or two independent lines each of untargeted DAGK, N-DGD1, tpTOC75, or tpATS1, respectively. Because of the large number of lines and replicates involved, this work was necessarily completed over a period of time. Each experiment included, at a minimum, three biological replicates from the wild type and two DAGK-producing lines (i.e. the wild type, tpATS1-1, and tpATS1-2) and was repeated once or more with an additional set of separately grown plants to ensure accuracy. For graphical display, each data set was normalized to the wild-type samples analyzed within the same group and then displayed relative to the average of all the wild types in all groups. For statistical analyses of significant changes, each data set was again compared to wild-type samples analyzed in the same group.
Because DAGK generates PtdOH from DAG, it was expected that the level of PtdOH would increase while the level of DAG would decrease in DAGK-producing plants. Untargeted DAGK lines had only a small effect on the levels of PtdOH and DAG, with the level of PtdOH appearing slightly reduced (Fig. 7A) but lacking statistical significance (best confidence level, 72%). DAG level changes were not consistent between the two lines tested (Fig. 7B) and are therefore unlikely to be relevant. As untargeted DAGK was shown not to interact with chloroplast membranes (Fig. 3B), it may not have inserted into any membrane or may have preferentially inserted into membranes that are not active in lipid metabolism generating DAG and thus had no effect. Similarly, tpATS1 lines showed no consistent change of DAG levels and an apparent change in PtdOH (Fig. 7, A and B), though again without strong statistical support (confidence level, 73%). Neither the tpATS1 nor the untargeted DAGK lines caused any changes to fatty acid profiles of PtdOH or DAG (Fig. 7, C and D). It should be noted that because fatty acid profiles are highly reproducible, many small changes were observed to be statistically significant (marked by asterisks). However, we have only considered the profile as “changed” if observed statistically significant changes are both consistent (i.e. present in both lines) and are compensated for by alternate statistically significant changes (e.g. 18:3 decreases are offset by 18:1 increases). The lack of observed changes in PtdOH and DAG fatty acid profiles of tpATS1 are likely because DAG in the inner chloroplast membrane is derived from PtdOH by action of a PtdOH phosphatase (Benning, 2009), the activity of which, like the observed increase of phospholipase A activity (Fig. 5B), may be increased in these lines. Thus, introducing a DAGK to the inner envelope likely causes completion of a futile cycle, reversibly converting DAG to PtdOH. The unchanged profiles only reconfirmed that the E. coli DAGK has no preference for specific DAG acyl chains (Walsh et al., 1990) and suggest that the native PtdOH phosphatase does not either.
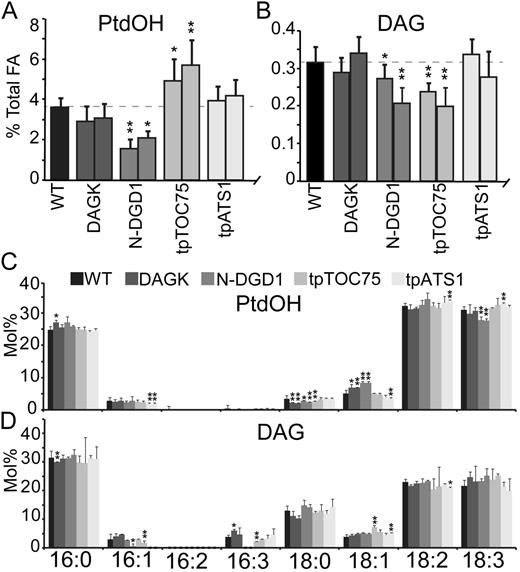
PtdOH and DAG levels in DAGK-producing plants. Levels of PtdOH (A) or DAG (B) are given as a molar percentage of total fatty acids in the wild type or plants producing DAGK indicated by their respective targeting peptide. Fatty acid profiles of PtdOH (C) and DAG (D) in the wild type or plants producing DAGK indicated by their respective targeting peptide. Quantification shown is mole percentage of total fatty acids in each lipid. Error bars are sds from three or more biological replicates for all graphs. Levels statistically different from the wild type at a 95% confidence level are indicated by an asterisk. Those at a 99% confidence level are indicated by a double asterisk.
By contrast, chloroplast outer envelope-localized N-DGD1 lines showed significant decreases in both PtdOH and DAG levels (Fig. 7, A and B). Presumably, DAGK activity did cause a conversion of DAG to PtdOH, because a reduction in the level of DAG was observed. However, the expected increase in PtdOH levels must have been transient, and PtdOH must have been further converted and/or transferred to another membrane. The fatty acid profiles of N-DGD1 DAG were relatively unchanged (Fig. 7D), consistent with the nonspecific activity of E. coli DAGK. However, the fatty acid profile of N-DGD1 PtdOH showed an increase in 18:1 and a decrease in 18:3 moieties (Fig. 7C), suggestive of specificity not attributable to DAGK, and its likely source is the enzyme or transporter resulting in steady-state reduction of PtdOH levels. Alternatively, it is also possible that flux through the PtdOH pool is increased in N-DGD1 plants, and the increase in 18:1 and decrease in 18:3 represents a higher ratio of newly synthesized PtdOH.
In tpTOC75 lines, where DAGK is targeted to both the inside of the outer envelope membrane and the outside of the inner envelope membrane (Fig. 3), the expected increase in PtdOH level and decrease in DAG level was finally observed (Fig. 7, A and B). The fatty acid profiles of each were similar to the wild type (Fig. 7, C and D), indicating that although PtdOH accumulated, it did so with acyl groups of normal desaturation levels, possibly because chloroplast desaturases are available in the inner envelope membrane (Joyard et al., 2010).
Indirect Effects on Other Lipids
PtdOH is a direct precursor for two abundant phospholipids, PtdGro and PtdCho (Benning, 2009), and therefore their levels are of interest. Furthermore, PtdGro levels and fatty acid composition were shown to be affected in tobacco producing tpSSU-DAGK (Fritz et al., 2007). In this study, Arabidopsis producing similarly targeted tpATS1-DAGK did not show any changes to the level of PtdGro, which was indistinguishable from the wild type (Fig. 8A). In fact, no lines showed changes to the level of PtdGro (Fig. 8A). There were, however, statistically significant changes to the fatty acid profile of PtdGro: tpATS1 showed decreases in 16:3 and increases in 18:2 (Fig. 8D), which could be consistent with eukaryotic pathway-derived PtdOH backbones becoming incorporated into plastidic PtdGro. If so, this would confirm the conclusion of the earlier study. Other DAGK lines did not show consistent changes to PtdGro profiles (Fig. 8D).
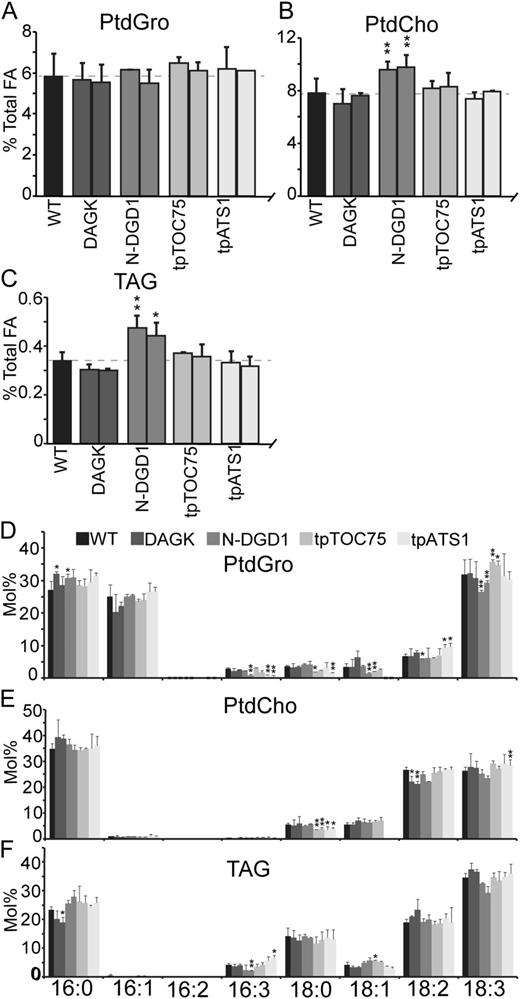
Effects on PtdGro, PtdCho, and TAG levels in DAGK-producing plants. Levels of PtdGro (A), PtdCho (B), and TAG (C) are given as a mole percentage of total fatty acids in the wild type or plants producing DAGK indicated by their respective targeting peptides. Fatty acid profiles of PtdGro (D), PtdCho (E), and TAG (F) are given as the mole percentage of total fatty acids in each lipid. Error bars are sds from three or more biological replicates for all graphs. Levels statistically different from the wild type at a 95% confidence level are indicated by an asterisk. Those at a 99% confidence level are indicated by a double asterisk.
In N-DGD1 lines, it was observed that PtdOH levels decreased by approximately 2% of total fatty acids (Fig. 7A) and that DAG levels decreased by approximately 0.1% (Fig. 7B) but that total fatty acids were not decreased (Fig. 4B). Therefore, these reductions must be compensated by increases in other lipid species. Accordingly, observed levels of PtdCho increased by approximately 2% (Fig. 8B) and TAG by approximately 0.15% (Fig. 8C). The fatty acid profile of PtdCho and TAG did not change to resemble that of PtdOH or DAG (compare Fig. 7, C and D to Fig. 8, E and F), suggesting that if a direct substrate-product relationship was in place, normal desaturation of product lipids was maintained. Levels and fatty acids of PtdCho and TAG were similar to the wild type for all other DAGK lines (Fig. 8, B, C, E, and F).
Levels and compositions of other major plant lipids, including MGDG, DGDG, SQDG, PtdIns, and phosphatidylethanolamine were also quantified (Supplemental Fig. S1). However, no statistically relevant deviations from the wild type were observed among the DAGK-producing plants.
Use of N-DGD1-DAGK to Probe DAG Pools Generated by SFR2
SFR2 is a processive galactosyltransferase also known as galactolipid:galactolipid galactosyltransferase, which is activated by freezing conditions or leaf infiltration with osmotically active compounds (Moellering et al., 2010). When activated, it removes a galactosyl moiety from MGDG and transfers it to another MGDG or higher order oligogalactolipid, increasing the length of the product’s head group and producing DAG as a product. The bulk of DAG formed this way is further metabolized to TAG. However, the availability of SFR2-generated DAG to alternate pathways is unknown. Hence, SFR2-generated DAG accessibility was tested by comparing PtdOH, DAG, and TAG levels before and after SFR2 activation in N-DGD1 or wild-type Arabidopsis.
Before SFR2 activation, levels of PtdOH and DAG were reduced, while TAG levels were increased in N-DGD1 compared with the wild type (Figs. 7, A and B, 8C, and 9A). After SFR2 activation by MgCl2 leaf infiltration, PtdOH, DAG, and TAG levels of the wild type and N-DGD1 were similar (Fig. 9B). It should be noted that the small steady-state increase in TAG levels (approximately 0.1%) or decrease in DAG levels (approximately 0.05%) before SFR2 activation may be too small to be discernible after SFR2 activation, when TAG levels are approximately 12% and DAG approximately 1.4% of total fatty acids. Instead, the focus should be on the levels of PtdOH, which remain relatively similar before and after SFR2 activation in the wild type but not in N-DGD1. The relative increase in N-DGD1 PtdOH levels after SFR2 activation is consistent with DAGK accessing the DAG pool generated by SFR2 activity. Interestingly, although fatty acid profiles of PtdOH, DAG, and TAG after SFR2 activation were dramatically different than those before SFR2 activation (compare Fig. 7, C, D, and F to Fig. 9, C, D, and E), no profiles showed significant differences between the wild type and N-DGD1. Specifically, DAG and TAG profiles after activation have increased levels of 16:3 fatty acids (compare Fig. 9D to Fig. 7D and Fig. 9E to Fig. 8D), likely because of SFR2’s ability to include MGDG-derived backbones in these pools. By contrast, levels of 16:3 fatty acids of PtdOH are only slightly increased relative to the uninduced condition (compare Fig. 9C to Fig. 7C), indicating these backbones are not stably accumulating in the PtdOH pool. These observations are consistent with the ability of N-DGD1-DAGK to access the pool of MGDG-derived DAG created by SFR2 activity but also with the previous observation that N-DGD1-DAGK activity does not cause a stable accumulation of PtdOH (Fig. 7, A and C). It is possible that the 16:3 fatty acid-PtdOH pool was further metabolized into other lipids, including PtdCho and TAG, which were observed to be increased in N-DGD1-DAGK plants (Fig. 8).
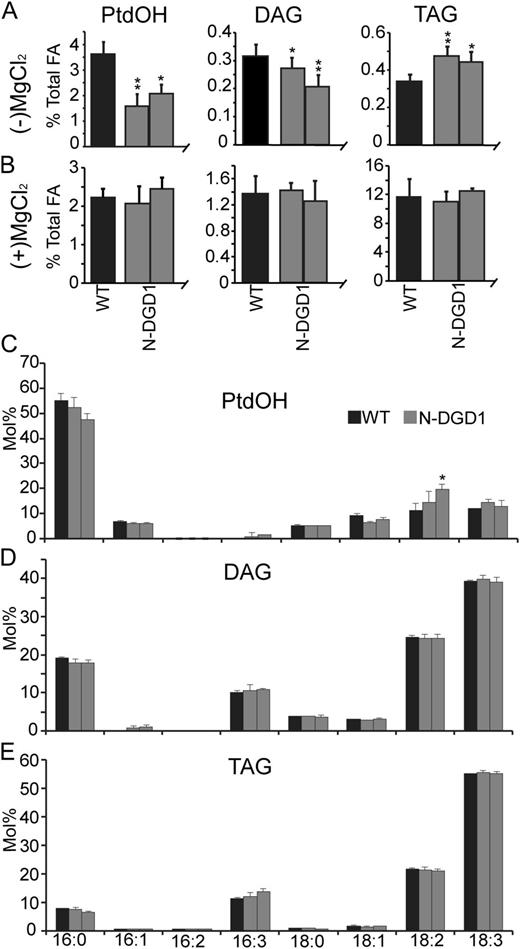
DAG produced by SFR2 is accessible to DAGK on the chloroplast outer envelope membrane. Levels of PtdOH, DAG, and TAG are given as a mole percentage of total fatty acids in the wild type or N-DGD1-DAGK-producing Arabidopsis before (A) or after (B) overnight treatment with 0.4 m MgCl2. The before treatment is reproduced from Figures 6 and 7 for easy comparison. Fatty acid profiles for PtdOH (C), DAG (D), and TAG (E) of treated plants are given as mole percentage of total fatty acids in each lipid. Error bars are sds from three or more biological replicates for all graphs. Levels statistically different from the wild type at a 95% confidence level are indicated by an asterisk. Those at a 99% confidence level are indicated by a double asterisk.
DISCUSSION
Because DAG is a low-abundance, rapidly metabolized intermediate, the role of different DAG pools in membranes has traditionally been difficult to determine in vivo. Here, we have described the generation of stable transgenic Arabidopsis lines in which DAGK was targeted to each lamella of the chloroplast envelopes. These lines represent tools in a strategy to investigate accessibility of different DAG pools in vivo. Analysis of steady-state lipid accumulation in DAGK-producing lines revealed a distinct pattern of PtdOH, DAG, TAG, and PtdCho levels in each line, which supports the hypothesis that DAG has individual roles in each membrane leaflet. Furthermore, comparison of the lines showed that PtdOH accumulation is apparently prevented in the outer leaflet of the outer envelope membrane as PtdOH is either rapidly converted to other lipids or removed to other membranes, while DAG reduction or redirection into other lipids in the inner leaflet of the inner envelope membrane is detrimental to plant growth. Usefulness of the lines was demonstrated by showing that N-DGD1-DAGK can access DAG pools generated by SFR2.
In the outer envelope-targeted N-DGD1 lines, an unexpected lipid phenotype was observed: a significant reduction in PtdOH and DAG with coincident increases in TAG and PtdCho levels (Figs. 6 and 7). The implication is that the outer lamella of the chloroplast outer envelope membrane has mechanisms to convert PtdOH into other lipids and avoid accumulation of PtdOH; however, the enzymes involved are currently not defined. There are no known pathways for TAG or PtdCho synthesis from PtdOH in the chloroplast outer envelope membrane (Inoue, 2007; Joyard et al., 2010). Therefore, PtdCho and TAG are more likely synthesized in a different membrane system, perhaps directed by a transient increase in PtdOH at the outer plastid envelope membrane. Because PtdOH can be a precursor for both PtdCho and TAG production in the ER (Benning, 2009), it is tempting to hypothesize that the relevant metabolism occurs there. In that case, PtdOH would have to be transported to the ER. It was recently shown that TGD4, a protein implicated in lipid trafficking between the ER and chloroplast, specifically binds PtdOH (Wang et al., 2012). TGD4 activity does not depend on external energy sources and is therefore likely to direct PtdOH transport by principles of mass action. Reverse transport of PtdOH by TGD4 could therefore explain why PtdOH is not accumulated, but it would fail to explain why PtdOH is reduced. On the other hand, PtdOH is known to be a signaling lipid, and PtdOH signals are known to be transient and quickly dissipated (Testerink and Munnik, 2005). It is certainly possible that PtdOH has a signaling role when generated on the outside of the chloroplast, as it would be exposed to cytosolic enzymes. However, it is not clear what the direct target(s) of the signaling PtdOH would be. We briefly considered the possibility that it would activate SFR2, as phospholipase activity and SFR2 activity both occur in response to freezing (Welti et al., 2002; Moellering et al., 2010). However, no accumulation of diagnostic oligogalactolipids was observed.
Another unexpected result was the growth phenotype of the tpTOC75 lines. Unlike the N-DGD1 and tpATS1 lines that were similar to the wild type, the tpTOC75 lines were dwarfed (Figs. 3A and 4). It seems unlikely that this is an effect on the endogenous TOC75 gene, as it is still expressed (Fig. 6A), and the plants are not pale (Figs. 3A and 6, B and C), as is typically observed for TOC75-attenuated lines. Therefore, it is most likely to be related to the presence of DAGK on the outside of the chloroplast inner and/or the inside of the chloroplast outer envelope membranes. Because the rates of DAG flip-flop across a membrane (approximately 50 s–1; Allan et al., 1978; Hamilton et al., 1991) and catalysis by DAGK (kcat, turnover number, approximately 26 s–1; Van Horn and Sanders, 2012) are similar and the flip-flop rate of PtdOH (approximately 0.02 h–1; Homan and Pownall, 1988) is much slower, it is possible that the tpTOC75 lines are pulling DAG to the intermembrane space side of the envelopes. If DAG was not present in the outside lamella of the inner envelope membrane, further metabolism to MGDG would be impaired and could cause the slow growth phenotype. However, mutants deficient in MGDG, such as mgd1, are pale (Jarvis et al., 2000), and tpTOC75 lines are not. Another possibility is the completion of a futile cycle associated with the inner envelope membrane. One has to assume that tpTOC75-DAGK is making PtdOH on the outside of the inner envelope membrane. Because the TGD1, TGD2, TGD3 complex in the chloroplast inner envelope is an ATP-dependent lipid transporter in the inner envelope membrane that specifically binds PtdOH (Lu et al., 2007; Lu and Benning, 2009; Roston et al., 2012), it could use ATP to return the PtdOH produced by DAGK to the inner leaflet of the inner envelope membrane. There, plastid PtdOH phosphatase hydrolyzes PtdOH to DAG, which can easily flip back through the inner envelope membrane and become the substrate for DAGK, thereby completing the futile cycle. This futile cycle effectively depletes the plant of energy resources and therefore could cause the slower growth phenotype seen. However, the PtdOH phosphatase portion of this futile cycle should also have been present in tpATS1, which shows no phenotype. Finally, the answer may be as simple as the fact that tpTOC75-DAGK is similar to a combination of DAGK targeted in tpATS1- and N-DGD1-DAGK lines. Because DAG can easily flip across the membranes, we may be observing an additive effect of DAGK acting on both chloroplast envelopes.
Interestingly, both the visual and lipid phenotypes of stromally targeted tpATS1-DAGK-producing Arabidopsis differ from previously reported stromally targeted tpSSU-DAGK-producing tobacco (Fritz et al., 2007). Transformed tobacco plants had severely reduced growth, were pale, and showed alterations in levels and/or composition of thylakoid MGDG, DGDG, SQDG, PtdOH, and PtdGro. Specifically, the study focused on unique molecular species of PtdGro with 18:1 and 18:4 Ɗ3-trans acyl groups in the sn-2 position of the glycerol backbone. In the Arabidopsis tpATS1-DAGK lines discussed here, there was no altered growth phenotype and no chlorotic phenotype, and while fatty acid profiles of total PtdGro were closely examined for unique species, none were found. Because levels of 18:1 and 18:4 Ɗ3-trans were very small in the tobacco study and the increase in DAGK activity levels were not large enough for statistical significance in the tpATS1-DAGK lines, it seems likely that any increases in 18:1 from our whole-leaf PtdGro extracts were below the detection limit. However, our PtdGro profiles did show consistently reduced 16:3 and increased 18:2 acyl groups, which could indicate that some chloroplast PtdGro was derived from eukaryotic PtdOH precursors. Because of the large differences in the data sets, better comparisons can be made of lipids extracted from whole leaves, as these experimental conditions were more similar. At the whole-leaf level, tpSSU-DAGK production resulted in a relative increase of PtdCho levels and relative decreases of MGDG and DGDG levels. These changes are likely to be indirectly related to the paleness and loss of photosynthetic capacity of transgenic tobacco, as chloroplast-specific lipids are reduced while the major extraplastidic phospholipid is increased. By contrast, the corresponding transgenic Arabidopsis lines were not pale, indicating that their chloroplasts and thylakoid membranes were functional, and PtdCho, MGDG, and DGDG levels seemed to reflect that by remaining constant (Fig. 7B; Supplemental Fig. S1). Again, it is unclear why photosynthesis was affected in tobacco and not in Arabidopsis. One possibility is that there is an intrinsic difference in lipid metabolism between the two species, a possibility that is corroborated by increased phospholipase A activity observed for the Arabidopsis transgenic lines and not the tobacco lines. It is a possibility that additional metabolic activities involved in PtdOH turnover have been activated in Arabidopsis expressing tpATS1-DAGK but not in tobacco transgenic lines. Conversely, it may be equally possible that the absolute difference in DAGK activity between the two experimental systems could explain the difference in phenotypes.
CONCLUSION
In conclusion, the chloroplast-targeted DAGK lines generated in this study revealed multiple effects that are not necessarily explained by our current understanding of lipid synthesis in the chloroplast envelope membranes. Therefore, the lines are not only informative in the short term, but will also be valuable tools for understanding lipid metabolism in the future. Their usefulness was demonstrated by showing that DAG generated during activation of SFR2 is accessible in the membrane.
MATERIALS AND METHODS
DAGK Constructs
All relevant primers are given in Table I and are therefore referenced in the text by number. All kits were used according to manufacturer protocols. The DAGK coding sequence was isolated from Escherichia coli genomic DNA using primers 1 and 2. Primer 1 included restriction sites for BglII and KpnI, and primer 2 included a HA tag. PCR products of DAGK-HA were inserted into Gateway vector pDONR-Zeo (Invitrogen) using BP clonase II (Invitrogen), and sequences were confirmed at the Michigan State University Research Technology Support Facility (http://rtsf.msu.edu/). Targeting sequences were isolated from complementary DNA (cDNA) produced using SuperScript III (Invitrogen) from total RNA purified from Arabidopsis (Arabidopsis thaliana) ecotype Columbia-2 with an RNeasy plant mini kit (Qiagen). Primers were as follows: N-DGD1, 3 and 4; tpTOC75, 5 and 6; and tpATS1, 7 and 8. All forward primers included a BglII site, and all reverse primers included a KpnI site. PCR products were cut with BglII and KpnI (New England Biolabs) and ligated into DAGK-HA-pDONR-Zeo, and the entire construct was confirmed by sequencing. They were then transferred to pMDC32 (Curtis and Grossniklaus, 2003) for plant transformation or pDEST24 (Invitrogen) for bacterial complementation using LR clonase II (Invitrogen). For chloroplast protein import, entire DAG constructs (i.e. N-DGD1-DAGK-HA) were inserted into pGEMTEASY (Promega) using forward primers 9, 10, 11, and 12 and reverse primer 13 and confirmed by sequencing to be properly inserted behind the Sp6 promoter. Construction of N-DGD1-DAGK-HA was challenging and required the use of the CopyCutter EPI400 bacterial host (Epicentre) to minimize expression.
Primer sequences
Primers used for cloning or RT-PCR experiments are listed in the 5′ to 3′ direction. They are identified in the text by the number assigned at left.
| No. | 5′ to 3′ Sequence |
|---|---|
| 1 | AAAAAGCAGGCTAGATCTACTGGTACCATGGCCAATAATACCACTGG |
| 2 | AGAAAGCTGGGTCCTAAGCGTAATCTGGAACATCGTATGGGTATCCAAAATGCGACCATAAC |
| 3 | GGCAGATCTATGGTAAAGGAAACTCTAA |
| 4 | TACGGTACCCTCAGGCTTCACAAA |
| 5 | GGCAGATCTATGGCCGCCTTCTC |
| 6 | TACGGTACCAGAATCCCAATCCGG |
| 7 | GGCAGATCTATGACTCTCACGTTTTC |
| 8 | TACGGTACCATCCTGAACAAGCTC |
| 9 | TATGCCACTCATATGATGGCCAATAATACCACTGG |
| 10 | TATGCCACTCATATGGTAAAGGAAACTCTAATTCCTCC |
| 11 | TATGCCACTCATATGATGGCCGCCTTCTCC |
| 12 | TATGCCACTCATATGACTCTCACGTTTTCCTC |
| 13 | ACAGCAGCATGCCTAAGCGTAATCTGGAACAT |
| 14 | CGTATCTGGATGGTGTTTACAATC |
| 15 | GGAATTCTTAATACCTCTCTCCAAATCGGAAGAAC |
| 16 | ATGGCCAATAATACCACTGG |
| 17 | TCCAAAATGCGACCATAAC |
| 18 | ATGGCTGAGGCTGATGATATTCAACCAATC |
| 19 | AGGAGCAATACGAAGCTCATTGTAGAAAGT |
Complementation of the dgkA − Mutant of E. coli
Bacterial strain FB21625 (Jerga et al., 2007) was T7 lysogenized using a λDE3 lysogenization kit (Merck,). Freshly lysogenized cells were transformed with pDEST24 constructs, including unrelated Plastid DiVision1 (PDV1)-pDEST24 as a vector control. After overnight selection on ampicillin and kanamycin, single colonies were grown in culture overnight, normalized for optical density, and then spotted onto ampicillin kanamycin media or media supplemented with 90 mm hydroquinone β-d-glucopyranoside (arbutin, Sigma) and 0.1 m isopropyl β-d-1-thiogalactopyranoside (Roche) and allowed to grow for 24 h at 37°C.
Chloroplast Protein Import
Control plasmids were as previously described for SSU (Olsen and Keegstra, 1992) and ARC6 (Vitha et al., 2003). TOC34 cDNA was obtained from Arabidopsis Biological Resource Center (Yamada et al., 2003), inserted into pENTR-SD-DTOPO, and then subsequently transferred into pDEST14 (Invitrogen) according to the manufacturer’s protocol. Intact chloroplasts were isolated from 8- to 12-d-old pea (Pisum sativum) seedlings and purified as previously described (Bruce et al., 1994). Intact pea chloroplasts were reisolated and resuspended in import buffer (330 mm sorbitol and 50 mm HEPES-KOH, pH 8.0) at a concentration of 1 mg chlorophyll mL–1. Import assays were performed essentially as described (Tranel et al., 1995). Briefly, large-scale import assays were performed in import buffer at 600 μL final volume containing 200 μL chloroplasts, 4 mm Mg-ATP, and either [3H]Leu or [35S]Met-labeled precursor proteins. After incubation for 40 min at room temperature, assays were divided into two 300-μL aliquots. One aliquot was mock treated with import buffer, while the second fraction was incubated with Thermolysin or trypsin as previously described (Jackson et al., 1998) for an additional 30 min on ice. After quenching, intact chloroplasts were recovered by centrifugation through a 40% (v/v) Percoll cushion, lysed, and then fractionated into total soluble and membrane fractions. All fractions were subsequently analyzed by SDS-PAGE. After electrophoresis, the gel was subjected to fluorography and exposed to x-ray film (Eastman Kodak).
Plant Material
Constructs in pMDC32 were transformed into Agrobacterium tumefaciens strain GV3101 and then introduced into the Arabidopsis wild type (ecotype Columbia-2) by floral dip (Clough and Bent, 1998). T1 seeds were screened for resistance to hygromycin (20 μg mL–1) on Murashige and Skoog medium (Murashige and Skoog, 1962) solidified with 0.6% (w/v) agar gel (Sigma), transferred to soil, and confirmed by RT-PCR (see below). The T3 generation of each transgenic line was habitually screened by growth on hygromycin for 3 to 4 weeks, except slow-growing tpTOC75, which was screened for 4 to 5 weeks, before transfer to soil for phenotypic and lipid analyses. Plants tested are therefore expected to be homo- or heterozygous with respect to the DAGK transgene. Growth on soil was in a controlled chamber with 16-h/8-h photoperiod at 22°C/18°C (day/night) with a photosynthetic photon flux density of 70 to 80 μmol m–2 s–1 during the day, and plants were supplemented with one-half-strength Hoagland’s solution (Hoagland and Arnon, 1950).
RT-PCR
Total RNA was isolated from T1 DAGK lines or wild-type Arabidopsis with the RNeasy plant mini kit. The cDNA was produced from 1 μg of RNA using SuperScript III. Expression of TOC75-III (At3g46740) was tested with primers 14 and 15. Expression of DAGK was tested with primers 16 and 17. Expression of ACTin2 (ACT2; At3g18780) was tested using primers 18 and 19. Initial tests confirmed that the reactions were not saturated at the cycle number used.
DAGK Assay
Measurement of DAGK activity was based on methods described previously (Loomis et al., 1985; Fritz et al., 2007). Briefly, 100 μg of chlorophyll-equivalent chloroplasts isolated as described (Bruce et al., 1994) were resuspended on ice with 50 μL of 50 mm HEPES, pH 6.8, 50 mm NaCl, 12.5 mm MgCl2, 2 mm dithiothreitol, 1% (w/v) decylmaltoside (Affymetrix), and 0.2 mg mL–1 1,2-dioleoyl-sn-glycerol (Avanti Polar Lipids). In specified experiments, commercial E. coli DAGK (Enzo Life Sciences) was serially diluted, and then a consistent volume (1 μL) of DAGK was added to chloroplasts before resuspension in the above buffer. Measurement of the DAGK reaction was started by addition of 1 μL of ATP and tetra (triethylammonium) salt [γ-32P] (5 mCi mL–1, American Radiolabeled Chemicals) and then incubated at room temperature for 20 min or as specified. Reactions were stopped by addition of 100 μL of methanol:chloroform (2:1, v/v) and 50 μL of 0.2 m H3PO4 and 1 m KCl. After centrifugation, the chloroform phase was loaded onto JT-Baker PA-Si250 plates, pretreated and baked as described (Wang and Benning, 2011), and then resolved with chloroform:methanol:7 m ammonium hydroxide (65:25:5, v/v). Radioactive PtdOH and l-PtdOH reaction products were visualized by autoradiography and quantified by scintillation counting of bands scraped from the thin layer chromatography (TLC) plate. For identification, lipids including a lipid standard generated by partial Rhizopus arrhizus lipase digestion (Li et al., 2012) were reversibly stained by exposure to iodine vapor.
Lipid Analysis
Lipids were extracted from leaves of 6- to 7-week-old soil-grown plants and used for TLC analysis as described (Wang and Benning, 2011). Resolving solvents used were as follows: DAG and TAG, petroleum ether:diethyl ether:glacial acetic acid (80:20:1, v/v); polar lipids excepting PtdOH, acetone:toluene:water (91:30:7.5, v/v). PtdOH was resolved using a two-dimensional TLC system, with the first dimension solvent chloroform:methanol:7 m ammonium hydroxide (130:80:8, v/v) and the second dimension chloroform:methanol:glacial acetic acid:water (170:25:25:6, v/v), similar to that described (Xu et al., 2005). Polar lipids were resolved on JT-Baker PA-Si250 plates and pretreated and baked as described (Wang and Benning, 2011). TAG, DAG, and PtdOH were resolved on TLC plates baked for 1 h at 120°C from EMD Millipore. Each resolved lipid band analyzed was compared to total lipid of a known fraction spotted onto the TLC plate outside the resolving area. These were scraped from the TLC plates, converted into fatty acid methyl esters, normalized to a 15:0 standard, and quantified by gas chromatographyflame ionization detection as described (Wang and Benning, 2011).
Data Processing
Using the unresolved total lipid fraction, gas chromatography data were converted to mole percentage of total fatty acids to allow comparison across experiments. When more than one form existed, various forms of 16:1 or 18:1 fatty acids were combined. To ensure that small changes were not misrepresented, when data sets were combined for graphical display, each data set was normalized to its wild-type samples run in the same experiment and displayed at the average wild-type value across all experiments. Statistical analyses used a two-tailed, paired, or unpaired Student’s t test as appropriate and only compared data sets to wild-type samples run in the same experiment.
Antisera
Generation of antipeptide antiserum recognizing E. coli DAGK was performed as described (Ramer and Bell, 1990), using a similar peptide ANNTTGFTRIIKAC, with the services of LifeTein.
Sequence data from this article can be found in the GenBank/EMBL data libraries under accession numbers E. coli DAGK: AAA24394; DGD1: NM_111999; TOC75: NM_114541; ATS1: NM_102953; PDV1: NM_124707; SSU: NM_105379; ARC6: NM_123613; TOC34: NM_120582; ACT2: NM_112764.
Supplemental Data
The following materials are available in the online version of this article.
Supplemental Figure S1. Levels and composition of MGDG, DGDG, SQDG, PtdIns, and phosphatidylethanolamine in DAGK-producing plants.
ACKNOWLEDGMENTS
We thank Sanjaya (Michigan State University) for measurement of chlorophyll, Sanjaya and Bensheng Liu (Michigan State University) for investigative mass spectrometry-based lipidomics, Charles O. Rock (St. Jude Children’s Research Hospital) for the gift of bacterial strain FB21625, and Anna Hurlock (Michigan State University) for critical reading of the manuscript.
Glossary
- DAG
diacylglycerol
- TAG
triacylglycerol
- ER
endoplasmic reticulum
- l-PtdOH
lyso-phosphatidic acid
- PtdOH
phosphatidic acid
- PtdGro
phosphatidylglycerol
- MGDG
monogalactosyldiacylglycerol
- SQDG
sulfoquinovosyldiacylglycerol
- PtdCho
phosphatidylcholine
- DGDG
digalactosyldiacylglycerol
- PtdIns
phosphatidyl inositol
- RT
reverse transcription
- TLC
thin layer chromatography
- cDNA
complementary DNA
LITERATURE CITED
Andersson MX, Dörmann P (2009) Chloroplast membrane lipid biosynthesis and transport. In AS Sandelius, H Aronsson, eds, The Chloroplast: Interactions with the Environment. Springer, Heidelberg, pp 125–158
Bruce BD, Perry S, Froehlich J, Keegstra K (1994) In vitro import of protein into chloroplasts. In SB Gelvin, RA Schilperoort, eds, Plant Molecular Biology Manual. Kluwer Academic Publishers, Boston, pp 1–15
Author notes
This work was supported by the Division of Chemical Sciences, Geosciences, and Biosciences, Office of Basic Energy Sciences of the U.S. Department of Energy (grant nos. DE–FG02–98ER20305 to C.B. and DE–FG02–91ER20021 to J.E.F.) and Michigan AgBioResearch (to C.B.).
Address correspondence to [email protected].
The author responsible for distribution of materials integral to the findings presented in this article in accordance with the policy described in the Instructions for Authors (www.plantphysiol.org) is: Christoph Benning ([email protected]).
Some figures in this article are displayed in color online but in black and white in the print edition.
The online version of this article contains Web-only data.
Articles can be viewed online without a subscription.
