


Abstract
The effect of nitrogen (N) stress on the pool system supplying currently assimilated and (re)mobilized N for leaf growth of a grass was explored by dynamic 15N labeling, assessment of total and labeled N import into leaf growth zones, and compartmental analysis of the label import data. Perennial ryegrass (Lolium perenne) plants, grown with low or high levels of N fertilization, were labeled with 15NO3 −/14NO3 − from 2 h to more than 20 d. In both treatments, the tracer time course in N imported into the growth zones fitted a two-pool model (r 2 > 0.99). This consisted of a “substrate pool,” which received N from current uptake and supplied the growth zone, and a recycling/mobilizing “store,” which exchanged with the substrate pool. N deficiency halved the leaf elongation rate, decreased N import into the growth zone, lengthened the delay between tracer uptake and its arrival in the growth zone (2.2 h versus 0.9 h), slowed the turnover of the substrate pool (half-life of 3.2 h versus 0.6 h), and increased its size (12.4 μg versus 5.9 μg). The store contained the equivalent of approximately 10 times (low N) and approximately five times (high N) the total daily N import into the growth zone. Its turnover agreed with that of protein turnover. Remarkably, the relative contribution of mobilization to leaf growth was large and similar (approximately 45%) in both treatments. We conclude that turnover and size of the substrate pool are related to the sink strength of the growth zone, whereas the contribution of the store is influenced by partitioning between sinks.
This article examines the nitrogen (N) supply system of growing grass leaves, and it investigates how functional and kinetic properties of this system are affected by N stress. The N supply of growing leaves is a dominant target of whole-plant N metabolism. This is primarily related to the high N demand of the photosynthetic apparatus and the related metabolic machinery of new leaves (Evans, 1989; Makino and Osmond, 1991; Grindlay, 1997; Lemaire, 1997; Wright et al., 2004; Johnson et al., 2010; Maire et al., 2012). The N supply system, as defined here, is an integral part of the whole plant: it includes all N compounds that supply leaf growth. Hence, it integrates all events between the uptake of N from the environment (source), intermediate uses in other processes of plant N metabolism, and the eventual delivery to the leaf growth zone (sink; Fig. 1). N that does not ultimately serve leaf growth is not included in this system; all N that serves leaf growth is included, irrespective of its localization in the plant. Conceptually, two distinct sources supply N for leaf growth: N from current uptake and assimilation that is directly transferred to the growing leaf (“directly transferred N”) and N from turnover/redistribution of organic compounds (“mobilized N”).
![Schematic representation of N fluxes in the leaf growth zone and in the N supply system of leaf growth in a grass plant. A, Scheme of a growing leaf, with its growth zone (including zones of cell division, expansion, and maturation) and recently produced tissue (RPT). N import (I; μg h−1) into the growth zone is mostly in the form of amino acids. Inside the growth zone, the nitrogenous substrate is used in new tissue construction. Then, N export (E; μg h−1) is in the form of newly formed, fully expanded nitrogenous tissue (tissue-bound export with RPT) and is calculated as leaf elongation rate (L ER; mm h−1) times the lineal density of N in RPT (ρ; μg mm−1): E = L ER × ρ (Lattanzi et al., 2004). In a physiological steady state, import equals export (I = E) and the N content of the growth zone (G; μg [not shown]) is constant. Labeled N import into the growth zone (I lab) commences shortly after labeling of the nutrient solution with 15N. The labeled N content of the growth zone (G lab; μg) increases over time (dG lab/dt) until it eventually reaches isotopic saturation (Fig. 2B). Similarly, the lineal density of labeled N in RPT (ρlab) increases until it approaches ρ. At any time, the export of labeled N in RPT (E lab) equals the concurrent ρlab × L ER. The import of labeled N is obtained as I lab = E lab + dG lab/dt (Lattanzi et al., 2005) and considers the increasing label content in the growth zone during labeling. The fraction of labeled N in the import flux (f lab I) is calculated as f lab I = I lab/I. The time course of f lab I (Fig. 3) reflects the kinetic properties of the N supply system of leaf growth (C). B, Scheme of a vegetative grass plant (reduced to a rooted tiller with three leaves) with leaf growth zone. N import into the growth zone (I) originates from (1) N taken up from the nutrient solution that is transferred directly to the growth zone following assimilation (directly transferred N) and (2) N derived from turnover/redistribution of stores (mobilized N). The store potentially includes proteins in all mature and senescing tissue in the shoot and root of the entire plant. As xylem, phloem, and associated transfer cells/tissue provide for a vascular network that connects all parts of the plant, the mobilized N may principally originate from any plant tissue that exhibits N turnover/mobilization. The fraction of total N uptake that is allocated to the N supply system of the growth zone equals U (see model in C). The fraction of total mobilized N allocated to the growth zone equals M (see model in C). C, Compartmental model of the source-sink system supplying N to the leaf growth zone, as shown by Lattanzi et al. (2005) and used here. Newly absorbed N (U; μg h−1) enters a substrate pool (Q 1); from there, the N is either imported directly into the growth zone (I) or exchanged with a store (Q 2). Q 1 integrates the steps of transport and assimilation that precede the translocation to the growth zone. Q 2 includes all proteins that supply N for leaf growth during their turnover and mobilization. The parameters of the model, including the (relative) size and turnover of pools Q 1 and Q 2, the deposition into the store (D; μg h−1), and the mobilization from the store (M; μg h−1), and the contribution of direct transfer relative to mobilization to the N supply of the growth zone are obtained by fitting the compartmental model to the f lab I data (A) obtained in dynamic 15N labeling experiments (for details, see “Materials and Methods”). During physiological steady state, the sizes of Q 1 and Q 2 are constant, I = U, and M = D. [See online article for color version of this figure.]](https://oup.silverchair-cdn.com/oup/backfile/Content_public/Journal/plphys/162/4/10.1104_pp.113.219311/2/m_plphys_v162_4_2095_f1.jpeg?Expires=1747909562&Signature=ddkcubmk2jnObkr7rbakbFrLAnyjoo60pjFE8oznmYUgPVYd3F3xXWZ~f4AtTsK-nxa4q41Wp51s2SudXtOu0w7yEviuBc80mAERdOaNkj-Hj5qjcp3gsjzSVZqoGJiPC2b3HJeN0fl1xrwkkWGGM1EzUtTP8RaYCcfiXOzX99zKJmsMcN3YgMEdxntkKNwj-vIawojTrVcQN5V-NHJ3iX0zCKHJpmh2FpNP-6n5u0s8A5LOvPi4zbJPizGzAkqzfzT2rsaxghCZSngYJ2o4dsqfPL9vH0W8qBz3KKnaXJiEnGixM2GRiIS2MTh-pP95cDs2TFtngWF3uO6oj3FgFg__&Key-Pair-Id=APKAIE5G5CRDK6RD3PGA)
Schematic representation of N fluxes in the leaf growth zone and in the N supply system of leaf growth in a grass plant. A, Scheme of a growing leaf, with its growth zone (including zones of cell division, expansion, and maturation) and recently produced tissue (RPT). N import (I; μg h−1) into the growth zone is mostly in the form of amino acids. Inside the growth zone, the nitrogenous substrate is used in new tissue construction. Then, N export (E; μg h−1) is in the form of newly formed, fully expanded nitrogenous tissue (tissue-bound export with RPT) and is calculated as leaf elongation rate (L ER; mm h−1) times the lineal density of N in RPT (ρ; μg mm−1): E = L ER × ρ (Lattanzi et al., 2004). In a physiological steady state, import equals export (I = E) and the N content of the growth zone (G; μg [not shown]) is constant. Labeled N import into the growth zone (I lab) commences shortly after labeling of the nutrient solution with 15N. The labeled N content of the growth zone (G lab; μg) increases over time (dG lab/dt) until it eventually reaches isotopic saturation (Fig. 2B). Similarly, the lineal density of labeled N in RPT (ρlab) increases until it approaches ρ. At any time, the export of labeled N in RPT (E lab) equals the concurrent ρlab × L ER. The import of labeled N is obtained as I lab = E lab + dG lab/dt (Lattanzi et al., 2005) and considers the increasing label content in the growth zone during labeling. The fraction of labeled N in the import flux (f lab I) is calculated as f lab I = I lab/I. The time course of f lab I (Fig. 3) reflects the kinetic properties of the N supply system of leaf growth (C). B, Scheme of a vegetative grass plant (reduced to a rooted tiller with three leaves) with leaf growth zone. N import into the growth zone (I) originates from (1) N taken up from the nutrient solution that is transferred directly to the growth zone following assimilation (directly transferred N) and (2) N derived from turnover/redistribution of stores (mobilized N). The store potentially includes proteins in all mature and senescing tissue in the shoot and root of the entire plant. As xylem, phloem, and associated transfer cells/tissue provide for a vascular network that connects all parts of the plant, the mobilized N may principally originate from any plant tissue that exhibits N turnover/mobilization. The fraction of total N uptake that is allocated to the N supply system of the growth zone equals U (see model in C). The fraction of total mobilized N allocated to the growth zone equals M (see model in C). C, Compartmental model of the source-sink system supplying N to the leaf growth zone, as shown by Lattanzi et al. (2005) and used here. Newly absorbed N (U; μg h−1) enters a substrate pool (Q 1); from there, the N is either imported directly into the growth zone (I) or exchanged with a store (Q 2). Q 1 integrates the steps of transport and assimilation that precede the translocation to the growth zone. Q 2 includes all proteins that supply N for leaf growth during their turnover and mobilization. The parameters of the model, including the (relative) size and turnover of pools Q 1 and Q 2, the deposition into the store (D; μg h−1), and the mobilization from the store (M; μg h−1), and the contribution of direct transfer relative to mobilization to the N supply of the growth zone are obtained by fitting the compartmental model to the f lab I data (A) obtained in dynamic 15N labeling experiments (for details, see “Materials and Methods”). During physiological steady state, the sizes of Q 1 and Q 2 are constant, I = U, and M = D. [See online article for color version of this figure.]
Amino acids are the predominant form in which N is supplied for leaf growth in grasses, and incorporation in new leaf tissue occurs mainly in the leaf growth zone (Gastal and Nelson, 1994; Amiard et al., 2004). This is a heterotrophic piece of tissue that includes the zones of cell division and elongation, is located at the base of the leaf, and is encircled by the sheath of the next older leaf (Volenec and Nelson, 1981; MacAdam et al., 1989; Schnyder et al., 1990; Kavanová et al., 2008). As most N is taken up in the form of nitrate but supplied to the growth zone in the form of amino acids, the path of directly transferred N includes a series of metabolic and transport steps. These include transfer to and loading into the xylem, xylem transport and unloading, reduction and ammonium assimilation, cycling through photorespiratory N pools, amino acid synthesis, loading into the phloem, and transport to the growth zone (Hirel and Lea, 2001; Novitskaya et al., 2002; Stitt et al., 2002; Lalonde et al., 2003; Dechorgnat et al., 2011). The time taken to pass through this sequence is unknown at present, as is the effect of N deficiency on that time. Also, it is not known how much N is contained in, and moving through, the different compartments that supply leaf growth with currently assimilated N.
At the level of mature organs, mainly leaves, there is considerable knowledge about N turnover and redistribution. Much less is known about the fate of the mobilized N and its actual use in sink tissues like the leaf growth zone. The processes in mature organs are associated with the maintenance metabolism of proteins, organ senescence, and adjustments in leaf protein levels to decreasing irradiance inside growing canopies when leaves become shaded by overtopping newer ones (Evans, 1993; Vierstra, 1993; Hikosaka et al., 1994; Anten et al., 1995; Hirel et al., 2007; Jansson and Thomas, 2008; Moreau et al., 2012). N mobilization in shaded leaves supports the optimization of photosynthetic N use efficiency at plant and canopy scale (Field, 1983; Evans, 1993; Anten et al., 1995), it reduces the respiratory burden of protein maintenance costs (Dewar et al., 1998; Amthor, 2000; Cannell and Thornley, 2000), and it provides a mechanism for the conservation of the most frequently growth-limiting nutrient (Aerts, 1996). Mobilization of N involves protein turnover and net degradation (Huffaker and Peterson, 1974), redistribution in the form of amino acids (Simpson and Dalling, 1981; Simpson et al., 1983; Hörtensteiner and Feller, 2002), and (at least) some of the mobilized N is supplied to new leaf growth (Lattanzi et al., 2005).
N fertilizer supply has multiple direct and indirect effects on plant N metabolism (Stitt et al., 2002; Schlüter et al., 2012). In particular, it modifies the N content of newly produced leaves, leaf longevity/senescence, and the dynamics of light distribution inside expanding canopies (Evans, 1983, 1989; Lötscher et al., 2003; Moreau et al., 2012). Thus, N fertilization influences the availability of recyclable N. At the same time, it augments the availability of directly transferable N to leaf growth. The net effect of these factors on the importance of mobilized versus directly transferred N substrate for leaf growth is not known. Also, it is unknown how N fertilization influences the functional characteristics of the N supply system, such as the size and turnover of its component pools.
The assessment of the importance of directly transferred versus mobilized N for leaf growth requires studies at the sink end of the system (i.e. investigations of the N import flux into the leaf growth zone). Directly transferred N and mobilized N can be distinguished on the basis of their residence time in the plant, the time between uptake from the environment and import into the leaf growth zone: direct transfer involves a short residence time (fast transfer), whereas mobilized N resides much longer in the plant before it is delivered to the growth zone (slow transfer; De Visser et al., 1997; Lattanzi et al., 2005). Such studies require dynamic labeling of the N taken up by the plant (Schnyder and de Visser, 1999) and monitoring of the rate and isotopic composition/label content of N import into the leaf growth zone (Lattanzi et al., 2005). For grass plants in a physiological steady state, N import and the isotopic composition of the imported N are calculated from the leaf elongation rate and the lineal density of N in newly formed tissue (Fig. 1A; Lattanzi et al., 2004) and the change of tracer content in the leaf growth zone and recently produced leaf tissue over time (Lattanzi et al., 2005). Such data reveal the temporal change of the fraction of labeled N in the N import flux (f lab I), which then can be used to characterize the N supply system of leaf growth via compartmental modeling. So far, there is only one study that has partially characterized this system (Lattanzi et al., 2005): this work was conducted with a C3 grass, perennial ryegrass (Lolium perenne), and a C4 grass, Paspalum dilatatum, growing in mixed stands and indicated that two interconnected N pools supplied the leaf growth zone in both species: a “substrate pool” (Q 1), which provided a direct route for newly absorbed and assimilated N import into the leaf growth zone (directly transferred N), and a mobilizing “store” (Q 2), which supplied N to the leaf growth zone via the substrate pool (Fig. 1C). The relative contribution of mobilization from the store was least important in the fast-growing, dominant individuals and most important in subordinate, shaded individuals. That work did not address the role of N deficiency, and the limited short-term resolution of the study (labeling intervals of 24 h or greater) precluded an analysis of the fast-moving parts of the system.
Accordingly, this work addresses the following questions. How does N deficiency influence the substrate supply system of the leaf growth sink in terms of the number, size, and turnover (half-life) of its kinetically distinct pools? How does N deficiency affect the relationship between directly transferred and mobilized N for leaf growth? And what additional insight on the compartmental structure of the supply system is obtained when the short-term resolution of the analysis is increased by 1 order of magnitude? The work was performed with vegetative plants of perennial ryegrass grown in constant conditions with either a low (1.0 mm; termed low N) or high (7.5 mm; high N) nitrate concentration in the nutrient solution. In both treatments, a large number of plants were dynamically labeled with 15N over a wide range of time intervals (2 h to more than 20 d). The import of total N and 15N tracer into growth zones was estimated at the end of each labeling interval. Tracer data were analyzed with compartmental models following principles detailed by Lattanzi et al. (2005, 2012) and Lehmeier et al. (2008) to address the specific questions. Previous articles reported on root and shoot respiration (Lehmeier et al., 2010) and cell division and expansion in leaf growth zones (Kavanová et al., 2008) in the same experiment.
RESULTS
Tiller and Leaf Growth Parameters
Plants were labeled and sampled when tillers (Table I) and plants (Lehmeier et al., 2010) had a similar carbon mass in both treatments. The average plant age at harvest was 38 d in high N and 60 d in low N (see “Materials and Methods”) due to the slower growth rate of the N-deficient plants (Lehmeier et al., 2010). Sampling at similar plant and tiller masses avoided problems of ontogenetic allometry on treatment comparison (Grimoldi et al., 2005; Kavanová et al., 2006, 2008).
Leaf elongation rate of the most actively expanding leaf of mature tillers, carbon and N mass of tillers and leaf growth zones, lineal density of N in recently produced tissue, and N import into the growth zone
Plants were grown with either 1.0 mm nitrate (low N) or 7.5 mm nitrate (high N) in the nutrient solution. Values are means ± sd. Asterisks denote significant differences between treatments based on Student’s t test (P ≤ 0.05).
| Parameter | Low N | High N | P |
|---|---|---|---|
| Leaf elongation rate (mm h−1) | 0.87 ± 0.24 | 1.62 ± 0.22 | * |
| Carbon mass per tiller (mg) | 66 ± 3 | 69 ± 2 | * |
| Carbon mass per growth zone (mg) | 2.1 ± 0.4 | 2.7 ± 0.4 | * |
| N mass per tiller (µg) | 1,424 ± 40 | 3,111 ± 19 | * |
| N mass per growth zone (µg) | 110 ± 30 | 230 ± 40 | * |
| Lineal density of N in recently produced tissue (µg mm−1) | 1.59 ± 0.28 | 2.51 ± 0.39 | * |
| N import (µg h−1) | 1.38 ± 0.31 | 4.07 ± 0.69 | * |
N deficiency had typical effects on tiller and growth zone parameters (Table I): when compared with high N, low N reduced the leaf elongation rate by 46%, the N mass of the growth zones by 52%, and that of tillers by 54%. The reductions in N mass resulted mainly from decreases in N concentration. Thus, low N reduced the N content (μg g−1 dry mass) of the leaf growth zone by 39% and that of tillers by 52% (data not shown). The reduced N content and mass were associated with a 66% reduction of N import into the leaf growth zone at low N relative to high N (Table I).
The above relationships were nearly steady in both treatments. Thus, leaf elongation rate, lineal density of N in recently produced tissue (Supplemental Figs. S1 and S2), and N content of the growth zone (data not shown) were practically constant during the experiment. Along with other evidence (see “Materials and Methods”; Kavanová et al., 2008; Lehmeier et al., 2010), these relationships indicated that the steady-state requirements for compartmental analysis were approximated well at the time scale of several days in both treatments.
The Fraction of Labeled N in the Leaf Growth Zone and in the Recently Produced Tissue
First tracer was detected in leaf growth zone biomass after a certain delay following the administration of tracer. The delay was longer in N-deficient plants (approximately 1 h at high N and 2 h at low N; Fig. 2A). Thereafter, growth zone N was continuously exchanged by tracer. This exchange occurred at a slower rate in N-deficient plants: growth zone N was half-labeled after 5.5 d at low N but already after 3.5 d at high N (Fig. 2B).
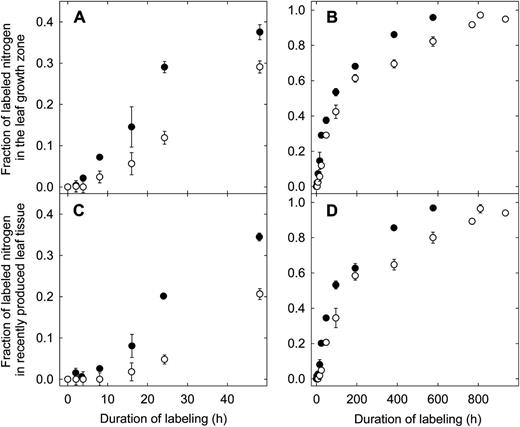
Fraction of labeled N in the leaf growth zone (A and B) and in recently produced leaf tissue (C and D) of perennial ryegrass during dynamic 15N labeling. Plants were grown with either 1.0 mm nitrate (low N; white circles) or 7.5 mm nitrate (high N; black circles) in the nutrient solution. A and C expand the first 50 h of labeling. Each value is the mean of four replicate plants ± se.
In recently produced tissue (i.e. tissue that had just left the growth zone; Fig. 1), the time course of tracer incorporation showed very similar patterns as in growth zones (Fig. 2, C and D), except that tracer was detected a little later (Fig. 2, C and D) and the degree of labeling at a given time was, on average, about 3% lower than in the growth zone (Fig. 2). This phenomenon was the same in both treatments and resulted naturally from the mechanism of N incorporation. N is mostly incorporated in cells in the lower half of the growth zone (Gastal and Nelson, 1994) and arrives in the recently produced tissue only after a lag, the time required to move from the growth zone to the recently produced tissue zone (for a discussion of the kinematics of tissue/cell expansion and displacement in the leaf growth zone of perennial ryegrass, see Schnyder et al., 1990). This mechanism implies that, at any point in time, the total N in the recently produced tissue consisted to a greater proportion of older N that was incorporated at an earlier developmental stage. The fractions of labeled N in the biomass of the leaf growth zone and recently produced tissue were used to calculate f lab I (Fig. 1; see “Materials and Methods”).
The Fraction of Labeled N in the Substrate Flux into the Leaf Growth Zone
In both treatments, there was a certain delay until tracer was detected in N imported into the growth zone (Fig. 3A). Then, f lab I increased in two distinct phases: first very rapidly, then slowly. Again, these phases were evident in both treatments.

The f lab I of leaf growth zones of perennial ryegrass during dynamic 15N labeling. Plants were grown with an N supply of either 1.0 mm nitrate (low N; white circles) or 7.5 mm nitrate (high N; black circles) in the nutrient solution. A expands the first 50 h of labeling. Solid lines give the fit of the two-pool model (Fig. 1C) to the tracer time courses and reflects the exchange kinetics of the substrate pool. The modeled labeling kinetics of the store is given by the short dashed line (high N) and the long dashed line (low N).
The delay for first tracer detection was longer in the N-deficient plants (approximately 2 h after the start of labeling at low N and 1 h at high N), and the rate of increase of f lab I was slower in both of the kinetically distinct phases of the f lab I time course (Fig. 3). At low N, the first phase lasted until about 16 h from the start of labeling. At that time, almost 50% of the imported N was labeled. At high N, the transition to this second phase occurred much faster (at about 8-h labeling duration) and at a higher degree of labeling of the imported N (f lab I was approximately 60% at 8 h). Also, the increase of f lab I in the second phase was faster than at low N (Fig. 3).
Compartmental Modeling
The above features of the tracer time course of f lab I (Fig. 3) reflect the functional properties of the N pool system feeding the leaf growth zone. These features were analyzed by compartmental modeling. This provided estimates of the number and size of kinetically distinct pools, the turnover of each pool, and their contribution to new leaf growth.
The two phases in f lab I (Fig. 3) revealed the presence of two kinetically distinct pools. This feature was observed in both treatments and was supported by statistical evidence: a one-pool model was unable to fit the tracer data, and models with more than two pools did not significantly improve the fits (see “Materials and Methods”). Thus, compartmental models with more than two pools were not supported by the experimental data and, hence, were rejected.
The model in Figure 1C was chosen over other (topologically different) two-pool models on the basis of statistical evidence (none of the other two-pool models was statistically superior and most were inferior; Schnyder et al., 2012) and biological realism in describing the N supply system of the leaf growth zone. Interestingly and incidentally, the model in Figure 1C was the only two-pool model that predicted a half-life of the store that matched the reported half-life of leaf and root proteins (see “Discussion”). In this model, all N supplying the growth zone first enters a substrate pool (Q 1) that exchanges with a store (Q 2) and conveys the N to the leaf growth zone. All N that moves through the store is defined as mobilized N. This two-pool model design provided accurate fits to the f lab I data of both treatments (r 2 > 0.99). The model included a delay that explained the lag between first tracer contact with roots (time 0 in Fig. 3) and the time of first tracer arrival in the growth zone. The model-optimized value of this delay was 2.2 h at low N and 0.9 h at high N (Table II).
Optimized parameters of a two-pool compartmental model of N sources supplying leaf growth applied to the tracer time courses of the substrate fluxes into the leaf growth zone of perennial ryegrass plants (Fig. 3), grown with either a low (1.0 mm) or a high (7.5 mm) nitrate concentration in the nutrient solution
The equations describing the model in terms of pool sizes, fluxes, and rate constants are given in “Materials and Methods.” Values ± 95% confidence intervals were calculated from model-optimized rate constants (and the N import flux for the size estimation).
The equations describing the model in terms of pool sizes, fluxes, and rate constants are given in “Materials and Methods.” Values ± 95% confidence intervals were calculated from model-optimized rate constants (and the N import flux for the size estimation).
Effects of N Deficiency on Pool Characteristics
Except for system structure/topology, N deficiency had effects on almost all functional characteristics of the N substrate supply system of leaf growth zones. It doubled the size of the substrate pool (Q 1) and decreased the size of the store (Q 2) by 38% (Table II). The total substrate supply system (Q 1 + Q 2) comprised 23% of total tiller N at low N and 17% at high N (Tables I and II). In both treatments, more than 95% of that quantity was contained in the store.
N fertilizer supply also affected the turnover of the pools: the half-life of the substrate pool (Q 1) was 3.2 h at low N and 0.6 h at high N; the half-life of the store (Q 2) was 7.2 d at low N and 5.3 d at high N (Table II).
Conversely, N deficiency had no significant effect on the contribution of mobilized relative to directly transferred N to the growth zone. In both treatments, mobilized N contributed about 45% of the total N import while directly transferred N contributed about 55% (Table II).
DISCUSSION
This work reveals strong effects of N deficiency on several functional characteristics of the pool system supplying N for leaf growth. N stress lengthened the delay between the uptake of N and its first arrival in the leaf growth zone, slowed the turnover and increased the size of the substrate pool (Q 1), which conveyed N to the leaf growth zone, and decreased the turnover rate and the size of the store (Q 2). By contrast, N deficiency had no significant effect on the relative contribution of the store to leaf growth, which was large at both high and low N (approximately 45% of total N import). Notably, the same two-pool model provided an accurate description of the compartmental structure/topology of the system supplying N for leaf growth at both low N and high N. The model topology was consistent with that proposed by Lattanzi et al. (2005), except that it also contained a discrete delay between N uptake and first import in the growth zone. This work also showed a much faster turnover time for the substrate pool (Q 1). The latter features were revealed and forced by the much higher temporal resolution of the model input data (f lab I) in this analysis.
Delay and Substrate Pool
In this experiment, all N from the nutrient solution was absorbed as nitrate. But it is known that N enters the growth zone essentially in the form of amino acids (Gastal and Nelson, 1994; Amiard et al., 2004). Hence, the delay between tracer uptake and arrival in the growth zone probably reflected the minimum time required for nitrate uptake, xylem transport, the metabolic steps associated with assimilation and amino acid synthesis, and phloem transport to the growth zone. Remarkably, these processes did not cause further compartmental differentiation; all steps were adequately described by one delay and one well-mixed pool (Q 1), which also received the N from the store (Q 2). We see three possible explanations for this result. First, this experiment missed temporal resolution shorter than 2 h (and Lattanzi et al. [2005] did not resolve at less than 24 h). So, processes at very short time scales were not resolved. Second, vacuolar storage of nitrate and amino acids (Martinoia et al., 1981; Fentem et al., 1983; Yoneyama et al., 1987; Britto and Kronzucker, 2001), which have intermediate kinetics (Devienne et al., 1994), may have been relatively unimportant because plant growth was still somewhat N limited even at high N, obviating a requirement for significant short-term storage (Mattsson et al., 1991). N limitation at both high and low N was suggested by the N nutrition index (Gastal and Lemaire, 2002; data not shown) and high nonstructural carbohydrate contents of the same plants as observed by Lehmeier et al. (2010) in studies of respiratory metabolism and by Lattanzi et al. (2012) in investigations of Suc and fructan metabolism of mature leaves. Third, in a serial arrangement of transport and metabolic events, the tracer kinetics of the end product (i.e. the amino acids entering the leaf growth zone) is determined largely by the kinetics of the slowest step in the series (Schnyder et al., 2012). As pool size and turnover are intrinsically related, the slowest step also contributes most to the total size estimate of the substrate pool (Q 1).
The substrate pool (Q 1) was small in both treatments: its size corresponded to 11% and 3% of total growth zone N mass, or 0.9% and 0.2% of total tiller N mass, at low N and high N, respectively. Given the N import fluxes reported in Table I, the amount of N in the substrate pool was equivalent to the total amount of N imported into the leaf growth zone in 9 h at low N and in 1.4 h at high N. The small size and short half-life also support the view that the substrate pool did not include a significant storage function. The smaller size and shorter half-life of the substrate pool at high N were associated with a three times higher flux of N through this pool (the N flux through the substrate pool equals N import into the growth zone; Fig. 1). This may be taken to indicate that the smaller size and shorter half-life of the substrate pool at high N were connected with the higher sink strength of the leaf growth zone at high N, the latter resulting from a stimulation of cell production and expansion and related metabolic activities (Volenec and Nelson, 1983; MacAdam et al., 1989; Kavanová et al., 2008; Sugiyama and Gotoh, 2010). The relative sizes of the different elements of the substrate pool, particularly the rate-limiting step, and the regulatory mechanisms that respond to N fertilization are unknown at present. Possibly, the rate limitation can be identified using nitrate assimilation or allocation mutants (Geelen et al., 2000; Monachello et al., 2009) and by analyzing the tracer kinetics of biochemical intermediates along the path from nitrate uptake to amino acid allocation to the growth zone.
The Store
The considerable size (approximately 20% of total tiller N) and the characteristic half-life (5–7 d) of the store (Q 2) dictates the conclusion that it was made up largely, if not completely, of proteins that release N in the form of amino acids during their turnover and degradation (Buchanan-Wollaston, 1997; Irving et al., 2010; Masclaux-Daubresse et al., 2010). It may seem surprising that the data and modeling indicate the existence of one well-mixed pool with continuous turnover, given the variety of proteins in several cell types of mature and senescing plant tissues as possible sources of stored N (Hörtensteiner and Feller, 2002; Bassham, 2007; Diaz et al., 2008; Feller et al., 2008; Ishida et al., 2008; Martínez et al., 2008; Wada et al., 2009; Kant et al., 2011). Yet, the half-life estimates for the store in this work agree well with work on the half-life of total protein in leaf sections of different ages in barley (Hordeum vulgare) primary leaves (4–9 d; Dungey and Davies, 1982) and with that of Rubisco, the main leaf protein, and total protein in maize (Zea mays) growing in light/dark cycles or continuous light (6–8 d; Simpson et al., 1981). Moreover, Scheurwater et al. (2000) report a similar half-life of between 4 and 6 d for root proteins in two C3 grasses.
In principle, the physical distribution of the store (Q 2) within the plant (i.e. the contributions of leaves and roots to the store) is unknown. Yet, based on the facts that most plant N was contained in leaves (75% of all plant N at low N and 82% at high N) and that protein turnover in leaves and roots is similar (Simpson et al., 1981; Dungey and Davies, 1982; Scheurwater et al., 2000), it is likely that the bulk of the store feeding leaf growth was located in mature and senescing leaves.
N deficiency increased the store’s half-life by 37%; in other words, it slowed its turnover rate. This result may reflect the effect of light gradients on N (re)distribution in canopies (Hikosaka et al., 1994). High-N plants were exposed to a more dynamically changing radiation environment: at 5 weeks after germination, the leaf area index was 2.5 at high N but 0.9 at low N. Thus, within a given position in the canopy, light attenuation occurred more rapidly at high N, likely accelerating N mobilization and redistribution from shaded older leaves to growing leaves.
In both treatments, the size of the store (Q 2) was very large in comparison with the total quantity of N that was imported into the growth zone each day: at low N and high N, the store contained the equivalent of approximately 10 and five times, respectively, the total quantity of N imported into the growth zone per day. Considering only the import of mobilized N into the growth zone, the store contained the equivalent of approximately 20 and 13 times the quantity used daily at low N and high N. A critical role of N stores in supporting leaf regrowth following defoliation of grasses and legumes has been established previously in several quantitative 15N tracer studies (Phillips et al., 1983; Avice et al., 1996; Volenec et al., 1996), but the constitutive role of N turnover supplying mobilized N to leaf growth during undisturbed development, as shown here, has not been assessed, except for evidence by Lattanzi et al. (2005). Our data here clearly demonstrate that constitutive N turnover and linked redistribution/mobilization also supply large amounts of mobilized N for undisturbed leaf growth in both N-stressed and nonstressed plants and proceed at rates similar to those induced in roots and stubble tissue following defoliation (Volenec et al., 1996).
With four leaves per tiller and all tiller N in leaves, the size of the store (Q 2) corresponded to 90% of the average N content of a leaf in the mature tiller at low N. In comparison, the size of the store corresponded to only 66% of the average N content of a leaf in mature tillers at high N. As resorption efficiency of leaf N is not influenced by N fertilization (Aerts, 1996), the above data indicate that a smaller proportion of the mobilized N was used for leaf growth in the same tiller at high N; hence, some of the mobilized N may have been available for other sinks, such as new tiller production, when plants grew at high N. Indeed, tiller production was significantly faster in high-N plants.
CONCLUSION
This study presents a new comprehensive compartmental analysis of the source-sink system supplying N for leaf growth in vegetative grass plants growing in conditions of N stress and near sufficiency. The work shows that N stress has strong effects on almost all functional features of the system, including the size and turnover of the component pools, and the delay between N uptake from the nutrient solution and arrival in the leaf growth zone. Notably, however, the N status of plants had no significant effect on (1) the relative importance of storage-derived (i.e. mobilized) N for leaf growth and (2) the structure/topology of the compartmental system that supplies N substrate for leaf growth. The close similarity of this system to that presented by Lattanzi et al. (2005) for a C3 grass and a C4 grass growing in competition in cool or warm conditions suggests that the compartmental system is not unique for a particular environmental scenario but has some more general validity that could be useful (e.g. for mechanistic modeling of N allocation during the vegetative growth of grasses and cereals). The work demonstrates directly the quantitative importance of constitutive N turnover in mature plant tissue as a source of N substrate for leaf growth under conditions of low and high N supply, and it shows that stores/constitutive N turnover provide nearly half of all N used in the leaf growth zone irrespective of the N status of the plant.
MATERIALS AND METHODS
Suitability of the Experimental System
C3 grasses such as perennial ryegrass (Lolium perenne) during vegetative growth provide a very useful model for studying the N supply system of leaf growth: (1) they conform to the succeeding type of leaf production, meaning that new leaf production on mature tillers is balanced by the senescence of older leaves, providing continuous leaf turnover and a constant leaf number; (2) the growth rate of the most actively elongating leaf and associated N import and use are nearly constant over an extended period of time when plants are grown in a constant environment; (3) most N incorporation occurs inside the leaf growth zone; and (4) N import (via the phloem) occurs mostly in the form of amino acids (Schnyder et al., 1990; Gastal and Nelson, 1994; Amiard et al., 2004; Lattanzi et al., 2004; Hikosaka, 2005; Schleip et al., 2013). These features provide for nearly steady-state conditions at the time scale of several days, suitable for the assessment of N import into growth zones (Lattanzi et al., 2004), execution of quantitative labeling experiments (De Visser et al., 1997), determination of labeled and nonlabeled N import into leaf growth zones, and determination of mechanistic features of the N supply system of leaf growth via compartmental modeling of the tracer data (Fig. 1; Lattanzi et al., 2005).
Plant Material and Growth Conditions
The experiment was performed in four identical, CO2-controlled growth chambers that formed part of the 13CO2/12CO2 labeling and gas-exchange mesocosms described by Schnyder et al. (2003). Individual plants of perennial ryegrass were grown from seeds in plastic pots (350 mm in height, 50 mm in diameter) filled with 0.8 kg of washed quartz sand (0.3- to 0.8-mm grain size). The bottom of each pot had a small hole (7 mm in diameter) covered with a fine nylon net. The pots were placed in plastic containers (760 × 560 × 320 mm) at a density of 378 m−2. Two containers were placed in each of four growth chambers (Conviron E15; Conviron). Except for nutrient supply (see below), the growth conditions were the same and constant in all chambers: all plants grew in continuous light, supplied by cool-white fluorescent tubes, with a photosynthetic photon flux density of 275 µmol m−2 s−1 at canopy height. Relative humidity was controlled at 85%, CO2 concentration at 360 µL L−1 in the chamber atmosphere, and temperature at 20°C at the level of the leaf growth zone. As a result, all plant growth and state parameters in the two replicate chambers of a given N treatment were statistically indistinguishable (Lehmeier et al., 2010), except for 15N composition. Previous work has also shown that the four growth chambers of the mesocosm system provide highly reproducible conditions of plant growth and CO2 exchange (Schnyder et al., 2003).
Every 3 h, a modified Hoagland nutrient solution was pumped into the containers for about 10 min, submerging the lower 200 mm of the pots. Then, the nutrient solution was allowed to drain off. Stands in two growth chambers received a nutrient solution with 7.5 mm nitrate as the sole N source (high N). This nutrient solution included 2.5 mm Ca(NO3)2, 2.5 mm KNO3, 1.0 mm MgSO4, 0.18 mm KH2PO4, 0.21 mm K2HPO4, 0.5 mm NaCl, 0.4 mm KCl, 0.4 mm CaCl2, 125 µm iron-EDTA, 46 µm H3BO3, 9 µm MnSO4, 1 µm ZnSO4, 0.3 µm CuSO4, and 0.1 µm Na2MoO4 (Lehmeier et al., 2010). Stands in the other two chambers received a nutrient solution with 1.0 mm nitrate (low N), including 1 mm KNO3, 1 mm MgSO4, 0.18 mm KH2PO4, 0.21 mm K2HPO4, 0.5 mm NaCl, 0.7 mm K2SO4, 2 mm CaCl2, and the same levels of micronutrients as high-N plants. All nutrient solutions were periodically checked for N concentration and frequently renewed. Stands were periodically flushed with demineralized water to prevent salt accumulation.
Leaf Elongation Rate
Leaf elongation rate (mm h−1) was measured on a subset of tillers that matched the developmental stage and size of sampled tillers. These tillers had at least two fully expanded leaves (termed “mature tillers”) and often presented younger (i.e. daughter) tillers. Leaf elongation rates of three plants per chamber were measured on the most rapidly expanding leaf, when leaf blade length was between 40% and 60% of final length and the elongation rate was nearly constant (Schnyder et al., 1990).
15NO3 −/14NO3 − Labeling
In one replicate chamber of each N fertilizer level, the nutrient solution contained 1.0 atom % nitrate-15N. The other replicate chamber received nitrate-15N at natural abundance [0.37 atom %; with atom % 15N = 15N/(14N + 15N) × 100]. These conditions prevailed throughout the experiment. For labeling, randomly selected individual pots were swapped between growth chambers receiving different atom % 15N-nitrate in their nutrient solution. Thus, plants growing in the chamber with 1.0 atom % 15N were transferred to the chamber with 0.37 atom % 15N and vice versa. Immediately before placement in the “isotopically new” chamber, every pot was well rinsed with the new nutrient solution to prevent any uptake of “old” nutrient solution.
Plants in high N were labeled for 2, 4, 8, 16, or 24 h or 2, 4, 8, 16, or 24 d. Low-N plants were labeled for the same intervals as well as for 32, 34, or 39 d. Four replicate plants were used for each labeling interval. Labeling began when plants had formed three mature tillers, 5 weeks after germination in high N and 8 weeks after germination in low N. To minimize possible size- and development-related effects on plant N relations, labeling periods were scheduled in such a way that variation in the mean age of plants at sampling was minimized.
Sampling
Plants were removed from the stands at the end of the target labeling durations. The average plant age at harvest was 38 d in high N and 60 d in low N. In each plant, the leaf growth zone and a piece of immediately adjacent recently produced leaf tissue (RPT) were excised from the youngest, most rapidly growing leaf of all mature tillers of the plant. The growth zone was defined as the leaf segment where the bulk of growth-associated N deposition occurred (Lattanzi et al., 2004). This was determined in preliminary investigations that demonstrated that N deposition stopped at approximately two-thirds of the enclosed part of the leaf. Kavanová et al. (2008) analyzed a subset of tillers from the same plants and found that N treatments did not affect the relationship between tiller size (as defined by the length of the youngest fully expanded leaf sheath) and the length of the cell division and elongation zone. As in Lattanzi et al. (2005), the recently produced tissue had a length of 3 mm in plants labeled for less than 24 h and 5 mm in plants labeled for longer periods. Sampled tillers held between three and five leaves, and average leaf number per tiller did not change during sampling. On average, one replicate sample of leaf growth zones or recently produced tissue included the tissue of nine mature tillers. Sampling was restricted to leaves in which the growing blade had between 40% and 60% of its final length (the same as leaves used for leaf elongation rate measurements), as previous work had established that during this phase, growth parameters (including leaf elongation rate, lamina width, and thickness) varied little, both within an individual leaf and between successive leaves (Kavanová et al., 2008; Parent et al., 2009, and refs. therein). Samples were weighed, frozen in liquid N, freeze dried for 72 h at −80°C, weighed again, ground to flour mesh quality with a ball mill, and stored at −30°C until elemental and isotopic analysis. In addition to the labeled plants, each of the four chambers contained randomly distributed “labeling control” plants that were grown continuously with the same isotopic composition of the nitrate-N. These controls were harvested in 4- to 5-d intervals and processed in the same way as labeled plants. The isotopic signatures of these control plant samples served as end members in the mixing model for the assessment of prelabeling and postlabeling N contents in the growth zone and recently produced tissue of labeled plants (Eq. 1).
Elemental and Isotopic Analysis
The N elemental content (mg N g−1 dry matter) and isotopic composition (atom % 15N) of sample aliquots (0.70 ± 0.05 mg dry matter) were determined by combustion in an elemental analyzer (NA 1110; Carlo Erba Instruments) that was interfaced to a continuous-flow isotope ratio mass spectrometer (Delta Plus; Finnigan MAT). Each sample was measured against a laboratory working standard gas (N2), which was previously calibrated against International Atomic Energy Agency secondary standards. Fine ground wheat (Triticum aestivum) flour served as an internal laboratory standard and was run regularly every 10th sample to determine the precision of the isotope analysis; the overall sd in 15N content for repeated standard measurements was 0.004 atom %.
The Fraction of Tracer in a Sample

N Import and Fraction of Tracer in the Imported N


Estimation of f lab I over a 2-h interval required the estimation of (1) f lab E over the same time interval and (2) f lab G at the lower (t i-2) and upper (t i) ends of the time interval. I was calculated by Equation 2, and G was a measured parameter.
For the estimation of f lab E, spline functions were fitted to the fraction of labeled N in recently produced tissue, and f lab E was calculated as the numerical integral of spline functions in 2-h intervals (f lab E = ∫ f lab RPT). Similarly, spline functions fitted to the time course of f lab G were used to estimate values at t i-2 and t i.
Compartmental Analysis of Tracer Time Courses
The time course of the fraction of tracer in N import into the leaf growth zone (f lab I) carries information about the number, size, kinetic properties (half-lives), and fractional contribution of individual substrate pools supplying N to the import flux. This information was extracted with compartmental analysis. In doing so, we set up and tested a variety of compartmental models that differed in the number of pools and in network topology (Schnyder et al., 2012), similar to Lehmeier et al. (2008) and Lattanzi et al. (2012).
The different models were implemented in the software modelMaker (Cherwell Scientific) and tested in terms of their capacity to simulate the time courses of f lab I. This was done by optimizing all the models’ rate constants in order to minimize the sum of the squared differences between measured and model-predicted f lab I. In addition, sensitivity analysis as described by Lehmeier et al. (2008) was consulted (1) to ensure that global, not local, best fits were detected during the optimization runs and (2) to identify redundant model parameters (Cram and Laties, 1974; Cheeseman, 1986). Furthermore, we compared model statistics via extra-sum-of-squares F tests (Motulsky and Christopoulos, 2004). These procedures served to identify the simplest, biologically meaningful model that provided a nonbiased representation of the data.


In the steady state, pool sizes are constant with time and given as


The optimized rate constants were used to derive a pool’s half-life as t 1/2(Q x) = ln(2)/k x, with k x the sum of all rate constants leaving the pool Q x. The fractional contribution of directly transferred N, that is N from current uptake and assimilation that is directly allocated to the leaf growth zone, thus not visiting Q 2, was assessed as k 10/(k 10 + k 12). The contribution of mobilized N that visited Q 2 at least once was calculated as k 12/(k 10 + k 12). The sum of the contributions of directly transferred and mobilized N equals 1.
Assumptions of Compartmental Analysis
Compartmental analysis rests on the assumptions that (1) fluxes obey first-order kinetics and pools are homogenous and well mixed, (2) isotope discrimination processes can be neglected, and (3) the system is in a physiological steady state.
The practical validity of assumption 1 has been supported repeatedly in studies of N fluxes in plants (Kronzucker et al., 1999a, 1999b; Lattanzi et al., 2005; Irving and Robinson, 2006) and other quantitative tracer studies (Moorby and Jarman, 1975; Moing et al., 1992). Assumption 2 was noncritical, since N isotope fractionation during uptake, transport, and metabolism is very small relative to the isotopic enrichment of N in this labeling experiment (De Visser et al., 1997). Assumption 3 was valid in the short term (first few days), when process and state variables of the system were approximately constant. Thus, growth conditions with continuous light, constant temperature and CO2 concentration, and frequent supply of water and nutrients virtually eliminated any environmental variability and associated external influence on plant growth and metabolism. These conditions gave rise to nearly constant shoot- and root-specific growth, N uptake, and respiration rates during the experimental period in both treatments (Lehmeier et al., 2010). However, over longer intervals, plant growth (relative growth rate was 0.038 d−1 at low N and 0.078 d−1 at high N; Lehmeier et al., 2010) caused an increasing divergence from steady state with time. We tested the effect of this factor on modeling results by restricting the compartmental analysis to the first 4 d of labeling. The differences between parameter estimates for the restricted and the full analyses differed by less than 10% for all parameters, except for the half-life of the store at low N, which was reduced by 14% (but was not significantly different from the estimate of the full analysis).
Supplemental Data
The following materials are available in the online version of this article.
Supplemental Figure S1. Elongation rate of the most rapidly growing leaf of perennial ryegrass grown with an N supply of 1.0 mm (low N) or 7.5 mm (high N).
Supplemental Figure S2. Lineal density of N in recently produced tissue of the most rapidly growing leaf of perennial ryegrass grown with an N supply of 1.0 mm (low N) or 7.5 mm (high N).
ACKNOWLEDGMENTS
We thank the members of the Lehrstuhl für Grünlandlehre, Technische Universität München, and UMR-INRA-UCBN 950 EVA Écophysiologie Végétale, Agronomie et Nutritions, University of Caen, for assistance during sampling, Fernando Lattanzi for advice with compartmental modeling and discussion of an early draft of this work, and Ulrike Ostler (née Gamnitzer) for discussions of statistical issues in compartmental modeling.
Glossary
- N
nitrogen
- f lab I
fraction of labeled nitrogen in the nitrogen import flux
- RPT
recently produced leaf tissue
LITERATURE CITED
Hirel B, Lea PJ (2001) Ammonia assimilation. In PJ Lea, JF Morot-Gaudry, eds, Plant Nitrogen. Springer-Verlag, Berlin, pp 79–99
Motulsky H, Christopoulos A (2004) Fitting Models to Biological Data Using Linear and Nonlinear Regression. Oxford University Press, New York
Schnyder H, Ostler U, Lehmeier CA, Wild M, Morvan-Bertrand A, Schäufele R, Lattanzi FA (2012) Tracing carbon fluxes: resolving complexity using isotopes. In R Matyssek, H Schnyder, JC Munch, W Osswald, H Pretzsch, eds, Growth and Defence in Plants: Resource Allocation at Multiple Scales. Springer, Berlin, pp 157–173
Author notes
This work was supported by the Deutsche Forschungsgemeinschaft (grant no. SFB 607).
Present address: Department of Animal and Plant Sciences, University of Sheffield, Sheffield S10 2TN, UK.
Present address: Bavarian State Research Center for Agriculture, Vöttinger Strasse 38, D–85354 Freising, Germany.
Corresponding author; e-mail [email protected].
The author responsible for distribution of materials integral to the findings presented in this article in accordance with the policy described in the Instructions for Authors (www.plantphysiol.org) is: Hans Schnyder ([email protected]).
Some figures in this article are displayed in color online but in black and white in the print edition.
The online version of this article contains Web-only data.
Articles can be viewed online without a subscription.
