


Abstract
Plant nucleotide-binding leucine-rich repeat (NB-LRR) proteins serve as intracellular sensors to detect pathogen effectors and trigger immune responses. Transcription of the NB-LRR-encoding Resistance (R) genes needs to be tightly controlled to avoid inappropriate defense activation. How the expression of the NB-LRR R genes is regulated is poorly understood. The Arabidopsis (Arabidopsis thaliana) suppressor of npr1-1, constitutive 1 (snc1) mutant carries a gain-of-function mutation in a Toll/Interleukin1 receptor-like (TIR)-NB-LRR-encoding gene, resulting in the constitutive activation of plant defense responses. A snc1 suppressor screen identified modifier of snc1,9 (mos9), which partially suppresses the autoimmune phenotypes of snc1. Positional cloning revealed that MOS9 encodes a plant-specific protein of unknown function. Expression analysis showed that MOS9 is required for the full expression of TIR-NB-LRR protein-encoding RECOGNITION OF PERONOSPORA PARASITICA 4 (RPP4) and SNC1, both of which reside in the RPP4 cluster. Coimmunoprecipitation and mass spectrometry analyses revealed that MOS9 associates with the Set1 class lysine 4 of histone 3 (H3K4) methyltransferase Arabidopsis Trithorax-Related7 (ATXR7). Like MOS9, ATXR7 is also required for the full expression of SNC1 and the autoimmune phenotypes in the snc1 mutant. In atxr7 mutant plants, the expression of RPP4 is similarly reduced, and resistance against Hyaloperonospora arabidopsidis Emwa1 is compromised. Consistent with the attenuated expression of SNC1 and RPP4, trimethylated H3K4 marks are reduced around the promoters of SNC1 and RPP4 in mos9 plants. Our data suggest that MOS9 functions together with ATXR7 to regulate the expression of SNC1 and RPP4 through H3K4 methylation, which plays an important role in fine-tuning their transcription levels and functions in plant defense.
Plants are constantly threatened by pathogens, yet they are healthy most of the time. During their long evolutionary history, plants have evolved elegant mechanisms to fend off pathogen infections. Conceptually, plants possess two layers of innate immunity (Chisholm et al., 2006; Jones and Dangl, 2006). The first layer is dependent on membrane-residing pattern recognition receptors, which recognize conserved pathogen-associated molecular patterns (PAMP; or microbe-associated molecular patterns) to activate defense responses termed PAMP-triggered immunity (PTI; Boller and Felix, 2009). Successful pathogens have evolved effectors to suppress pathogen-associated molecular pattern-triggered immunity to promote pathogen virulence. During the arms race between plants and pathogens, plants have evolved a second layer of immunity that is mediated by Resistance (R) proteins. R proteins can specifically recognize the activities of pathogen effectors and activate effector-triggered immunity (ETI). ETI is a robust defense response that usually results in the induction of the hypersensitive response, a type of localized cell death that may contribute to restriction of pathogen proliferation. Most R proteins have a central nucleotide-binding (NB) domain and C-terminal Leucine-rich repeats (LRRs). These NB-LRR-containing R proteins (NLRs) share structural similarity with animal immune receptors such as Nod proteins, possibly due to convergent evolution (Ausubel, 2005). NB-LRR R proteins can be further grouped into the Toll/Interleukin1 receptor-like (TIR) type or the coiled-coil (CC) type based on their different N termini. Although resistance mediated by plant R proteins is rapid and robust, effectively restricting pathogen growth, the molecular events surrounding R protein activation are largely unknown.
An Arabidopsis (Arabidopsis thaliana) gain-of-function autoimmune mutant suppressor of npr1-1 , constitutive1 (snc1; npr1 stands for nonexpressor of PR gene1) constitutively expresses defense marker Pathogenesis Related (PR) genes and exhibits enhanced disease resistance against the virulent bacterial pathogen Pseudomonas syringae pv. maculicola (Psm) ES4326 and the oomycete pathogen Hyaloperonospora arabidopsidis (Ha) Noco2 (Li et al., 2001). As a consequence, snc1 plants are severely dwarfed. The autoimmune phenotypes in snc1 are caused by a point mutation that results in a Glu to Lys substitution in the linker region between the NB and LRR domains of a TIR-type NB-LRR protein (Zhang et al., 2003). This unique mutation renders the NLR protein more stable, leading to autoimmunity of the mutant plants (Cheng et al., 2011).
To identify components required for TIR-type NLR protein-mediated immunity, forward genetic screens were employed to identify mutants that can suppress the autoimmune phenotypes of snc1. From these modifier of snc1 (MOS) screens, important cellular and molecular processes were found to be critical for R protein-mediated resistance. These include RNA processing, nucleocytoplasmic trafficking, transcriptional reprogramming, and protein modifications (Palma et al., 2005, 2007; Zhang et al., 2005; Zhang and Li, 2005; Goritschnig et al., 2007, 2008; Cheng et al., 2009; Germain et al., 2010; Li et al., 2010b; Zhu et al., 2010; Xu et al., 2011, 2012). The diverse components identified from the MOS screens suggest that NLR activities are regulated at multiple levels to achieve appropriate immune response.
R gene transcription is an early regulatory node in the modulation of NLR activities. The example of SNC1 illustrates the importance and delicacy of transcriptional regulation of R genes. Less than 2-fold increase or decrease in SNC1/snc1 gene expression can dramatically alter the outcome of the immune response. The homozygous snc1 mutant is severely dwarfed, while the heterozygous snc1/SNC1 plant with 50% transcriptional activity of the snc1 allele is morphologically similar to the wild type (Li et al., 2001). Conversely, a duplication of the SNC1 locus in an epiallele of snc1, bal, that leads to a 1-fold increase in the transcriptional activity of SNC1 results in autoimmunity (Yi and Richards, 2009). Adequate R gene transcription is required to mount an appropriate degree of resistance, whereas excessive R gene transcription results in an overaccumulation of R proteins leading to autoimmunity, which is detrimental to development and growth. Although the transcriptional regulation of R genes is a critical step in plant immunity, little is known about the details of the mechanisms controlling this process. Here, we report the identification, characterization, and functional study of mos9. MOS9 is a plant-specific nuclear protein that plays an important role in regulating the expression level of SNC1 and RECOGNITION OF PERONOSPORA PARASITICA 4 (RPP4); both are TIR-type NLR-encoding genes. MOS9 was found to associate with Arabidopsis Trithorax-Related7 (ATXR7), a histone methyltransferase that activates FLOWERING LOCUS C (FLC) expression through trimethylation of the fourth Lys of histone H3 (H3K4me3), close to the start codon of FLC (Tamada et al., 2009). We show that ATXR7 is also required for the regulation of SNC1 and RPP4 expression, suggesting that MOS9 functions together with ATXR7 to regulate the expression of these R genes.
RESULTS
Identification of the mos9 Mutant
The mos9 mutant was identified from a suppressor screen of snc1 single mutant (Zhang and Li, 2005). The size of the mos9 snc1 double mutant plant is much bigger than that of snc1 but still exhibits snc1-like twisted leaves (Fig. 1A). Quantitative reverse transcription-PCR analysis showed that the elevated PR1 and PR2 expression in snc1 is largely reduced by mos9, although not to wild-type levels (Fig. 1, B and C). The free and total salicylic acid (SA) content in mos9 snc1 double mutant plants was 30% lower when compared with that of snc1 plants (Fig. 1, D and E) but still higher than those of the wild type. When mos9 snc1 double mutant plants were challenged with the virulent oomycete pathogen Ha Noco2 or the bacterial pathogen Psm ES4326, they produced more spores and supported more bacterial growth than snc1 plants but not to the level of the wild type (Fig. 1, F and G). Taken together, mos9 partially suppresses all autoimmune phenotypes of snc1.
![Mutation in mos9 partially suppresses the autoimmune phenotypes of snc1. A, Morphology of 4-week-old soil-grown Col-0 wild-type, snc1, and mos9 snc1 plants. B and C, Relative PR1 (B) and PR2 (C) expression in wild-type, snc1, and mos9 snc1 plants. Two-week-old seedlings grown on one-half MS were collected for total RNA extraction and reverse transcribed to obtain cDNA. The cDNA amounts were quantified with real-time PCR as described in Zhang et al. (2003). Bars represent means of three replicates ± sd. D and E, Free (D) and total (E) SA levels in leaves of wild-type, snc1, and mos9 snc1 plants. SA was extracted and measured from 4-week-old soil-grown plants using a previously described procedure (Li et al., 1999). Bars represent means of four replicates ± sd. F, Growth of Ha Noco2 on wild-type, snc1, and mos9 snc1 plants. Two-week-old seedlings were sprayed with Ha Noco2 at a concentration of 100,000 spores mL–1 water. The infection was scored 7 d after inoculation. Bars represent means of four replicates ± sd. G, Psm ES4326 bacterial growth in wild-type, snc1, and mos9 snc1 plants. Leaves were infiltrated with a bacterial suspension at OD600 of 0.0001 (day 0). Bacterial growth was measured 3 d after infiltration (day 3) as previously described (Zhang et al., 2003). Bars represent means of five replicates ± sd. All experiments were repeated at least once with similar results. WT, Wild type. [See online article for color version of this figure.]](https://oup.silverchair-cdn.com/oup/backfile/Content_public/Journal/plphys/162/3/10.1104_pp.113.214551/2/m_plphys_v162_3_1694_f1.jpeg?Expires=1747864958&Signature=Ha7o~B92Ce2A~4A08uFfeNbR4EsttghL1geTDjOSmimoYdjh2C61DooMCuCz686Fxbby2eutmqxofk6Y-4gX98xj2pXlPBToZ44GhsSElnPtpUMbfr-VH9hkr19S5hdShqkbsGKPduorn-Lchm5tmwslKWnv08MrCK~VcjD01RdqOeTQidfdCKYW4cCgTjf4r-ctROJt6q237mfPTXeYBjz7QJiXBAu8-ryegEvQKayUxlmtf1rUgdG9hnIVoZAxLfq3qHxRcfWRUyUgNRdS4p4ghuKvbRbXmyl9B1Dcoy4pc3heHIBILBRapef08pG8OHc8fOTciu7jd8k3TvvrVA__&Key-Pair-Id=APKAIE5G5CRDK6RD3PGA)
Mutation in mos9 partially suppresses the autoimmune phenotypes of snc1. A, Morphology of 4-week-old soil-grown Col-0 wild-type, snc1, and mos9 snc1 plants. B and C, Relative PR1 (B) and PR2 (C) expression in wild-type, snc1, and mos9 snc1 plants. Two-week-old seedlings grown on one-half MS were collected for total RNA extraction and reverse transcribed to obtain cDNA. The cDNA amounts were quantified with real-time PCR as described in Zhang et al. (2003). Bars represent means of three replicates ± sd. D and E, Free (D) and total (E) SA levels in leaves of wild-type, snc1, and mos9 snc1 plants. SA was extracted and measured from 4-week-old soil-grown plants using a previously described procedure (Li et al., 1999). Bars represent means of four replicates ± sd. F, Growth of Ha Noco2 on wild-type, snc1, and mos9 snc1 plants. Two-week-old seedlings were sprayed with Ha Noco2 at a concentration of 100,000 spores mL–1 water. The infection was scored 7 d after inoculation. Bars represent means of four replicates ± sd. G, Psm ES4326 bacterial growth in wild-type, snc1, and mos9 snc1 plants. Leaves were infiltrated with a bacterial suspension at OD600 of 0.0001 (day 0). Bacterial growth was measured 3 d after infiltration (day 3) as previously described (Zhang et al., 2003). Bars represent means of five replicates ± sd. All experiments were repeated at least once with similar results. WT, Wild type. [See online article for color version of this figure.]
Map-Based Cloning of mos9
To identify the molecular lesion in mos9 that leads to the suppression of snc1, mos9 snc1 (in ecotype Columbia [Col-0] accession) was crossed with ecotype Landsberg erecta (Ler) with snc1 introgressed (Ler-snc1; Zhang and Li, 2005). Linkage analysis on 24 F2 plants that had lost the snc1 morphology revealed that the mos9 locus is located on the top arm of chromosome 1 between markers T28P6 and F3F19 (Fig. 2A). Further mapping with over 1,000 F2 plants narrowed the mos9 mutation to the region between markers T28K15 and T12C24. Unfortunately, with this population, we could not narrow the region beyond this 250-kb region.
![Positional cloning of mos9. A, The rough position of mos9 locus on chromosome 1 between markers T28P6 (3.77 megabase pair) and F3F19 (4.48 megabase pair) by using a small mapping population. Positions of the markers used for mapping are indicated. The more defined region between markers T28K15 and T12C24 was achieved using a larger mapping population with over 1,000 plants. B, Overlapping JAtY clones used to transform mos9 snc1 for complementation. C, Candidate genes in the final region containing mos9. Arrows indicate transcription direction. Black arrows are genes that can be PCR amplified, whereas dashed arrows indicate genes which failed to be amplified using PCR. D, Morphology of the wild type, snc1, mos9 snc1, and mos9 snc1 carrying genomic sequences of At1g12520 or At1g12530 driven by their native promoters. E, Disease ratings of plants of the indicated genotypes infected with Ha Noco2. Two-week-old seedlings were sprayed with Ha Noco2 at a concentration of 100,000 spores mL–1 water. The infection was scored 7 d after inoculation. A total of 20 plants were scored for each genotype. Disease rating scores are as follows: 0, no conidiophores on the plants; 1, one leaf infected with no more than five conidiophores; 2, one leaf infected with more than five conidiophores; 3, two leaves infected but with no more than five conidiophores on each infected leaf; 4, two leaves infected with more than five conidiophores on each infected leaf; and 5, more than two leaves infected with more than five conidiophores (Jing et al., 2011). The experiment was repeated at least once with similar results. Mb, Megabase pair; WT, wild type. [See online article for color version of this figure.]](https://oup.silverchair-cdn.com/oup/backfile/Content_public/Journal/plphys/162/3/10.1104_pp.113.214551/2/m_plphys_v162_3_1694_f2.jpeg?Expires=1747864958&Signature=BWLVRqcfqgYciHsALZZdYZCt~7piLcETSZY-O~4~JW0u5Uq5BSOM4u6ROgpeh7uMqaK-qVRxDk2STRfQE5b2uCTVklTsZ0-QvHQKAxEt4zMHAPeFMjCDiKlLvFC0fZCTEELL9AR1U3b8hDAlwUAa~p65AGFnUFkG1cwWpl1YQaxWJ7Clki5tUKBFU-cc8oO8TBu9HoHxI1NH0s1rHbmHQUbyjvTzzOKPkdvApi~OcK0SX1BgOKQVb20wbGVEp2piMBP4DmXhHFpIs4qRJMAKFXR3j-9CIH7DkXruYnLkRBEzaHSnx~vq0HnmTxHeQjhgo1194~brztZJFwcUF0xFlg__&Key-Pair-Id=APKAIE5G5CRDK6RD3PGA)
Positional cloning of mos9. A, The rough position of mos9 locus on chromosome 1 between markers T28P6 (3.77 megabase pair) and F3F19 (4.48 megabase pair) by using a small mapping population. Positions of the markers used for mapping are indicated. The more defined region between markers T28K15 and T12C24 was achieved using a larger mapping population with over 1,000 plants. B, Overlapping JAtY clones used to transform mos9 snc1 for complementation. C, Candidate genes in the final region containing mos9. Arrows indicate transcription direction. Black arrows are genes that can be PCR amplified, whereas dashed arrows indicate genes which failed to be amplified using PCR. D, Morphology of the wild type, snc1, mos9 snc1, and mos9 snc1 carrying genomic sequences of At1g12520 or At1g12530 driven by their native promoters. E, Disease ratings of plants of the indicated genotypes infected with Ha Noco2. Two-week-old seedlings were sprayed with Ha Noco2 at a concentration of 100,000 spores mL–1 water. The infection was scored 7 d after inoculation. A total of 20 plants were scored for each genotype. Disease rating scores are as follows: 0, no conidiophores on the plants; 1, one leaf infected with no more than five conidiophores; 2, one leaf infected with more than five conidiophores; 3, two leaves infected but with no more than five conidiophores on each infected leaf; 4, two leaves infected with more than five conidiophores on each infected leaf; and 5, more than two leaves infected with more than five conidiophores (Jing et al., 2011). The experiment was repeated at least once with similar results. Mb, Megabase pair; WT, wild type. [See online article for color version of this figure.]
To further resolve the position of the mos9 mutation, we transformed mos9 snc1 plants with a set of overlapping transformation-competent artificial chromosome (TAC) clones (JAtY, John Innes Center) covering the 250-kb region. Only one clone, JAtY51H02, complemented the mos9 phenotype (Fig. 2B; Supplemental Table S1). By subtracting the regions covered by the noncomplementing clones from JAtY51H02, the mos9 lesion could be confined to a small region containing six candidate genes (Fig. 2C). Because mos9 was identified from a fast neutron-mutagenized population and fast neutron induces deletion mutations, the coding sequences of these candidate genes were amplified from mos9 snc1 to test whether any of them has been deleted in the mutant. Two genes, At1g12520 and At1g12530, could not be PCR amplified from mos9 snc1, suggesting that mos9 contains a deletion mutation affecting both genes. Direct transgenic complementation using the genomic region of At1g12520 or At1g12530 driven by their native promoter was used to test which gene is MOS9 (Chu et al., 2005). As shown in Figure 2, D and E, only mos9 snc1 transgenic plants carrying At1g12530 exhibited snc1-like morphology and enhanced resistance against Ha Noco2. Of 12 transgenic lines carrying At1g12530 in mos9 snc1, 11 showed snc1-like morphology, indicating that At1g12530 complemented the mos9 defects. Together with the complementation data from JAtY51H02 clone (Supplemental Table S1), we concluded that MOS9 is At1g12530.
Sequence analysis of MOS9 revealed that it encodes a plant-specific protein of 193 amino acids with no discernible motifs or domains. In Arabidopsis, MOS9 has a remote paralog, At1g56420 (Supplemental Figs. S1A and S2). MOS9 and At1g56420 seem to be evolving independently and at different rates, with MOS9 evolving faster than At1g56420 (Supplemental Fig. S2). MOS9 homologs in other plant species, including Arabidopsis lyrata, are more divergent, while those of At1g56420 are highly conserved. A survey of coding regions of MOS9 in 75 Arabidopsis accessions revealed that there are at least 11 alleles present in the population containing 24 polymorphic sites, 15 of which are nonsynonymous changes resulting in amino acid substitutions. By contrast, At1g56420 shows seven alleles with six polymorphic sites, only two of which lead to amino acid substitutions. Codeml analysis (Yang, 2007) indicates that two of the individual amino acid residues (39 D and 156 K) in MOS9 could be positively selected under positive selection model 8 with posterior probabilities 0.703 and 0.707, respectively (Supplemental Table S2). However, there was no indication of positive selection in At1g56420 (Supplemental Table S3).
Characterization of the mos9 Single Mutant
To obtain the mos9 single mutant, mos9 snc1 was crossed with wild-type Col-0 plants. Lines homozygous for mos9 and the wild type for SNC1 were selected as the mos9 single mutant. As shown in Figure 3A, mos9 is morphologically indistinguishable from wild-type plants.
![Characterization of the mos9 single mutant. A, Morphology of 4-week-old soil-grown wild-type and mos9 plants. B, Psm ES4326 bacterial growth in wild-type, mos9, and Col-0-eds1 plants. Leaves were infiltrated with a bacterial suspension at OD600 of 0.0001 (day 0). Bacterial growth was measured 3 d after infiltration (day 3) as previously described in Zhang et al. (2003). Bars represent means of five replicates ± sd. C, Growth of Ha Emwa1 on seedlings of the indicated genotypes. Two-week-old soil-grown plants were sprayed with Ha Emwa1 at spore suspension 100,000 spores mL–1 water. At least 20 plants were collected for spore counting 7 d after inoculation. D, Relative SNC1 and snc1 expression level in the indicated genotypes. Bars represent means of three replicates ± sd. E, Relative SNC1 expression level in uninduced and avrRpm1-treated 4-week-old soil-grown wild-type (gray bar) and mos9 (white bar) plants. Bars represent means of three replicates ± sd. F, Relative RPP4 expression level in uninduced and avrRpm1-treated 4-week-old soil-grown wild-type (gray bar) and mos9 (white bar) plants. Bars represent means of three replicates ± sd. All experiments were repeated at least once with similar results. WT, Wild type; UI, uninduced; AVR, avrRpm1-treated. [See online article for color version of this figure.]](https://oup.silverchair-cdn.com/oup/backfile/Content_public/Journal/plphys/162/3/10.1104_pp.113.214551/2/m_plphys_v162_3_1694_f3.jpeg?Expires=1747864958&Signature=WjNdPCPjz~UwiDQ9NhOoh1DjmFUz12nMKwhJdhVMgEn8u1EbTGyy4so5bf5aoKkkrBB2WNuPleVIHu33ExvlbbwrtjjSPXP5bGrhnUqenYXpyRt3oLasD9yMVpxuEWy0IXx3CyV-fW6-kaB7f7djgY3I3iMyHFh3~8SceJT3f2kfv8xzLO5mVAc1S6TUPisijoEb0pry99aJN4n5bFlpFarLzxkfL-JGEXQWHK1YVZ2FmilCYsdcLoT38PkIb-1Dz3~T~RBqToLKCH6LN3mtss86pMJQMrBMkBkb15ipPabxyDmhbVpSVkOG0yBZqguOm~JTePPs0DjNWwQdx~hV2g__&Key-Pair-Id=APKAIE5G5CRDK6RD3PGA)
Characterization of the mos9 single mutant. A, Morphology of 4-week-old soil-grown wild-type and mos9 plants. B, Psm ES4326 bacterial growth in wild-type, mos9, and Col-0-eds1 plants. Leaves were infiltrated with a bacterial suspension at OD600 of 0.0001 (day 0). Bacterial growth was measured 3 d after infiltration (day 3) as previously described in Zhang et al. (2003). Bars represent means of five replicates ± sd. C, Growth of Ha Emwa1 on seedlings of the indicated genotypes. Two-week-old soil-grown plants were sprayed with Ha Emwa1 at spore suspension 100,000 spores mL–1 water. At least 20 plants were collected for spore counting 7 d after inoculation. D, Relative SNC1 and snc1 expression level in the indicated genotypes. Bars represent means of three replicates ± sd. E, Relative SNC1 expression level in uninduced and avrRpm1-treated 4-week-old soil-grown wild-type (gray bar) and mos9 (white bar) plants. Bars represent means of three replicates ± sd. F, Relative RPP4 expression level in uninduced and avrRpm1-treated 4-week-old soil-grown wild-type (gray bar) and mos9 (white bar) plants. Bars represent means of three replicates ± sd. All experiments were repeated at least once with similar results. WT, Wild type; UI, uninduced; AVR, avrRpm1-treated. [See online article for color version of this figure.]
To test whether MOS9 contributes to basal defense against virulent pathogens, mos9 plants were challenged with Psm ES4326 at a concentration of optical density at 600 nm (OD600) of 0.0001. Wild-type plants usually develop no disease symptoms at this low dose 3 d after infiltration. Like wild-type plants, mos9 plants support similar bacterial growth 3 d after inoculation, whereas the susceptible control, Col-0-eds1 (enhanced disease susceptibility 1), carries 1,000 times more bacteria (Fig. 3B). Therefore, MOS9 does not seem to contribute to basal resistance.
To determine whether MOS9 is required for resistance mediated by other TIR-type R proteins, we challenged mos9 single mutant plants with Ha isolates Emwa1 and Cala2 and Pseudomonas syringae pv tomato (P.s.t.) DC3000 carrying avrRps4 that can be recognized by TIR-type NLRs RPP4 (van der Biezen et al., 2002), RPP2 (Sinapidou et al., 2004), and Resistance to P.s.t. avrRps4 (RPS4) (Hinsch and Staskawicz, 1996), respectively. Resistance mediated by RPP4 is compromised in mos9 plants (Fig. 3C). mos9 supported growth of approximately 1,500 spores per seedling, while less than 200 spores were observed on the wild type. However, resistance mediated by RPS4 (Supplemental Fig. S4A) and RPP2 (data not shown) is not affected in mos9 plants.
Another large class of plant NLRs is the CC type. To test whether MOS9 contributes to resistance mediated by CC-type NLRs, we challenged mos9 single mutant plants with P.s.t. DC3000 carrying the avirulent effectors avrPphB, avrRpt2, or avrRpm1 that can be recognized by plant CC-type NLRs RPS5 (Simonich and Innes, 1995), RPS2 (Kunkel et al., 1993; Yu et al., 1993), and RPM1 (Debener et al., 1991), respectively. As shown in Supplemental Figure S4, B to D, mos9 single mutant plants were as resistant as wild-type Col-0 plants when challenged with bacterial pathogens carrying these avirulent effectors. These data suggest that MOS9 does not contribute to resistance mediated by these CC-type NLR proteins.
Because mos9 only affects resistance responses mediated by snc1 and RPP4, we tested whether the expression of snc1 and RPP4 is affected in the mos9 mutant background. As shown in Figure 3D, the steady-state expression level of SNC1 is reduced in mos9 single mutant, whereas that of snc1 is about 67% in the mos9 snc1 double mutant as that in snc1. Moreover, SNC1 transcript levels in mos9 single mutant remains lower than that in wild-type plants, even after pathogen challenges (Fig. 3E). Like SNC1, the steady-state and the induced RPP4 transcript levels are also reduced in the mos9 single mutant plants (Fig. 3F). These data suggest that mutation in MOS9 affects the expression levels of SNC1 and RPP4. Alternatively, the steady-state and the pathogen-induced expression of RPM1 and RPS2 in mos9 are similar to that of wild-type plants (Supplemental Fig. S4, E and F), indicating that MOS9 has no effect on the transcription of these R genes.
Subcellular Localization of MOS9
Because protein sequence analysis of MOS9 yielded very little information, we first investigated its subcellular localization. MOS9 was expressed by its native promoter and with GFP fused to its C terminus. MOS9-GFP fully complemented mutant phenotypes associated with the mos9 mutation, and mos9 plants carrying the MOS9-GFP construct restored resistance against Ha Emwa1 (Fig. 4A). This suggests that the construct expressing MOS9-GFP fusion protein localizes and functions as the wild-type MOS9 in planta. Whereas GFP alone under constitutive 35S promoter control was localized everywhere inside the cell, weak fluorescence of the MOS9-GFP fusion protein was mostly detected inside the nuclei in both root cells, guard cells, and leaf pavement cells (Fig. 4B).
![Nuclear localization of MOS9-GFP. A, Growth of Ha Emwa1 on seedlings of the wild type, mos9, and mos9 transformed with MOS9-GFP. Two-week-old soil-grown plants were sprayed with Ha Emwa1 at a spore suspension 100,000 spores mL–1 water. At least 20 plants were collected for spore counting 7 d after inoculation. B, Confocal microscopy images of MOS9-GFP localization in root and leaf pavement cells. Propidium iodide was used as cell wall stain. C, Western-blot analysis of fractioned protein samples from wild-type and MOS9-GFP transgenic plants. Phosphoenolpyruvate carboxylase (PEPC) and histone H3 were used as cytosolic and nuclear protein markers, respectively. The slight positional difference between the bands of nuclear fraction and nuclei-depleted fraction versions of MOS9-GFP is due to the variation in the extraction buffers. WT, Wild type; N, nuclear fraction; ƊN, nuclei-depleted fraction. [See online article for color version of this figure.]](https://oup.silverchair-cdn.com/oup/backfile/Content_public/Journal/plphys/162/3/10.1104_pp.113.214551/2/m_plphys_v162_3_1694_f4.jpeg?Expires=1747864958&Signature=il~o3F0gO~iM9of7-IpR4gUP-W7UYOJWXCWFpR8rObcG0CzLB8TR~zPHYLufeq783eMx1dJHcYVD-1D76hblrSgyrsdrutNwYDpSupkLvCShlJ8y5NnK~lJxtdhja21uWxhICUfryFE07y9hgGMD1orxbuMkJC4Uw2Q5RaaSs0DM9MG-C~e2EYau8cpmUZw3YvjwN6j90lJHOoF2kGAYq3QhT5LFRSyOg0dHcfVMGlvygcWaanljVFKPs1ShgkWZsC1GTTTB1IsrE~4ovlZylZ570BgtciYQvT410YY20vejpzOy~e6M2eBhmkoh3kiumL3Iqspw3t8wMrJtsb54Zw__&Key-Pair-Id=APKAIE5G5CRDK6RD3PGA)
Nuclear localization of MOS9-GFP. A, Growth of Ha Emwa1 on seedlings of the wild type, mos9, and mos9 transformed with MOS9-GFP. Two-week-old soil-grown plants were sprayed with Ha Emwa1 at a spore suspension 100,000 spores mL–1 water. At least 20 plants were collected for spore counting 7 d after inoculation. B, Confocal microscopy images of MOS9-GFP localization in root and leaf pavement cells. Propidium iodide was used as cell wall stain. C, Western-blot analysis of fractioned protein samples from wild-type and MOS9-GFP transgenic plants. Phosphoenolpyruvate carboxylase (PEPC) and histone H3 were used as cytosolic and nuclear protein markers, respectively. The slight positional difference between the bands of nuclear fraction and nuclei-depleted fraction versions of MOS9-GFP is due to the variation in the extraction buffers. WT, Wild type; N, nuclear fraction; ƊN, nuclei-depleted fraction. [See online article for color version of this figure.]
Because we could not exclude the possibility that MOS9 also localizes to other cellular compartments, we also carried out subcellular fractionation on complementing mos9 mutant plants expressing MOS9-GFP. As shown in Figure 4C, MOS9-GFP signal can be detected in both nuclear and nuclei-depleted fractions. Taken together, MOS9 seems to be a protein predominantly localizing to the nucleus.
Identification of MOS9-Associated Proteins
To better understand how MOS9 regulates the expression levels of SNC1 and RPP4, we searched for MOS9-associating proteins by affinity purification and mass spectrometry (MS) analysis. Because a large portion of MOS9-GFP protein is located inside the nucleus, the affinity purification experiment was carried out on the nuclear fraction of MOS9-GFP plants using anti-GFP microbeads. A nuclear fraction of wild-type plants was used as negative control.
SDS-PAGE followed by silver staining showed that two proteins, one about 150 kD and the other about 65 kD copurified with the MOS9-GFP bait protein (Fig. 5A). MS analysis showed that the large protein is ATXR7, a nuclear Set1 class H3K4 methylase of 159 kD, and the smaller protein is High Chlorophyll Fluorescence Phenotype173 (HCF173; 66 kD), a protein with weak similarities to the short-chain dehydrogenases/reductases (Fig. 5B). Both proteins were not detected in the wild-type control sample. Because HCF173 localizes to the chloroplasts (Schult et al., 2007), it is likely a false positive interactor from chloroplast contamination. We therefore focused our further analysis on ATXR7.
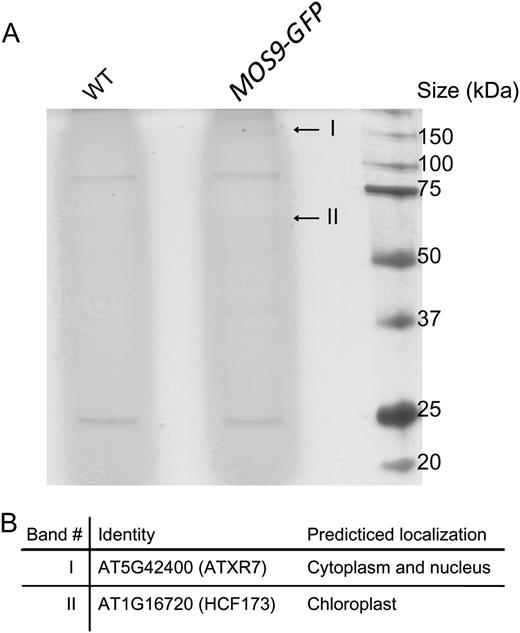
Identification of proteins associated with MOS9-GFP. A, Silver-stained SDS-PAGE gel of the anti-GFP microbeads-immunoprecipitated protein samples from wild-type and MOS9-GFP transgenic plants. Two specific protein bands shown in the MOS9-GFP-immunoprecipitated sample are indicated with arrows. B, List of the specific proteins identified from the MOS9-GFP-immunoprecipitated sample. WT, Wild type.
Suppression of snc1 Mutant Phenotypes by atxr7-1
H3K4 methyltransferases ATXR7 and ATX1 are required for proper activation of FLC through H3K4 methylation (Tamada et al., 2009). The identification of ATXR7 as a protein associated with MOS9 prompted us to test whether ATXR7 is required for snc1 mutant phenotypes. We first introduced atxr7-1 into snc1 to determine whether a mutation in ATXR7 can suppress snc1 like mos9. As shown in Figure 6, atxr7-1 not only partially suppresses the stunted growth morphology of snc1 (Fig. 6A), but also suppresses the enhanced disease resistance of snc1 against the virulent oomycete pathogen Ha Noco2 (Fig. 6B). The suppression of enhanced disease resistance of snc1 is also reflected by reduced snc1 and PR gene expression in atxr7-1 snc1 double mutant plants (Fig. 6, C–E). Unlike mos9 and atxr7, a mutation in the ATXR7 paralog ATX1 cannot suppress the stunted growth morphology or the autoimmune phenotypes of snc1 (Supplemental Fig. S3). These data suggest that both MOS9 and ATXR7 are required for full expression of snc1 and snc1-mediated autoimmunity. Consistent with reduced transcripts of snc1, snc1 protein levels were reduced in both mos9 snc1 and atxr7 snc1 mutant backgrounds when compared with that of snc1 plants (Fig. 6F). Similar reduction in SNC1 protein level was also observed in mos9 and atxr7 single mutants (Supplemental Fig. S5).
![Mutation in ATXR7 suppresses snc1. A, Morphology of wild-type, snc1, mos9 snc1, and atxr7 snc1 plants. The picture shows 4-week-old soil-grown plants. B, Growth of Ha Noco2 on the indicated genotypes. Two-week-old seedlings were sprayed with Ha Noco2 at a concentration of 100,000 spores mL–1 water. The infection was scored 7 d after inoculation. Bars represent means of four replicates ± sd. C, Relative SNC1 transcript levels in the indicated genotypes. Bars represent means of three replicates ± sd. D and E, Relative expression of PR1 (D) and PR2 (E) levels in the indicated genotypes. Bars represent means of three replicates ± sd. F, SNC1 and snc1 protein levels in the indicated genotypes as detected by Western-blot analysis using a SNC1-specific antibody (Li et al., 2010a). All experiments were repeated at least once with similar results. WT, Wild type. [See online article for color version of this figure.]](https://oup.silverchair-cdn.com/oup/backfile/Content_public/Journal/plphys/162/3/10.1104_pp.113.214551/2/m_plphys_v162_3_1694_f6.jpeg?Expires=1747864958&Signature=iwR~hA88qa8oCM8zzCifQlvqdKpkSaaXsho6VSYllO6QZ7oqeAvctGMLSeraEIluvWeYAo3PwH9neo5THERnLFpum0lUuJlQKvK11JZZD-49AE~BnK2KoEoHLVQsj4aL6k-nwQeIn3UODadGjEKuL0e9xXz0QuwOajZkzRsx2MCIe~aSILY-yLARBeBBZEEdtSF~X4RQgTLhfF7NsDuq6Iy51qdnJe1DJna4wZ~Dqs9kE5TZyYYrWMWuL2~RfU3ChD98w0hB6e3tVqKPnpQ5VEbRlOQ6PfKdc~omd8A-ExWXOwnfQL7VO-80ViykMj42yORph3fb6DHJBLFC2~VSJg__&Key-Pair-Id=APKAIE5G5CRDK6RD3PGA)
Mutation in ATXR7 suppresses snc1. A, Morphology of wild-type, snc1, mos9 snc1, and atxr7 snc1 plants. The picture shows 4-week-old soil-grown plants. B, Growth of Ha Noco2 on the indicated genotypes. Two-week-old seedlings were sprayed with Ha Noco2 at a concentration of 100,000 spores mL–1 water. The infection was scored 7 d after inoculation. Bars represent means of four replicates ± sd. C, Relative SNC1 transcript levels in the indicated genotypes. Bars represent means of three replicates ± sd. D and E, Relative expression of PR1 (D) and PR2 (E) levels in the indicated genotypes. Bars represent means of three replicates ± sd. F, SNC1 and snc1 protein levels in the indicated genotypes as detected by Western-blot analysis using a SNC1-specific antibody (Li et al., 2010a). All experiments were repeated at least once with similar results. WT, Wild type. [See online article for color version of this figure.]
ATXR7 Is Required for RPP4 Expression and RPP4-Mediated Immunity
We further tested whether ATXR7 is required for RPP4-mediated disease resistance against Ha Emwa1. As shown in Figure 7A, atxr7 mutant plants supported much higher growth of Ha Emwa1 than the wild type. The susceptibility of atxr7 is similar to that of mos9 and rpp4 plants (Supplemental Fig. S6). The growth of Ha Emwa1 is similar to that in mos9 plants. Interestingly, when the mos9 atxr7 double mutant plants were challenged with Ha Emwa1, no additive effect is observed; the growth of the oomycete is similar to that in the single mutants. These data suggests that MOS9 and ATXR7 function in the same biological process relating to immunity. This is consistent with the earlier biochemical data that MOS9 is able to pull down ATXR7, and they seem to function together in a protein complex. Similar to SNC1, expression of RPP4 is also reduced in atxr7 (Fig. 7B), suggesting that reduced expression of RPP4 results in compromised resistance to Ha Emwa1 in atxr7-1. Suppression of snc1 by atxr7 (Fig. 6) and similar susceptibility to Ha Emwa1 in mos9 atxr7 double mutant when compared with that of mos9 and atxr7 single mutants (Fig. 7A) suggest that MOS9 and ATXR7 function together in the same genetic pathway in regulating snc1- and RPP4-mediated resistance.
![Compromised RPP4-mediated resistance in atxr7 and mos9 plants and reduced H3K4me3 levels in mos9 at SNC1 and RPP4 loci. A, Growth of Ha Emwa1 on wild-type, mos9, atxr7, and mos9 atxr7 mutant plants. Two-week-old soil-grown plants were sprayed with Ha Emwa1 at spore suspension 100,000 spores mL–1 water. At least 20 plants were collected for spore counting 7 d after inoculation. B, Relative RPP4 expression level in the indicated genotypes. Bars represent means of three replicates ± sd. C, Relative levels of Actin7 in chromatin-immunoprecipitated DNA samples from wild-type and mos9 plants using antibodies against histone H3 or H3K4me3. The Actin7 levels from each sample were compared with that of anti-H3 pulled-down wild-type sample. D, Relative levels of H3K4me3 at SNC1 and RPP4 as determined by ChIP-PCR analysis in wild-type and mos9 mutant seedlings. The y axis indicates relative levels of modifications. Each experiment was normalized to no antibody treatment. Bars represent means of three replicates ± sd. For C and D, the relative wild-type value was calculated against itself, thus with an average value of 1 and no relative enrichment. Other treatments were calculated against the wild type. All experiments were repeated at least once with similar results. E, A conceptual model on the regulation of SNC1 or RPP4 expression by MOS9 and ATXR7. MOS9 associates with ATXR7 in a multiprotein complex. This association is probably responsible for the specificity of the target genes, such as SNC1 and RPP4, for H3K4 bulk methylation by ATXR7. Because reduced expression of SNC1 was also detected in the atx1 mutant (Alvarez-Venegas et al., 2006), another Set1 class of H3K4 methyltransferases could also affect these promoters. WT, Wild type. [See online article for color version of this figure.]](https://oup.silverchair-cdn.com/oup/backfile/Content_public/Journal/plphys/162/3/10.1104_pp.113.214551/2/m_plphys_v162_3_1694_f7.jpeg?Expires=1747864958&Signature=yKFUnFly2sX3Fz~m0JSBzDAEzH87eUP6noecn59ohKN-fcb7X3Qym-So-jV0cK3~xToQaEk6jcAAwyQIZcjzTv8Het0OKc14g~yAXf5YTlNL1kf599G9vwTipgdA2UYfP0dudHsQETDJI3W57KFtbVONEM~C7tnkOKHBvtFcylVIjxc5344iF3XayTE6D9mFvkFG~I1raNkNvHFaAWdO1hvxOgiRM-QnhyL8H3-7JecvTj3Gsyko2aSBlOntSv0nfCY3AaIzatM-KH4FLDVFyOp4eMKDJ6HDJYZCfhQi7iBM1rPhU2vsuJf93U5N2P10tkab~V0nTcwG7TnitE8lyQ__&Key-Pair-Id=APKAIE5G5CRDK6RD3PGA)
Compromised RPP4-mediated resistance in atxr7 and mos9 plants and reduced H3K4me3 levels in mos9 at SNC1 and RPP4 loci. A, Growth of Ha Emwa1 on wild-type, mos9, atxr7, and mos9 atxr7 mutant plants. Two-week-old soil-grown plants were sprayed with Ha Emwa1 at spore suspension 100,000 spores mL–1 water. At least 20 plants were collected for spore counting 7 d after inoculation. B, Relative RPP4 expression level in the indicated genotypes. Bars represent means of three replicates ± sd. C, Relative levels of Actin7 in chromatin-immunoprecipitated DNA samples from wild-type and mos9 plants using antibodies against histone H3 or H3K4me3. The Actin7 levels from each sample were compared with that of anti-H3 pulled-down wild-type sample. D, Relative levels of H3K4me3 at SNC1 and RPP4 as determined by ChIP-PCR analysis in wild-type and mos9 mutant seedlings. The y axis indicates relative levels of modifications. Each experiment was normalized to no antibody treatment. Bars represent means of three replicates ± sd. For C and D, the relative wild-type value was calculated against itself, thus with an average value of 1 and no relative enrichment. Other treatments were calculated against the wild type. All experiments were repeated at least once with similar results. E, A conceptual model on the regulation of SNC1 or RPP4 expression by MOS9 and ATXR7. MOS9 associates with ATXR7 in a multiprotein complex. This association is probably responsible for the specificity of the target genes, such as SNC1 and RPP4, for H3K4 bulk methylation by ATXR7. Because reduced expression of SNC1 was also detected in the atx1 mutant (Alvarez-Venegas et al., 2006), another Set1 class of H3K4 methyltransferases could also affect these promoters. WT, Wild type. [See online article for color version of this figure.]
Analysis of H3K4me3 Levels in the Promoter Regions of SNC1 and RPP4
Because H3K4 methylation is correlated with transcriptional activation and ATXR7 functions as a H3K4 trimethyltransferase, we further investigated whether MOS9 plays a role in the regulation of H3K4me3 levels in the promoter regions of SNC1 and RPP4 by chromatin immunoprecipitation (ChIP) assays using an antibody that specifically recognizes H3K4me3 marks. Real-time PCR was carried out on the DNA samples from the ChIP assays using primers specific to DNA close to the start codon of SNC1 and RPP4. As shown in Figure 7C, the amount of the housekeeping gene Actin7 is similarly pulled down in both wild-type and mos9 plants in chromatin-immunoprecipitated samples using both H3 and H3K4me3 antibodies, indicating that MOS9 does not affect general H3K4me3 marks. However, with regards to SNC1 and RPP4, reduced H3K4me3 marks were observed in mos9 plants compared with that of the wild type (Fig. 7D), suggesting that MOS9 contributes to the level of H3K4 trimethylation at these loci.
DISCUSSION
From the MOS forward genetics screens intended to isolate positive regulators of snc1-mediated immunity, we have identified mos9. This modifier partially suppresses the autoimmune phenotypes of snc1, including dwarfism, constitutive PR gene expression, elevated SA levels, and enhanced resistance against bacterial and oomycete pathogens (Fig. 1). Positional cloning followed by transgene complementation revealed that MOS9 encodes a small plant-specific protein with no known conserved domain or function. More detailed analysis on the mos9 single mutant uncovered that MOS9 is not only required for snc1-mediated autoimmunity, it is also essential for RPP4-mediated resistance against the oomycete Ha Emwa1 (Fig. 3C). MOS9 is not required for basal resistance (Fig. 3B). Further expression analysis of SNC1 and RPP4 in the mos9 plants revealed that the expression of both TIR-NB-LRR-encoding genes is reduced in mos9, leading to attenuated resistance mediated by the encoded NLR proteins (Fig. 3, D and E). Thus, MOS9 seems to be a nuclear regulator specifically required for proper transcription of SNC1 and RPP4.
The regulation of R protein-mediated immunity is very complex. However, stringent control has to be imposed at R gene and R protein levels to ensure appropriate degree of immunity outcome conferred by these receptors. Despite the importance of R gene transcriptional regulation, its mechanisms are poorly understood. From past expression analysis and various microarray experiments, it has been taken for granted that many R genes are expressed at low level without pathogen interaction. Upon infection, some R genes, but not all, are moderately up-regulated, presumably to amplify immune signals and enhance immunity against pathogen attack (de Torres et al., 2003; Navarro et al., 2004). From the RPP7 suppressor screen, Enhanced Downy Mildew 2 (EDM2) was identified as a transcriptional regulator of RPP7 (Eulgem et al., 2007). EDM2 is a plant-specific nuclear protein with plant homeodomain finger-like domains. Loss of EDM2 renders plants more susceptible to Ha Hiks1 due to reduced RPP7 expression (Tsuchiya and Eulgem, 2010). MOS1, identified in the same screen as MOS9, encodes a conserved nuclear protein with a HLA-B-Associated Transcript 2 (BAT2) domain of unknown function (Li et al., 2010b). Mutations in MOS1 attenuate the expression of SNC1. The exact mechanism of how EDM2 and MOS1 regulate R gene transcription is unclear; however, regulation at the chromatin level is speculated for both proteins (Li et al., 2010b, 2011).
MOS9 is annotated as an unknown protein. Its only Arabidopsis paralog is At1g56420, which shares 39% identity and 60% similarity at amino acid level with MOS9 throughout the protein sequence (Supplemental Fig. S1A). As shown phylogenetically (Supplemental Fig. S2), MOS9 and At1g56420 are both plant-specific proteins, although curiously belonging to two separate clades. The cluster including MOS9 exhibits longer branches, suggesting that MOS9 has evolved faster compared with its paralog. This was confirmed by the maximum likelihood analysis implemented in the Codeml package (Yang, 2007), which shows at least two amino acid residues in MOS9 may be positively selected, whereas there is no indication of positive selection in the paralogs (Supplemental Tables S2 and S3). Faster evolving genes are often under positive selection such as biotic stresses. The evolution pattern of MOS9 somewhat mimics the fast-evolving NB-LRR-encoding R genes. It is possible that as a transcriptional regulator, MOS9 has coevolved with its target R genes to properly regulate their transcription.
The biological function of the MOS9 paralog At1g56420 is unclear. It seems to be highly conserved in higher plants (Supplemental Fig. S2). Unfortunately, there is no null knockout line available from the public resources. RNA interference lines for At1g56420 did not exhibit any obvious defects with regards to plant morphology, growth, or development. When the RNA interference construct was transformed into the mos9 snc1 double mutant, no enhanced or suppressed snc1-mediated autoimmunity was observed either (Supplemental Fig. S1B). These data suggest that At1g56420 does not share redundancy with MOS9. Conceivably, like MOS9, At1g56420 may be specifically involved in the regulation of proper transcription of unknown target genes.
MOS9 is a nuclear protein associating with SET domain-containing protein ATXR7 (Fig. 5). The SET domain was named after Drosophila spp. Su (var) 3-9, Enhancer of zeste, and Trithorax. Although we did not detect direct protein-protein interaction between MOS9 and truncated parts of ATXR7 in our yeast (Saccharomyces cerevisiae) two-hybrid analysis (data not shown), it is possible that bridging proteins exist between the two proteins in the same protein complex (Fig. 7E). We also tried to confirm the MOS9-ATXR7 interaction using ATXR7-GFP transgenic lines (Tamada et al., 2009). Unfortunately, we discovered that the ATXR7-GFP fusion construct was made with the incorrect complementary DNA (cDNA) sequence prediction from The Arabidopsis Information Resource, thus, the GFP was not in frame with ATXR7. The correct ATXR7 cDNA sequence can be found at http://www.ncbi.nlm.nih.gov/nuccore/EU014691. When we made the correct ATXR7-HA (hemagglutinin) fusion, it is no longer able to complement the atxr7 defects, suggesting that the fusion protein is not functional. With these unfortunate events, we were not able to obtain a useful tool to confirm the interaction between ATXR7 and MOS9 in planta. However, because mutation in ATXR7 shares similar immune defects as mos9 (Fig. 6) and there is no additive effect observed in mos9 atxr7 double mutant when compared with the single mutants (Fig. 7A), these genetic data strongly corroborate the biochemical data (Fig. 5) that these two proteins act in the same protein complex (Fig. 7D).
Highly conserved among eukaryotes, most of the SET domain-containing proteins exhibit histone Lys methyltransferase activity. In recent years, histone modifications, in particular histone methylation marks, have been shown to be associated with different transcriptional activities of their target genes. For example, H3K4, H3K36, and H3K79 methylation is correlated with transcriptional activation, whereas methylation at H3K9, H3K20, and H4K27 is associated with transcriptional silencing or repression. In addition, each Lys residue of H3 can be mono-, di-, or trimethylated, and each methylation status may have a different biological relevance (Liu et al., 2010). These add more complexity to fine-tune the expression of a target gene at various developmental stages or during different cellular responses such as an immune response.
Specifically, SET1/COMPASS (Complex proteins associated with SET1) proteins are H3K4 methyltransferases, where H3K4me3s are most often histone marks for actively transcribed genes. There are three SET1/COMPASS orthologs in Drosophila spp. and six in human. They serve diverse roles in regulating gene expression in various biological processes such as development, diseases such as cancer, aging, and pathogenesis (Shilatifard, 2012). In Arabidopsis, ATXR7 is the only homolog of yeast SET1/COMPASS, which regulates flowering time by modifying the methylation status of histones close to the ATG start codon of the master flowering time repressor FLC (Tamada et al., 2009). Like mos9, atxr7 suppresses the stunted growth and autoimmune phenotypes of snc1 (Fig. 6). The expression level of SNC1 and RPP4 is also lower in both mos9 and atxr7 mutant backgrounds (Fig. 7). These data suggest that both MOS9 and ATXR7 are required for full expression of SNC1 and RPP4, which is crucial for providing the appropriate level of immunity mediated by these TIR-NB-LRR-encoding genes. Such transcriptional control is probably brought about through ATXR7 by H3K4 bulk methylation. Because mos9 does not exhibit any flowering time defects (data not shown) and MOS9 does not have obvious DNA-binding motifs, it is possible that MOS9 is responsible for directing ATXR7 specifically to its target genes such as SNC1 and RPP4. Agreeing with this hypothesis, less H3K4me3 was detected around the promoter region of SNC1 and RPP4 in mos9 mutant plants (Fig. 7D).
One intriguing fact about SNC1 and RPP4 is that they are highly homologous TIR-type NLR-encoding genes residing in the RPP4 cluster on chromosome 4 (Noël et al., 1999). We speculate that MOS9 could coregulate these two R genes through histone modification due to close proximity. Such speculation is supported by an independent study of LAZARUS5 (LAZ5; Palma et al., 2010). While searching for mutations that can suppress the autoimmunity and spontaneous cell death phenotype of accelerated cell death 11 (acd11), Palma et al. (2010) found that acd11 is suppressed by mutations in LAZ2 and LAZ5. Further studies revealed that the expression of LAZ5, a TIR-NB-LRR-encoding gene, is under the control of LAZ2, which encodes another SET domain protein, SET domain group 8 (SDG8). SDG8 is responsible for H3K36 di- and trimethylation, also a histone mark for actively transcribing genes. Interestingly, it was found that not all R genes tested are affected by the laz2 mutation. In addition to LAZ5, the expression level of another TIR-NB-LRR-encoding gene, At5g45230, located very close to LAZ5 (At5g44870), is also affected by the laz2 mutation. Thus, coexpression regulation through histone modifications could be a common theme in regulating R gene activity, especially when they are in close proximity. This type of regulation shares resemblance with a phenomenon observed in cancer cells, where tumor suppressor genes are coordinately silenced during carcinogenesis, a process called long-range epigenetic silencing (LRES). LRES can affect megabases of DNA and can result in heterochromatin formation and hypermethylation of contiguous CpG islands inside the region (Clark, 2007; Coolen et al., 2010). Recent cancer epigenomics studies revealed that LRES might be achieved through a combination of reinforcement of repressive histone marks in genomic regions that are normally silenced and gain of repressive marks in regions that are transcriptionally active in normal cells. In addition, exchange of repressive marks on genes that are inactive or expressed at low levels in normal cells was also observed. It can be speculated that coactivation of R genes in close proximity may be achieved through coordinated opposite types of histone modifications such as H3K4, H3K36, and H3K79 methylations that are associated with transcriptional activation.
Due to the nature of R protein-mediated responses, it is essential that the proper level of R gene expression is achieved with or without pathogen infection. Without infection, low levels of R genes are expressed, presumably to be prepared for immunity and take part in basal defense. With pathogen attack, proper expression has to be maintained to ensure the production of enough R protein molecules to take care of pathogen recognition, defense activation, and defense amplification and maintenance. Too much R gene expression would lead to autoimmunity, while insufficient expression would lead to disease. Our study of MOS9 revealed that it is required for full expression of SNC1 and RPP4. This positive regulation of expression likely involves H3K4me3 histone modifications by ATXR7 and possibly other SET domain proteins (Alvarez-Venegas et al., 2006), which associates with MOS9 (Fig. 7E). It is expected that there are other regulators in addition to H3K4 and H3K36 methylation events involved in R gene expression and that there must also be repressive forces that hold the R genes under check to prevent autoimmunity. Future in-depth studies on these mechanisms will reveal the full picture of the intricate epigenetic regulation of expression of R genes.
MATERIALS AND METHODS
Plant Growth Condition, Mutant Screen, and Mutant Phenotypic Characterization
All plants were grown at 22°C under a 16-h-light/8-h-night regime. mos9 snc1 was identified from a fast neutron-treated snc1 mutant population previously described (Zhang and Li, 2005). In brief, the M2 population of fast neutron-treated snc1 (carrying pPR2::GUS reporter gene system) was first screened for suppression of snc1’s dwarf and stunted growth morphology. These putative mutants were further tested for suppression of constitutive defense phenotype of snc1 by carrying out GUS staining. Mutants that showed reduced or no GUS staining were studied further.
Gene expression analysis was carried out by extracting RNA from 2-week-old plate-grown or 4-week-old soil-grown plants using the Totally RNA kit (Ambion). The extracted total RNA (0.4 μg) was then reverse transcribed using SuperScript II reverse transcriptase (Invitrogen). Expression analysis for PR1, PR2, and Actin1 was performed as previously described (Zhang et al., 2003), with cDNA samples being normalized by real-time PCR using Actin1 and the QuantiTect SYBR Green PCR kit (Qiagen). Gene-specific primers for reverse transcription-PCR analyses used in this study are listed in Supplemental Table S2.
Infection experiments with Pseudomonas and Hyaloperonospora arabidopsidis strains were performed as described (Li et al., 2001). In brief, infection of Hyaloperonospora arabidopsidis Noco2 was performed on 2-week-old seedlings by spraying with an Ha Noco2 spore suspension at a concentration indicated in figure legends. Plants were maintained at 18°C under 12-h-light/12-h-dark cycles with 80% humidity, and the infection was scored 7 d after inoculation by counting the number of conidia spores per gram of tissue (when plants of different treatments are of different sizes) or per plant (when plants of different treatments are of similar sizes) using a hemocytometer or using a 0 to 5 disease rating system as previously described (Jing et al., 2011).
The induced R gene expression experiments were done by infiltrating 4-week-old soil-grown plants with 10 mm MgSO4 (mock) or Pseudomonas syringae pv tomato DC3000 (OD600 = 0.1) carrying specific avirulence effector indicated in the figure legends. Two full leaves from each plant and six plants per genotype were used for each treatment. The infiltrated leaves were collected 4 h after infiltration and subjected to total RNA extraction followed by reverse transcription to generate cDNA for R gene expression analysis. The induced R gene expression was calculated relative to uninduced wild-type cDNA samples.
Map-Based Cloning and JAtY Clone Complementation
Positional cloning of mos9 was performed as previously described (Zhang and Li, 2005). The markers used to map mos9 were designed according to the insertion-deletion polymorphisms between the genomic sequences of Col-0 and Ler provided by Monsanto on The Arabidopsis Information Resource homepage (https://www.arabidopsis.org/Blast/cereon.jsp). Primer sequences for these markers are listed in Supplemental Table S2.
JAtY clones were individual clones from the TAC library, which consists of clones that provides 14× coverage of the Arabidopsis (Arabidopsis thaliana) Col-0 genome. Overlapping JAtY clones covering the 250-kb mapping region were obtained from the John Innes Centre. Plasmids from each clone were extracted from 4 mL overnight Escherichia coli. culture (in Luria-Bertani medium supplement with 25 μg mL–1 kanamycin) using standard alkaline lysis method. Extracted plasmids were transformed into Agrobacterium tumefaciens strain GV3101 using electroporation method. Successfully transformed A. tumefaciens were grown in 400 mL Luria-Bertani medium (supplement with 25 μg mL–1 kanamycin) at 28°C for 24 to 48 h (until OD600 reached 0.8) with constant shaking. A. tumefaciens cells were collected by centrifugation and resuspended in dipping solution (5% [m/v] Glc and 0.02% [v/v] Silwet-77). All constructs were transformed into mos9 snc1 plants using the floral dip method (Clough and Bent, 1998) to generate transgenic lines for complementation analysis.
Construction of Plasmids
For the construction of pGreen0229-pMOS9::MOS9, which was used for transgene complementation of mos9 snc1, the genomic sequence covering the MOS9 coding region plus 1.8-kb 5′ upstream and approximately 0.4-kb 3′ downstream sequence was PCR amplified using primers 5′-CGCGGATCCGACGTGGAGACGATCGGGAG-3′ and 5′-CCGGAATTCCATCCGACACTAGGTTCTTG-3′. The amplified fragment was digested with BamHI and EcoRI, and the digested fragment was cloned into pGreen0229 vector (Hellens et al., 2000).
For construction of pCambia1305-pMOS9::MOS9-GFP, which was used for subcellular localization of MOS9-GFP and immunoprecipitation of MOS9-GFP experiments, the genomic sequence covering the MOS9 coding region without the stop codon plus the 1.8-kb 5′ upstream sequence was PCR amplified using primers 5′-ccgGAATTCcatccgacactaggttcttg-3′ and 5′-CGCggatccGCCAAAGCCAGGAGGGAGTTC-3′. The amplified fragment was digested with BamHI and EcoRI, and the digested fragment was cloned into a modified pCAMBIA1305 vector that contained a GFP tag (http://www.cambia.org/daisy/cambia/home.html).
All constructs were transformed into designated genotypes using the floral dip method (Clough and Bent, 1998) to generate transgenic lines for subsequent analysis.
Mutant Genotyping
Mutants described in this study were PCR genotyped using the following primers. For genotyping mos9, which was generated using fast neutron bombardment, primer pairs 4269391_F: ggcgtagacggattgaacgg and At1g12530_R: tgatgcatcatgaagccctg were used. A fragment with approximately 1.4 kb can be amplified from wild-type MOS9 but not from homozygous mos9 mutant. Seeds of ATX1 and ATXR7 mutants were obtained from Richard M. Amasino (Tamada et al., 2009); they are transfer DNA insertional mutant alleles and were genotyped by using the primer pairs listed in Supplemental Table S2.
Total Protein Extraction
For total protein extraction, 0.1 g leaf tissue of 4-week-old soil-grown plants was harvested in liquid nitrogen and ground into fine powder. Samples were homogenized in extraction buffer (100 mm Tris-HCl, pH 8, 0.2% [w/w] SDS, and 2% [v/v] β-mercaptoethanol). After 5 min of centrifugation at 4°C at 13,200 rpm, the supernatant was transferred to a new tube containing 4× Laemmli loading buffer and heated at 95°C for 5 min. Protein samples were loaded onto SDS-PAGE and followed by Western-blot analysis.
Nuclear Fractionation
Approximately 3 g of 2-week-old plate-grown plants were frozen in liquid nitrogen, ground to fine powder, and homogenized in 1.5 V of lysis buffer (20 mm Tris-HCl, pH 7.4, 25% [w/w] glycerol, 20 mm KCl, 2 mm EDTA, 2.5mm MgCl2, and 250mm Suc) at 4°C. The homogenate was sequentially filtered through a 100- and 30-μm nylon mesh. The nuclei were pelleted by centrifugation at 1,500g for 10 min. The nuclei pellet was washed three times with nuclei resuspension buffer with Triton X-100 (20 mm Tris-HCl, pH 7.4, 25% [w/w] glycerol, 2.5 mm MgCl2, and 0.2% [v/w] Triton X-100) at 4°C and washed one time with nuclei resuspension buffer without Triton X-100. The final nuclei pellet was resuspended in 300 µL 2× Laemmli loading buffer and heated at 95°C for 5 min. For Western-blot analysis, the nuclear fraction was loaded 2 times more than the nuclei-depleted fraction.
Nuclear Extraction and Immunoprecipitation
Approximately 20 g of 2-week-old plate-grown plants were frozen in liquid nitrogen, ground to fine powder, and homogenized in lysis buffer (20 mm Tris-HCl, pH 7.4, 25% [w/w] glycerol, 20 mm KCl, 2 mm EDTA, 2.5 mm MgCl2, and 250 mm Suc) at 4°C. Two samples were prepared simultaneously. Wild-type Col-0 plants were used as negative control, and MOS9-GFP transgenic plants were used for immunopurification. Nuclei were purified as above and then resuspended in 2 mL ice-cold NE-2 buffer (20 mm HEPES-KOH, pH 7.9, 2.5 mm MgCl2, 250 mm NaCl, 20% [w/w] glycerol, 0.2% [v/w] Triton X-100, 0.2 mm EDTA, 1 mm dithiothreitol, and protease inhibitor cocktail [Sigma]) and then subjected to sonication for 4 min with 5-s on and 10-s off intervals to completely release nuclear proteins. The supernatant was mixed with 50 μL of anti-GFP MicroBeads (Miltenyi Biotec) and incubated at 4°C for 1 h; the MicroBeads-bound target protein was magnetically precipitated on columns according to the manufacturer’s instructions. The columns were then washed eight times, each time with 1mL NE-3 buffer (20 mm HEPES-KOH, pH 7.9, 2.5 mm MgCl2, 150 mm NaCl, 20% [w/w] glycerol, 0.2% [v/w] Triton X-100, 0.2 mm EDTA, 1 mm dithiothreitol, and protease inhibitors) before proteins were eluted with 60 μL 95°C preheated 1× SDS loading buffer. The samples were subsequently analyzed by SDS-PAGE followed by silver staining using ProteoSilver Plus Silver Stain Kit (Sigma). The protein bands specific to MOS9-GFP were excised for Mass Spectrometry (MS) analysis. Gel bands at the same positions of the Col-0 treatment were also excised. The MS data from MOS9-GFP were compared with that of Col-0 to rule out false-positive identifications.
ChIP
ChIP was performed as described previously (Lee et al., 2007), with some modifications. In brief, approximately 8 g of 2-week-old seedlings grown on MS plate were collected and cross linked with 1% [v/w] formaldehyde for 20 min and the cross linking was terminated by adding 2 m Gly to final concentration of 0.125 m and vacuum infiltrated for 5 min. After rinsing seedlings with distilled water for five times, tissues were ground into fine power using liquid nitrogen and nuclei purified as described above. Nuclei pellet was resuspended in 1 mL ChIP lysis buffer (50 mm Tris-HCl, pH 8.0, 10 mm EDTA, pH 8.0, 1% [w/w] SDS, 1× Protease inhibitor, and 1 mm phenylmethylsulfonyl fluoride) and sonicated with a Fisher 550 Sonic Dismembrator for 2 min (15 s on and 60 s off, power 4.0) to yield DNA of an average fragment size of approximately 0.5 to 1.0 kb. Sonicated chromatin was centrifuged at 13,000 rpm at 4°C for 5 min to pellet the debris, and the supernatant was collected into a new 1.5-mL Eppendorf tube. The soluble chromatin solution was diluted 10-fold with ChIP dilution buffer (16.7 mm Tris-HCl, pH 8.0, 167 mm NaCl, 1.1% [v/w] Triton X-100, 1.2 mm EDTA, 1× Protease inhibitor, and 1mm phenylmethylsulfonyl fluoride) to decrease the SDS concentration to 0.1% [w/w]. Chromatin solution was precleared with no antibody-conjugated Protein A Sepharose (GE Healthcare; 17-1279) at 4°C for 1 h with gentle rotation, and 1 μL of α-H3K4me3 (Abcam, ab8580) antibody was added to approximately 2.5 mL of diluted chromatin solution and incubated at 4°C overnight. Thirty microliters of prewashed Protein A Sepharose beads were added to each sample to pull down the antibody for 2 h at 4°C. After washing with different washing buffers, immunocomplex was eluted twice from the beads with 250 μL of elution buffer (0.1 m NaHCO3 and 1% [w/w] SDS). Eluted immunocomplex was reverse cross linked by adding 5 m NaCl to a final concentration of 200 mm at 65°C overnight. Protein was removed by adding proteinase K, and DNA was extracted using phenol:chloroform:isoamyl alcohol (25:24:1), followed by chloroform:isoamyl alcohol (24:1), extraction methods and precipitated by ethanol. The immunoprecipitated DNA was resuspended in Tris-EDTA buffer and subjected to real-time PCR analysis with primers listed in Supplemental Table S4.
Supplemental Data
The following materials are available in the online version of this article.
Supplemental Figure S1. MOS9 paralog At1g56420 does not contribute to snc1-mediated immunity.
Supplemental Figure S2. Phylogenetic tree of MOS9 (At1g12530) and its paralog At1g56420.
Supplemental Figure S3. Mutation in ATX1 does not affect snc1-mediated immunity.
Supplemental Figure S4. R protein mediated resistance in mos9.
Supplemental Figure S5. SNC1 protein levels in mos9 and atxr7-1.
Supplemental Figure S6. RPP4-mediated immunity is attenuated in mos9 and atxr7-1.
Supplemental Table S1. Transgenic complementation of mos9 snc1 using overlapping JAtY clones.
Supplemental Table S2. Codeml analysis of MOS9 sequences from 75 Arabidopsis thaliana accessions.
Supplemental Table S3. Codeml analysis of MOS9 paralog sequences from 74 Arabidopsis thaliana accessions.
Supplemental Table S4. Primer sequences used in the study.
ACKNOWLEDGMENTS
We thank Richard M. Amasino (University of Wisconsin, Madison) for seeds of atxr7, atx1, and ATXR7-GFP transgenic lines and Kristoffer Palma and Kaeli Johnson for careful reading of the manuscript.
Glossary
- Psm
Pseudomonas syringae pv. maculicola
- Ha
Hyaloperonospora arabidopsidis
- SA
salicylic acid
- Col-0
ecotype Columbia
- Ler
ecotype Landsberg erecta
- OD600
optical density at 600 nm
- ChIP
chromatin immunoprecipitation
- cDNA
complementary DNA
- LRES
long-range epigenetic silencing
- MS
Murashige and Skoog
LITERATURE CITED
Author notes
This work was supported by the Canadian National Science and Engineering Research Council Discovery grant program, Michael Smith Laboratories, and the University of British Columbia Department of Botany William Cooper Endowment Fund.
These authors contributed equally to the article.
Corresponding author; e-mail [email protected].
The author responsible for distribution of materials integral to the findings presented in this article in accordance with the policy described in the Instructions for Authors (www.plantphysiol.org) is: Xin Li ([email protected]).
Some figures in this article are displayed in color online but in black and white in the print edition.
The online version of this article contains Web-only data.
Open Access articles can be viewed online without a subscription.
