


Abstract
Growth is driven by newly fixed carbon in the light, but at night it depends on reserves, like starch, that are laid down in the light. Unless plants coordinate their growth with diurnal changes in the carbon supply, they will experience acute carbon starvation during the night. Protein synthesis represents a major component of cellular growth. Polysome loading was investigated during the diurnal cycle, an extended night, and low CO2 in Arabidopsis (Arabidopsis thaliana) Columbia (Col-0) and in the starchless phosphoglucomutase (pgm) mutant. In Col-0, polysome loading was 60% to 70% in the light, 40% to 45% for much of the night, and less than 20% in an extended night, while in pgm, it fell to less than 25% early in the night. Quantification of ribosomal RNA species using quantitative reverse transcription-polymerase chain reaction revealed that polysome loading remained high for much of the night in the cytosol, was strongly light dependent in the plastid, and was always high in mitochondria. The rosette sucrose content correlated with overall and with cytosolic polysome loading. Ribosome abundance did not show significant diurnal changes. However, compared with Col-0, pgm had decreased and increased abundance of plastidic and mitochondrial ribosomes, respectively. Incorporation of label from 13CO2 into protein confirmed that protein synthesis continues at a diminished rate in the dark. Modeling revealed that a decrease in polysome loading at night is required to balance protein synthesis with the availability of carbon from starch breakdown. Costs are also reduced by using amino acids that accumulated in the previous light period. These results uncover a tight coordination of protein synthesis with the momentary supply of carbon.
Protein synthesis occurs via the recruitment of ribosomes to mRNA to form polysomes (Bailey-Serres et al., 2009). It represents a major component of the total ATP consumption in animal and plant cells (Hachiya et al., 2007; Pace and Manahan, 2007; Proud, 2007; Piques et al., 2009; Raven, 2012). For each amino acid added to the growing peptide chain, two ATPs are consumed in aminoacyl-tRNA synthesis and two in peptide bond synthesis. The actual costs are higher due to copy reading and because many proteins are synthesized as longer polypeptides and then trimmed to their final size. Energy is also required to synthesize amino acids. Conversion of nitrate to amino acids requires the equivalent of about five ATPs and, on average, 2.8 carbons (C) per amino acid (Penning de Vries, 1975; Hachiya et al., 2007, Amthor, 2010).
Protein synthesis also carries substantial indirect costs. Mature ribosomes contain four ribosomal RNA (rRNA) species (typically 25S, 18S, 5.8S, and 5S) and approximately 80 ribosomal proteins (Bailey-Serres et al., 2009). rRNA and ribosomal proteins represent more than 80% and 30% to 50% of the total RNA and protein, respectively, in a growing yeast cell (Warner, 1999; Perry, 2007). Ribosome biogenesis involves the synthesis of a large approximately 45S rRNA precursor that is processed to generate the mature rRNA species and the synthesis of ribosomal proteins as well as their stepwise assembly into the large and small ribosome subunits in a process that requires about 200 ancillary proteins (Houseley and Tollervey, 2009).
Ribosome biosynthesis occupies a large part of the transcriptional and translational machinery in growing yeast and bacterial cells (Warner, 1999; Rudra and Warner, 2004; Snoep et al., 2006). In Arabidopsis (Arabidopsis thaliana) rosettes, ribosomal proteins are equivalent to about 10% of the protein in the whole rosette (Piques et al., 2009). Much higher levels can be anticipated in young growing leaves, where ribosome abundance is much higher than in mature leaves (Detchon and Possingham, 1972; Dean and Leech, 1982; Baerenfaller et al., 2012). Transcripts for ribosomal proteins increase in response to sugar (Contento et al., 2004; Price et al., 2004; Bläsing et al., 2005), nitrate (Scheible et al., 2004), or phosphate (Misson et al., 2005; Morcuende et al., 2007). During diurnal cycles, they show a coordinated increase in the light and decrease during the night (Bläsing et al., 2005; Usadel et al., 2008; Baerenfaller et al., 2012), although this is not accompanied by significant changes in the levels of ribosomal proteins (Baerenfaller et al., 2012).
Protein synthesis is regulated by changing the loading of ribosomes into polysomes. Nutrient or anaerobic stress results in a rapid decrease in polysome loading in yeast and animals (Hinnebusch, 2005; Ingolia et al., 2009). Translation in plants is regulated by the rate of initiation, at least in the cytosol (Bailey-Serres et al., 2009). Loading of transcripts into polysomes changes rapidly in response to environmental stress (Bailey-Serres, 1999; Bailey-Serres et al., 2009), including dehydration (Hsiao, 1970; Scott et al., 1979; Kawaguchi et al., 2003, 2004; Kawaguchi and Bailey-Serres, 2005, Matsuura et al., 2010), anaerobiosis (Branco-Price et al., 2005, 2008; Mustroph et al., 2009), and severe C depletion (Nicolaï et al., 2006). Illumination of dark-grown Arabidopsis seedlings leads to rapid and widespread changes in translation (Liu et al., 2012). In many cases, polysome loading changes independent of transcript levels (Bailey-Serres, 1999; Bailey-Serres et al., 2009; Piques et al., 2009; Juntawong and Bailey-Serres, 2012), allowing rapid recovery of protein synthesis when the stress is removed.
Ribosome synthesis and ribosome loading are regulated by the universal nutrient-signaling Target of Rapamycin (TOR) pathway in animals and yeast (Mayer and Grummt, 2006; Wullschleger et al., 2006; Ma and Blenis, 2009). Inducible inhibition of TOR expression revealed that TOR is also a major regulator of metabolism and growth in plants (Caldana et al., 2013). Synthesis of the 45S rRNA precursor in Arabidopsis is regulated by the kinase domain of TOR (Ren et al., 2011), and Arabidopsis mutants with strongly decreased TOR expression show a small decrease in polysome loading (Deprost et al., 2007). In yeast and animals, TOR regulates polysome loading via a signal cascade initiated by the AMP-dependent protein kinase or SNF1, leading to phosphorylation of the ribosomal protein S6 and of the initiation factor eIF4E-binding protein eIF4BP and elongation factor eEF2 (Ma and Blenis, 2009). Phosphorylation of ribosomal protein S6 is implicated in stress signaling in plants (Scharf and Nover, 1982; Williams et al., 2003; Mahfouz et al., 2006).
The daily alternation between light and darkness is one of the most pervading environmental changes experienced by plants. In the light, photosynthetic electron transport and photophosphorylation deliver ATP and NAD(P)H, providing energy to assimilate CO2 into carbohydrates and nutrients like nitrate and ammonium into amino acids. In the dark, carbohydrates and other C-containing storage metabolites are catabolized to generate C skeletons, NAD(P)H, and ATP. This involves energy costs, including the loss of free energy during the turnover and respiration of C reserves.
Starch is the major C reserve in many species (Geiger et al., 2000; Smith and Stitt, 2007; Stitt and Zeeman, 2012). Arabidopsis mutants impaired in starch synthesis or degradation show strongly reduced growth except in continuous light or very long days (Caspar et al., 1985, 1991). In wild-type Arabidopsis, growth is rapidly inhibited when starch is exhausted, and this inhibition is not immediately reversed when C becomes available again (Gibon et al., 2004b; Smith and Stitt, 2007, Yazdanbakhsh et al., 2011). The risk of acute C starvation is minimized by regulating the rate of starch degradation; this occurs in a nearly linear manner such that most but not all of the starch is exhausted at dawn (Smith and Stitt, 2007; Stitt and Zeeman, 2012). This pattern of starch turnover is retained across a wide range of growth conditions (Chatterton and Silvius, 1979, 1980; for review, see Smith and Stitt, 2007; Stitt and Zeeman, 2012). The rate of starch degradation is set such that starch is almost exhausted at dawn, as anticipated by the biological clock (Graf et al., 2010). This allows the rate of degradation to be immediately adjusted to sudden and unpredictable changes in the amount of starch at dusk (Lu et al., 2005; Graf et al., 2010) or night temperature (Pyl et al., 2012).
This sophisticated regulation of photosynthate allocation needs to be accompanied by coordinated changes in the rate of growth (Stitt and Zeeman, 2012). A decrease in the C supply at some time during the diurnal cycle due to the alternation of light and darkness, changes in growth conditions, or sudden unpredictable changes such as shading or changes in the rate of starch degradation will result in acute C starvation unless there is a concomitant decrease in the rate of C utilization.
During diurnal cycles, there are dynamic changes in the rate of leaf and root extension growth (Schmundt et al., 1998; Walter et al., 2009; Poiré et al., 2010; Yazdanbakhsh et al., 2011), which are modified in response to short- and long-term changes in the C supply (Wiese et al., 2007; Gibon et al., 2009; Pantin et al., 2011; Yazdanbakhsh et al., 2011; Kjaer et al., 2012). However, extension growth is driven by water uptake and vacuole expansion. Such measurements do not provide information about the timing of the biosynthesis of cellular components.
Protein synthesis provides an experimentally tractable process (Rudra and Warner, 2004) to study the relation between C supply and the rate of cellular growth. Polysome loading in Arabidopsis rosettes increases between the end of the night and 2 h into the photoperiod (Piques et al., 2009) and decreases slightly when plants are darkened for 1 h in the middle of the light period (Juntawong and Bailey-Serres, 2012). However, it is not known whether polysome loading or ribosome abundance changes in the remainder of the diurnal cycle or whether any such changes are in response to light, C fixation, or other inputs. An additional complication is introduced by subcellular compartmentation. Plant cells contain considerable amounts of ribosomes in their plastids (Detchon and Possingham, 1972; Dean and Leech, 1982). Plastid translation is especially dependent on light (Deng and Gruissem, 1987; Marín-Navarro et al., 2007). The cytosol, plastid, and mitochondria have contrasting phosphorylation potentials that respond differently to illumination and darkening (Stitt et al., 1982, 1983; Gardeström and Wigge, 1988; Igamberdiev and Gardeström, 2003).
The following experiments investigate polysome loading and ribosome abundance during diurnal cycles in wild-type Arabidopsis and the starchless phosphoglucomutase (pgm) mutant. We show that overall polysome loading changes dynamically during diurnal cycles, closely tracking Suc levels. Cytosolic polysome loading responds mainly to changes in Suc, plastidic polysome loading shows a strong dependence on light, and mitochondrial polysome loading remains high throughout the diurnal cycle. While ribosome number remains similar throughout the diurnal cycle and for at least 8 h into an extended night, the abundance of plastidic and mitochondrial ribosomes is modified in the starchless pgm mutant, indicating long-term adjustment of organelle ribosome number to sugars. This information about ribosome abundance and loading into polysomes is then used to model the rate of protein synthesis and the associated costs and compare them with the availability of C at different times in the diurnal cycle.
RESULTS
Changes of Metabolites during a Diurnal Cycle in Wild-Type Col-0 and the Starchless pgm Mutant
Wild-type Col-0 and the starchless pgm mutant were grown in a 12-h-light/12-h-dark cycle. After 5 weeks, rosettes were harvested at the end of the night, after 0.25, 0.5, 1, 2, 4, 8, and 12 h in the light, and after 0.25, 0.5, 1, 2, 4, 8, and 12 h in the dark. On the following day, the light was not turned on in the morning, and further sets of plants were harvested 0.5, 1, 2, 4, and 8 h into the extended night. The diurnal changes of carbohydrates were analyzed in biological triplicates to provide an internal baseline for comparison with changes in ribosome loading and abundance (Fig. 1; for original data, see Supplemental Table S2). While the results resemble earlier studies (Caspar et al., 1985; Smith et al., 2004; Gibon et al., 2004b, 2006; Bläsing et al., 2005; Graf et al., 2010), the increased density of time points provides additional information, especially during transitions between light and darkness.
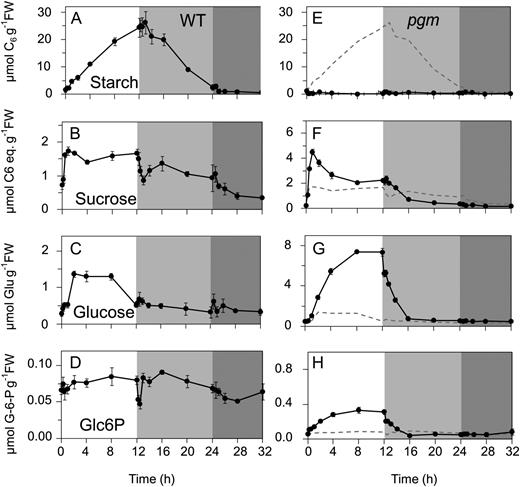
Diurnal changes of carbohydrates in rosettes of the Arabidopsis Col-0 wild type (WT) and the starchless pgm mutant. The plants were grown in soil in a 12-h-light/12-h-dark diurnal cycle. The x axis starts at the end of the night, with 0 h representing harvest just before illumination, followed by the light period, the night, and a 10-h extended night treatment that was given on this day only. A, Starch in the wild type. B, Suc in the wild type. C, Glc in the wild type. D, Glc-6-P in the wild type. E, Starch in pgm. F, Suc in pgm. G, Glc in pgm. H, Glc-6-P in pgm. Note the different y axis in plots E to H. The original data are given in Supplemental Table S2. The results are means ± sd (n = 3 biological replicates). FW, Fresh weight.
In wild-type Col-0, starch accumulated in a nearly linear manner in the light and decreased in a nearly linear manner in the dark, with almost all the starch being exhausted by the end of the night (Fig. 1A). Suc (Fig. 1B) rose to a maximum after 30 min, remained high for the remainder of the light period, decreased to a transient minimum 15 to 30 min after darkening, partially recovered after 1 to 2 h, declined slightly during the remainder of the night, and decreased by 60% during the first 4 h of the extended night. Glc and Fru increased more gradually than Suc at the start of the light period, decreased to the original value by the end of the day, and did not show a transient decrease after darkening (Fig. 1C; Supplemental Table S2). These slow changes may reflect the gradual synthesis of reducing sugars via hydrolysis of Suc in the vacuole (see “Discussion”) and their remobilization later in the 24-h cycle. Glc-6-P (Fig. 1F) is both a precursor for Suc and starch synthesis and an early product of their mobilization. It remained largely unaltered throughout the diurnal cycle, except for a short transient decrease immediately after darkening, at the time when Suc showed a transient minimum, and a more extended transient decrease at the start of the extended night.
These metabolites showed very different kinetics in pgm, both with respect to timing and magnitude. The scales of the y axis for the Col-0 and pgm displays are different; to aid comparison, the Col-0 response is indicated as a dotted line in the pgm displays. First, as expected, starch is effectively absent in pgm (Fig. 1E). Second, following illumination, Suc rose to very high levels, with a peak after 1 h followed by a 50% decrease during the remainder of the light period (Fig. 1F). Glc and Fru also rose to very high levels, but more slowly than Suc, reaching maximum values after 4 to 8 h in the light and remaining high until the end of the light period (Fig. 1G; Supplemental Table S2). The total amount of C in reducing sugars was more than 2-fold higher than that in Suc. After darkening, Glc and Fru decreased rapidly within the first 15 to 30 min, while Suc decreased gradually over the first 4 h of the night. In contrast to wild-type plants, Glc-6-P showed a strong increase during the light period and a rapid decrease after darkening (Fig. 1H). The levels of Suc, reducing sugars, and Glc-6-P in pgm at the end of the night resemble those in Col-0 in an extended night.
The transient decrease of Suc and Glc-6-P after darkening in wild-type Col-0 resembles the response seen in earlier studies of spinach (Spinacia oleracea) and barley (Hordeum vulgare; Stitt et al., 1985). One explanation for this transient decrease would be a delay before starch degradation commences after a sudden shift from light to darkness. The absence of a transient decrease in pgm is consistent with this possibility. To provide additional evidence, maltose levels were analyzed (Fig. 2). Maltose is an intermediate of starch degradation in leaves (Niittylä et al., 2004; Stitt and Zeeman, 2012). Maltose levels were relatively high at the end of the night, remained high for the first 30 min after illumination, declined to low levels for most of the light period, remained low for the first 15 min in the dark, rose progressively at 30, 60, and 120 min after darkening, and decreased gradually during the remainder of the night. These results indicate that there is a lag until starch degradation is activated and inhibited after sudden darkening and sudden reillumination, respectively.
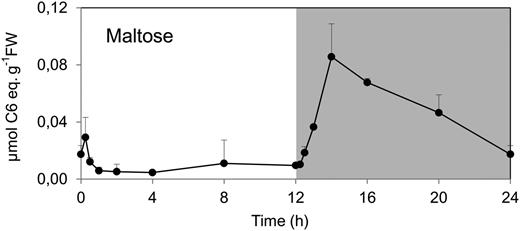
Diurnal changes of maltose in rosettes of the Arabidopsis Col-0 wild type. The data are for the experiment of Figure 1. The results are means ± sd (n = 3 biological replicates). FW, Fresh weight.
Changes of Polysome Loading during a Diurnal Cycle in Wild-Type Col-0
Material from the same set of biological triplicates was individually subjected to polysome density gradient centrifugation. Examples of typical gradients from material harvested at the end of the night and after 2 h of illumination are provided in Supplemental Figure S1. The distribution of RNA is monitored via A 254. As the vast majority of the RNA in the gradients is rRNA (Raven, 2012), A 254 largely reflects the distribution of ribosomes. At the end of the night, the majority of the RNA was present at the top of the gradient, corresponding to free ribosomes (nonpolysome [NPS] fraction). The rest was present in an intermediary small polysome (SPS) fraction (corresponding to polysomes with two to four ribosomes) and a large polysome (LPS) fraction (corresponding to polysomes with five or more ribosomes). In the light, there was a large decrease of absorbance in the NPS fraction and a large increase in the LPS fraction, reflecting an increase in the proportion of ribosomes that are loaded into polysomes.
Figure 3A summarizes the diurnal changes of polysome loading in wild-type Col-0. At the end of the night, about 40% of the RNA was in polysomes (SPS plus LPS), and the remaining 60% was in the NPS fraction. After illumination, the fraction in polysomes rose to about 62% and 67% after 30 min and 1 h and remained high for the remainder of the light period. After darkening, there was a rapid transient decrease of polysome loading (SPS + LPS) to less than 40%, followed by a partial recovery to about 50% during the first part of the night, a slight decline to about 40% at the end of the night, and a further decrease to less than 20% when the night was extended. The main features of this response were seen in five independent experiments performed over a period of 3 years (see below).
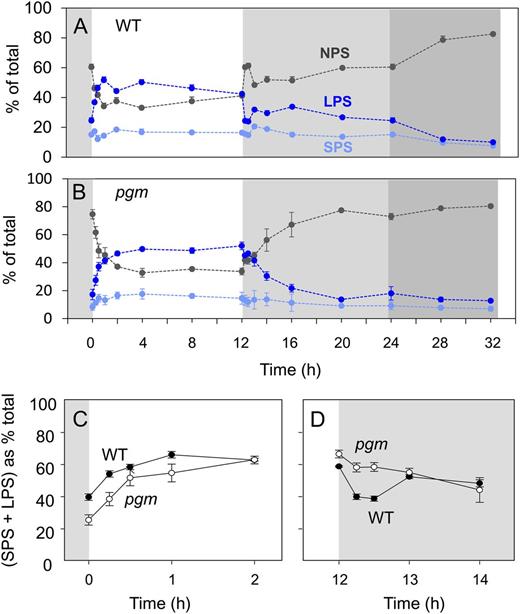
Diurnal changes in polysome loading. Polysome density gradients were performed using material from the experiments of Figures 1 and 2. The x axis starts at the end of the night (0 h), followed by the light period, the night, and an extended night. A, Wild-type Col-0 (WT). B, pgm. In A and B, the display shows the estimated distribution of polysomes (%) between the NPS (black), SPS (light blue), and LPS (blue) fractions. C and D, Comparison of polysome loading in Col-0 and pgm in the time intervals 0 to 2 h in the light (C) and 12 h of light and 2 h of dark (D). Polysome loading was calculated as (SPS + LPS)/(NPS + SPS + LPS). The original data are given in Supplemental Table S2. The results are means and sd of three independent biological replicates.
Changes of Polysome Loading during a Diurnal Cycle in the Starchless pgm Mutant
Similar measurements were carried out with the starchless pgm mutant (Fig. 3B). Polysome loading was low (about 25%) at the end of the night. It rose gradually over the next 2 to 4 h to a value of about 67%, remained high until the end of the light period, decreased gradually during the first 4 h of the night to 20% to 25%, and remained at this low value in the extended night. As in wild-type Col-0, the polysome loading tracked the Suc content, with low values at the end of the night, a gradual rise in the light, and a gradual decrease during the first 4 h of the night. Differences in the response in Col-0 and pgm are highlighted in Figure 3, C and D, which compare the responses at the start of the light period and the start of the night. In pgm, ribosome loading into polysomes started from a lower value and rose more slowly after illumination (Fig. 3C), while at the start of the night, polysome loading in pgm did not show a transient minimum and partial recovery but instead fell gradually to a lower value than in Col-0 after 4 h of darkness (Fig. 3D).
Comparison of Polysome Loading and Metabolite Levels
Visual inspection of Figures 1 and 3 indicates similarities between the responses of Suc content and polysome loading. Both rose after illumination and both showed similar changes in the night, with a transient decrease and partial recovery in wild-type Col-0 and a monotonic decrease to a low value in pgm. Figure 4A compares polysome loading and Suc levels in wild-type Col-0 and pgm at 17 times during the diurnal cycle and extended night. Polysome loading correlated strongly with Suc content (Pearson’s r = 0.71, P = 2 × 10⁻⁶), except early in the light period in pgm, when Suc levels were especially high. Spearman’s rank analysis yielded an even higher correlation (r = 0.82, P = 3 × 10⁻⁹). Visual inspection indicates that polysome loading is not so strongly correlated with the other measured metabolites (Supplemental Fig. S2).
![Relation between metabolite levels and polysome loading. A, Suc content versus polysome loading. Pearson’s r was 0.71 (P = 2 × 10⁶). Genotypes and time of harvest are distinguished (top right). The three data points with the highest Suc content are for pgm at the times 0.5, 1, and 2 h after illumination (see Fig. 1F). The relation for log-transformed data is shown at bottom right. Plots of the relation between polysome loading and Glc, Fru, and Glc-6-P are provided in Supplemental Figure S1. FW, Fresh weight; WT, wild type. B, Partial correlation analysis, with r values shown in the bottom right sector and P values (color coded for significance) shown in the top right sector. Partial correlation analysis was performed to exclude secondary correlations. The analysis was performed using log-transformed data; similar results were obtained with nonlogged data (P < 5 × 10⁴ for Suc versus [SPS + LPS] and P > 0.05 for all other traits; data not shown). The data for both panels are taken from Figures 1 and 3 and comprise measurements of metabolites and polysome loading at 34 times (17 time points in the diurnal cycle and extended night in the Col-0 wild-type and pgm).](https://oup.silverchair-cdn.com/oup/backfile/Content_public/Journal/plphys/162/3/10.1104_pp.112.212258/2/m_plphys_v162_3_1246_f4.jpeg?Expires=1747874936&Signature=2FMaSempIU5FJuB0WZMRUpDPv7ji~5XrUh6YXtL4mGNvoWtALr0C7hxZOUHIwrCIM99tPJPlZX0amq04Sv0JLUlW-tr~dwPfPkp1Jfq-nqJDxBMvBWDw6uDdbC7w4fp45ycu6x26JQDhaQKTWaRJh9HErTyhyFVoUGMUtBTgo0H~wvYlVD82bW7Q5CYX1-BY4ChfaSnHZcr60QMyqFZKCUBGRjjXl5ekN5RLd4Bua3ZDy0zs6O5bN72pVGFnOEPl1neI4WJPnkzq9XYE2GQzMyeI9zElUuwAsO6YotJ3X3bpfe-nEbQIxa9gi3z5tSzyGG4ZHMbzwdxotlJxY07XCw__&Key-Pair-Id=APKAIE5G5CRDK6RD3PGA)
Relation between metabolite levels and polysome loading. A, Suc content versus polysome loading. Pearson’s r was 0.71 (P = 2 × 10⁶). Genotypes and time of harvest are distinguished (top right). The three data points with the highest Suc content are for pgm at the times 0.5, 1, and 2 h after illumination (see Fig. 1F). The relation for log-transformed data is shown at bottom right. Plots of the relation between polysome loading and Glc, Fru, and Glc-6-P are provided in Supplemental Figure S1. FW, Fresh weight; WT, wild type. B, Partial correlation analysis, with r values shown in the bottom right sector and P values (color coded for significance) shown in the top right sector. Partial correlation analysis was performed to exclude secondary correlations. The analysis was performed using log-transformed data; similar results were obtained with nonlogged data (P < 5 × 10⁴ for Suc versus [SPS + LPS] and P > 0.05 for all other traits; data not shown). The data for both panels are taken from Figures 1 and 3 and comprise measurements of metabolites and polysome loading at 34 times (17 time points in the diurnal cycle and extended night in the Col-0 wild-type and pgm).
The strong relation between polysome loading and Suc was checked by performing partial correlation analysis. This statistical approach analyzes the data matrix to exclude secondary correlations (Fig. 4B). Polysome loading was significantly correlated with Suc (r = 0.69, P = 2 × 10⁻⁵; note that the P value is slightly lower than in a simple regression analysis due to correction for multiple testing) and weakly with starch (r = 0.46, P = 0.01) but not with any other measured metabolite.
Changes in Loading of Cytosolic, Plastidic, and Mitochondrial Ribosomes into Polysomes at Dusk and during the Night
To resolve the responses of polysomes in the cytosol, plastid, and mitochondria, we performed a separate experiment in which we quantified the abundance of cytosolic, plastidic, and mitochondrial 18S/16S rRNA in the different density gradient fractions in wild-type Col-0 at the end of the day and several times during the night (Fig. 5; for original data, see Supplemental Table S3). rRNA abundance provides a proxy for ribosome number. To allow absolute quantification, eight external standards were added before preparing RNA. The rRNA species were determined by quantitative reverse transcription (qRT)-PCR using specific primers for the cytosolic, plastidic, and mitochondrial 18S/16S rRNA (Supplemental Table S1). Cycle threshold values were corrected to absolute concentrations, using the external standards as a calibration curve (Piques et al., 2009). In absolute terms, cytosolic, plastidic, and mitochondrial ribosomes account for about 55%, 45%, and 2% of the total ribosomes (Piques et al., 2009).
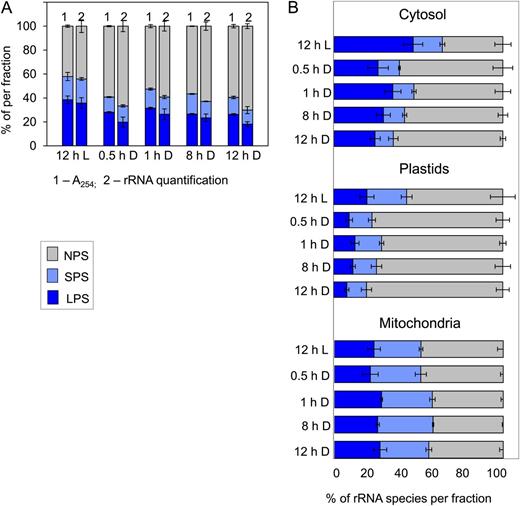
Loading of cytosolic, plastidic, and mitochondrial ribosomes into polysomes. Col-0 was grown in a 12-h-light/12-h-dark cycle as in Figure 1, and rosettes were harvested after 12 h of light (L) and 0.5, 1, 8, and 12 h of darkness (D) and subjected to polysome gradient fractionation. To determine the abundance of cytosolic, plastidic, and mitochondrial ribosomes in each gradient fraction, complementary cDNA was prepared after adding eight external standards and rRNA quantified by qRT-PCR using specific primer pairs for the cytosolic 18S, the plastidic 16S, and the mitochondrial 18S rRNA species. A, Comparison of polysome loading as calculated from the A 254 profile of the gradient (1) and the summed level of cytosolic, plastidic, and mitochondrial rRNA in each gradient fraction (2). B, Loading of the cytosolic, plastidic, and mitochondrial ribosomes into polysomes. NPS, Gray bars; SPS, light blue bars; LPS, dark blue bars. The original data are given in Supplemental Table S3. The results are means ± sd of three independent biological samples from plants grown and harvested at different times.
Piques et al. (2009) showed that similar estimates of polysome loading are obtained using A 254 and by summing the rRNA species in the different fractions in a polysome gradient. In this study, the changes in polysome loading obtained by determining A 254 resembled those obtained by summing the abundance of cytosolic, plastidic, and mitochondrial rRNA (Fig. 5A).
Cytosolic, plastidic, and mitochondrial ribosomes all showed a high loading at the end of the day (Fig. 5B). After darkening, cytosolic ribosome loading showed a small transient decrease at 30 min, a partial recovery, and declined toward the end of the night. Plastidic ribosome loading decreased strongly after 30 min of dark and remained low for the remainder of the night. Mitochondrial ribosome loading remained high throughout the night. While cytosolic rRNA was always more than 3-fold higher in the LPS fraction than in the SPS fraction, the proportion of plastidic and mitochondrial rRNA in the LPS fraction was not much higher than that in the SPS fraction. In the dark, less plastidic rRNA was found in the LPS than the SPS fraction.
Changes of Polysome Loading and Carbohydrates after Illumination at Subcompensation Point and Ambient CO2 Levels
It is possible that light leads to increased polysome loading independently of any changes in CO2 fixation and carbohydrate levels. In particular, light is known to activate translation in chloroplasts (Marín-Navarro et al., 2007). To separate the effects of light and CO2 fixation, we performed two further experiments in which wild-type Col-0 was harvested at the end of the night or illuminated for either 2 or 4 h in the presence of subcompensation point or ambient CO2 (50 and 480 µL L−1, respectively; Arrivault et al., 2009; Fig. 6; Supplemental Table S4). In 50 µL L−1 CO2, photosynthesis is prevented and there is even CO2 release, whereas at 480 µL L−1 CO2, there is rapid photosynthesis and carbohydrate synthesis. The response of global gene expression to this increase of CO2 closely resembles that after readdition of Suc to seedlings (Osuna et al., 2007).
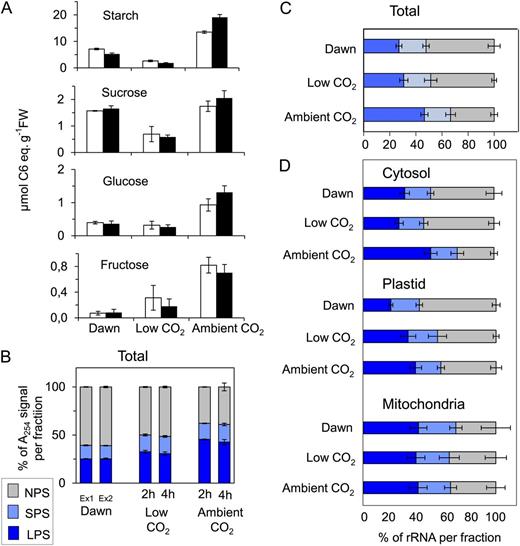
Response to illumination at ambient and subcompensation point CO2. A, Content of starch and sugars (Suc, Glc, and Fru) in rosettes of the Arabidopsis Col-0 wild type grown in soil in a 12-h-light/12-h-dark diurnal cycle in two separate experiments harvested at the end of night and after illumination at low (50 µL L−1) or ambient (480 µL L−1) CO2 for either 2 h (experiment 1; white bars) or 4 h (experiment 2; black bars). FW, Fresh weight. B, Estimated ribosome content in each fraction of the density gradient based on A 254. Ex1 and Ex2 indicate samples at dawn in experiment 1 and experiment 2, respectively. rRNA was also determined using qRT-PCR in the material from experiment 2. C, Percentage of all rRNA species in NPS, SPS, and LPS calculated using qRT-PCR. D, Percentage of 18S cytosolic, 16S plastidic, and 18S mitochondrial rRNAs in NPS, SPS, and LPS. The original data are provided in Supplemental Table S4. Color coding is as in Figure 5. The results are means ± sd of three independent biological replicates.
In both experiments, subcompensation point CO2 completely suppressed the increase of starch, Suc, and reducing sugars that normally occurs after illumination (Fig. 6A). Indeed, the levels of these metabolites decreased further, because the plants were exposed to an additional period of time in which there was no photosynthesis. In this particular experiment, slightly more starch remained at the end of the night and Suc was slightly higher than in the experiments of Figure 1 and other published studies (Gibon et al., 2004b; Bläsing et al., 2005, Usadel et al., 2008). Overall polysome loading assessed by A 254 increased from about 40% in the dark to 50% after illumination at subcompensation point CO2 and more than 60% after illumination at 480 µL L−1 CO2 (Fig. 6B). Addition of low concentrations of Suc to C-starved seedlings also led within 30 min to an increase in overall polysome loading (Supplemental Fig. S3).
Responses of the Loading of Cytosolic, Plastidic, and Mitochondrial Ribosomes into Polysomes after Illumination at Subcompensation Point and Ambient CO2 Levels
To resolve the responses of translation in the cytosol, plastid, and mitochondria, we quantified the abundance of cytosolic, plastidic, and mitochondrial 18S/16S rRNA in the different density gradient fractions at the end of the night and after illumination for 2 h in the presence of subcompensation point or ambient CO2. The changes in polysome loading obtained by summing the cytosolic, plastidic, and mitochondrial ribosomes in each fraction (Fig. 6C) resembled those obtained by A 254 (Fig. 6B).
Cytosolic polysome loading hardly changed after illumination for 2 h at subcompensation point CO2 compared with the end of night (Fig. 6D). It rose strongly and significantly after 2 h of illumination at ambient CO2 (P = 0.016 compared with the end of the night and P = 0.002 compared with illumination in low CO2; Fig. 6D). Plastid polysome loading increased strongly and significantly after illumination for 2 h at subcompensation point CO2 (P = 0.004) and did not increase further in ambient CO2 (Fig. 6D). Loading of mitochondrial ribosomes was high at the end of the night and in the light at subcompensation point CO2 and showed a slight but nonsignificant decrease in the light in ambient CO2 (Fig. 6D). In the dark, a large proportion of the plastidic ribosomes were present in the SPS fraction compared with the LPS fraction.
Meta-Analysis of Diurnal Changes in Polysome Loading
The data sets from the preceding experiments were combined with further data to examine the reproducibility of the diurnal response of overall polysome loading in five studies conducted over a time span of 3 years (Supplemental Fig. S4). The analysis revealed a remarkable reproducibility, including a 2-fold rise after illumination, a transient trough 15 to 30 min after darkening, a subsequent recovery, the maintenance of relatively high polysome loading until the end of the night, and a decrease of polysome loading in an extended night (Supplemental Fig. S4A). This meta-analysis also revealed that the correlation between rosette Suc content and overall polysome loading noted in the experiment of Figure 4A is robust and conserved across all these independent studies (Supplemental Fig. S4B; r 2 = 0.78 for Col-0).
We also combined the experiments of Figures 5 and 6, in which qRT-PCR was used to resolve subcellular polysome loading. Suc showed a strong correlation with cytosolic polysome loading (r 2 = 0.60; Fig. 7A). The subcompensation point CO2 treatment grouped with the other treatments. In contrast, there was only a weak relation between Suc and plastidic (r 2 = 0.16) or mitochondrial (r 2 = 0.05) polysome loading (Fig. 7, B and C). The weak correlation between plastidic polysome loading and Suc content (Fig. 7B) may be an indirect effect. Illumination leads to an increase in plastid polysome loading both in subcompensation point CO2, when Suc remains low, and in ambient CO2, when photosynthesis leads to an increase in Suc.

Correlation between Suc and loading of cytosolic ribosomes into polysomes. Scatterplots show the relation between total rosette Suc and loading of cytosolic 18S rRNA into polysomes (A), loading of plastidic 18S rRNA into polysomes (B), and loading of mitochondrial 18S rRNA into polysomes (C). Polysome loading is calculated as (SPS + LPS)/(NPS + SPS + LPS). The data are from the experiments shown in Figures 5 (blue circles) and 6 (black and white circles) and correspond to samples in the light (open circles) and dark (closed circles) in ambient CO2 and in the light in subcompensation point CO2 (arrow). The original data are provided in Supplemental Tables S3 and S4. FW, Fresh weight.
If protein synthesis is mainly regulated via changes in the rate of its initiation, an increase in the rate of protein synthesis should be accompanied by an increase in the number of ribosomes per polysome. This can be detected as a decrease in the LPS-SPS ratio. Supplemental Figure S5, A to C, summarizes the responses of this ratio in the experiments of Figures 3 to 6. There is a clear correlation between overall polysome loading and the overall LPS-SPS ratio (Supplemental Fig. S4, A and D). In Col-0, the LPS-SPS ratio is very high in the light (2.5–4), lower in the dark (1.5–2.2), and falls further in an extended night. The values are already low in the night in pgm (1.3–1.7). Despite this decrease of the LPS-SPS ratio, the majority of polysomes contain five or more ribosomes across all these conditions. A similar result is obtained for cytosolic polysomes, where the LPS-SPS ratio was above 2 throughout the night (Supplemental Fig. S4, B and D). This is consistent with initiation playing a major role in the regulation of translation in the cytosol. The LPS-SPS ratio is much lower for plastidic polysomes, especially in the dark, when it falls to values less than 0.8 (Supplemental Fig. S4, B and C). Mitochondrial polysomes also exhibit a low LPS-SPS ratio. An LPS-SPS ratio below unity indicates that the majority of polysomes contain only a small number of ribosomes. The mean lengths of the open reading frames of genes encoded by the nuclear, plastid, and mitochondrial genomes are 1,222, 1,062, and 620 bp, respectively (http://www.arabidopsis.org/; TAIR10). The predominance of small polysomes in the mitochondria might be partly due to the short open reading frames of mitochondrial transcripts. Among these, the larger transcripts encode core proteins of the respiratory membrane complexes, which are highly hydrophobic. Their polysomes may be tightly membrane associated and not isolated by our extraction methods. This would lead to an even greater bias to small open reading frames in the analyzed polysomes. The predominance of small polysomes in the plastid in the dark cannot be easily explained in this way. In view of current knowledge about the regulation of protein synthesis in the plastid (Marín-Navarro et al., 2007), it is most likely to reflect ribosome arrest at a small number of sites per transcript
Diurnal Changes in the Abundance of Cytosolic, Plastidic, and Mitochondrial rRNA
The absolute ribosome abundance in rosettes of wild-type Col-0 and pgm was assessed by determining the overall concentration of cytosolic 18S rRNA, plastidic 16S rRNA, and mitochondrial 18S rRNA. Triplicate biological samples were harvested at the end of the night, after 4, 8, and 12 h of light, after 4, 8, and 12 h of darkness, and 4 and 8 h into an extended night (Fig. 8; for original data, see Supplemental Table S2). To decrease the analytic noise inherent in qRT-PCR measurements, three technical replicates were included for each biological sample.
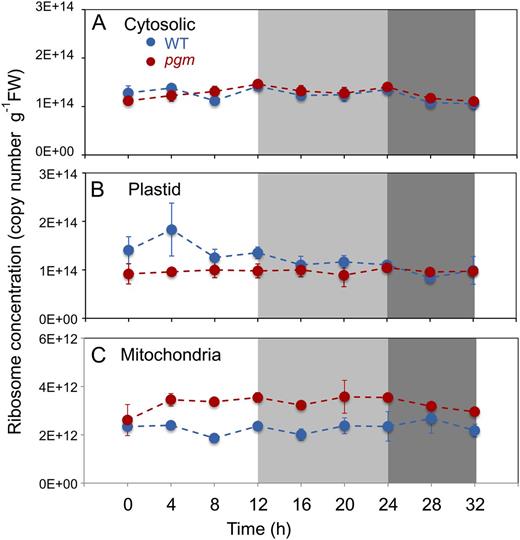
Ribosome abundance in Col-0 and pgm during a diurnal cycle and an extended night. Ribosome number was determined by qRT-PCR against the 18S/16S rRNA species for the cytosolic, plastidic, and mitochondrial ribosomes, using external RNA standards added before RNA preparation to allow absolute quantification of the rRNA species. A, Cytosolic ribosomes. B, Chloroplast ribosomes. C, Mitochondrial ribosomes. The Col-0 wild-type (WT) and pgm mutant are shown as blue and red lines, respectively. The original data are given in Supplemental Table S2. The results are means ± sd (n = 3 biological replicates). FW, Fresh weight.
Cytosolic 18S rRNA abundance was similar in wild-type Col-0 and pgm and did not show any significant changes during the diurnal cycle and the extended night (Fig. 8A). Plastidic 16S rRNA showed a slight nonsignificant increase during the light period in Col-0 (Fig. 8B). It was consistently lower in pgm than in wild-type Col-0. A reverse picture emerged for the mitochondria, where pgm consistently contained more mitochondrial 18S rRNA than wild-type Col-0 (Fig. 8C). The changes in pgm compared with Col-0 were significant (0.03 and less than 0.001) for plastidic and mitochondrial rRNA, respectively, using either the Holm-Sidak or the Tukey test. Thus, while there are no large diurnal changes of cytosolic, plastidic, or mitochondrial ribosome number in either genotype, there are differences in the absolute amounts between Col-0 and pgm, with pgm containing slightly less plastidic rRNA and considerably more mitochondrial rRNA.
Comparison of Changes in rRNA Abundance and the Abundance of Transcripts for Ribosomal Proteins
We mined public domain expression data for information about diurnal changes of transcripts that encode cytosolic, plastidic, and mitochondrial ribosomal proteins (Usadel et al., 2008). Genes encoding cytosolic, plastidic, and mitochondrial ribosomal proteins were identified using the MapMan ontology (Thimm et al., 2004; mapman.gabipd.org/web/guest/mapman). Data were downloaded and viewed via a Web link (http://mapman.mpimp-golm.mpg.de/supplement/xn/figures.shtml) that displays the response in Col-0 in a diurnal cycle and extended night and in pgm in a diurnal cycle and compares them with the response to light (Bläsing et al., 2005), to sugars (Osuna et al., 2007), and during a free-running circadian cycle (Edwards et al., 2006). It also displays the predicted response of each gene in a simple linear model with light, sugar, and the circadian clock as inputs (for details, see Usadel et al., 2008). Screen shots are provided in Supplemental Figure S6. A detailed analysis of the response of these transcripts to the C supply and during the diurnal cycle is provided in Supplemental Figures S7 and S8 and Supplemental Text S1.
Transcripts for the vast majority of cytosolic ribosomal proteins were induced by sugars. They increased in the light and decreased in the night in Col-0 and showed more pronounced diurnal changes in pgm (Supplemental Figs. S6A and S7). A similar but even more pronounced response was found for transcripts encoding BRIX proteins and Nucleolin1, which are involved in ribosome assembly (Supplemental Fig. S9). However, these diurnal changes in transcripts do not result in significant diurnal changes in cytosolic or mitochondrial ribosome abundance in Col-0 or pgm, as assessed by rRNA abundance (Fig. 8). A similar conclusion was reached by Baerenfaller et al. (2012) based on the abundance of a subset of ribosomal proteins in Col-0 at dawn and dusk.
Plastidic ribosomal protein transcripts showed a more complex response. (Supplemental Figs S6B and S8). There was a much more diverse response to C, with some being induced and others repressed. Some of the transcripts also exhibited circadian responses. Correspondingly, some transcripts for plastid ribosomal protein rose and others fell in the light period in Col-0. These complex diurnal changes were accentuated in pgm. The slight decrease in plastidic rRNA in pgm (Fig. 8) is accompanied by a decrease of transcripts for many plastidic ribosomal proteins in the light period, in particular those that are repressed by sugar.
Transcripts for mitochondrial ribosomal proteins showed a similar pattern to the cytosolic ribosomal proteins, with an increase in the light period in Col-0 that was accentuated in pgm (Supplemental Fig. S6C). The latter corresponds to the increase in mitochondrial rRNA in the starchless pgm mutant (Fig. 8).
Modeling the Rate of Protein Synthesis and Associated Costs
The finding that polysome loading is positively correlated with Suc content is understandable, as protein synthesis is an energy-intensive process (see introduction). However, the analyses presented so far do not provide any information about the quantitative relationship between the availability of C at different times in the diurnal cycle and the costs of protein synthesis. In particular, they do not reveal whether the decrease in polysome loading in the night is necessary to balance protein synthesis with the rate of starch mobilization.
Piques et al. (2009) developed a model that estimates the rate of protein synthesis from quantitative data about ribosome abundance and their loading into polysomes. This model assumes that the rate of ribosome progression is the same in all conditions and that all the ribosomes in the polysome fraction are involved in protein synthesis. The modeled rates of the protein synthesis rate are then used to calculate the costs associated with protein synthesis. These can be divided into (1) the cost of amino acid activation and peptide bond synthesis and (2) the cost of amino acid synthesis. The former is immediately linked to protein synthesis, while the latter, in principle, can be temporally separated, for example by synthesizing and accumulating amino acids in the light period to support protein synthesis in the dark. The model provides separate estimates of the cost of amino acid activation and peptide bond synthesis (termed “immediate costs”) and the costs of these processes plus the synthesis of amino acids from nitrate (termed “full costs”). The calculations were carried out for all time points in the 24-h cycle and the extended night. The sources of experimental data, the calculations, and lists of the assumptions and values used to parameterize the model are provided in Supplemental Table S5. Costs were calculated as μatom C g−1 fresh weight h−1; parameters used to interconvert ATP and C are also summarized in Supplemental Table S5.
The results are summarized in Figure 9. Comparison of the modeled costs with the measured rates of starch breakdown and respiration leads to three predictions. First, the observed decrease in polysome loading at night is required to balance protein synthesis with the availability of C. Starch represents more than 80% of the C stored in an Arabidopsis rosette (Gibon et al., 2009; Pyl et al., 2012). If the rate of protein synthesis in the light were to be maintained at night, 25% to 33% of the starch and 36% to 47% of the measured respiration would be required to supply ATP for amino acid activation and peptide bond formation. This is unrealistic, as C and energy will be required for the synthesis of other cellular components and for maintenance. If the measured level of polysome loading at night is used as an input, less than 20% of the starch and 25% of the respiration is required to provide ATP for amino acid activation and peptide bond synthesis. Second, the rosette does not contain enough starch to support the synthesis of all the amino acids that are used for protein synthesis at night. The estimated full costs in the night are equivalent to about 73% to 84% of the available starch and are similar to or higher than the rate of respiration. This indicates that a substantial proportion of the amino acids that are used at night may be accumulated during the preceding day. Amino acids often accumulate in the day and decrease at night in leaves (Pate, 1989; Morot-Gaudry et al., 2001). Supplemental Figure S10 compares the modeled rate of amino acid incorporation into protein with five studies of diurnal amino acid turnover in Col-0 growing in a 12-h-light/12-h-dark cycle. While there is variation between experiments, this comparison indicates that up to half the amino acids that are used for protein synthesis at night are synthesized in the preceding light period. Third, the cost of protein synthesis in the light (13–18 μatom C g−1 fresh weight h−1) is equivalent to 18% to 21% of the total fixed C (85 μmol CO2 g−1 fresh weight h−1; Supplemental Table S5). This value will be an underestimate because some of the amino acids that are used at night are synthesized in the preceding light period.
![Modeled costs of protein synthesis in a diurnal cycle. The rate and costs of protein synthesis were modeled as described by Piques et al. (2009) Two sets of costs were calculated: immediate (triangles; the ATP and GTP required for amino acid activation and peptide bond synthesis) and full (squares; this includes the immediate direct costs plus the costs of converting nitrate to amino acids). Results are shown for wild-type Col-0 (red) and pgm (blue). The calculations, a list of assumptions and parameters, and the sources of data are specified in Supplemental Table S5. The display also shows the average rate of starch degradation at night in Col-0 (11.3 μatom C g−1 fresh weight [FW] h−1; Supplemental Table S2) and a typical rate of respiration in Col-0 (8 μatom CO2 g−1 fresh weight h−1; Gibon et al., 2009).](https://oup.silverchair-cdn.com/oup/backfile/Content_public/Journal/plphys/162/3/10.1104_pp.112.212258/2/m_plphys_v162_3_1246_f9.jpeg?Expires=1747874937&Signature=rYj5vcwrsEvwtFT1ktJ6TB7xleJS2ZYl26OuDQkmzx2KOhLB35hj29jwtpirC7UObv25BvK3UyezdXTaicQ22WNnqb9Yl23pX1bYTNRIdu3zX-0S2zRzg5qiEvpBLqvz~bbo-ibG8LywhHc7FxMBke7k5bz5Y2R8RkHBXJV65zQaZJCI2PGC~lxBnWczlWIr6JJTz0-hCGJYD9jjpl2hR~XIHaSqepqfFktcaHCDt2DRkYQAPTSWAXoLJw3j9kI8txGE~nBNAJovuzfe1SogYtD25WnuMKFUKcDKdux21xLHDqjWvEsZWe7ZLgXuTqMQDwutUsWa4dCKkX5ehtIYbw__&Key-Pair-Id=APKAIE5G5CRDK6RD3PGA)
Modeled costs of protein synthesis in a diurnal cycle. The rate and costs of protein synthesis were modeled as described by Piques et al. (2009) Two sets of costs were calculated: immediate (triangles; the ATP and GTP required for amino acid activation and peptide bond synthesis) and full (squares; this includes the immediate direct costs plus the costs of converting nitrate to amino acids). Results are shown for wild-type Col-0 (red) and pgm (blue). The calculations, a list of assumptions and parameters, and the sources of data are specified in Supplemental Table S5. The display also shows the average rate of starch degradation at night in Col-0 (11.3 μatom C g−1 fresh weight [FW] h−1; Supplemental Table S2) and a typical rate of respiration in Col-0 (8 μatom CO2 g−1 fresh weight h−1; Gibon et al., 2009).
Estimation of the Rate of Protein Synthesis Rates from13CO2 Incorporation
Our model predicts that protein synthesis continues at a substantial rate during the night. To test this prediction, we monitored the incorporation of 13CO2 into protein. Whole plants were transferred before dawn into a chamber that was supplied with a stream of 480 µL L−1 13CO2. Some plants were harvested before transfer to measure 13C natural abundance, and others were harvested at the end of the day or the end of the night. Labeling was started just before dawn, when most endogenous pools are at their diurnal minimum. Starch represents about 80% of the total C reserve in Arabidopsis (Gibon et al., 2009) and is almost completely depleted at the end of the night (Fig. 1A). Other metabolites, including sugars (Fig. 1B) and amino acids (Gibon et al., 2009), are also at a minimum at dawn. This experimental design ensures that starch and other C reserves are built up in the light period using newly fixed C, providing a highly enriched source of C for metabolism at night. The supply of 13CO2 was maintained throughout the night to avoid the dilution of these internal pools by CO2 fixed by phosphoenolpyruvate carboxylase. Total protein was extracted and chemically hydrolyzed to release amino acids for analysis by gas chromatography-mass spectrometry. The mass shift resulting from the incorporation of one or more atoms of 13C allows identification of the 12C species and the various 13C isotopomers (Szecowka et al., 2013). Data were obtained for 11 amino acids: Glu, Asp, Ala, Thr, Leu, Val, Phe, Tyr, Lys, Gly, and Ser (Supplemental Table S6). The rate of 13C incorporation in the light can be estimated from enrichment at the end of the day, and the rate of incorporation in the night can be estimated from the increment in enrichment between the end of the day and the end of the night. It should be noted that the estimated rates are relative, because they are not corrected for enrichment in the precursor pools of free amino acids.
When 13C enrichment was averaged across all amino acids, it increased on average by 1.4% h−1 in the light and 0.4% h−1 in the night. This indicates that the rate of protein synthesis is about 3-fold lower in the dark than in the light period. Overall, about 60% of the protein synthesis occurred in the light period and 40% in the night. For comparison, polysome loading measured in this plant material was 60% in the light and 40% in the dark. This is smaller than the inhibition of protein synthesis estimated from 13C incorporation (see “Discussion”).
One possible explanation for the decreased rate of 13C incorporation into protein in the dark might be the recycling of unlabeled amino acids released by protein degradation. If recycling were leading to an underestimation of the rate of protein synthesis in the dark, it should have an especially marked effect on minor amino acids, because they are more likely to be recycled without mixing with C from central metabolic pools. We inspected the responses for each individual amino acid (Supplemental Table S6). The increase in enrichment ranges from 0.6% to 1.5% h−1 in the light and from 0.3% to 0.6% h−1 in the night. The ratio between the rate in the night and the light was 0.34, 0.37, and 0.89 for Asp, Ala, and Glu, which are directly connected by aminotransferase reactions with organic acids in central C metabolism, 0.24 and 0.27 for Gly and Ser, which are synthesized by photorespiration, and 0.28, 0.30, 0.24, 0.54, 0.37, and 0.35 for six minor amino acids (Leu, Lys, Phe, Thr, Tyr, and Val). With the exception of the curiously high ratio for Glu (0.89; see “Discussion”), all ratios lie between 0.24 and 0.37, and there is no evidence for a substantially lower ratio in the minor amino acids.
DISCUSSION
Dynamic Changes of Ribosome Loading into Polysomes during the Diurnal Cycle
Protein synthesis represents a major component of cellular growth. We have investigated whether changes in the C supply during the diurnal cycle are accompanied by changes in polysome loading or ribosome abundance. We have also taken a modeling approach to ask whether these changes are necessary to balance C consumption in protein synthesis with diurnal changes in the C supply.
Overall polysome loading in wild-type Col-0 ranges between 65% and 70% in the light period, 40% at the end of the night, and about 20% when starch is exhausted after a short extension of the night (Figs. 3 and 4; Supplemental Fig. S4). It falls to less than 25% during the night in the starchless pgm mutant. Values of 20% to 25% resemble those seen under a range of stress treatments, including dehydration (Hsiao, 1970; Scott et al., 1979; Kawaguchi et al., 2003, 2004; Kawaguchi and Bailey-Serres, 2005; Matsuura et al., 2010), anaerobiosis (Branco-Price et al., 2005, 2008; Mustroph et al., 2009), and severe C depletion (Nicolaï et al., 2006). We conclude that there are substantial changes in overall polysome loading during an undisturbed diurnal cycle and that exhaustion of starch leads to a decrease comparable to that seen under extreme stress.
Compartment-Specific Changes in Polysome Loading
Protein synthesis occurs in three different subcellular compartments in plant cells: the cytosol, the plastid, and the mitochondria. Chloroplast-encoded proteins like RBCL represent a substantial proportion of total leaf protein; correspondingly, the plastid accounts for a substantial proportion of the total ribosomes in photosynthetic cells (Fig. 8; Detchon and Possingham, 1972; Dean and Leech, 1982).
To assess the compartment-specific response of polysome loading, we investigated the distribution of cytosolic, plastidic, and mitochondrial rRNA species in polysome density gradients. This was done at selected times during the diurnal cycle (Fig. 5) and in an additional experiment in which leaves were illuminated in subcompensation point CO2 or ambient CO2 to separate the impact of light-driven CO2 fixation from the effect of light per se (Fig. 6). Cytosolic polysome loading remained relatively high for most of the night, and the increase after illumination in the morning was dependent on the provision of CO2 to allow C fixation. Mitochondrial polysome loading remained high throughout the day and night and was unaffected by the CO2 concentration. Plastidic polysome loading was strongly light dependent; it was high in the light, low in the night, and increased in the light in subcompensation point CO2. The latter is in agreement with many earlier studies showing that translation is strongly light dependent in plastids (Marín-Navarro et al., 2007).
The subcellular responses of polysome loading resemble the responses of the cytosolic, chloroplastic, and mitochondrial phosphorylation potential to illumination. Studies in protoplasts from leaves of various species have shown that the cytosolic ATP-ADP ratio is high in the light and the dark and that the mitochondrial ATP-ADP ratio remains unaltered or even increases slightly in the dark. In contrast, the plastidic ATP-ADP ratio is very low in the dark and increases in the light (Stitt et al., 1982, 1983; Gardeström and Wigge, 1988; Igamberdiev et al., 2001). Nonaqueous fractionation of leaves has also shown that the plastidic ATP-ADP ratio is very low in the dark and increases in the light (Keys and Whittingham, 1969; Sellami, 1976; Dietz and Heber, 1984; Heineke et al., 1991). The latter technique is unable to separate the cytosolic and mitochondrial compartments. The low ATP-ADP ratio in plastids in the dark presumably reflects a strong dependence of the plastidic phosphorylation potential on photophosphorylation. Even though the Arabidopsis genome encodes two envelope transporters that facilitate ATP uptake into plastids (Neuhaus et al., 1997; Trentmann et al., 2008), their function appears to be mainly restricted to nonphotosynthetic plastids and developing chloroplasts (Flügge et al., 2011). Their expression decreases during leaf development (Baerenfaller et al., 2012), and mature chloroplasts exhibit very low rates of ATP uptake (Heldt, 1969; Robinson and Wiskich, 1977). Protein synthesis in plastids may be inhibited in the dark for further reasons, in addition to a shortfall of energy. Light may be required to activate plastidic translation via thioredoxin (Balmer et al., 2003; Barnes and Mayfield, 2003; Marín-Navarro et al., 2007) and a signal that is derived from the thylakoid pH gradient (Mühlbauer and Eichacker, 1998). Energy in the form of ATP, GTP, or the thylakoid pH gradient is also required for the import and insertion of many thylakoid proteins (Keegstra and Cline, 1999; Cline and Dabney-Smith, 2008; Albiniak et al., 2012).
The decrease in polysome loading may underestimate the inhibition of translation in plastids in the dark. It is known that protein synthesis in plastids may be decreased in the dark due to a slower rate of elongation or by ribosome arrest at specific regulatory motifs (Marín-Navarro et al., 2007). The very low LPS-SPS ratio in plastids in the dark (Supplemental Fig. S5) points to the majority of the plastidic polysomes containing only a small number of ribosomes in the dark. This is inconsistent with a general inhibition of elongation but is consistent with ribosome arrest at a small number of specific sites. The LPS-SPS ratio was also always low for mitochondrial polysomes. This is consistent with the predominance of short reading frames and the importance of translation regulation in the mitochondria (MacKenzie and McIntosh, 1999; Giegé et al., 2000).
The differing diurnal response of polysome loading in the plastid and cytosol raises questions with respect to the coordination of translation in these two compartments. Almost all of the plastid-encoded proteins are components of Rubisco or large protein complexes in the thylakoid, which also contain nucleus-encoded proteins (Marín-Navarro et al., 2007). To avoid a cycle of synthesis and degradation of the nucleus-encoded components in the dark, it appears necessary that their transcripts are rapidly degraded in the dark and/or that their translation is strongly decreased in the dark. Incidentally, any preferential inhibition of translation of the nucleus-encoded components of Rubisco and thylakoid complex proteins would make more cytosolic ribosomes available for the translation of other proteins in the dark.
Cytosolic Polysome Loading Tracks Suc Content
Overall polysome loading closely tracks Suc levels during diurnal cycles (Figs. 1, A and F, and 3, A and B). Polysome loading changes rapidly in response to transient changes in Suc levels when Col-0 rosettes are darkened (Fig. 3) and after adding Suc to C-starved seedlings (Supplemental Fig. S3). The transient decrease of Suc after darkening is probably due to a delay until starch degradation commences (Fig. 2). Plants are seldom exposed to sudden darkening in their natural environment and may not have evolved regulatory mechanisms that act to immediately activate starch degradation after a sudden transition. Although sudden darkening is an artificial treatment, it is a useful perturbation to uncover the close temporal connection between changes in Suc and polysome loading.
A meta-analysis revealed a robust correlation between overall polysome loading and rosette Suc content across a large set of experiments in wild-type Col-0 and pgm in diurnal cycles and in Col-0 in low CO2 (Fig. 4; Supplemental Fig. S4). The only data points that show a major deviation are at early times in the light period in pgm, when Suc accumulates to very high levels but polysome loading is still rising. While a definitive explanation for the latter discrepancy is not possible, two explanations appear plausible. One is that the levels of Suc in wild-type Col-0 may suffice to support maximal stimulation of polysome loading. The second is that, like root extension growth (Yazdanbakhsh et al., 2011), there may be a time lag before protein synthesis can be fully reactivated in pgm following a period of acute C starvation in the preceding night. Compartment-resolved analyses (Figs. 5 and 6) indicate that this correlation between polysome loading and Suc is probably driven by changes in cytosolic polysome loading (Fig. 7).
Polysome loading correlated more strongly with Suc than with other metabolites, in particular reducing sugars (Fig. 4B; Supplemental Fig. S2). This is striking because reducing sugars are present at similar levels to Suc and might be a more immediately readily metabolized form of carbohydrate. However, Suc is the form in which C is transported in plants. Whereas Suc levels responded rapidly to changes in photosynthesis and starch breakdown, reducing sugars changed more slowly (Fig. 1). Subcellular fractionation in protoplasts (Stitt et al., 2010) and leaf material of various species (Gerhardt et al., 1987; Winter et al., 1993, 1994; Heineke et al., 1994) have shown that while Suc is largely located in the cytosol, reducing sugars are almost exclusively localized in the vacuole. Recent studies in Arabidopsis also point to Glc and Fru being mainly located in the vacuole (Szecowka et al., 2013), while Suc is partly or mainly in the cytosol (Krueger et al., 2011; Szecowka et al., 2013). Taken together, it appears that polysome loading in leaves responds to changes in the immediate supply of C, as reflected by Suc.
It is nevertheless not yet clear whether Suc is itself responsible for the changes in polysome loading. It is possible that other metabolites that change in a similar manner to Suc may be involved. Polysome loading correlated with ATP levels and the ATP-ADP ratio in Arabidopsis seedlings during the imposition and recovery from hypoxia (Branco-Price et al., 2008). Earlier studies with barley mesophyll protoplasts showed that the ATP-ADP ratio is very high in the light (less than 10) and does not decrease in the dark (Stitt et al., 1982), even during transients in the time scale of seconds (Stitt et al., 1983). However, in principle, it is still possible that changes in Suc are accompanied by small changes in the phosphorylation potential in the cytosol. Subcellular measurements of adenine nucleotide levels in leaves are technically challenging due to their rapid turnover, the large proportion present in plastids, and the differing phosphorylation potentials in the cytosol, plastid, and mitochondria (see above) and require precise corrections for cross contamination. A final decision on whether changes in cytosolic adenylate energy status contribute to changes in polysome loading in leaves during diurnal cycles may require the development of more sensitive methods to monitor the energy status in different subcellular compartments.
Relatively little is known about the molecular details of Suc sensing (Hanson and Smeekens, 2009). The best characterized system involves a translational inhibition mediated by a Suc control peptide present in the uORF2 of five Arabidopsis bZIP family members (bZIP11, bZIP1, bZIP2, bZIP44, and bZIP53) and their potential homologs in other species (Wiese et al., 2004; Rahmani et al., 2009). Transient overexpression of bZIP11 leads to an inhibition of growth, a rapid increase in transcript for the C-starvation indicator gene ASN1 (Hanson et al., 2008; Hanson and Smeekens, 2009), changes in the expression of genes involved in raffinose, myoinositol, and trehalose metabolism, and widespread change in metabolite levels (Ma and Blenis, 2009). However, it is not known if increased bZIP11 expression leads to a general decrease in polysome loading. In many life forms, TOR acts via the SNRK1/AMP-dependent protein kinase to regulate translation in response to energy and nutrient status, acting partly via the phosphorylation of ribosomal protein S6 (Ma and Blenis, 2009). There is evidence for an analogous role in plants (Williams et al., 2003; Mahfouz et al., 2006; Turkina et al., 2011), although the relatively small decrease in polysome loading in mutants with a large decrease in TOR expression (Deprost et al., 2007) indicates that other factors are also involved.
Ribosome Abundance Does Not Change Substantially during Diurnal Cycles
There is mounting evidence that growth is impaired by mutations in ribosome assembly proteins, which decrease overall ribosome abundance (Kojima et al., 2007; Petricka and Nelson, 2007; Fujikura et al., 2009; Horiguchi et al., 2011). Transcripts for cytosolic ribosomal proteins are expressed in a coordinated manner, increasing in conditions when the energy status is thought to be high (Baena-González, 2010). More specifically, transcripts for cytosolic and mitochondrial ribosomal proteins are coordinately induced by sugar (Supplemental Fig. S6). During diurnal cycles, most of these transcripts increase in the light and decrease in the night, and this response is accentuated in the starchless pgm mutant, which has more marked diurnal changes of sugars (Usadel et al., 2008; Supplemental Figs. S6 and S7). Genes involved in ribosome assembly show similar diurnal changes (Supplemental Fig. S9). A small number of genes for cytosolic ribosomal proteins show an opposite response, as recently also shown in a proteomics study (Hummel et al., 2012). In contrast, plastid ribosomal proteins show a much more varied expression pattern (Supplemental Figs. S6 and S8).
To investigate if these diurnal changes of transcripts result in changes in ribosome abundance, we measured the absolute abundance of cytosolic, plastidic, and mitochondrial 18S/16S rRNA as a proxy for ribosome number (Fig. 8). There were no significant changes in the abundance of cytosolic, plastidic, or mitochondrial rRNA in the diurnal cycle or a short extended night. However, there was a slightly lower abundance of plastidic rRNA and an almost 2-fold increase in the abundance of mitochondrial rRNA in pgm compared with wild-type Col-0. This indicates that while changes in C metabolism have little immediate impact on ribosome abundance, they do result in long-term adjustments. The increased level of mitochondrial ribosomes in pgm might speculatively be related to the high rates of respiration in this mutant at the start of the night (Caspar et al., 1985; Gibon et al., 2004b).
In microbes, excess ribosomes are degraded when polysome loading is low (Davis et al., 1986; Kuroda et al., 2001; Zundel et al., 2009). This does not happen at night in plants, even in the pgm mutant, where polysome loading decreases strongly at night. Degradation of ribosomes during the night would necessitate their resynthesis at the start of the next light period, which would represent a considerable energy load (Warner, 1999; Snoep et al., 2006; Houseley and Tollervey, 2009; Zundel et al., 2009). It has already been shown that large diurnal changes of transcripts do not lead to significant changes in the abundance of the encoded proteins for 38 enzymes (Gibon et al., 2004a) and for 2,000 proteins with a wide range of cellular functions, including many ribosomal proteins (Baerenfaller et al., 2012). These proteins presumably have relatively slow turnover times. Piques et al. (2009) used quantitative data about transcript abundance and polysome loading to model the synthesis rates of 38 enzymes and, for most of them, predicted that the rate of synthesis is of the same order as the rate of growth. It is likely that a similar situation holds for ribosomes. The turnover times of ribosomes in plants is not known, but it is on the order of 3 d in mammalian liver (Hirsch and Hiatt, 1966; Nikolov et al., 1987).
Modeling the Balance between C Availability and C Consumption for Protein Synthesis at Night
We used our quantitative data for ribosome abundance and polysome loading to model the rate of protein synthesis and the associated energy costs throughout the diurnal cycle (Fig. 9). Comparison with the measured rates of starch degradation and respiration predicted that a decrease in protein synthesis is required at night to balance energy consumption with the availability of C from starch degradation. These calculations also predicted that costs at night are decreased by using amino acids that are accumulated in the preceding light period (Supplemental Fig. S10).
These calculations require assumptions, in particular, that the rate of elongation is the same in the light and the dark and that all the ribosomes in the polysome fraction are involved in protein synthesis. We tested these assumptions by using 13CO2 labeling to obtain a qualitative estimate of the rates of protein synthesis in the light period and the dark. These measurements indicated that the changes in polysome loading may underestimate the decrease in protein synthesis at night. There are several explanations for this discrepancy. First, the rate of elongation might be decreased in the dark. Second, the ribosome distribution in polysome density gradients may overestimate active ribosomes because some of the ribosomes are arrested. Third, differences in 13C enrichment in the free amino acid precursors may affect our estimates of the rate of protein synthesis. Potential sources of error include decreases in the enrichment of free amino acids in the dark due to the mobilization of weakly labeled C reserves or recycling of unlabeled amino acids released by the degradation of unlabeled proteins. These are unlikely to be responsible for the large decrease in 13C incorporation into protein in the dark. Our experimental protocol will ensure that starch and other major C reserves are almost completely labeled at dusk (see “Results”), and 10 different amino acids provided similar estimates for the rate of protein synthesis in the night compared with the light (0.24–0.37), irrespective of the likelihood that the amino acid will be recycled before it is reequilibrated with labeled pools in central metabolism. The only outlier was Glu (0.87). The C precursor for Glu is 2-oxoglutarate. It was recently shown that 2-oxoglutarate is synthesized from a preformed unlabeled pool of citrate in the light, and this citrate pool is replenished at night using C that was fixed in the previous light period (Tcherkez et al., 2012a, 2012b; Szecowka et al., 2013). This may explain the outlier value for Glu in our experiments. In the future, it will be desirable to obtain information about enrichment in free amino acid pools to further strengthen the estimates of flux to protein.
The overall distribution of ribosomes, and in particular cytosolic polysomes, in density is consistent with protein synthesis being mainly regulated by the rate of initiation (Supplemental Fig. S5). A different picture emerged for the plastid in the dark, where polysomes with two to four ribosomes constitute most of polysome fraction. This, and the fact that elongation and ribosome arrest contribute to the regulation of translation in the plastid (Marín-Navarro et al., 2007), indicate that polysome gradient analyses may overestimate the rate of translation in the plastid at night.
Polysome loading did not decrease to zero in an extended night or in the night in the starchless mutant. This indicates that some protein synthesis continues in the absence of starch. The modeled costs at these times are low (Fig. 9) and are probably overestimates (see above). It is nevertheless likely that protein synthesis continues at a low rate in the absence of starch. Hundreds of transcripts related to C-starvation responses are induced in an extended night in Col-0 or at night in pgm (Gibon et al., 2006; Usadel et al., 2008), the translation of some transcripts is specifically increased in C starvation (Nicolaï et al., 2006), and specific proteins increase in C-starved Arabidopsis rosettes (Gibon et al., 2004a, 2006). C starvation induces autophagy (Brouquisse et al., 1991; Aubert et al., 1996; Contento et al., 2004). In agreement, metabolites that are released by the catabolism of protein, cell wall, and lipids increase in an extended night in Col-0 and during the night in pgm (Gibon et al., 2004b, 2006; Usadel et al., 2008). They could provide energy to support a low rate of protein synthesis when starch is exhausted.
Optimization of Ribosome Utilization
The indirect costs of protein synthesis include the C, nitrogen, and phosphorus invested in ribosomes and the costs of synthesizing and maintaining ribosomes (Warner, 1999; Rudra and Warner, 2004; Snoep et al., 2006). Cells require high concentrations of ribosomes because the rate of ribosome progression along the mRNA is relatively slow (for review, see Mathews et al., 2007), with typical values of four to five and seven to eight amino acids added per second in animal cells at 25°C to 26°C (Lodish and Jacobsen, 1972; Palmiter, 1974) and in yeast cells at 30°C (Arava et al., 2003), respectively. The rate of progression is constrained by the size of the ribosome, the need to unwind secondary structures in the mRNA (Wen et al., 2008), and the need to proofread, which involves pausing after the recruitment of an aminoacyl-tRNA to allow competition with other aminoacyl-tRNA species (Kramer and Farabaugh, 2007; Zaher and Green, 2009a, 2009b).
There is strong selective pressure to minimize these indirect costs by optimizing the use of the translational machinery (Beilharz and Preiss, 2004, 2007; Lackner et al., 2007; Qin et al., 2007). This includes the optimization of codon usage in abundant transcripts (Beilharz and Preiss, 2007; Lackner et al., 2007), the formation of complexes to maximize the efficiency of tRNA use (Cannarozzi et al., 2010), and the maximization of ribosome loading into polysomes. Up to 80% and 60% to 75% of all ribosomes are loaded into polysomes in microbes (Arava et al., 2003; Beilharz and Preiss, 2004; Brockmann et al., 2007) and nonstressed plant tissues (Kawaguchi et al., 2003, 2004; Kawaguchi and Bailey-Serres, 2005; Branco-Price et al., 2008; Piques et al., 2009), respectively.
Indirect costs would be minimized in Arabidopsis by maintaining high rates of protein synthesis through the entire 24-h cycle. However, as already discussed, protein synthesis is decreased at night to balance the direct costs with the rate of C release from starch. A decreased rate of protein synthesis at night will also reduce the direct costs incurred per 24-h cycle. The direct costs include (1) the ATP that is required for amino acid activation and peptide bond synthesis and (2) the NAD(P)H, ATP, and C that are required to convert nitrate into amino acids. In the light, ATP, NAD(P)H, and C are provided by photosynthesis, whereas at night, they are provided by the catabolism of reserves like starch, with a concomitant loss of free energy (Penning de Vries, 1975; Hachiya et al., 2007; Amthor, 2010; Raven, 2012).
To produce a given amount of protein per 24-h cycle, a decreased rate of protein synthesis at night will have to be counterbalanced by an increased rate of protein synthesis in the light. Given that ribosomes are already used intensively in the light, this would require an increase in ribosome abundance and, hence, increased indirect costs. The intermediate values for polysome loading found during the night in Arabidopsis rosettes indicate that there is a tradeoff between direct and indirect costs of protein synthesis. More information is needed about ribosome assembly and turnover in plants to model this tradeoff between direct and indirect costs. Its consequences are likely to be especially important in growing tissues, which have high rates of protein synthesis and high ribosome abundance.
MATERIALS AND METHODS
Plant Growth Conditions and Harvesting
Arabidopsis (Arabidopsis thaliana) accession Col-0 and the pgm mutant (in the Col-0 background) were germinated in soil for 1 week with 16 h of light (20°C in the light and 6°C at night, 200 µE m−2 s−1 florescent light, and 60%–70% relative humidity), transferred to short-day conditions (8 h of light at 20°C, dark at 16°C, 180 µmol m−2 s−1 fluorescent light, and 60%–70% relative humidity), pricked out after day 14 into 10-cm pots, grown under short-day conditions for a further 7 d (Thimm et al., 2004), and then transferred to Percival controlled-environment chambers for a further 2 weeks with 12 h of light (180 µmol m−2 s−1 fluorescent light, 20°C in the day and night). Rosettes were harvested at 35 d at different time points as follows: 0 h, 15 and 30 min, 1, 2, 4, 8, and 12 h of light; 15 and 30 min, 1, 2, 4, and 8 of darkness. On the following day, the plants remained in the dark and further samples were harvested 30 min and 1, 2, 4, and 8 h after the time at which the light period would have commenced. For low-CO2 treatments, the CO2 concentration was adjusted 30 min before the start of the light period until the concentrations in the low-CO2 and ambient-CO2 chambers were about 50 and 480 µL L−1, respectively (Bläsing et al., 2005). Rosettes were harvested at the end of the night and after 2 or 4 h of illumination under ambient and low CO2 concentrations. Experiments with seedlings in liquid culture were performed exactly as described by Osuna et al. (2007).
Immediately following harvest, leaf tissue and seedlings were frozen in liquid nitrogen. Samples were ground to a fine powder, subdivided into aliquots at −70°C using a cryogenic grinding robot (http://www.labman.co.uk/MAPC_Cryogenic_Grinder.html; Labman Automation), and stored until analysis at −80°C.
Polysome Isolation and Analysis
Polysomes were fractionated from crude leaf extracts as described previously (Kawaguchi et al., 2003; Piques et al., 2009). Gradients were divided into 14 fractions of approximately 350 µL using a programmable density gradient fractionation system (Teledyne Isco), which continuously recorded the A 254 (ribosome profile). Polysome levels were determined by calculating the area under the polysome profile after subtracting the gradient baseline absorbance (absorbance of a gradient loaded with extraction buffer). The area of each polysome profile was normalized to an equal value to correct for differences in sample loading. Levels of NPS (the gradient region containing messenger ribonucleotide protein complexes, 40S/60S and 30S/50S ribosome subunits, 70S/80S ribosomes, and one ribosome per transcript), SPS (the gradient region containing two to four ribosomes per mRNA), and LPS (the gradient region containing five or more ribosomes per transcript) were determined by calculating corresponding peak areas of the gradient regions.
Isolation and Analysis of rRNA Species
Ribosome number was calculated by determining the amounts of the small subunits of cytosolic, plastidic, and mitochondrial rRNAs by qRT-PCR and assuming that each of these ribosomal RNAs corresponds to one ribosome (Piques et al., 2009). The absolute quantification of rRNA species in the unfractionated total RNA was done by isolating total RNA from 0.25 mg (fresh weight) of rosette leaves using the RNeasy Plant Mini Kit (Qiagen). Ten milligrams of frozen leaf powder was first homogenized with 1 mL of RLC buffer and then diluted in the same buffer to obtain a final fresh weight of 0.25 mg. Absolute quantification of total rRNA species was performed as described by Piques et al. (2009) with modifications. Gradient fractions corresponding to NPS (1–6), SPS (7–9), and LPS (10–14) were combined, and an equal volume of 8 m guanidine hydrochloride was added to inactivate the RNases. Aliquots from the fractions containing 0.25 mg of initial fresh weight were spiked with a mix of the eight artificial poly(A+) RNAs (Ambion/Life Technologies) in the dynamic range 9.6E+12 to 3.75E+10 copy number artificial RNA g−1 fresh weight. RNA was then precipitated with 2 volumes of ethanol at −20°C overnight. After centrifugation at 12,000g for 30 min, the RNA pellet was resuspended in 450 µL of RLC buffer from the Plant RNeasy Mini kit (Qiagen), and RNA was recovered following the manufacturer’s protocol and digested using Turbo DNA-free DNase I (Ambion/Life Technologies) following the manufacturer’s instructions. Complementary DNA was synthesized with 5 to 50 ng of total DNase I-treated RNAs, a mixture of oligo(dT)20 primers (100 ng), and random hexamers (0.1 nmol) using the SuperScript III First-Strand Synthesis System (Invitrogen/Life Technologies), according to the manufacturer’s instructions. qRT-PCR was performed in a volume of 10 µL with 1:1,000 and 1:50 dilutions of the complementary DNAs obtained from unfractionated and polysomal RNAs, respectively, and 200 nm of each gene-specific primer pair. Power SYBR Green PCR Master Mix (Applied Biosystems/Life Technologies) was used to monitor double-stranded DNA synthesis. Standard curves for the eight spike-in controls always had r 2 values greater than 0.98. They were used to calculate the abundance (copy number g−1 fresh weight) of the cytosolic, plastidic, and mitochondrial ribosomes in the whole extract and in fractions from polysome density gradients. The primers used to amplify the genes for the cytosolic, plastidic, and mitochondrial small subunit rRNAs and the spike-in controls were designed as described by Piques et al. (2009) and Pyl et al. (2012). A list of primers is provided in Supplemental Table S1.
Metabolites
Suc, Glc, and Fru were determined in ethanol extracts as described by Geigenberger et al. (1996), starch and Glc-6-P as described by Gibon et al. (2004b), and total amino acids as described by Gibon et al. (2009). Assays were prepared on 96-well microplates using a multiprobe pipetting robot (Perkin-Elmer). The absorbances were read at 340 or 570 nm in a Synergy or ELX-800-UV microplate reader (Bio-Tek). Maltose was determined using HPLC based on Fulton et al. (2008); 100 mg of finely powdered material was extracted with 500 µL of 1.5 m perchloric acid on ice for 30 min, neutralized (with 2 m KOH, 0.4 m MES, and 0.4 m KCl), and stored at −20°C until further analysis. Aliquots of 100-µL extracts were then sequentially applied to 1.5-mL columns of Dowex 50 W and Dowex 1 (Sigma-Aldrich), eluted with 4 mL of water, lyophilized, and redissolved in 100 µL of water. Maltooligosaccharides were separated by High Performance Anion Exchange Chromatography with Pulsed Amperometric Detection (Dionex DX 500), using a CarboPac PA-100 column set eluted using a gradient mixing eluent A (100 mm NaOH) and eluent B (150 mm NaOH and 500 mm NaOAc), such that the proportion of eluent B was constant from 0 to 5 min (4% B) and increased linearly from 4% to 41% between 5 and 25 min and from 41% to 80% between 25 and 32 min. Between 32 and 39 min, the proportion of eluent B decreased linearly from 80% to 4% B, and it was constant (4%) between 40 and 42 min.
13CO2 Feeding Experiments
13CO2 feeding experiments were performed as described by Szecowka et al. (2013) with modifications. 13CO2 feeding was carried on in a Plexiglas box (internal dimensions, 60 × 31 × 17.4 cm), applying a stream of premixed air containing 400 µL L−1 13CO2, 21% oxygen, and 79% nitrogen in a Percival controlled-environment chamber. The gas content in the box was completely replaced in 20 min with a flow rate of 5 L min−1. The photon flux density and temperature inside the box were maintained at approximately 150 µmol m−2 s−1 and 20°C/18°C in light/dark, respectively. Plants were grown in an 8/16-h photoperiod and were used at 28 d after germination. Labeling started 1 h before dawn and was continued through an entire light and dark period. Rosette leaves were harvested for analysis before starting labeling, at the end of the light period, and at the end of the night (8 and 24 h after starting labeling, respectively). Total protein was extracted from the equivalent of 30 mg fresh weight of frozen powder. Starting with the pellet remaining after metabolite extraction, as described by Szecowka et al. (2013), total protein was resuspended in 6 m urea/2 m thiourea solution, precipitated with 15% (v/v) ice-cold TCA, and washed with ice-cold 100% (v/v) acetone. The protein pellet was then chemically hydrolyzed with 6 m hydrochloric acid at 100°C for 24 h at atmospheric pressure to release amino acids (Williams et al., 2010). The hydrolyzed proteins were analyzed by gas chromatography-mass spectrometry to quantify the level of each isotopomeric form of Glu, Asp, Ala, Ser, Gly, Ile, Val, Lys, Phe, Tyr, and Pro (Schwender and Ohlrogge, 2002; Szecowka et al., 2013). Signals were too weak to allow precise quantification for other amino acids. Enrichment was calculated as described by Szecowka et al. (2013). A list of masses is given in Supplemental Table S6.
Supplemental Data
The following materials are available in the online version of this article.
Supplemental Figure S1. Representative example of polysome profiles at the end of night and 2 h into the light period.
Supplemental Figure S2. Regression plots of metabolites against polysome loading.
Supplemental Figure S3. Representative profile of polysome loading after the addition of Suc to C-starved Arabidopsis Col-0 seedlings.
Supplemental Figure S4. Meta-analysis of overall polysome loading at different times in the diurnal cycle and the relation between polysome loading and rosette Suc content in five independent studies performed over a period of 3 years.
Supplemental Figure S5. Changes in the ratio between the small polysome fraction and the large polysome fraction.
Supplemental Figure S6. Light, sugar, clock, and measured and predicted diurnal responses of transcripts for ribosomal proteins.
Supplemental Figure S7. Comparison of sugar and diurnal responses of transcripts for cytosolic ribosomal proteins.
Supplemental Figure S8. Comparison of sugar and diurnal responses of transcripts for plastidic ribosomal proteins.
Supplemental Figure S9. BRIX, nucleolin organizer, and ribosome biogenesis proteins.
Supplemental Figure S10. Modeled rates of protein synthesis in this study compared with the change in total amino acid levels between dusk and dawn.
Supplemental Table S1. Primers for the determination of cytosolic 18S rRNA, plastidic 16S rRNA, and mitochondrial 16S rRNA and external RNA standards.
Supplemental Table S2. Metabolite levels, polysome loading, and ribosome abundance in wild-type Col-0 and pgm in diurnal cycles and an extended night.
Supplemental Table S3. Cytosolic, plastidic, and mitochondrial rRNA abundance in NPS, SPS, and LPS fractions from polysome gradients of rosettes sampled at the end of the day and at various times during the night.
Supplemental Table S4. Metabolites, polysome loading estimated by A 254, and cytosolic plastidic, and mitochondrial ribosome abundance in the NPS, SPS, and LPS fractions at the end of the night and after 2 h of illumination at subcompensation point and ambient CO2.
Supplemental Table S5. Modeling of the costs of protein synthesis.
Supplemental Table S6. Measurement of the rate of protein synthesis in the light period and in the night in Col-0.
Supplemental Text S1. Explanation for Supplemental Figures S6 to S9.
ACKNOWLEDGMENTS
We are grateful to an anonymous referee for many insightful comments and to Ralph Bock for discussions on the regulation of translation in plastids and mitochondria
Glossary
- C
carbon
- NPS
nonpolysome
- SPS
small polysome
- LPS
large polysome
- qRT
quantitative reverse transcription
- rRNA
ribosomal RNA
LITERATURE CITED
Mathews MB, Sonenberg N, Hershey JWB (2007) Origins and principles of translational control. In MB Mathews , N Sonenberg, JWB Hershey, eds, Translational Control in Biology and Medicine. Cold Spring Harbor Laboratory Press, Cold Spring Harbor, NY, pp 1–40
Morot‐Gaudry JF, Job D, Lea PJ (2001) Amino acid metabolism. In PJ Lea, JF Morot‐Gaudry, eds, Plant Nitrogen. Springer-Verlag, Berlin, pp 167–211
Pate JS (1989) Synthesis, transport and utilization of products of nitrogen metabolism. In JE Poulsen, JT Romeo, EE Conn, eds, Plant Nitrogen Metabolism. Plenum Press, New York, pp 65–115
Author notes
This work was supported by the Max Planck Society, the German Ministry for Education and Research, and the European Commission FP7 collaborative project TiMet (contract no. 245143).
These authors contributed equally to the article.
Present address: National University of Galway, Plant Systems Biology Laboratory, Plant and AgriBiosciences Research Centre, Botany and Plant Science, Galway, Ireland.
Present address: University of North Texas, Department of Biological Sciences, 1155 Union Circle 305220, Denton, TX.
Present address: RWTH Aachen University, Institute for Biology I, Worringer Weg 1, 52056 Aachen, Germany.
Corresponding author; e-mail [email protected].
The author responsible for distribution of materials integral to the findings presented in this article in accordance with the policy described in the Instructions for Authors (www.plantphysiol.org) is: Mark Stitt ([email protected]).
The online version of this article contains Web-only data.
Open Access articles can be viewed online without a subscription.
