


Abstract
The Nannochloropsis genus contains oleaginous microalgae that have served as model systems for developing renewable biodiesel. Recent genomic and transcriptomic studies on Nannochloropsis species have provided insights into the regulation of lipid production in response to nitrogen stress. Previous studies have focused on the responses of Nannochloropsis species to short-term nitrogen stress, but the effect of long-term nitrogen deprivation remains largely unknown. In this study, physiological and proteomic approaches were combined to understand the mechanisms by which Nannochloropsis oceanica IMET1 is able to endure long-term nitrate deprivation and its ability to recover homeostasis when nitrogen is amended. Changes of the proteome during chronic nitrogen starvation espoused the physiological changes observed, and there was a general trend toward recycling nitrogen and storage of lipids. This was evidenced by a global down-regulation of protein expression, a retained expression of proteins involved in glycolysis and the synthesis of fatty acids, as well as an up-regulation of enzymes used in nitrogen scavenging and protein turnover. Also, lipid accumulation and autophagy of plastids may play a key role in maintaining cell vitality. Following the addition of nitrogen, there were proteomic changes and metabolic changes observed within 24 h, which resulted in a return of the culture to steady state within 4 d. These results demonstrate the ability of N. oceanica IMET1 to recover from long periods of nitrate deprivation without apparent detriment to the culture and provide proteomic markers for genetic modification.
Microalgae act as sunlight-driven cellular factories that can convert carbon dioxide into valuable commodities (Spolaore et al., 2006; Chisti, 2007). Specifically, microalgae have received considerable attention as potential next-generation feedstocks for advanced biofuels, such as biodiesel derived from microalgal oils and photobiologically produced biohydrogen (Scott et al., 2010; Stephens et al., 2010; Wijffels and Barbosa, 2010). Microalgae have several advantages when compared with other sources of biodiesel production. For example, many algae are highly efficient in their photosynthetic capabilities when compared with land plants, and their lipid content can exceed 50% by weight of the dry biomass (Hu et al., 2008; Rodolfi et al., 2009). Microalgae can be cultivated in seawater, brackish water, or waste water and do not compete for arable land with conventional agricultured species. In addition, the biochemical composition of the algal biomass can easily be modulated by varying growth conditions, resulting in higher oil content (Wijffels and Barbosa, 2010).
Nutrient stress can strongly influence microalgal metabolism, including photosynthesis and lipid content. In the reference green alga Chlamydomonas reinhardtii, the pigment levels in nitrogen-limited cells were reduced and the rates of synthesis of photosynthetic proteins were reduced 10- to 40-fold, suggesting that nitrogen availability affects chloroplast protein synthesis (Plumley and Schmidt, 1989). Under nitrogen stress, five marine microalgal species, Dunaliella tertiolecta from chlorophyta, Isochrysis galbana from haptophyta, and Thalassiosira pseudonana, Thalassiosira weisflogii, and Skeletonema costatum from diatoms showed substantial decreases in photosynthetic energy conversion efficiency in PSII (Kolber et al., 1988). Silva et al. (2009) reported that in the marine cryptophyte Rhodomonas spp., nitrogen starvation triggered a rapid decline in hydrosoluble proteins, photosynthetic pigments, and photosynthetic efficiency and an increase in total carbohydrate content, suggesting that protein nitrogen from biliproteins was mobilized. Taken together, these studies may suggest that the reduced photosynthesis is a common response of many eukaryotic algae to nitrogen starvation. Insufficient cellular nitrogen is one of the most efficient factors affecting lipid metabolism in many algal lineages. Increased lipid content, particularly triacylglycerols, under nitrogen deprivation has been observed in various algal species, including Chaetoceros muelleri (diatom; McGinnis et al., 1997), Parietochloris incise (chlorophyta; Merzlyak et al., 2007), Neochloris oleoabundans (chlorophyta; Li et al., 2008), Nannochloropsis spp. (Eustigmatophyceae; Rodolfi et al., 2009), and C. reinhardtii (Li et al., 2012). Also, overproduction of neutral lipids in a mutant of C. reinhardtii under nitrogen starvation has been achieved through blocking a competing pathway to produce starch (Li et al., 2010). For Nannochloropsis spp., it has been reported that nitrogen shortage can lead to significant accumulation of saturated and monounsaturated fatty acids (Hu and Gao, 2006). These fatty acids are mainly associated with storage triacylglycerols, the preferred substrate for biodiesel production. However, there is a fundamental contradiction between photosynthetic efficiency and lipid production under nutrient stress, making theoretical maximum production impossible. Therefore, in order to maximize the yield of valuable products from microalgae, it is essential to first describe the mechanisms behind the changes in photosynthesis, fatty acid composition, and lipid accumulation on the molecular level.
Nannochloropsis is a genus in the Eustigmatophyceae lineage, ranging in size from 2 to 5 µm and widely distributed in marine, fresh, and brackish waters. They are currently the most promising microalgae that have been cultivated in outdoor ponds and photobioreactors for wide-scale renewable biodiesel production (Rodolfi et al., 2009). Under nitrogen-starvation conditions, many Nannochloropsis spp. can accumulate oil exceeding 60% of its biomass on a dry weight basis. Recently, the draft genome and transcriptome sequencing for Nannochloropsis gaditana under nitrogen starvation have been completed (Radakovits et al., 2012), which have provided new insights into the regulating mechanisms of lipid metabolic pathways. However, transcripts of a few genes involved in lipid biosynthesis are increased significantly during the rapid deprivation of nitrate (Radakovits et al., 2012), suggesting that transcriptome analyses may not accurately reflect the responses of organisms to environmental changes. Also, genetic transformation methods of N. gaditana and the high-efficiency homologous recombination transformation method of Nannochloropsis spp. have become available (Kilian et al., 2011; Radakovits et al., 2012), which have permitted the genetic and metabolic engineering of Nannochloropsis spp. Proteomics allows for direct observation of changes in an organism’s protein pool and, thus, is a worthy complement to nucleic acid sequencing for studying how molecular-level pathways drive physiological responses. It is unquestionable that proteomic study will further detail the pathway of lipid metabolism and provide more clues and targets for genetic modification of Nannochloropsis spp.
Nannochloropsis oceanica IMET1 is an oleaginous microalga that has been commonly used in fish hatcheries as feed for rotifers (Lubzens et al., 1995). IMET1 has been widely distributed in various research institutions and industries because it has high biomass productivity and lipid production rate. It has been reported that IMET1 was able to produce 69% lipid (dry weight) in a 23-d batch culture (Xiao et al., 2013), which is higher than that (60% of dry weight) of several other Nannochloropsis spp. reported by Rodolfi et al. (2009). Therefore, IMET1 is a good candidate for development into a model organism for algal biofuel production. In this study, a comparative two-dimensional gel electrophoresis proteomic approach coupled with mass spectrometry (MS) was used for examining proteome changes in N. oceanica IMET1 under long-term nitrate depletion. These data will provide new mechanistic insights into physiological responses, especially lipid metabolism of oleaginous microalgae, to nitrogen starvation on the level of the proteome.
RESULTS
Physiological Responses under Long-Term Nitrogen Starvation and Recovery
The N. oceanica IMET1 culture was grown in an artificial seawater medium (Berges et al., 2001) with initial nitrate and phosphate concentrations of 1,765 and 17.45 μmol L−1, respectively. From day 1 to 7, cell density increased from 4.45 × 10⁶ to 25.9 × 10⁶ cells mL−1, and in vivo chlorophyll a (Chl a) increased from 29 to 143 μg mL−1 (Fig. 1A), indicating that the culture was in exponential growth. From day 7 to 10, in vivo Chl a increased and peaked on day 10, but cell density dropped to 22.2 × 10⁶ cells mL−1 (Fig. 1A), suggesting that cell division had ceased. The concentrations of nitrate and phosphate in the medium decreased exponentially to 133.87 and 0.41 μmol L−1, respectively, on day 10 (Table I). During the first 5 d of growth, there was a slight reduction in cell size (from 3.0 ± 0.35 µm to 2.66 ± 0.32 µm), with the size remaining constant for the full remaining period of the experiment (2.70 ± 0.08 µm [n = 31]; Supplemental Fig. S1). The nitrogen within the cells as a percentage of dry mass was highest on day 10, 1.7 times that on day 5 (Fig. 2A). Therefore, for the purposes of this study, day 10 is considered to be the last day of nitrogen repletion.
![Growth curve of N. oceanica IMET1 under semicontinuous pH controlled growth conditions. N. oceanica IMET1 was cultured in 10 L of medium made from artificial seawater supplemented with nutrients and bubbled with a sterile air/CO2 mixture to support growth. A, Cell density and in vivo Chl a fluorescence as a function of culture time. Arrows indicate when the nitrogen starvation started and when nitrogen was resupplied to the culture. The experiment was repeated two times. Each data point is the average of three replicates, and error bars represent sd. B, Time course of total cell number in culture when 2 L of culture sampled each time was considered. [See online article for color version of this figure.]](https://oup.silverchair-cdn.com/oup/backfile/Content_public/Journal/plphys/162/2/10.1104_pp.113.214320/2/m_plphys_v162_2_1110_f1.jpeg?Expires=1747894321&Signature=ALGWAIxLiCFxbnL~Oabsv~NwHB802dVDeJ143ouj7s7at4ssvk1FfWQhvNDXJSLyh4I6qyFFmoKzWxDw0JjN~DKldFrsEgJQy-Gg6nMDMvoQ6drLvdYGNc7vcPnzYnm1sU727RPY7wszOahjaVlJv3WSo9VF8c8~XQL8FqzUgpglqFbj5Jc2JHQ23JfMi~6bhSWruT7Ok6M0P~xkHIWfRO8MOC7iAXtTzR~4JOhRDtcwQew1XD-TJv2MwGBUCfiteYVq9eL~QV4XoQgYGUxB9bXRmJuN8vF-qwmia7ttp4ZEt9d7JD7PBBt103dAGPKsQrTQNLoWL-lgWuG~UwyJ9g__&Key-Pair-Id=APKAIE5G5CRDK6RD3PGA)
Growth curve of N. oceanica IMET1 under semicontinuous pH controlled growth conditions. N. oceanica IMET1 was cultured in 10 L of medium made from artificial seawater supplemented with nutrients and bubbled with a sterile air/CO2 mixture to support growth. A, Cell density and in vivo Chl a fluorescence as a function of culture time. Arrows indicate when the nitrogen starvation started and when nitrogen was resupplied to the culture. The experiment was repeated two times. Each data point is the average of three replicates, and error bars represent sd. B, Time course of total cell number in culture when 2 L of culture sampled each time was considered. [See online article for color version of this figure.]
The biochemical and nutrient parameters in medium during chronic nitrate depletion and after nitrate addition
The experiment was repeated two times. Nitrate concentration was measured two times, and data from the second experiment are presented here.
| Day | Salinity | pH | NH4 + | NO2 − | PO4 3− | NO3 − |
|---|---|---|---|---|---|---|
| µs cm−1 | µmol L−1 | |||||
| 4 | 28.9 | 8.08 | 0.56 | 16.74 | 0.31 | 848.39 |
| 5 | 29.5 | 8.25 | 0.56 | 11.52 | 0.37 | 650 |
| 7 | 29.5 | 8.23 | <0.56 | 6.30 | 0.26 | 251.61 |
| 10 | 30.1 | 8.22 | <0.56 | <0.22 | 0.41 | 133.87 |
| 12 | 25.2 | 7.86 | <0.56 | 0.22 | 0.79 | 9.84 |
| 14 | 26 | 7.86 | <0.56 | 0.65 | 0.57 | 0 |
| 21 | 30 | 8.05 | <0.56 | 0.22 | 0.66 | 0 |
| 26 | 29.5 | 8.01 | <0.56 | 0.22 | 0.52 | 0 |
| 28 | 31 | 7.77 | <0.56 | 0.22 | 0.41 | 0 |
| 13 | 27.6 | 8.29 | 1.11 | 0.22 | 0.42 | 0 |
| 16 | 28.7 | 8.19 | 1.11 | 0.87 | 1.23 | 0 |
| 19 | 28.9 | 8.25 | 22.22 | 0.87 | 1.39 | 0.97 |
| 24 | 27.1 | 8.30 | 0.56 | 0.22 | 0.49 | 0 |
| 31 | 30 | 8.30 | 0.56 | 0.22 | 0.31 | 0 |
| 32 | 30.3 | 8.09 | 1.67 | 116.52 | 1.17 | 246.77 |
| 33 | 30.9 | 8.17 | 2.22 | 7.39 | 0.36 | 0 |
| 34 | 28.9 | 8.27 | 2.22 | 2.17 | 0.42 | 0 |
| 35 | 30.7 | 7.99 | 1.11 | 1.74 | 0.60 | 0.65 |
![A, Time course of changes in cellular carbon and nitrogen. Arrows indicate when the nitrogen starvation started and when nitrogen was resupplied to the culture. B, Cellular dissolved protein content at the 10-, 16-, 31-, and 32-d sampling points. Cultures from the four points were used as studies of proteomics. Days 16 and 31 (nitrate depletion) were compared with day 10 (nitrate repletion), while day 32 was compared with day 31. Asterisks indicate significant differences determined by an independent Student’s t test (*P < 0.05, **P < 0.001). The experiment was repeated two times, and the values are means ± sd (n = 6). [See online article for color version of this figure.]](https://oup.silverchair-cdn.com/oup/backfile/Content_public/Journal/plphys/162/2/10.1104_pp.113.214320/2/m_plphys_v162_2_1110_f2.jpeg?Expires=1747894321&Signature=4sPJbSKgRohhW1wrc~VGyenrXRLtYJB9brvMNYRjGI9ojfH8Ll4YzEGdhlhdM7Ze-Q6Svz7Ox37NRs~G2e8XNPfRNznUN6Bi52CScHu261DG~t7wLbB3dU5PiDpOn9GQxZpYWBX9J-chl9HWNoy8IaQs4fXqfs-0H-hjWik~FWHbfJBl-5gXVxvZ5xN4RHwGJ4w3DwRSl-8aU20Rl~4Q6QEPagH701gBz68Y74wLl43h0Ol9s3lEiMVsfs7sdeDZqIdm93-02PM~IOGEb3m4aBebNVSzdNz41w-yE6aqji9fvPG-1z~jcbp8eJSmYGw4iWKrnyuJZhwRd1gZN~Ipvg__&Key-Pair-Id=APKAIE5G5CRDK6RD3PGA)
A, Time course of changes in cellular carbon and nitrogen. Arrows indicate when the nitrogen starvation started and when nitrogen was resupplied to the culture. B, Cellular dissolved protein content at the 10-, 16-, 31-, and 32-d sampling points. Cultures from the four points were used as studies of proteomics. Days 16 and 31 (nitrate depletion) were compared with day 10 (nitrate repletion), while day 32 was compared with day 31. Asterisks indicate significant differences determined by an independent Student’s t test (*P < 0.05, **P < 0.001). The experiment was repeated two times, and the values are means ± sd (n = 6). [See online article for color version of this figure.]
From day 10 to 31, 2 L of culture was replaced with medium without nitrate every 2 to 3 d. Cell density and in vivo Chl a were gradually decreased and were close to the starting point by day 31 (Fig. 1A). Nevertheless, when cells in the sampled 2 L of culture were considered, total cells fluctuated in a narrow range after day 13 (Fig. 1B). Nitrate in the medium was depleted quickly and was below the detectable limit by day 14 (Table I). As nitrate in the medium was removed, cellular nitrogen was also reduced (Fig. 2A). The percentage nitrogen (dry weight) was reduced from 6.6% on day 10 to 2.1% on day 31, and cellular dissolved protein content was reduced from 44.4 μg (108 cells)−1 on day 10 to 14.8 μg (108 cells)−1 on day 31 (Fig. 2). As a nitrogenous macromolecule, total Chl a per cell showed a continuous decrease (Fig. 3B). However, Chl a levels never reached zero during nitrate depletion, indicating mechanisms in place to maintain some photosynthetic capacity. The reduction of Chl a and the likely remodeling of the photocenters caused by nitrogen deficiency also had an effect on photosynthetic efficiency. Maximum photochemical efficiency of PSII in the dark-adapted state (F v/F m) was gradually reduced from 0.623 on day 10 to 0.179 on day 31 (Fig. 3A), and carbon uptake per cell as a function of C14 bicarbonate assimilation was gradually reduced following nitrogen deprivation (Fig. 4A). Meanwhile, F v/F m and electron transport rate (ETR) of nitrogen-depleted cultures were decreased significantly (P < 0.001) when compared with nitrogen-replete cultures (Fig. 5). Carbon and nitrogen metabolism are closely linked, since the assimilation of nitrate to amino acids and nitrogenous compounds requires reducing equivalents and carbon skeletons. The minor fluctuation in percentage carbon (dry weight) in opposition to the decline in percentage nitrogen during the long-term nitrogen starvation (Fig. 2A) suggests that the metabolism has shifted toward nitrogen recycling and carbon sequestration.
![A, Time course of photosynthetic efficiency parameters (F v/F m and ETR) in N. oceanica IMET1 under semicontinuous pH controlled growth conditions. B, Time course of cellular pigment changes in N. oceanica IMET1 under semicontinuous pH controlled growth conditions with depleted nitrate. Arrows indicate when the nitrogen starvation started and when nitrogen was resupplied to the culture. [See online article for color version of this figure.]](https://oup.silverchair-cdn.com/oup/backfile/Content_public/Journal/plphys/162/2/10.1104_pp.113.214320/2/m_plphys_v162_2_1110_f3.jpeg?Expires=1747894321&Signature=cSS-qa-ejTaaIWj-Rl7YVDmO8I~jbZ3K9cX6HikQIz8JcrFt-4x2VUUTwQsJTIuE8MPu6xevdzgNaslmDbGMBOlB~zffevGCleu8am5wSeHFi3heSyJ-T7sMJW3MLqt28Snsic5NthfPtAnMI4w2SsuU2~LiqMeByAB2wLzPrZay8MVeeQVo9DQqwZXuCDx2NQiOTULej-73pF5PclXWYeyuOHewkQDSj2KaO1YRHZxAz1a7uVfiOiFl4AhgJQbxgc-m2k7eiypzPIBqjOFpNKjXz1nuttAuX4LMFJaWIX-cd-VsAZ~20cn01SJLMtVOzXUgLFG7Pso2JJmllBfx3Q__&Key-Pair-Id=APKAIE5G5CRDK6RD3PGA)
A, Time course of photosynthetic efficiency parameters (F v/F m and ETR) in N. oceanica IMET1 under semicontinuous pH controlled growth conditions. B, Time course of cellular pigment changes in N. oceanica IMET1 under semicontinuous pH controlled growth conditions with depleted nitrate. Arrows indicate when the nitrogen starvation started and when nitrogen was resupplied to the culture. [See online article for color version of this figure.]

Time course of photosynthetic carbon fixation rates of N. oceanica IMET1 grown under nitrate repletion, nitrate depletion, and nitrate addition in the light (A) and carbon fixation rates of day 14 and day 21 in the dark (B). Each time point is the average of three replicates, and error bars represent se. Days 14, 21, 26, and 28 (nitrate depletion) were compared with day 10, and days 35 and 32 (nitrate addition) were compared with day 28. Asterisks indicate significant differences determined by an independent Student’s t test (*P < 0.05, **P < 0.01).
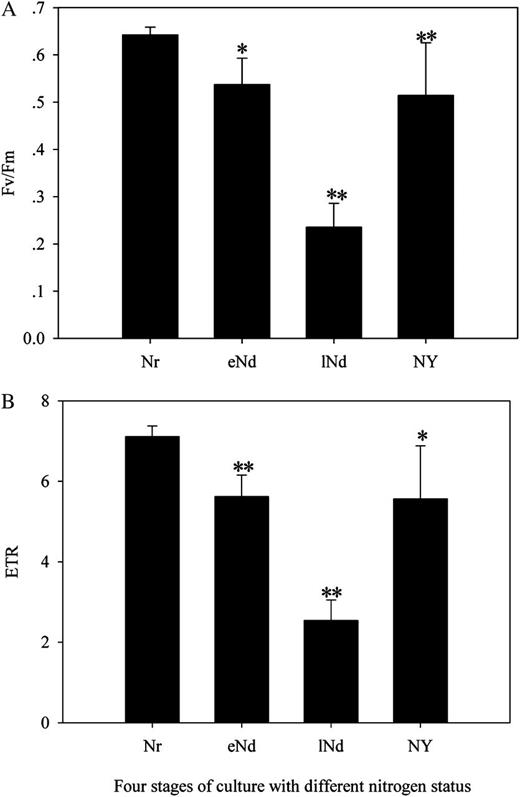
F v/F m (A) and ETR (B) of N. oceanica IMET1 grown under nitrate repletion, nitrate depletion, and nitrate addition. Nr, Mean IMET1 grown under nitrate repletion (n = 7) from day 3 to day 10; eNd, mean IMET1 grown under early nitrate depletion (n = 6) from day 14 to day 20; lNd, mean IMET1 grown under late nitrate depletion (n = 6) from day 25 to day 31; Ny, mean IMET1 grown under nitrate addition (n = 6) from day 32 to day 39. eNd and lNd were compared with Nr, while Ny was compared with lNd. Statistical analysis was performed with an independent Student’s t test. Significance values are expressed as follows: *P < 0.05, **P < 0.001.
It was observed that algal cells changed in color from green to yellow (on day 14) to light yellow (on day 28) during long-term nitrate depletion, which is analogous to the color change during leaf senescence or accelerated cell death caused by various biotic or abiotic stresses (Matile et al., 1999). Based on the results of pigment analysis, Chl a was decreased from 96 ng (106 cells)−1 during log-phase growth to 5 ng (106 cells)−1 during nitrate depletion and then remained steady (Fig. 3B). Violaxanthin and carotenoid in the cells following nitrogen depletion were reduced to 15% and 4% of initial levels, respectively (Fig. 3B; Supplemental Table S1). However, zeaxanthin exhibited a different profile in that it decreased from 0.5 ng (106 cells)−1 to 0.26 ng (106 cells)−1 during log-phase growth, followed by an increase to 0.75 ng (106 cells)−1 during nitrogen depletion (Fig. 3B; Supplemental Table S1). Analogously, the ratio of Chl a to carotenoid presented a profile similar to that of zeaxanthin (Supplemental Table S1). In addition, Chl a, violaxanthin, and carotenoid were decreased significantly (P < 0.05), and the ratio of Chl a to carotenoid was increased significantly (P < 0.05) in nitrogen-depleted cultures when compared with nitrogen-replete cultures (Fig. 6). These results demonstrate that the yellowing of algal cells was due to proportional changes between Chl a and accessory pigments.

Pigment content (Chl a) and the ratio of Chl a to carotenoid (A) and carotenoid, violaxanthin, and zeaxanthin (B) of N. oceanica IMET1 grown under nitrate repletion and nitrate depletion. Nr, Mean IMET1 grown under nitrate repletion (n = 4) from day 3 to day 6; Nd, mean IMET1 grown under nitrate depletion (n = 4) from day 14 to day 24. Nd was compared with Nr. Error bars represent se. Asterisks indicate significant differences determined by an independent Student’s t test (P < 0.05).
It is noteworthy that in the four pigments determined, only zeaxanthin content per cell showed a continuous upward trend after day 10 (Fig. 3B). Zeaxanthin can counterbalance the heat-induced disorganization of the photosynthetic membranes and protect against peroxidative damage (Havaux, 1998). In this study, increases in zeaxanthin content relative to other pigments indicate that the light-harvesting centers were modified and that zeaxanthin was likely used for photoprotection and thermal dissipation of absorbed light, since available photons exceeded the cell capacity for photosynthesis.
Following nitrogen depletion, the lipid content gradually increased and reached 37.4% and 58.7% of dry weight after the 16- and 31-d cultures, respectively, which were significantly greater (P < 0.05, P < 0.001) than that of nitrogen-replete cultures (24.8% of dry weight on day 10; Fig. 7A). The lipid content we determined was slightly lower than the value of the IMET1 reported previously (Xiao et al., 2013). It might be due to the cultivation system and the method of lipid extraction. Also, electron microscopy analyses confirmed that big lipid droplets were present in algal cells on day 13 and 28 (Fig. 8), suggesting that the accumulation of substantial lipid occurs in cells following nitrogen depletion. Since photosynthesis was still occurring to some degree during nitrogen depletion (Figs. 3A and 4A), these lipids were likely to derive partly from newly assimilated carbon. The time course of the fatty acid profile during the whole culture is presented in Supplemental Table S2. Generally, total fatty acid content gradually increased from 7.5% on day 10 to 55.4% of dry weight on day 31 as nitrogen was depleted (Fig. 7B). However, the maximum fatty acid productivity (113.9 mg L−1 d−1) was observed on day 21 (Fig. 7B), indicating that the biomass decrease caused by the reduction of photosynthesis surpassed the increase of fatty acid content after day 21. It is also expected that day 21 will be the optimal harvesting time when the culture system is enlarged. Thus, we will be able to obtain a tradeoff between algal growth and high oil content by manipulating the maintenance protocol.
![A, Percentage lipid content at the 10-, 16-, and 31-d sampling points. Samples from the three points were used as studies of proteomics. Days 16 and 31 (nitrate depletion) were compared with day 10 (nitrate repletion). Asterisks indicate significant differences determined by an independent Student’s t test (*P < 0.05, **P < 0.001). The experiment was repeated two times, and the values are means ± sd (n = 6). B, Time course of changes for cellular content of fatty acids (dry weight) and fatty acid production (mg L−1 d−1) after nitrate removal and addition. The values represent averages of two replicates, with error bars indicating sd. Arrows indicate when the nitrogen starvation started and when nitrogen was resupplied to the culture. [See online article for color version of this figure.]](https://oup.silverchair-cdn.com/oup/backfile/Content_public/Journal/plphys/162/2/10.1104_pp.113.214320/2/m_plphys_v162_2_1110_f7.jpeg?Expires=1747894321&Signature=PjyhDANsQBZtU~eJ0CFNYfleF2A7G-LrIH2JKTz4DIQcQfEo8K7gwZ1yjsaYEyeqkLkuRso2zWrkf6RO9geCKxPc0FnTPRLpgbiezd7da8XmyQdtPZNk25ZAYjkdH1z9J8KvD0q43k2WKW5KpeVsH70Hpui2G~uR2Y3iG0sDFspo9LtxPlI4K6u-ECWAUWr3UvPU-5IgkciErAQzdFs84eyKHuuknXmrkXhAV92LqD6JU7OA9au~RpnnEAfn3uBEbHzAxqXOD0-pVGIvMKdmf-RfLfwYUQ6FnLW-0sSXvtBztoYIZ~hTgzgP-qGtEPgdBKAE7t9EkT2i3~9ok0GZFg__&Key-Pair-Id=APKAIE5G5CRDK6RD3PGA)
A, Percentage lipid content at the 10-, 16-, and 31-d sampling points. Samples from the three points were used as studies of proteomics. Days 16 and 31 (nitrate depletion) were compared with day 10 (nitrate repletion). Asterisks indicate significant differences determined by an independent Student’s t test (*P < 0.05, **P < 0.001). The experiment was repeated two times, and the values are means ± sd (n = 6). B, Time course of changes for cellular content of fatty acids (dry weight) and fatty acid production (mg L−1 d−1) after nitrate removal and addition. The values represent averages of two replicates, with error bars indicating sd. Arrows indicate when the nitrogen starvation started and when nitrogen was resupplied to the culture. [See online article for color version of this figure.]
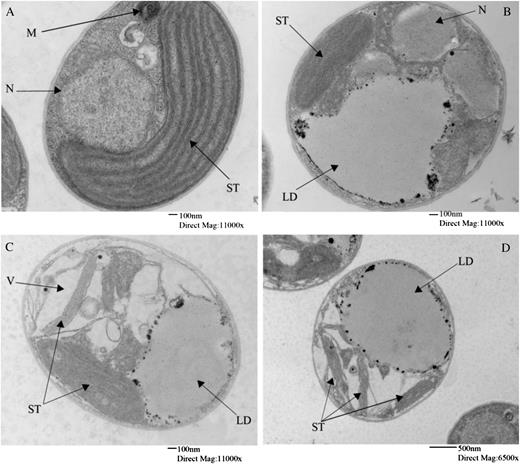
Ultrastructure of Nannochloropsis spp. cells during nitrate depletion. Electron micrographs show a representative cell grown in replete medium on day 4 (A) and representative cells grown in nitrogen-deficient medium on day 13 (B) and day 28 (C and D). LD, Lipid droplets; M, mitochondrion; N, nucleus; ST, stacks of thylakoids; V, vacuoles. Bars = 100 nm for A to C and 500 nm for D.
In fatty acid profile, the dominant fatty acids were C14:0, C16:0, C16:1Ɗ9, C18:1Ɗ9, and C20:5ω3 (number of carbons:number of double bonds, where positions of double bonds are indicated with Ɗ [counting from the carboxyl group] or ω [counting from the methyl group]; Supplemental Table S2). When IMET1 cultures under nitrogen-depleted conditions were compared with those under nitrogen-replete conditions, the content of C14:0, C16:0, C16:1Ɗ9, and C18:1Ɗ9 (dry weight) appeared to increase significantly (P < 0.001) following nitrogen depletion (Figs. 9 and 10B), which was similar to the results reported by Rodolfi et al. (2009). These fatty acids represented about 90% of the total fatty acids of nitrogen-depleted culture (on day 31) and could be easily used for the production of biodiesel. Meanwhile, no significant increase in C20:5ω3 content (dry weight) between day 10 and day 31 was observed (Fig. 10B). For changes in the percentage of fatty acids within the total fatty acids between day 10 (nitrogen replete) and day 31 (chronic nitrogen depleted; Fig. 10A), it was observed that the levels of C16:0, C16:1Ɗ9, and C18:1Ɗ9 were significantly increased (P < 0.05), while no significant change for C14:0 was observed. In a previous study on IMET1 (Xiao et al., 2013), only C18:1Ɗ9 was increased, which may be due to the duration time of nitrogen depletion. In addition, when compared with the 10-d culture, the 31-d culture showed a significant decrease (P < 0.05) in the relative amount of C18:2ω6, C20:4ω6, and C20:5ω3 in the total fatty acids (Fig. 10A), which was basically in agreement with the observations by Xiao et al. (2013). In total, these data indicated that nitrogen starvation can lead to increased percentages of saturated and monounsaturated fatty acids as well as decreased percentages of polyunsaturated fatty acids in the total fatty acids.

Fatty acid composition in N. oceanica IMET1 grown under nitrate repletion, nitrate depletion, and nitrate addition. Nr, Mean IMET1 grown under nitrate repletion (n = 8) from day 5 to day 10; eNd, mean IMET1 grown under early nitrate depletion (n = 6) from day 16 to day 21; lNd, mean IMET1 grown under late nitrate depletion (n = 6) from day 26 to day 31; Ny, mean IMET1 grown under nitrate addition (n = 6) from day 32 to day 35. eNd and lNd were compared with Nr, while Ny was compared with lNd. Error bars represent se. Asterisks indicate significant differences determined by an independent Student’s t test (*P < 0.05, **P < 0.001).
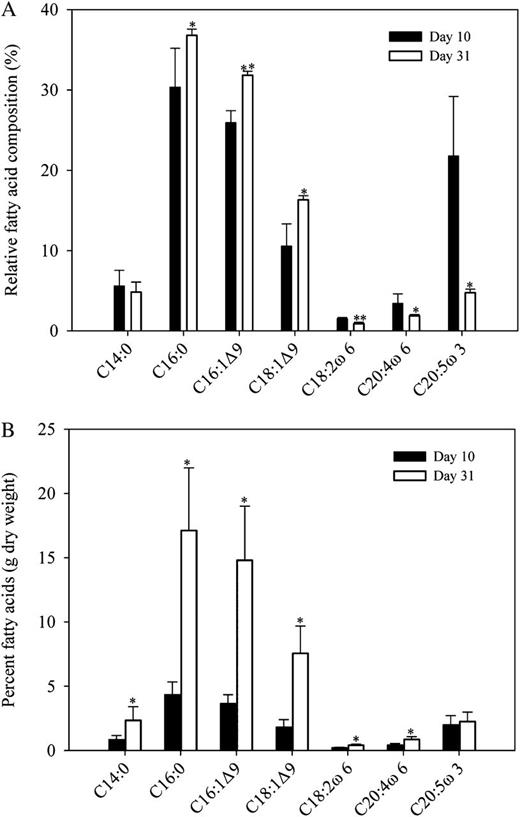
Detailed lipid analysis of N. oceanica IMET1 harvested at day 10 (nitrate repletion) and day 31 (chronic nitrate depletion). A, Relative fatty acid composition (percentage total fatty acids). B, Percentage fatty acid composition (g dry weight). Samples harvested at the two time points were used as studies of proteomics. The experiment was repeated two times, and the values are means ± sd (n = 5). Day 31 was compared with day 10. Asterisks indicate significant differences determined by an independent Student’s t test (*P < 0.05, **P < 0.01).
After nitrate readdition, photochemical energy conversion efficiency of PSII was elevated sharply. F v/F m increased from 0.179 on day 31 to 0.585 on day 35 (Fig. 3A). Meanwhile, cell carbon uptake increased quickly. From day 32 to 35, the rate of carbon uptake per cell was increased 6.7-fold (Fig. 4A). Greening of algal cells demonstrates a rapid synthesis of chlorophyll. Percentage nitrogen and dissolved protein also increased quickly (Fig. 2). However, percentage fatty acids (including all types of saturated and unsaturated fatty acids except for C20:5ω3) were reduced (Figs. 7B and 9; Supplemental Table S2). It is possible that existing hydrocarbons could have been degraded and preferentially used for the generation of carbon skeletons in nitrogenous compounds, including proteins and chlorophyll.
Proteomic Responses under Long-Term Nitrogen Starvation and Recovery
To better understand physiological responses of N. oceanica IMET1 to long-term nitrogen depletion and recovery, the proteome patterns of IMET1 cultures collected on day 10 (nitrogen replete), day 16 (early nitrogen depleted), day 31 (late nitrogen depleted), and day 32 (nitrogen resupplied) were compared (Fig. 11). These sampling points were chosen based on the changes of in vivo Chl a concentrations and the nitrate concentration in medium as benchmarks.
![Proteomic profiling of N. oceanica IMET1 in response to the removal and addition of nitrate. Soluble proteins were isolated from N. oceanica IMET1 and resolved in a nonlinear pH 4 to 7 gradient and on 12.5% SDS-PAGE gels. D10, D16, and D31 are two-dimensional gels for the samples taken on days 10, 16, and 31, respectively, during nitrate depletion, and 24-Hr is a two-dimensional gel for the sample taken at 24 h after nitrate was resupplied. During nitrate depletion, gels from day 10 were used as a control, and other time points (days 16 and 31) were compared with them. For nitrate recovery, 24-h recovery was compared with day 31. Red circles on the gels show the identified differentially expressed spots. Numbers 1 to 33 on the D10, D16, and D31 gels correspond to spots numbered in Table II, and numbers S1 to S14 corresponds to spots numbered in Table III. [See online article for color version of this figure.]](https://oup.silverchair-cdn.com/oup/backfile/Content_public/Journal/plphys/162/2/10.1104_pp.113.214320/2/m_plphys_v162_2_1110_f11.jpeg?Expires=1747894321&Signature=gCCGSmKXGB1PBMx8Ok049Yz-TF~E~-fl6BGlIy16tU6xXh78HVUQcJiRTwrijv9Kw2Bwda6BaWPjs5Mn-Tm5OTDb-vHnpoB9N72LhCourrqM1f2CHeA5yAGPJXLC2Beg-uxO2JcQVxmjPajMRmdFvvt19bOehYA9dtlgANTRAh33uBZGKDpFEmciEI1L681zaVDtQcURO2ggCjwhvwv3~UjhxwYrOGL2H1gCesDcCP~6D8G571Kbvwt3MD9VETCy8M8VuLM5seTKVy5sL7ME2eGRX-4HPoCYTUOANg08KMpiYqCR~fiTJO5L-FPecMlijwHR7hRLROk2qN1UldwIDA__&Key-Pair-Id=APKAIE5G5CRDK6RD3PGA)
Proteomic profiling of N. oceanica IMET1 in response to the removal and addition of nitrate. Soluble proteins were isolated from N. oceanica IMET1 and resolved in a nonlinear pH 4 to 7 gradient and on 12.5% SDS-PAGE gels. D10, D16, and D31 are two-dimensional gels for the samples taken on days 10, 16, and 31, respectively, during nitrate depletion, and 24-Hr is a two-dimensional gel for the sample taken at 24 h after nitrate was resupplied. During nitrate depletion, gels from day 10 were used as a control, and other time points (days 16 and 31) were compared with them. For nitrate recovery, 24-h recovery was compared with day 31. Red circles on the gels show the identified differentially expressed spots. Numbers 1 to 33 on the D10, D16, and D31 gels correspond to spots numbered in Table II, and numbers S1 to S14 corresponds to spots numbered in Table III. [See online article for color version of this figure.]
First, we compared the proteomes of IMET1 culture under nitrogen-depleted conditions on day 16 and 31 with that of the nitrogen-replete culture on day 10. Following filtering to remove speckling and background, about 1,500 distinct protein spots were detected on each gel. In the comparisons, when excluding different spots between replicates, those small and faint spots, only 75 differentially expressed proteins that had a greater than 1.5-fold increase or decrease in relative abundance (P < 0.05) and a few abundant protein spots were analyzed by MS. Among them, 47 proteins were identified, of which 32 proteins were assigned a functional annotation, including proteins involved in photosynthesis, nitrogen assimilation, protein metabolism, glycolysis, and fatty acid metabolism (Table II). Several of these proteins were present as multiple spots, most probably due to posttranslational modifications, such as phosphorylation. Although many proteins exhibited differential expression between day 10 and 16, the majority of differentially expressed proteins were found comparing day 10 with day 31 (Table II). It is also noteworthy that many regulated proteins cannot be identified using the two-dimensional gel electrophoresis approach, such as membrane-bound proteins, faint proteins with low abundance, and poorly separated proteins.
Proteins identified as involved in important metabolism in Nannochloropsis spp. from day 10 to day 31 during long-term nitrate starvation
Ratio represents fold change in relative abundance. Ratio greater than 1.5-fold means that a protein is increased significantly (P < 0.05). Ratio less than or equal to 1.5-fold means that a protein is reduced significantly (P < 0.05). Values are based on three biological replicates. Further information regarding the protein identification is accessible at Supplemental Table S3 and https://www.box.com/s/q5oy0thdhlvda29vclq2.
| Spot No. | Protein Name | Unique Peptides Matched with MS/MS Spectra | Mascot Protein Score | Ratio, Day 16/Day 10 | Ratio, Day 31/Day 10 |
|---|---|---|---|---|---|
| Photosynthesis and carbon fixation | |||||
| 1 | CbbX protein homolog | 7 | 563 | −2.0 | −1.8 |
| 2 | Chloroplast FNR | 6 | 672 | −0.8 | −2.9 |
| 3 | Chloroplast FNR | 4 | 257 | −0.8 | −1.5 |
| 4 | Ribulose-phosphate 3-epimerase | 3 | 407 | −1.2 | −1.4 |
| 5 | Light-harvesting complex protein | 6 | 526 | −1.1 | −1.7 |
| 6 | Light-harvesting complex protein | 4 | 445 | −1.2 | −1.5 |
| 7 | Light-harvesting complex protein | 5 | 541 | 1.0 | −1.5 |
| 22 | Light-harvesting complex protein | 3 | 293 | −1.0 | −2.5 |
| 8 | Violaxanthin/Chl a-binding protein precursor | 2 | 186 | 0.8 | −1.5 |
| 9 | Oxygen-evolving enhancer protein | 2 | 310 | −0.6 | −2.7 |
| 10 | Carbonic anhydrase | 1 | 116 | −1.3 | −2.7 |
| Nitrogen assimilation and urea cycle | |||||
| 11 | Gln synthetase | 9 | 887 | 3.0 | 2.1 |
| 12 | Argininosuccinate synthetase | 2 | 319 | 1.7 | 1.4 |
| 13 | Gln synthetase | 8 | 1100 | 1.8 | 2.5 |
| H+ transport and endocytosis | |||||
| 14 | V-type H-ATPase | 2 | 139 | 1.7 | 0.9 |
| 15 | Vacuolar proton pump | 13 | 1290 | 1.7 | 2.0 |
| 16 | Receptor-mediated endocytosis protein | 1 | 89 | 1.3 | 1.7 |
| Antioxidant | |||||
| 17 | Cytochrome c peroxidase | 3 | 382 | 1.4 | 1.0 |
| 18 | l-Ascorbate peroxidase | 4 | 452 | −0.8 | 0.8 |
| 19 | 2-Cys peroxiredoxin | 4 | 516 | 1.9 | |
| Protein metabolism | |||||
| 20 | Proteasome subunit α | 4 | 562 | 1.0 | 2.1 |
| 21 | Translation elongation factor EF-Ts | 4 | 377 | −1.4 | −4.2 |
| Fatty acid metabolism, glycolysis, and TCA cycle | |||||
| 23 | Enoyl-ACP reductase | 2 | 315 | 3.6 | 4.0 |
| 24 | Trans-2-enoyl-CoA reductase | 5 | 471 | 2.0 | 2.2 |
| 25 | Stearoyl-ACP desaturase | 8 | 691 | −1.2 | −1.9 |
| 26 | 1,3-β-Glucanase | 8 | 708 | 1.2 | 1.5 |
| 27 | PGK | 4 | 490 | 0.8 | 1.5 |
| 28 | PK | 7 | 725 | 1.0 | 1.2 |
| 29 | PPH | 5 | 807 | 0.7 | 1.0 |
| 30 | GAPDH | 5 | 589 | 1.0 | 1.5 |
| 32 | Enoyl-ACP reductase | 2 | 218 | −1.3 | −2.6 |
| 33 | β-Chain succinyl-CoA synthetase | 8 | 952 | 1.6 | 1.1 |
When IMET1 was resupplied with nitrate on day 31, a total of 150 differently expressed distinct proteins were detected at 24 h, of which 78% had a greater than 1.5-fold decrease and 22% had a greater than 1.5-fold increase in relative abundance (P < 0.05). Among the up-regulated proteins, 13 distinct proteins were identified (Table III), including proteins involved in protein synthesis, photosynthesis, glycolysis, tricarboxylic acid (TCA) cycle, and lipid degradation.
Proteins identified in Nannochloropsis spp. when the level of expression is increased significantly (P < 0.05) at 24 h after nitrate was resupplied
Values are based on three biological replicates. Further information regarding the protein identification is accessible at Supplemental Table S4 and https://www.box.com/s/q5oy0thdhlvda29vclq2.
| Spot No. | Protein Name | Unique Peptides Matched with MS/MS Spectra | Mascot Protein Score | Ratio, 24 h/Control |
|---|---|---|---|---|
| Lipid degradation | ||||
| S1 | Inorganic pyrophosphatase | 4 | 411 | 1.6 |
| Protein synthesis | ||||
| S2 | 60S acidic ribosomal protein P0 | 4 | 414 | 1.7 |
| S3 | Translation elongation factor EF-Ts | 1 | 62 | 1.5 |
| S7 | Elongation factor Tu | 2 | 178 | 2.6 |
| S13 | Transcription factor BTF3-like protein | 1 | 162 | 1.8 |
| S14 | Elongation factor P | 1 | 102 | 6.6 |
| Photosynthesis | ||||
| S4 | Light-harvesting complex protein | 9 | 877 | 1.6 |
| S5 | Chloroplast FNR | 6 | 672 | 1.5 |
| S6 | Chloroplast FNR | 3 | 257 | 2.0 |
| Glycolysis and TCA cycle | ||||
| S9 | β-Chain succinyl-CoA synthetase | 6 | 620 | 1.5 |
| S10 | PGK | 11 | 980 | 1.5 |
| S12 | PK | 7 | 725 | 1.5 |
| One-carbon metabolism | ||||
| S11 | Adenosylhomocysteinase | 11 | 861 | 2.0 |
DISCUSSION
The genome and transcriptome of IMET1 under nitrogen starvation have been sequenced (J. Xu, personal communication). In this study, we utilized transcriptomic information of IMET1 to study its proteome and attempted to unravel the protein foundation of physiological responses of IMET1 to long-term nitrogen depletion and readdition. The following discussion mainly focused on proteomic changes.
Proteomic Responses under Long-Term Nitrogen Starvation
Nitrogen Assimilation and Protein Metabolism
Two isoforms of Gln synthetase were increased by 1.8- to 3.0-fold in relative abundance during initial and chronic nitrogen starvation, respectively (Table II). Gln synthetase catalyzes the formation of Gln from ammonium and Glu in a reversible reaction. In the marine diatom T. pseudonana, proteins for nitrate and nitrite reduction were decreased during nitrogen starvation, while Glu synthase and Gln synthetase were increased (Hockin et al., 2012). Therefore, Gln synthetase appears to be essential for the recovery of ammonium during nitrogen recycling in microalgae. Also, argininosuccinate synthetase, involved in the urea cycle, was increased by 1.7-fold in relative abundance under the initial starvation, which might be correlated with Orn and Arg biosynthesis or the degradation of amino acids. During nitrogen depletion, very small amounts of NO3 −, NO2 −, and NH4 + were detected in the medium (Table I) and were likely released from old or dead cells. Thus, N. oceanica IMET1 was able to employ multiple approaches to scavenge various forms of inorganic nitrogen in the culture medium, similar to the response of the marine diatom T. pseudonana to nitrogen starvation (Hockin et al., 2012).
A significant increase of the protein degradation pathway (i.e. proteasome) following chronic nitrogen depletion was observed. In addition, translation elongation factors were decreased by 4.2-fold in relative abundance under long-term nitrogen depletion (Table II). This is consistent with the reduced nitrogen content and extractable proteins during this period (Fig. 2). These results suggest that IMET1 may reduce protein synthesis and increase protein degradation in response to the long-term nitrogen starvation. Similar protein metabolism was also found in the marine diatom T. pseudonana under nitrogen starvation (Hockin et al., 2012). Under nitrogen starvation, IMET1 may use the carbon from the reduced proteins for fatty acid synthesis.
Antioxidant and Other Stress-Related Proteins
Three isoforms of the peroxidase family were identified in IMET1: cytochrome c peroxidase, l-ascorbate peroxidase, and a 2-Cys peroxiredoxin. Only 2-Cys peroxiredoxin was increased significantly (P < 0.05) under the long-term nitrogen-depleted condition (Table II). It has been shown that 2-Cys peroxiredoxin is active with various thioredoxin isoforms and functions as an antioxidant toward reactive oxygen species in C. reinhardtii (Goyer et al., 2002). In IMET1, 2-Cys peroxiredoxin increased more than other peroxidases, suggesting that it is a key antioxidant involved in the nitrogen stress response. On day 28, IMET1 showed poor chloroplast structure. Most chloroplasts lacked outer membranes, and surface membranes of some thylakoids appeared to not be intact (Fig. 8, C and D). The cellular destruction of IMET1 under chronic nitrogen stress could be related to the activity of reactive oxygen species or autophagy by the host cell. However, it has been reported that triacylglycerol accumulation in cells of C. reinhardtii can mitigate reactive oxygen species formation at PSI following nitrogen deprivation by sequestering excess electrons moving through the photosynthetic electron transport chain (Li et al., 2012). Therefore, lipid accumulation in cells might be important to the vitality of IMET1 under chronic nitrogen starvation.
Autophagy is the major pathway by which proteins and organelles are targeted for degradation in the vacuoles of plants (Liu et al., 2009). Plant autophagy is thought to play an important role in nutrient recycling under starvation (Liu et al., 2009). The nitrate-stressed IMET1 cells developed large vacuoles containing membranous inclusions and isolated organelles (Fig. 8, C and D). Furthermore, two vacuolar proton pump subunits were increased by 1.7- to 2.0-fold under nitrogen depletion (Table II), suggesting that the vacuoles in IMET1 could actively degrade macromolecules. Interestingly, a receptor-mediated endocytosis protein was increased by 1.7-fold under the long-term nitrogen depletion (Table II). These results may suggest that autophagy was induced in IMET during nitrogen starvation and that the vacuolar degradation of cytoplasmic components is an important process for N. oceanica IMET1 to cope with limited nitrogen sources. However, further studies need to be performed to validate the conclusion using markers of autophagy (i.e. Atg antibodies).
Photosynthesis and Carbon Fixation
During the long-term nitrate depletion, four isoforms of the light-harvesting complex were decreased by 1.5- to 2.5-fold, and a violaxanthin/Chl a-binding protein precursor was decreased by 1.5-fold (Table II). In addition, ribulose-phosphate 3-epimerase, involved in the Calvin cycle, was decreased by 1.4-fold. The decreases of photosynthesis-related proteins in IMET1 are consistent with the responses of C. reinhardtii to long-term nitrogen stress (Plumley and Schmidt, 1989). The genes involved in photosynthesis, carbon fixation, and oxidative phosphorylation in N. gaditana were also down-regulated under nitrogen stress (Radakovits et al., 2012). For IMET1, physiological changes such as continuous reductions of F v/F m, ETR, and carbon uptake during long-term nitrogen depletion were observed (Figs. 3A and 4A), and such physiological responses appear to correspond to the sharp reduction of photosynthesis-related proteins. These results suggest that inorganic nitrogen functions as a regulatory element in the chloroplasts for optimizing photosynthesis and carbon fixation.
Interestingly, a Cbbx protein homolog was decreased by 2.0- and 1.8-fold under initial and chronic nitrate starvation, respectively (Table II). The Cbbx protein has been identified as an activase of red-type Rubisco (Mueller-Cajar et al., 2011). Rubisco must first be carbamylated by the addition of a CO2 molecule at the active-site Lys in order to have activity (Cleland et al., 1998). Since the carboxylation of ribulose-1,5-bisphosphate catalyzed by Rubisco is the primary rate-limiting factor of the Calvin cycle during the day, the reduction of Cbbx protein homolog expression may decrease Rubisco activity, which thereby leads to a reduction in photosynthetic carbon fixation.
Two chloroplast ferredoxin NADP(+) reductases were decreased significantly (P < 0.05) under nitrogen depletion (Table II). In the chloroplast, ferredoxin NADP(+) reductase (FNR) transfers electrons from reduced ferredoxin to NADPH in the final step of linear electron flow. In this study, down-regulation of FNR during starvation suggests a less efficient NADP+ photoreduction. This result was consistent with the persistent reduction of F v/F m and carbon fixation during the long-term nitrogen starvation. An oxygen-evolving enhancer protein that is part of the oxygen-evolving complex of PSII was decreased by 2.7-fold during nitrate starvation. The oxygen-evolving complex is capable of splitting water into oxygen and hydrogen (Mayfield et al., 1987). Down-regulation of oxygen-evolving enhancer protein abundance may reduce the release of electrons and limit the flow of electrons, thereby limiting photosynthetic ability. In the future, specific antibodies of photosynthetic reaction center proteins like D1 and D2 will be used to further study photosynthesis in response to long-term nitrogen depletion.
A carbonic anhydrase family protein was found to be decreased by 1.3- and 2.7-fold under initial and chronic nitrogen starvation (Table II). This enzyme catalyzes the reversible conversion of CO2 to HCO3 − and produces CO2 in the vicinity of Rubisco from actively transported HCO3 − (Huertas and Lubian, 1998). A decrease in this enzyme could decrease available CO2 in the chloroplast, which is supported by the low rate of carbon fixation during chronic depletion (Fig. 4A). Surprisingly, we found that the uptake of CO2 continued in IMET1 cells 4 h after the light was turned off during nitrogen depletion (Fig. 4B). This finding challenges the concept that HCO3 − transport is strictly energized by the light reactions of photosynthesis (Huertas et al., 2000). In N. gaditana, HCO3 − uptake remains active in the dark for up to 20 min before stopping, and it is proposed that the supply of inorganic carbon for photosynthetic CO2 fixation is partly dependent upon mitochondrial activity (Huertas et al., 2002). Our results not only confirmed this experiment but also showed that the low uptake of CO2 could persist in the dark in N. oceanica IMET1 for longer than 20 min. This may also indicate a change in carbon metabolism during nitrogen stress to maximize the limited abilities of the light-harvesting complexes.
Storage Products
Glycolysis can be a source of acetyl-CoA for fatty acid synthesis. Several key enzymes involved in glycolysis in IMET1 were increased during nitrate depletion (Table II). These enzymes include phosphoglycerate kinase (PGK), pyruvate kinase (PK), phosphopyruvate hydratase (PPH), and glyceraldehyde-3-P dehydrogenase (GAPDH). Meanwhile, enoyl-acyl carrier protein reductase (FabI) and trans-2-enoyl-CoA reductase, involved in fatty acid synthesis, were increased by 4.0- and 2.2-fold under nitrate depletion, respectively. The transcript levels of PGK, PK, PPH, GAPDH, and FabI genes were also up-regulated during the nitrogen stress (J. Xu, personal communication).
Triacylglycerol is synthesized from glycerol-3-P and acyl-CoA through a series of acyltransferase reactions to form fatty acid esters of glycerol. In microalgae, fatty acid de novo synthesis is performed in the chloroplast, where acetyl-CoA produced from photosynthesis and glycolysis is converted to malonyl-CoA, which then serves as a building block for fatty acid chain extension in the acyl carrier protein (ACP) enzyme complex (Ohlrogge and Browse, 1995). This first step is considered to be catalyzed by acetyl-CoA carboxylase. The four enzymes, PGK, PK, PPH, and GAPDH, are responsible for converting glycerate-3-phosphate derived from photosynthesis to acetyl-CoA via glycolysis. In the steps immediately downstream of acetyl-CoA carboxylase, FabI is involved in the extension of fatty acid carbon chains as a key enzyme in the fatty acid synthetase complex. In IMET1, under nitrate depletion, up-regulation of these enzymes in relative abundance suggested that photosynthate fluxes might be channeled into the acetyl-CoA pool, maintaining or enhancing the synthesis of fatty acids. However, interestingly, an isoform of FabI showed 1.3- to 2.6-fold decreases during chronic nitrogen starvation. This may be a response to the reduced protein content of the cell; alternatively, differential expression of isoforms of FabI may play a regulatory role in fatty acid synthesis. In addition, it is noteworthy that the ACP-dependent system in the chloroplasts usually synthesizes fatty acids with chain lengths of C16 and C18 (Hendren and Bloch, 1980). Subsequently, the fatty acids synthesized in the chloroplast are transferred to the endoplasmic reticulum for fatty acid elongation (Poulos, 1995). In IMET1, the increase of trans-2-enoyl-CoA reductase in relative abundance suggests that the synthesis of long-chain fatty acids might be vital for sustaining the synthesis of triacylglycerols during nitrate starvation.
A stearoyl-ACP desaturase was decreased by 1.2- to 1.9-fold in relative abundance under initial and long-term nitrogen depletion (Table II). Stearoyl-ACP desaturase can catalyze the formation of oleoyl-ACP from stearoyl-ACP, and its potential role depends on the type of plant (Cheesbrough, 1990; Fukuchi-Mizutani et al., 1998). In 18:3-type plants, all unsaturated fatty acids are synthesized by the pathway that begins with stearoyl-ACP desaturase (Cheesbrough, 1990). Therefore, any changes in this enzyme can lead to a change in the ratio of saturated to unsaturated fatty acids. In IMET1, under nitrate starvation, the percentage of polyunsaturated fatty acids (C18:2ω6, C20:4ω6, and C20:5ω3) decreased and the percentage of saturated and monounsaturated fatty acids increased within total fatty acids (Fig. 9A), which might be attributed to the reduction of stearoyl-ACP desaturase or its homologs. It is likely that the quick attenuation of some acyl-ACP desaturases under environmental stresses blocks the formation of oleoyl-ACP from stearoyl-ACP.
Based on the sequencing of Nannochloropsis spp. genomes, it is proposed that the form of carbohydrate reserve in Nannochloropsis spp. is not starch but chrysolaminaran (J. Xu, personal communication), similar to the diatom Phaeodactylum triconum (Kroth et al., 2008). In this study, one 1,3-β-glucosidase was found in IMET1 and was increased by 1.2- to 1.5-fold through chronic nitrogen depletion (Table II). Similarly, the 1,3-β-glucosidase gene in IMET1 was also up-regulated under nitrogen stress (J. Xu, personal communication). Our results further support the hypothesis that under nitrate starvation, chrysolaminaran might be hydrolyzed into Glc, which then enters cytosolic glycolysis and provides acetyl-CoA precursors for fatty acid biosynthesis. Under chronic nitrogen deprivation, a succinyl-CoA synthetase involved in the TCA cycle was increased by 1.6-fold (Table II). Different responses of the TCA cycle in C. reinhardtii and T. pseudonana to nitrogen starvation have been observed (Miller et al., 2010; Hockin et al., 2012), showing that the flux of the TCA cycle may be adaptable. The increase of succinyl-CoA synthetase might facilitate the use of various carbon skeletons produced by the catabolism of some amino acids into the TCA cycle via succinyl-CoA. In IMET1, a potential model for the accumulation of fatty acids under nitrate starvation is proposed (Fig. 12).
![Potential model of fatty acid synthesis pathways based on protein changes during chronic nitrogen depletion. SCS, Succinyl-CoA synthetase; TECR, trans-2-enoyl-CoA reductase. The numbers represent fold change of proteins in relative abundance. Dashed lines mean that no related proteins were detected in this pathway. [See online article for color version of this figure.]](https://oup.silverchair-cdn.com/oup/backfile/Content_public/Journal/plphys/162/2/10.1104_pp.113.214320/2/m_plphys_v162_2_1110_f12.jpeg?Expires=1747894321&Signature=wVPoaPwHF6Mk6eWzDuds~260Y7e794hAcbnFgS1VawG83zTvHSE6ONoOgH4KOtAwmWfUjxIwSeOayxlmPbXnd~-svO3IklUemYSkwnQBvEgXv~Gwgfnc~96Uf941T~4g~r7~ZmtwU1-D~H~27hKhs0nH79g6cu4Vte1DJYq0HDEf3fALsXDvULQGE5YIEG8n1ruMFpIcxpJh7P6Idv5SU1jVu0WlAhv6zEJ3IoPu2rBYMagoUJ0uavzeWBBXqCKEE8WFPl81FPHlp2Z8-TP37XReDUORJSMo3WYmcSFbHXsLARmGSDMUgBXEQhX6YWUPc7p7jSGuNTvFt~GY3Ps22A__&Key-Pair-Id=APKAIE5G5CRDK6RD3PGA)
Potential model of fatty acid synthesis pathways based on protein changes during chronic nitrogen depletion. SCS, Succinyl-CoA synthetase; TECR, trans-2-enoyl-CoA reductase. The numbers represent fold change of proteins in relative abundance. Dashed lines mean that no related proteins were detected in this pathway. [See online article for color version of this figure.]
Proteomic Responses under Nitrogen Recovery
Three isoforms of a translation elongation factor and one 60S acidic ribosomal protein were increased by 1.5- to 6.6-fold at 24 h after nitrate readdition (Table III), which play an important role in the elongation step of protein synthesis, indicating that the global efficiency of protein synthesis in IMET1 was increased after nitrate repletion. In C. reinhardtii, protein synthesis in nitrogen-limited cells is immediately stimulated by the nitrogen pulse, increasing 10-fold within 30 min in both soluble and membrane fractions (Plumley and Schmidt, 1989). However, the majority of proteins in IMET1 still retained low expression levels after 24 h. This might be due to a delay in the synthesis of free amino acids after nitrogen provision. One light-harvesting complex protein showed a 1.6-fold increase, and two FNRs were up-regulated by 1.5- and 2.0-fold, respectively (Table III). These proteins are involved in photosynthesis, and their responses were supported by sharp increases of F v/F m and ETR during the recovery (Fig. 3A). Plumley and Schmidt (1989) also showed an increased mRNA expression of light-harvesting complex II in C. reinhardtii following a nitrogen pulse. It is possible that the response of photosynthesis to nitrate levels might be primarily controlled by suppressing or promoting gene expression of the light-harvesting complex and FNR.
A PGK and a PK involved in glycolysis, and a succinyl-CoA synthetase involved in the TCA cycle, were up-regulated (Table III), suggesting that acetyl-CoA from elevated glycolysis might be channeled into the TCA cycle, which could provide important precursors for the biosynthesis of compounds, including amino acids, as well as the reducing agent NADH. Also, an inorganic pyrophosphatase involved in lipid degradation was increased, together with a sharp reduction of fatty acid content during the recovery (Figs. 7B and 9; Supplemental Table S2). These results suggest that fatty acid oxidation might provide the energy for this metabolic shift during nitrogen recovery, whereas acetyl-CoA could be shifted to the TCA cycle. However, owing to the down-regulation of the majority of differently expressed proteins in relative abundance, nitrate might act as a signal to induce the expression of some key regulator genes or pathways during initial nitrogen recovery. As a result, only a few proteins would show increased expression during the first 24 h of nitrate recovery to ensure the preferential restoration of metabolisms necessary for this metabolic shift.
CONCLUSION
We demonstrate here that marine microalga N. oceanica IMET1 evolves a series of physiological strategies to survive long-term nitrogen stress. These responses include pigment alteration, lipid accumulation, and reductions in photosynthesis, carbon fixation, and protein content. Proteomic comparisons present the potential molecular foundation of these physiological responses. In particular, the up-regulation of protein expression involved in glycolysis, fatty acid synthesis, and the TCA cycle ensures lipid accumulation. In addition, lipid accumulation and autophagy may play a key role in maintaining vitality and ensuring the positive incorporation of recycled nitrogen. During the nitrate pulse, nitrate acts as a signal to induce a preferentially elevated expression of key proteins or enzymes involved in photosynthesis, protein synthesis, glycolysis, and the TCA cycle, such as FNR, translation elongation factor, PK, and succinyl-CoA synthetase. The combined physiological and proteomic approaches proved to be a powerful way to understand algal systematic responses to environmental changes. This will eventually allow for the manipulation of metabolic processes in order to enhance the production of algal oil or other valuable products.
MATERIALS AND METHODS
Algal Culture and Experimental Design
Nannochloropsis oceanica IMET1 was cultured in a 20-L polyvinyl tank with 10 L of artificial seawater medium (Berges et al., 2001) bubbled with sterile air and CO2 to support growth. A pH controller connected to a CO2 cylinder was plumbed into the air supply to maintain pH within the desired range (7.8–8.3). IMET1 was grown at 20°C under a 14/10-h light/dark cycle with an average of 100 μmol photons m−2 s−1 illumination. At day 10, IMET1 was in logarithmic growth. Two liters of day-10 culture was removed and replaced with 2 L of fresh medium without nitrate on Monday, Wednesday, and Friday of each week. The 2 L of culture removed at each time point was centrifuged to form pellets and stored in –80°C for further analyses. The culture was regularly monitored for cell counts, Chl a levels via fluorescence, F v/F m, ETR, and effective photochemical efficiency of photosystem II via chlorophyll fluorometer, alkalinity, nutrients, temperature, and CO2 uptake efficiency via radiolabeled bicarbonate. Based on the measured concentrations of in vivo Chl a and nitrate, algal pellets from days 10, 16, and 31 were chosen for two-dimensional gel electrophoresis. After 31 d of culture, 2 L of culture was removed and replaced with 2 L of medium with nitrate at 4 h and on days 1, 2, and 4 after nitrate was resupplied.
In Vivo Monitoring of Photosynthetic Parameters and Cell Number
Fresh culture was taken at 10 to 11 am every day. Chlorophyll fluorescence was determined in vivo using the AquaFluor Handheld Fluorometer. The parameters F v/F m, effective photochemical efficiency of photosystem II, and ETR were determined by the PAM-2500 Portable Chlorophyll Fluorometer (Walz). Culture was dark acclimated for 15 to 20 min before determining F v/F m. Cell number was counted using a Beckman Coulter Counter II using isoton as the diluent.
Analysis of Nutrient, Alkalinity, and Dissolved Inorganic Carbon in Culture Medium
Culture medium was regularly collected and filtered through a glass fiber filter. All filtrate samples were stored at −20°C until analysis.
Ammonium was determined applying the salicylate-hypochlorite method (Bower and Holm-Hansen, 1980). Nitrate and nitrite were measured by standard colorimetric methods (Johnson and Petty, 1983). Phosphate was determined using a colorimetric method described elsewhere (Eibl and Lands, 1969). Alkalinity was determined by converting all carbonate, bicarbonate, and carbonic acid to carbon dioxide at the Nutrient Analytical Services Laboratory at the Chesapeake Biological Laboratory, University of Maryland Center for Environmental Science. Total inorganic carbon was determined using a total organic carbon analyzer (Shimadzu TOC-5000A) at the Nutrient Analytical Services Laboratory.
Nitrogen and Carbon Analysis
Elemental analysis using a model C3-440 Elemental Analyzer (Exeter Analytical) was performed on lyophilized samples by the Nutrient Analytical Services Laboratory.
Two-Dimensional Gel Electrophoresis
Protein extraction was performed according to a published method (Lee and Lo, 2008) with minor modifications. Three individual algal pellets with a wet weight of 200 to 300 mg were used for protein extraction. A total of 500 μL of rehydration buffer with 7 m urea, 2 m thiourea, and 4% (w/v) CHAPS was added to solubilize the dry protein powder. The total protein concentration was assayed using the 2-D Quant Kit (GE Healthcare). For each replicate, 120 μg of total protein extract was loaded into an 11-cm no-linear ReadyStrip with pH range 4 to 7 (Bio-Rad) and then subjected to isoelectric focusing in a Protean IEF Cell (Bio-Rad). The following voltage/time profile was used: 20 min at linear 250 V, 2.5 h at linear 8,000 V, and 35,000 V h−1 at rapid 8,000 V. Following the first-dimensional run, the gel strip was equilibrated with the equilibration buffer (50 mm Tris, pH 8.8, 6 m urea, 30% glycerol, 2% SDS, and 1% dithiothreitol) for 15 min. The gel strip was then placed in fresh equilibration buffer containing 1% iodoacetamine (instead of dithiothreitol) for another 15 min. The second-dimensional SDS-PAGE gels (12.5%) were run in a Dodeca cell (Bio-Rad) at a constant 120 V until the bromphenol blue dye reached the end of the gel. After electrophoresis, the gels were silver stained as described elsewhere (Chan et al., 2004).
Gel Analysis
Gel images with 300-dots per inch resolution were analyzed with Melanie version 7.0 software (Swiss Institute of Bioinformatics). Manual editing and normalization were applied after automated spot detection and matching. Spot quantification was based on spot volume (integration of spot density over spot area) as a percentage of the total spot volumes of the gel to normalize for possible staining differences between gels. Gel annotations and matching fidelity were checked manually to eliminate matching errors caused by the software. Three gels representing independent samples were analyzed for each time point. Statistically significant variation (P < 0.05) and a ratio greater than 1.5 were used for cutoffs. These clear spots with significant variation and some abundant spots without significant changes under chronic nitrogen starvation were selected for MS analyses. All the procedures for two-dimensional gel electrophoresis and gel analysis were repeated independently.
MS and Database Search
Protein spots were individually excised from gels and then manually in-gel trypsin digested as described previously (Wang et al., 2011). Briefly, each gel piece was destained, shrunk with 100% acetonitrile, and then air dried at room temperature. The dried gel pieces were incubated with sequencing-grade trypsin in 20 mm NH4HCO3 overnight at 37°C. After digestion, 1 μL of peptide solution was mixed with 1 μL of matrix before spotting on the target plate.
MS analysis was carried out with a 5800 Plus MALDI TOF-TOF Analyzer (Applied Biosystems). The laser wavelength and the repetition rate were 349 nm and 200 Hz, respectively. The mass spectra were processed using Peak Explorer (Applied Biosystems) software. At least 1,000 laser shots were typically accumulated, with a laser pulse rate of 400 Hz in the MS mode, whereas in the tandem mass spectrometry (MS/MS) mode, spectra from up to 2,000 laser shots were acquired and averaged with a laser pulse rate of 1,000 Hz. Peptides were fragmented with collision-induced decomposition. A maximum of the 20 strongest precursor ions per protein spot were chosen for MS/MS analysis. A combined MS and MS/MS search was performed against protein sequences predicted by the time-coursed transcriptomes of IMET1 using an in-house MASCOT server (version 2.2). The raw MS and MS/MS spectra were processed using GPS Explorer software (version 3.5; Applied Biosystems). Further information regarding the protein identification is accessible at https://www.box.com/s/q5oy0thdhlvda29vclq2.
Lipid and Fatty Acid Profile Analysis
Total lipids were extracted using the method of Bligh and Dyer (1959) and measured gravimetrically.
Fatty acids were analyzed directly from liquid cultures as described previously (Work et al., 2010). Briefly, 1.0 mL of 1 m NaOH in 95% methanol was added to 0.5 mL of algal culture and then heated in tightly sealed vials at 100°C for 2 h, which resulted in cell lysis and lipid saponification. Acid-catalyzed methylation was accomplished by adding 1.5 mL of 12 n HCl:methanol (1:16, v/v) and incubating at 80°C for 5 h. Fatty acid methyl esters (FAMEs) were extracted into 1.25 mL of hexane through gentle inversion for 20 min. Extracts were washed with distilled water and analyzed directly by gas chromatography.
Analysis of the FAMEs obtained was performed on the Hewlett-Packard 6890 gas chromatograph equipped with a 30-m × 0.25-mm i.d. capillary column with 0.25-mm film thickness (DB Wax; J&W Scientific) and a flame ionization detector at 300°C. Gas chromatography was run in “constant flow rate” mode at 1.5 mL min−1 with helium as the carrier gas. FAMEs were quantified against a standard curve from different concentrations of C19:0 and C21:0 standard mixture (nonadecanoic acid and heneicosanoic acid). The internal C19:0 and C21:0 standards run with each sample were used for calculating the recovery of FAMEs.
Electron Microscopy Analysis
Centrifuged cell pellets were fixed using a fixative containing 2.5% glutaraldehyde and 2% paraformaldehyde in 0.1 m sodium phosphate (pH 7.0). Transmission electron micrographs were captured using a FEI Tecnai T12 transmission electron microscope operating at 80 kV.
Carbon Fixation Rate
The rate of carbon fixation by the culture during nitrate depletion was measured by the incorporation of 14C-labeled bicarbonate. A total of 30 mL of culture was inoculated with 2 μL of NaH14CO3 at 1 mCi mL−1, mixed, and then returned to the original culture environment for 4 h. After incubation, the culture was vacuum filtered through GF/F filters, the filters were placed into 3 mL of Biosafe II liquid scintillation cocktail, and the cpm for each filter were measured using a liquid scintillation counter. Cultures without NaH14CO3 addition and an unused GF/F filter were used as controls, and each experiment was performed in triplicate. Total inorganic carbon was calculated from total alkalinity and pH in medium using the CO2 SYS.BAS program. Direct assay of total inorganic carbon in the medium from days 21, 26, 28, 32, and 35 was also performed in order to verify the values in the calculation software. Profiles of the rate of carbon fixation calculated by the two total inorganic carbon values were very similar, and the calculated values are presented.
Pigment Extraction and Analysis
Ten-milliliter cultures were vacuum filtered onto a 25-mm GF/F glass fiber filter (Whatman) and immediately stored at −80°C. Pigments were analyzed using reverse-phase HPLC as described elsewhere (Van Heukelem and Thomas, 2001). The frozen GF/F filters were extracted with acetone. For each sample, 500 μL was injected into the HPLC apparatus. Pigment concentrations were quantified by peak area with external standards purchased from DHI Water and Environment. Routine identification of pigment peaks was based on retention times and absorption spectra identical to those of authentic standards.
Supplemental Data
The following materials are available in the online version of this article.
Supplemental Figure S1. Cell diameter of IMET1 during chronic nitrate depletion.
Supplemental Table S1. Pigment content in IMET1 during chronic nitrate depletion.
Supplemental Table S2. Fatty acid composition of IMET1 during chronic nitrate depletion.
Supplemental Table S3. Proteins identified during long-term nitrate starvation.
Supplemental Table S4. Proteins identified during nitrogen recovery.
ACKNOWLEDGMENTS
We thank Aaron Waton (University of Maryland Center for Environmental Science) for assistance with fatty acid analysis and Chen Li and Lin Lin (Xiamen University) for conducting MS analysis.
Glossary
- Chl a
chlorophyll a
- F v/F m
maximum photochemical efficiency of PSII in the dark-adapted state
- ETR
electron transport rate
- TCA
tricarboxylic acid
- FNR
ferredoxin NADP(+) reductase
- PGK
phosphoglycerate kinase
- PK
pyruvate kinase
- PPH
phosphopyruvate hydratase
- GAPDH
glyceraldehyde-3-phosphate dehydrogenase
- FabI
enoyl-acyl carrier protein reductase
- ACP
acyl carrier protein
- MS
mass spectrometry
- MS/MS
tandem mass spectrometry
- FAME
fatty acid methyl ester
LITERATURE CITED
Author notes
This work was supported by the National Basic Research Program of China (973 Program; grant no. 2010CB428702), the National Natural Science Foundation of China (grant no. 41206126), and the University of Maryland Center for Environmental Sciences (contribution 4755) and Institute of Marine and Environmental Technology (contribution 13106).
Corresponding author; e-mail [email protected].
The author responsible for distribution of materials integral to the findings presented in this article in accordance with the policy described in the Instructions for Authors (www.plantphysiol.org) is: Allen R. Place ([email protected]).
Some figures in this article are displayed in color online but in black and white in the print edition.
The online version of this article contains Web-only data.
Open Access articles can be viewed online without a subscription.
