


Abstract
In response to biotic stresses, such as herbivore attack, plants reorganize their transcriptomes and reconfigure their physiologies not only in attacked tissues but throughout the plant. These whole-organismic reconfigurations are coordinated by a poorly understood network of signal transduction cascades. To explore tissue-based interdependencies in the resistance of Nicotiana attenuata to insect attack, we conducted time-series transcriptome and metabolome profiling of herbivory-elicited source leaves and unelicited sink leaves and roots. To probe the multidimensionality of these molecular responses, we designed a novel approach of combining an extended self-organizing maps-based dimensionality reduction method with bootstrap-based nonparametric analysis of variance models to identify the onset and context of signaling and metabolic pathway activations. We illustrate the value of this analysis by revisiting dynamic changes in the expression of regulatory and structural genes of the oxylipin pathway and by studying nonlinearities in gene-metabolite associations involved in the acyclic diterpene glucoside pathway after selectively extracting modules based on their dynamic response patterns. This novel dimensionality reduction approach is broadly applicable to capture the dynamic rewiring of gene and metabolite networks in experimental design with multiple factors.
Plants adapt to environmental stresses through large-scale transcriptional reprogramming, which involves intricate signaling pathways (Hahlbrock et al., 2003; Nakashima et al., 2009; Zeller et al., 2009; Walley and Dehesh, 2010). These transcriptional adjustments can be captured by studying changes in the expression of genes in different tissues in order to elucidate the influence of particular pathways as well as the relative contribution of a given tissue to the whole-organism response. Although poorly understood, signaling networks controlling these transcriptional responses have been shown to be highly stress condition specific, as clearly illustrated by the large number of studies that have demonstrated differences in plant responses to mechanical wounding and herbivory (Baldwin, 1990; Alborn et al., 1997; Halitschke et al., 2003; Reymond et al., 2004; Wu et al., 2007). Experiments designed to study such intricate networks often have a complex factorial structure, obtained from different conditions/treatments, tissue types, or genetic contexts. In addition, time-series experiments are often employed to capture dynamic expression profiles that distinguish primary from secondary responses to stress in gene regulatory networks (GRN).
Basic statistical tests and clustering algorithms based on Pearson correlation to analyze multifactorial experiments are often plagued by the problem of gene prioritization and large numbers of false positives (Bittner et al., 1999; Getz et al., 2000). First, clustering algorithms classify genes on the basis of their expression under all experimental conditions, whereas signaling pathways underlying these gene expression responses are generally affected only by a subset of the experimental conditions (Swindell, 2006). Additionally, connections in GRN computed by considering all samples for different tissues, treatments, and time points together in a single analysis fail to recognize the transient gene associations found in early stress-responsive pathways that only appear in a subset of treatment types. Thus, the synchronous coregulation of genes representing intermediate biological states cannot be captured using collective information studies, and this represents a major challenge for the identification of the exact mechanisms of stress adaption in many organisms. Bioinformatic approaches such as mutual information (Priness et al., 2007) and biclustering (Dharan and Nair, 2009) have been developed to address this limitation. Moreover, interaction patterns deduced from these coexpression studies represent the static wiring of the network, whereas networks will assemble dynamically as the organism adapts to external stimuli.
To best capture the temporal dimension as a variable affecting the structure of GRN, several efforts have been published that identify patterns in time-series data. Park et al. (2003) used a modified ANOVA approach taking time as a factor along with other conditions. Wang and Kim (2003) used mixed-effect ANOVA to identify genes with different temporal profiles for different stress conditions in Caenorhabditis elegans. Tai and Speed (2006) used an empirical Bayes approach to introduce moderation, defined as the effect of moving gene-specific variances toward a common value estimated from a whole gene set, to reduce the number of false positives and false negatives. Storey et al. (2005) developed a statistical method that identifies genes showing differential temporal expression profiles by assigning a statistic calculated using spline-based methods. Zhou et al. (2010) developed a method to simultaneously analyze experiments involving more than one factor measured across time series by finding the significant direction in the time course across different conditions.
Nicotiana attenuata, a wild tobacco species native to the Great Basin Desert in the United States, is among the few model plants for which different omics technologies have been applied to understand its complex ecophysiological responses (Halitschke et al., 2003; Giri et al., 2006; Gaquerel et al., 2010). N. attenuata germinates in the postfire environment from long-lived seed banks to form monocultures in nitrogen-rich soils (Baldwin and Morse, 1994; Baldwin et al., 1994). As a consequence of its peculiar germination system, this plant is an ideal model for understanding the traits that native plants have evolved to cope with stresses characteristic of the agricultural niche: intense intraspecific competition and highly variable biotic and abiotic stress regimes (Baldwin, 2001). By germinating into the postfire environment, the plant becomes the focus of herbivores that colonize open habitats. This large and unpredictable herbivore community has provided a major evolutionary selective pressure that has likely sculpted many aspects of the plant’s GRN. Some of the essential nodes in the plant’s transcriptome and metabolome responses to attack from larvae of the specialist lepidopteran herbivore, Manduca sexta, have been functionally characterized (for review, see Wu and Baldwin, 2010). Feeding by this herbivore or its simulation by the application of its oral secretions (OS) into puncture wounds results in profound reorganizations of the plant’s metabolic and growth processes, in the de novo production of defense compounds, such as the accumulation and mobilization of nicotine (Steppuhn et al., 2004), phenolic derivatives (Kaur et al., 2010), and acyclic diterpene glycosides (Heiling et al., 2010), and in the activation of tolerance mechanisms essential for survival (carbon and nitrogen bunkering in roots; Schwachtje et al., 2006). The jasmonic acid (JA) signaling cascade represents the core pathway controlling these responses (Halitschke and Baldwin, 2003). Its activity mediates, via a set of largely unknown pathway-specific transcription factors, profound changes in the expression of regulatory and structural genes (Halitschke and Baldwin, 2003; Wang et al., 2008).
To investigate the dynamics of activation in time and space of herbivory-induced changes in gene-to-metabolite networks, we conducted replicated global expression profiling using identically treated wild-type N. attenuata plants for three tissues and two stress conditions (mechanical wounding and simulated herbivory) with a regular time series of six time points for both metabolomics and transcriptomics data. We then employed a bootstrap-based nonparametric ANOVA model to find the projected significant direction in the time vector for two factors (stress and tissue type) for both genes and metabolites (Zhou et al., 2010; Zhou and Wong, 2011). To further characterize the coexpression modules of different tissues, we imposed the structure using batch-learning (BL) self-organizing maps (SOM). From this analysis, we framed the concept of interactive motifs, which are defined as patterns of interconnections between genes and metabolites that are differentially perturbed in local and systemic tissues in response to stress, with additional information of their time of action obtained from projected data on time series termed “ANOVA directions.” We extracted and studied motifs defining gene-gene and gene-metabolite interactions involved in early and late responses in systemic leaf tissues. The premise of this approach is that genes or metabolites with similar ANOVA directions and, therefore, similar dynamic responses during herbivory are likely to be involved in similar biochemical pathways and/or are under the control of a common transcriptional regulatory mechanism. This broadly applicable approach allowed us to identify nonlinear relationships in gene-metabolite interactions with a high level of accuracy and robustness.
RESULTS
Work Flow for Analyzing the N. attenuata Transcriptome and Metabolome
The objective of this study was to identify tissue-specific gene-gene and gene-metabolite associations recruited in response to chewing insect herbivory in N. attenuata plants. Therefore, we conducted time-course transcriptome analysis and broadly targeted ultra-high performance liquid chromatography coupled to a quadrupole time-of-flight mass spectrometer (UHPLC-qTOFMS) metabolome measurements of source/sink transition leaves and roots (Fig. 1). Each sample was harvested from an independent control or treated plant every 4 h during a 21-h period to capture early and late activity phases of OS-elicited responses. In treated plants, M. sexta feeding was simulated by wounding a leaf with a fabric pattern wheel on both sides of the midrib of a source leaf and immediately applying M. sexta OS to the fresh puncture wounds (W+OS). This procedure, hereafter referred to as OS elicitation, recapitulates most changes in the N. attenuata transcriptome and metabolome, which are repeatedly activated during continuous insect feeding, and provides a convenient means of accurately standardizing herbivore elicitation and dependent responses in N. attenuata plants (McCloud and Baldwin, 1997). This standardization of herbivore elicitations is critical to conduct replicated microarray and metabolomics analyses. Additionally, this procedure allows inferring OS-specific responses. For this, we also sampled plants with leaves similarly wounded but in which the puncture wounds were treated with water, referred to as the W+W treatment. Microarray and metabolomics data sets were then preprocessed and normalized using pipelines described in “Materials and Methods.” A pivotal step in this work flow consisted of analyzing processed transcript and metabolite data for two factors using nonparametric ANOVA models in order to generate distinct clusters, separated by their combined treatment effects and time behaviors. Instead of modeling effects of the three factors (time, tissue type, and treatment applied) together, we used time-vector space to find the most significant effects from two-way ANOVA and used this information to conduct explorative studies on tissue- and treatment-specific responses.
![Work flow for analyzing changes in the transcriptome/metabolome landscape of N. attenuata elicited by insect herbivory. Leaf and root tissues of wild-type N. attenuata plants were harvested 1, 5, 9, 13, 17, and 21 h after leaves were wounded with a fabric pattern wheel and immediately treated with M. sexta (W+OS) to study herbivory-induced responses or with water (W+W) to study OS-specific induction. Replicated transcriptomic and metabolomic data were analyzed using multifactorial analysis, with both factors (tissue and treatment) taken together across the time series to identify modules showing differential OS elicitation. These modules were spatiotemporally resolved using BL-SOM. Herbivory-elicited interactive effects among transcript and metabolite levels were analyzed, with a special emphasis on identifying short- and medium-term changes in metabolism. To this end, interactive motifs from resolved maps were extracted and analyzed using network properties. [See online article for color version of this figure.]](https://oup.silverchair-cdn.com/oup/backfile/Content_public/Journal/plphys/162/2/10.1104_pp.113.217588/2/m_plphys_v162_2_1042_f1.jpeg?Expires=1747886546&Signature=PLHDBunH8MfeXq910~S4bTNocC~QCCG5tNnbcghhODNbKyHjcw4ZHuDKGh~2bvBdvcSmQ4~jo8FMJ9z82G1WmCwwF0J396beiSMS3N375NVe3O814CY7HXuf-n0JrZwwKpq0hcDN7DvY8lab2m03EUqF58GnQqet7JhmodaGLlwyCvO~EIWtvULORORL2ASF7F7Oyxv1CxtrobeEPf7BFMecMuw2URJaVUWaAa5dtqAem2kWq3ZVwtJ38-FkxQoRtQHSv4z~TJhiQYUJR6ARSH62c5QXAiI8yQ5-gam2jdl8X7B8XItfwrcIpKUG3YzURi5sDKDQu3AveVneOKbOug__&Key-Pair-Id=APKAIE5G5CRDK6RD3PGA)
Work flow for analyzing changes in the transcriptome/metabolome landscape of N. attenuata elicited by insect herbivory. Leaf and root tissues of wild-type N. attenuata plants were harvested 1, 5, 9, 13, 17, and 21 h after leaves were wounded with a fabric pattern wheel and immediately treated with M. sexta (W+OS) to study herbivory-induced responses or with water (W+W) to study OS-specific induction. Replicated transcriptomic and metabolomic data were analyzed using multifactorial analysis, with both factors (tissue and treatment) taken together across the time series to identify modules showing differential OS elicitation. These modules were spatiotemporally resolved using BL-SOM. Herbivory-elicited interactive effects among transcript and metabolite levels were analyzed, with a special emphasis on identifying short- and medium-term changes in metabolism. To this end, interactive motifs from resolved maps were extracted and analyzed using network properties. [See online article for color version of this figure.]
Multifactorial Time Response Features of OS-Elicited Gene Expression
The nature and amplitude of herbivore responses in untreated leaves and roots are controlled by short- and long-distance systemic signaling networks (Wu et al., 2007). As response pattern and timing of activation of individual genes likely underlie the differences observed between systemic and localized herbivore responses, we simultaneously analyzed time series with two binary factors (treatment and tissue type) using bootstrap-based nonparametric ANOVA models, according to the methods implemented in the R package TANOVA. This method has been designed specifically to handle multifactorial microarray experiments with the aim of extracting gene-specific responses across time series based on their dependency on experimental factors used for comparison (Zhou et al., 2010). We conducted such dynamic response analyses for two tissue comparisons: treated (source) leaf versus untreated systemic (sink) leaf (TvS comparison), to explore differential gene expression patterns activated during shoot systemic signaling; and treated leaf versus untreated root (TvR comparison), to obtain novel insights into root-specific responses.

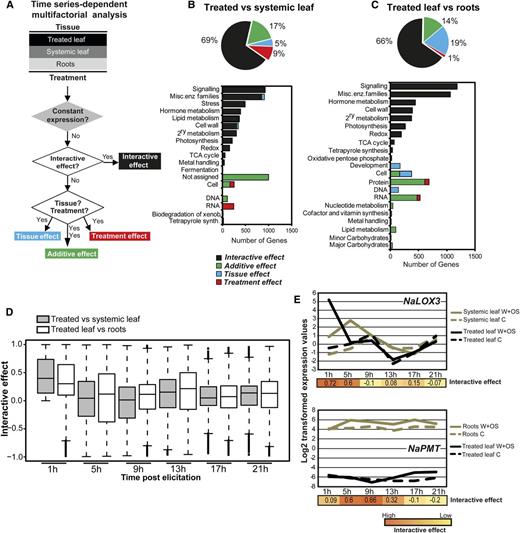
Time series-dependent multifactorial classification of transcripts and encoded molecular processes. A, We employed a bootstrap-based nonparametric ANOVA model to classify transcript levels based on combined significant responses in different tissues and for different treatments across the time series. Transcripts with no significant changes in expression across different conditions were excluded from further analysis. B and C, Functional categorization of transcripts. GO classification was performed for processes with a bin-specific enrichment statistic of F < 0.05. TCA, Tricarboxylic acid. D, Box plots of ANOVA directions, described as a time-response metric representing the significant interactive effect along the time series while comparing systemic tissues (unelicited leaves and roots) with the treated leaves. E, Temporal profiles of two representative genes (NaLOX3 and NaPMT) obtained from clusters exhibiting interactive effects between treated and systemic tissues using ANOVA model analysis on transcript time-response behaviors.
Genes displaying an interactive response pattern were our major interest and were used for further analysis. The set of genes showing interactive effects between treated and untreated leaf tissues constituted 69% of the total probe set, while those showing interactive effects between treated leaf and untreated root tissue constituted 66% (Supplemental File S1). We analyzed the distribution of interactive effects detected in leaf and root tissues using box plots and observed larger effects at 1 and 5 h for the TvS comparison and at 1, 5, and 13 h after elicitation for the TvR comparison (Fig. 2D). To assess the functional significance of these gene clusters, we computed the enrichment of Gene Ontology (GO) terms for genes within each group defined by the multifactorial analysis using hypergeometric tests (F < 10e-10; Fig. 2, B and C). Consistent with previous transcriptomic studies (Hui et al., 2003; Schittko and Baldwin, 2003; Schmidt et al., 2005), the group of genes showing interactive effects in shoots (TvS comparison) was highly enriched for processes associated with signaling, stress responses, hormone metabolism, and secondary metabolism. GO term representations for groups of genes showing additive and treatment effects clearly contrasted with sets of genes with interactive effects. GO terms for these gene classes likely reflect major reconfigurations, coordinated between treated and systemic shoot tissues, of transcriptional and cell cycle machineries. For the TvR comparison, GO terms significantly enriched for interactive effects were from signaling and secondary and hormone metabolism; as expected from the root’s highly specialized physiology, we also observed significant differences between tissue type for a large set of genes with functional terms enriched for development, transcription, and cell cycle machineries.
Biotic and abiotic stresses activate profound reorganizations of the general phenylpropanoid metabolism. Genes in this pathway were among those exhibiting the largest interactive effects in shoots (Supplemental Fig. S2). We evaluated the potential of the time-response metric to improve the detection of coexpression patterns among genes of this pathway compared with the use of average expression data. Supplemental Figure S2 presents Pearson correlation coefficients between NaPAL1, characterized for the first committed step in the phenylpropanoid pathway, and downstream functionally characterized genes. More significant coexpression values between functionally related genes were obtained when using the response metric from the factorial analysis, which was specifically biased at time points showing the best ANOVA structure.
Interactive Time Response Analysis Highlights Branch-Specific Functional Organization and Transition Points in the Oxylipin Gene Network
Genes involved in a common biological process tend to be coregulated and thus under the control of a shared regulatory system (Saito et al., 2008). Since interactive effect vectors capture as a whole the dynamic response of a gene in more than one tissue, we hypothesized that this information could be used as a metric to assess the differential regulation of members of a gene family based on their functional associations with other known genes. To illustrate the value of this approach in delineating pivotal signaling pathways for herbivory responses, we extracted gene interactive responses within the oxylipin pathway and analyzed the activation transition points between the different branches of this pathway (Fig. 3).
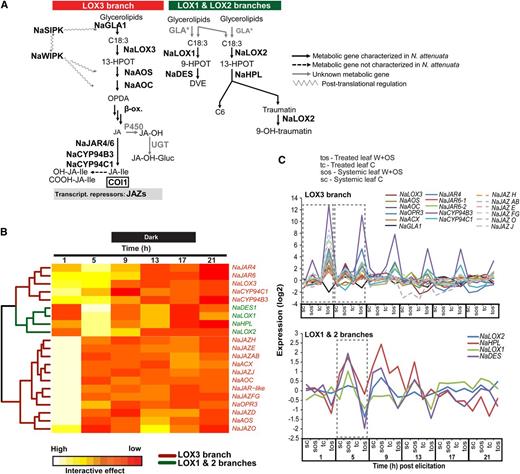
Separation of LOX-dependent branches of the oxylipin pathway based on their ANOVA directions in the time dimension. A, Schematic representation of the three main LOX-based branches of the oxylipin pathway. Free linolenic acid released by the induced activity of a glycerolipase (NaGLA1) is oxygenated by NaLOX3 enzymes (LOX) and converted by a multienzymatic cascade into JA. JA-Ile formed after enzyme-dependent conjugation of JA to Ile and is the bioactive jasmonate interacting with the F-box receptor protein NaCOI1 and NaJAZ transcriptional repressor proteins. C12 and C6 aliphatic chains are produced by the cleavage of NaLOX2-dependent hydroperoxides. Divinyl ether (DVE) oxylipins are produced by enzymatic rearrangement of NaLOX1-dependent hydroperoxides. B, HCA of ANOVA directions for interactive effects for genes involved in the two different branches of the LOX pathway. Elements of the NaLOX3 branch (red) exhibit differential regulation in leaf tissues 1 h after OS elicitation. NaLOX2 and NaLOX1 branches (green) exhibit high interactive effects 5 h after elicitation. C, Temporal profiles for genes from the NaLOX3 pathway showing a high degree of coordination at 1 h and from the NaLOX2 and NaLOX1 pathways showing a high degree of coordination at 5 h.
Oxylipins are bioactive lipids rapidly produced from enzymatic and nonenzymatic fatty oxidation cascades upon various stresses. Lipoxygenases (LOXs) are iron-containing enzymes that catalyze the dioxygenation of fatty acids, the first committed step in oxidation cascades connecting most oxylipin biosynthetic pathways. In most plant systems, different LOX isoforms with different tissue expression and cellular compartmentalization control specific branches of the oxylipin metabolic network. Three LOX genes responsive to OS elicitation have been functionally characterized in N. attenuata (Halitschke and Baldwin, 2003). Activation of NaLOX1 leads in N. attenuata to the production of fatty acid 9-hydroperoxides, which serve as substrates for the formation of fatty acid divinyl ethers by a divinyl ether synthase (Bonaventure et al., 2011). NaLOX2 and NaLOX3 control the biogenesis of two distinct chloroplastic linolenic acid 13-hydroperoxide (13-HPOT) pools (Allmann et al., 2010). NaLOX2-based 13-HPOTs are cleaved by hydroperoxide lyase enzymes into C12 and C6 aliphatic chains, the latter ones being further metabolized into a large array of green leaf volatiles. NaLOX3-based 13-HPOTs are cyclized by the combined action of allene oxide synthase (NaAOS) and allene oxide cyclase (NaAOC) enzymes to serve as precursors for the production of JA and its Ile conjugate (JA-Ile; Fig. 3A), the signaling molecules mediating most of the changes in gene expression occurring during OS elicitation (Wang et al., 2008).
Consistent with the functional diversification of these three LOXs, the temporal profiles of NaLOX1, NaLOX2, and NaLOX3 and functionally associated genes showed distinct responses to OS elicitation in the two leaf tissues that were compared (Fig. 3B): NaLOX3 exhibits interactive effects largely at 1 h after elicitation, while NaLOX1 and NaLOX2 show significant interactive effects 5 h after elicitation. To assess the organization of LOX-dependent oxylipin branches, we also extracted the time-response patterns for genes that had been functionally associated with each LOX branch and assembled them using hierarchical clustering analysis (HCA) based on Euclidean distance measure (Fig. 3C). HCA revealed clearly distinguishable clusters, each with a high degree of coordination among genes involved in the same LOX branch. Interactive effects for all genes of the LOX3 branch were detected 1 h after elicitation, while downstream elements of the LOX1 and LOX2 branches showed significant interactive effects at 5 h. Interestingly, within the LOX3 branch, interactive responses between leaf tissues were highly transient for most structural genes as well as for NaJAZ transcriptional repressors, but NaLOX3 and genes involved in the formation and catabolism of JA-Ile (NaJAR4, NaJAR6, NaCYP94C1, and NaCYP94B3) showed more prolonged interactive effects. A striking observation was the coordination of NaGLA1 (for glycerolipase1), the lipase controlling wound- and herbivory-induced jasmonate levels in N. attenuata leaves (Kallenbach et al., 2010) but not LOX1- and LOX2-dependent oxylipin formation (Bonaventure et al., 2011), with NaLOX3 and associated genes. This pattern, which has not previously been detected in correlational studies of gene expression data, is consistent with the rapid conversion of fatty acid released during herbivory into LOX3-dependent hydroperoxide derivatives (Kallenbach et al., 2010).
SOM-Based Spatiotemporal Resolution of Interactive Responses Identifies the Sequential Activation of Functional Gene Associations
As seen above, clustering genes using their interactive responses as an associative metric clearly delineates the multiple branches of a biological process. To further resolve the temporal distribution of OS-elicited processes, we supplemented the time-response metrics with additional information from the differences in fold change between the two tissues that were compared in factorial analysis as described in “Materials and Methods.” We then used BL-SOM (Hirai et al., 2004) to impose structure on the scaled data. With grids of size 40 × 16 and 40 × 18 for comparisons between treated leaf and systemic tissues (leaves and roots), nodes were mapped into a six-dimensional space, initially based on principal component analysis. On subsequent iterations (200), a data point was selected and its nearest nodes were adjusted by moving toward the selected point, finally converging to distinctive and tight clusters (Fig. 4A). Maps produced for each comparison were colored so that red clusters represent major up-regulated elements in treated leaves and minor down-regulated elements in untreated systemic tissue. Similarly, blue clusters represent major up-regulation in untreated systemic tissue with minor down-regulated elements in treated leaves. Each cluster, termed an interactive motif, contains a set of nodes with genes showing interactive responses of similar amplitude (Fig. 4B). Since regulation patterns could differ slightly for genes involved in one particular process, functionally associated genes tend to localize not necessarily within the same node but within a common interactive motif. The nodes in these spatiotemporally resolved motifs with similar ANOVA directions along time series may be biologically related, as their dynamic responses are highly coordinated.
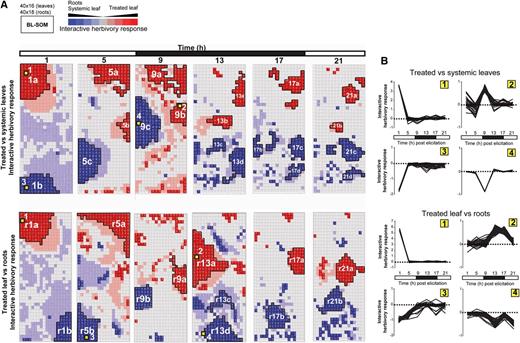
Spatiotemporal resolution of herbivory-regulated interactive motifs in gene expression. A, Time-response metrics, derived from bootstrap-based nonparametric ANOVA models for genes with tissue-specific responses to OS elicitation, were scaled and classified by BL-SOM. Red and pink clusters represent sets of genes showing up-regulation in treated leaves or down-regulation in unelicited tissues (roots or systemic leaves). Blue and pale blue clusters represent sets of genes showing up-regulation in unelicited systemic tissues (roots or systemic leaves) and down-regulation in elicited leaves. B, Each node in the grid represents a cluster of genes with similar amplitude of responses to simulated herbivory, defined as the product of the response metric with fold change differences between tissues that were compared. GO term enrichment for these motifs is presented in Supplemental Figure S4.
Examination of major interactive motifs extracted from the SOM grid underscored fundamental trends in the spatiotemporal activation of OS-elicited transcriptional rewiring. Consistent with the interactive effect concept, gene assemblies according to interactive effect metrics appeared highly tissue specific and greatly plastic over time (Fig. 4A). Thus, we observed few topological overlaps between interactive motifs formed at each time point and in different tissues. For the TvS comparison, we observed a clear reduction in the size of the treated leaf interactive motifs (red clusters) along the time series, suggesting a rapid dampening of local herbivory responses concomitant with an increase in the size of the systemic leaf interactive motifs (blue clusters) starting after 1 h and attaining maximum values 9 h after OS elicitation. A similar trend of dampening of responses in treated leaves was observed for the TvR comparison, except for 13 h after OS elicitation in the middle of the dark phase. Mapping genes known to be regulated by fatty acid-amino acid conjugates (FACs; Gilardoni et al., 2010), well-established elicitors contained in M. sexta OS (Halitschke et al., 2001), revealed significant enrichment of these FAC-regulated genes in motifs labeled as 1a, 5a, and 5c for the TvS comparison and r1a, r5a, r1b, and r5b for the TvR comparison, indicating that FAC signaling had a strong contribution to the activation of these interactive motifs. GO enrichment analyses for these motifs (1a, 1b, 5a, 5b, r5a, and r5b) are well represented by processes involved in signaling cascades and secondary metabolism (Supplemental Fig. S4).
Plant tissue-specific responses to insect herbivory are thought to be controlled by tissue-specific activation and interaction between hormone gene networks (Meldau et al., 2012). Consistent with this view, our factorial analysis revealed significant differences in the amplitude and timing of the activation of hormone gene networks between damaged and systemic leaf tissues. Thus, the intensity of the ANOVA signals for genes encoding for JA (maximum at 1 h; Fig. 3), ethylene (1, 5, and 9 h), auxin (1, 5, and 9 h), cytokinin (1 h), and brassinosteroid (1 h) synthesis and connected signaling components was higher in treated leaf tissues (Supplemental Figs. S3 and S4). Additionally, we observed specific sets of genes encoding notably auxin- and ethylene-related signaling processes that displayed high responses to OS elicitation in untreated systemic leaf tissues (Supplemental Figs. S3 and S4).
Studying OS Responses in Systemic Leaf Tissues Using Interactive Motifs: the Acyclic Diterpene Glycoside Pathway as a Case Study
Coordinated pattern analysis based on dynamic response information from factorial analysis suggested better clustering with fewer false positives and separated components of biological machineries deployed at different times after elicitation. Next, we analyzed gene-gene networks to understand how different biological functions are orchestrated. To understand the performance of entire parts of the OS-elicited transcriptome, we isolated interactive motifs from the SOM grids and analyzed their dynamic behaviors using network analysis.
We used this network-based approach to analyze the regulation of OS-elicited changes in the acyclic diterpene glycoside pathway. 17-Hydroxygeranyllinalool diterpene glycosides (17-HGL-DTGs) are a group of sugar-containing defense metabolites active against a wide spectrum of herbivores (Heiling et al., 2010). The high abundance of these metabolites and their rapid de novo production in systemic tissues during herbivory are controlled by important transcriptional changes that are not completely understood (Heiling et al., 2010). Three experimentally validated genes, NaDXS, NaDXR, and NaGGPPS2, of the nonmevalonate pathway (the 2-C-methyl-d-erythritol 4-P/1-deoxy-d-xylulose 5-P pathway) involved in the biosynthesis of geranylgeranyl pyrophosphate (GGPP), forming the backbone of 17-HGL-DTGs (Jassbi et al., 2008), as well as three other genes (NaHDR, NaHDS, and NaISPD) predicted based on their homology to Arabidopsis (Arabidopsis thaliana) isoprenoid genes, were mapped to the SOM grid and found to be localized in the same interactive motif (5c), the largest one showing a huge response to OS elicitation in systemic leaves. GO terms enriched (F < 10e-10) for this motif are overrepresented by those involved in photosystem, hormone metabolism, secondary metabolism, and stress, with a major section of them having unknown functions.
Using a module-centric approach, we extracted this interactive motif to construct a gene-gene network using a statistically sound two-stage coexpression detection algorithm with FDR = 0.05 and a minimal acceptable strength of 0.7 using the GeneNT package in R (Fig. 5A). We found that this network shares properties of other biological networks. The scale-free topology is of 0.96, which suggests that the network is composed of many genes with few connections but a few genes with many connections. Additionally, the clustering coefficient, which provides a measure of cliquishness (0.516), and the measure of network heterogeneity, which reflects the tendency of a network to contain hub nodes (1.40), are within ranges expected for biological networks (Supplemental Fig. S5). Interestingly, we observed the highest degree of connectivity for the six genes of the nonmevalonate pathway (Supplemental Fig. S6), suggesting tight coregulation between this process and a large array of gene networks activated in untreated systemic leaves or suppressed in treated leaves 5 h after OS elicitation (interactive motif 5c). Network analysis also confirmed differential functional activation of the three NaGGPPS genes present in N. attenuata, with NaGGPPS1 showing no significant interactive effect in the TvS comparison while the other two showed large differences in their degree of connectivity in the motif 5c network [deg(NaGGPPS2) = 224, deg(NaGGPPS3) = 90].
![OS elicitation selectively activates interactive motif formation in unelicited systemic leaves. A, Distribution of enriched GO for a gene set extracted from motif 5c, which displayed major transcriptional changes in unelicited systemic leaves 5 h after elicitation. Extracted genes were used to construct a gene-gene network representing connectivities screened with FDR = 0.05 and a minimum Pearson correlation of 0.98. A known gene with the highest degree of nodal connectivity (NaGGPPS2) is used to illustrate temporal overlap between the two different treatments (W+OS/C and W+W/C). B, Analysis of differentially expressed genes between the control and W+OS for a single time point (5 h after elicitation) for treated and systemic leaves independently. The pie chart represents the distribution of enriched GO terms for both down-regulated pathways in elicited tissues and up-regulated pathways in unelicited systemic tissues. 2ry, Secondary; AA, amino acid; Misc. enz., miscellaneous enzymes; met., metabolism. [See online article for color version of this figure.]](https://oup.silverchair-cdn.com/oup/backfile/Content_public/Journal/plphys/162/2/10.1104_pp.113.217588/2/m_plphys_v162_2_1042_f5.jpeg?Expires=1747886546&Signature=jFzgM3o3~vPhZ2TWKZryBFzQKeb2oSOzwzqHOvSbHDx1aTLArr0EU6V9xRD9Cesa7neE0h~Icx9qrnNGlhyGN4JFSDaht2rZyqO4YDtfKr-Leg6yPqir-cJQA~McNFRwpLlj2-bcgf7XAVWOtspcYa1VkAXsiOe5CIaQKcRSAeWGLvJMmZfhsmgGh0A3wJaFohzaoDLJjeNrq~rYIzrepA0uEQwfuQfkJIqan3B31c-UYjFPxOtTPkSfmULnmGSauONIOVl8sKZ66siHAeP0Vv-6cRnJuTE82WLY~XH2r-6X4~M9nYq~EBN1EMYOcvz-KJbdgmZWuOVUYUlWdHLZgA__&Key-Pair-Id=APKAIE5G5CRDK6RD3PGA)
OS elicitation selectively activates interactive motif formation in unelicited systemic leaves. A, Distribution of enriched GO for a gene set extracted from motif 5c, which displayed major transcriptional changes in unelicited systemic leaves 5 h after elicitation. Extracted genes were used to construct a gene-gene network representing connectivities screened with FDR = 0.05 and a minimum Pearson correlation of 0.98. A known gene with the highest degree of nodal connectivity (NaGGPPS2) is used to illustrate temporal overlap between the two different treatments (W+OS/C and W+W/C). B, Analysis of differentially expressed genes between the control and W+OS for a single time point (5 h after elicitation) for treated and systemic leaves independently. The pie chart represents the distribution of enriched GO terms for both down-regulated pathways in elicited tissues and up-regulated pathways in unelicited systemic tissues. 2ry, Secondary; AA, amino acid; Misc. enz., miscellaneous enzymes; met., metabolism. [See online article for color version of this figure.]
To infer OS elicitation-specific gene associations, we constructed a partial coexpression network using the first neighbors of NaGGPPS2 for the W+W treatment from the set of genes analyzed with the same parameters of the factorial analysis and compared it with the subnetwork from the W+OS treatment. A large number of genes uniquely expressed in the W+OS condition failed to show interactive behavior in the W+W treatment, which reduced the number of connections in the W+W subnetwork (Fig. 5A). GO terms overrepresented in the OS elicitation-specific subnetwork include those from the photosynthetic pathway and from secondary metabolite and phytohormone metabolism, reinforcing the conclusion that OS-based signaling controls the recruitment and coherent activation of molecular processes otherwise loosely connected.
To further support this conclusion, we conducted a single-time-point differentially expressed genes analysis for 5-h elicitation samples of both tissues independently and detected a large number of genes uniquely up-regulated in systemic leaves and down-regulated in treated leaves (Fig. 5B). As expected, major processes highlighted by this analysis included secondary metabolism and hormone metabolism as up-regulated pathways in untreated systemic leaf tissue and genes from photosynthetic pathways as down-regulated processes in treated leaf tissue. The biosynthesis of plastid isoprenoids by the nonmevalonate is essential for photosynthesis and chloroplast function (Vranová et al., 2012). Dense connectivities were shared between the nonmevalonate/17-HGL-DTG pathways and photosynthetic genes, suggesting yet-unknown coordination mechanisms between these two processes and consistent with the previously reported transcriptional down-regulation of photosynthesis (Halitschke et al., 2001; Hui et al., 2003; Mitra and Baldwin, 2008) as an integral part of the mechanisms facilitating defense compound production.
Factorial Analysis Reveals OS-Elicited Metabolic Changes with Diverse Response Patterns
To facilitate the interpretation of the large transcriptomic differences observed between elicited and unelicited tissues, we profiled downstream metabolite responses using a broadly targeted UHPLC-qTOFMS metabolomic approach (Gaquerel et al., 2010). Often in such large-scale profiling, several compounds are not completely chromatographically resolved or are observed with shifts in their retention times, so mathematical procedures involving deconvolution and retention time corrections need to be applied to extract accurate mass spectra with resolved chromatographic peaks for further comparisons. These procedures require samples with somewhat similar metabolomes; therefore, we only processed treated leaf and untreated systemic leaf tissues for all time points, and the two conditions together for both positive and negative modes, using the XCMS package in R.
The first stage in the identification of differences between local and systemic responses is the projection of the ANOVA structure obtained by fitting the same ANOVA models used in the transcriptomic analysis. The experimental factors used were treatment (control and W+OS) and tissue type (treated and untreated leaves). As with the transcriptomic analysis and using the same parameters (FDR = 0.05, bootstraps = 200), the sampling time was not taken as another factor but was used to find the best ANOVA structure along the optimal direction resulting in response metrics. In addition to the induced changes in responses to OS (treatment effect), a set of metabolites of interest also showed small differences between the two leaf tissues (tissue effect); hence, they were classified in an additive bin. Therefore, in order to increase metabolite coverage, we combined both bins of ions showing interactive and additive effects for further analysis. A total of 19.2% (1,610 of 8,357) of mass-to-charge ratio (m/z) signals from the positive mode and 26.9% (720 of 2,676) of m/z signals from the negative mode showed major differences in induced responses between leaf tissues for at least one time point in the series (Supplemental Files S2 and S3). This is severalfold fewer than the transcriptomic differences observed between the responses of the two leaf tissues. One reason for this lower coverage could be the use of a targeted approach for profiling major classes of secondary metabolites; moreover, some metabolites showed large constitutive biological variation, which thwarted the detection of significant differences between control and W+OS conditions with FDR = 0.05. For further analysis, we also combined positive and negative mode m/z lists. We extracted and plotted response metrics obtained from the factorial analysis for both bins and observed larger differences between elicited and unelicited leaves at 9 and 13 h after elicitation (Fig. 6A, box plots). Finally, we scaled the interactive response metrics with additional data of the fold change differences between elicited and unelicited leaf tissue, as described in “Materials and Methods,” and visualized these differences using HCA. We observed a large number of small clusters showing very diverse patterns across combinations of time points after elicitation. Larger accumulation of metabolites in systemic tissues was observed at 9, 13, and 17 h after elicitation, reflected by the red part of the color scheme used in the HCA. This difference in the timing of activation of transcriptomic changes in systemic tissues (1 and 5 h after elicitation; Fig. 4, blue motifs 1b and 5b) and metabolic changes (Fig. 6A) was likely due to a time lag in the biosynthesis of metabolites compared with underlying gene expression or to the transport of metabolites from treated to untreated leaf tissues.
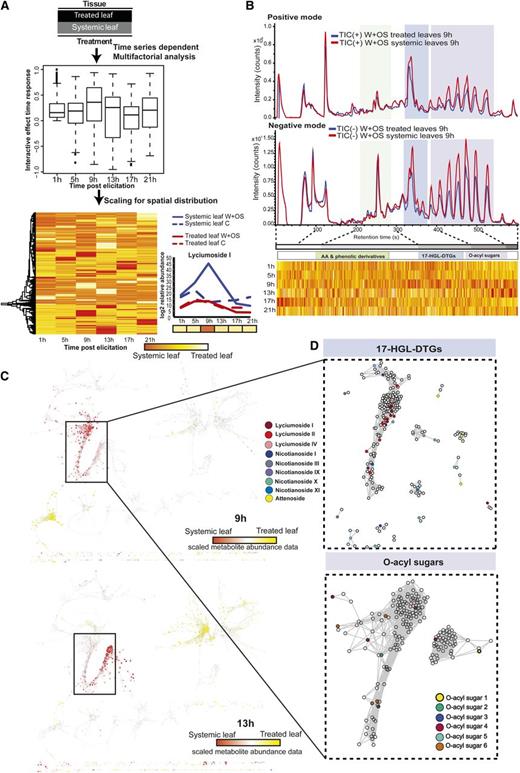
Factorial analysis revealed OS-elicited large-scale metabolic changes with diverse response patterns across the time series. A, Elicited and unelicited leaf tissues were compared for control and W+OS treatments using multifactorial analysis. Box plots represent the distribution of interactive response metrics across the time series. Ions with interactive effects were scaled and used for HCA. B, Chromatograms for treated leaf and untreated systemic leaf tissues obtained 9 h after W+OS elicitation and aligned with heat maps representing scaled interactive effect data ordered by retention time. C, Visualization of systemic responses occurring 9 and 13 h after elicitation localized on different branches of the metabolite-metabolite network. D, Partial network representations of the first neighbors of known 17-HGL-DTG and O-acyl sugar m/z signals extracted from the same branch of the network. AA, amino acid; TIC, total ion current.
To identify major classes of compounds showing larger differences between the two leaf tissues, we included the additional information of retention time and mapped interactive effects onto the chromatographic scale. Figure 6B highlights three main regions of the chromatogram showing differential OS responses in treated and systemic leaves at 9 h after elicitation for both positive and negative modes, corresponding to phenolic derivatives, 17-HGL-DTGs, and O-acyl sugars, well-studied classes of defense metabolites. Next, we ordered ions by their retention time and visualized the scaled data obtained from factorial analysis using heat maps. Since we reduced the number of ions based on the ANOVA model for their differential behavior between the two tissues, we created bins of retention times for these selected ions to match the chromatogram for visualization. To further illustrate the application of this approach, we focused on responses detected at 9 h after OS elicitation. This exploratory analysis covers the spanned red regions across the classes of 17-HGL-DTGs and O-acyl sugars for 9 h after elicitation, which suggests tandem induction and/or metabolic cross talk among several of the metabolic pathways affected by OS elicitation in systemic tissues. To understand such concerted increases in metabolites, we constructed metabolite networks based on associations among metabolites (Pearson correlation ≥ 0.98; Fig. 6C). We mapped scaled data on the network to visualize distinctly occupied branches of the network in which the red regions spanned, containing different sets of ions with high OS responses in systemic leaves at 9 and 13 h. We isolated a branch enriched with m/z signals showing induction in systemic leaves at 9 h and detected the presence of different known 17-HGL-DTGs; interestingly, in the same network branch, we also found several m/z signals corresponding to O-acyl sugars (Supplemental Fig. S7). Consistent with the power of this approach to cluster biochemically connected metabolites, we additionally observed highly coordinated dynamic responses between shikimate pathway-derived amino acids and downstream metabolites produced within the phenylpropanoid pathway (Supplemental Fig. S2).
Time-Lag-Corrected Correlation on the Interactive Response Metric Supports the Reconstruction of Gene-to-Metabolite Networks
The nature of the coregulation of functionally related genes and metabolites could vary depending on the biological activity of the studied metabolic class and the experimental conditions applied. The patterns of correlation between metabolite and transcript data have been successfully analyzed in a few studies using high-resolution time-course analyses (Hirai et al., 2004), but most studies in this field, including our work (Fig. 7), have reported significant differences in the temporal dynamics of transcriptomes and metabolomes (Walther et al., 2010; Takahashi et al., 2011). Considering the complex interdependencies between metabolites and transcripts, we sought to detect and interpret gene-metabolite interactions at the level of isolated pathways for TvS comparisons using the interactive responses of genes and metabolites as associative metrics and used this approach to study previously reviewed oxylipin and 17-HGL-DTG pathways.
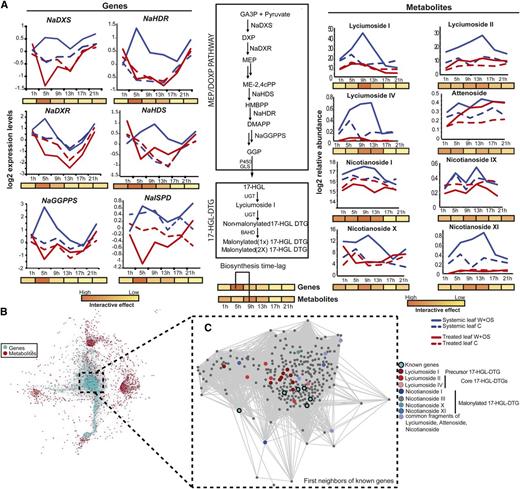
Gene-metabolite associations underlying the formation of 17-HGL-DTG in N. attenuata. A, Temporal profiles for identified acyclic 17-HGL-DTG and known hub genes in the biosynthetic network of these metabolites, with the schematic of the diterpene glycoside synthetic pathway. B, Network constructed after time-lagged correlation on the interactive patterns of the module representing major transcriptomic changes in systemic leaves 5 h after elicitation and the entire set of metabolites classified for differential changes in treated and systemic leaves in response to simulated herbivory. C, Partial coexpression network representing the first neighbors of identified 17-HGL-DTG in N. attenuata. The cluster represents the strong connectivity between 17-HGL-DTG metabolites and known biosynthetic genes in N. attenuata. Other previously characterized m/z features present in this cluster are enriched for O-acyl sugar-associated signals. BAHD, acyltransferase; GLS, geranylinalool synthase; MEP/DOXP, non-mevalonate pathway or 2-C-methyl-D-erythritol 4-phosphate/1-deoxy-D-xylulose 5-phosphate pathway; UGT, UDP-glucosyltransferase.

We constructed a gene-to-metabolite network using lagged time-specific data with Pearson correlation ≥ 0.98. Figure 7B presents a magnification of the network region containing the first neighbors of the six known genes of the nonmevalonate/17-HGL-DTG pathways in strong associations with m/z signals derived from 17-HGL-DTGs. We observed strong coordination between 17-HGL-DTGs, O-acyl sugars, genes from the nonmevalonate/17-HGL-DTG pathways, and photosynthetic genes. Unknown m/z signals reported in this network represent potential molecular fragments of the aforementioned compounds that will need to be confirmed by additional mass spectrometry-based fragmentation analysis.
DISCUSSION
The comprehensive classification of leaf and root herbivory-activated gene expression levels presented here significantly expands our knowledge of the multidimensionality of herbivory-activated transcriptional and metabolic reprogramming. The use of SOM on interactive effect-response metrics derived from factorial analysis, instead of raw expression signatures, enabled a reconstruction of gene-gene, metabolite-metabolite, and gene-metabolite associations with a high degree of predictive power. Spatiotemporal maps produced in this study not only underscore the high plasticity of OS elicitation responses but also provide a powerful data platform for the functional genomics of novel regulatory and structural genes involved in antiherbivory processes. The two metabolic routes investigated in greater detail in this study, oxylipin signaling and 17-HGL-DTG pathways, illustrate fundamental working aspects of gene-metabolite networks in terms of activation and transition points during herbivory and shared patterns of regulation with other physiological processes.
Elucidating groups of genes involved in the sequential reorganization of biological networks is extremely challenging using the available bioinformatics approaches, but we successfully studied such a reorganization by systematically combining information about when to respond (time points) with information about how to respond (fold changes). This method could be used to query different gene families of interest as input or to discover regulatory motifs for each separated module from the SOM grid. The applicability of this method can be further extended to study diurnal rhythms perturbed in response to herbivore attack (Kim et al., 2011) by considering the ordering of time points before deriving the optimal direction for the best ANOVA structure. Here, we demonstrate that SOM-based herbivory-elicited interactive motifs are highly tissue specific, highly versatile, and decrease in size for later time points, reflecting specific sequential responses deployed in different tissues. We speculate that this increased modularity in time reflects the functional specialization of the sequential responses deployed in the different tissues. These observations are in line with smaller scale transcriptional screens published by several groups indicating that insect herbivory results in major shifts in almost every aspect of a plant’s physiology (Hermsmeier et al., 2001; Schmidt et al., 2001). The fact that large-sized interactive motifs are more pronounced in systemic tissues at 5, 9, and 13 h after elicitation indicates the involvement of organismic-level responses specifically triggered by OS-based signaling, with a large proportion of these also attributable to unexplored root-specific processes. Previous work has shown that the elicitation in N. attenuata shoots of defense-related transcriptional and metabolic programs relies on the rapid translocation, specifically triggered by OS perception, of signaling molecules from the sites damaged by insects to systemic undamaged tissues (Wu et al., 2007). Jasmonate signaling through the plant vasculature has major functions in this process and is controlled by rapid transcriptional and posttranscriptional changes (Wu and Baldwin, 2010).
Analysis of interactive effects and response timings for jasmonates and oxylipin genes illustrates that the extraction of multifactorial statistical information in terms of response patterns not only facilitates the clustering of genes involved in similar biochemical pathways, as also shown for the phenylpropanoid (Supplemental Fig. S2) and 17-HGL-DTG pathways (Figs. 6 and 7), but also the identification of transition points in the activation of certain pathways (Fig. 3). Most structural genes involved in the biogenesis of jasmonates (NaAOS, NaAOC, and β-oxidation components), associated upstream signaling components such as mitogen-activated protein kinase (NaSIPK and NaWIPK), posttranslationally activating linolenic acid release and hydroperoxidation by NaLOX3 (Kallenbach et al., 2010), and downstream signaling components such as transcriptional repressors (NaJAZs) and NaMYC2, show transient interactive responses. In clear contrast, metabolic systems involved in the initiation of JA synthesis (NaLOX3), its conjugation to form bioactive JA-Ile (NaJAR4/NaJAR6), and the catabolism of this signaling molecule (NaCYP94C1 and NaCYP94B3; Koo et al., 2011; Heitz et al., 2012) exhibited a prolonged interactive effect. Experimental work supported by mathematical modeling (Banerjee and Bose, 2011) has demonstrated that the transient nature of the jasmonate pulse and most of the underlying gene expression is an outcome of two opposing influences. Jasmonate accumulation activates a positive feedback loop in which the expression of jasmonate biosynthesis genes is activated after degradation of a specific set of JAZ proteins inhibiting MYC2 transcriptional activity (Chung et al., 2008). This positive loop is counterbalanced by the MYC2-dependent increased expression of JAZs repressing jasmonate signaling transduction (Chini et al., 2007). Prolonged interactive responses for certain genes that contrast with the pulse effects, however, are consistent with the existence, as suggested by different experimental efforts (Howe et al., 2000; Strassner et al., 2002), of additional regulatory loops modulating transition points in pathway activation.
To analyze the metabolic output of these large transcriptional changes, we also profiled metabolites for the same experimental conditions and tissue types (Fig. 6). Even though instrumental in highlighting the breadth of the complete metabolic profile being affected by the treatment, the mining of these data are extremely challenging, notably due to compound-specific in-source fragmentation resulting in redundant signal detection (Dettmer et al., 2007) and also because of the scarcity of methods available for analyzing such complex factorial time-series data. Here, we demonstrate the advantage of constructing a dynamic correlation network based on response features captured by the factorial analysis. This conclusion is based on the inference of compound-family-wise grouping of m/z signals exhibiting similar interactive effects (e.g. for 17-HGL-DTG and O-acyl sugar fragmentation patterns) and on the detection of a significant coexpression, after time-lag correction of interactive effect metrics, of structural genes and metabolites of the 17-HGL-DTG pathway (Fig. 7). To our knowledge, this analysis represents the first successful example of spatiotemporal categorization on a pathway scale of induced changes in plant transcriptomics and metabolomics data.
The analysis of OS-specific interactive motifs activated in systemic tissues as well as network reconstructions placed known genetic elements of the nonmevalonate pathway at the center of the largest gene network formed in systemic leaf tissues following OS elicitation (Fig. 5). This is consistent with the role of the nonmevalonate pathway as a central metabolic provider for the production of structurally diverse plastidic isoprenoids such as carotenoids, phytol (a side chain of chlorophylls), isoprene, and monoterpenes and diterpenes (Vranová et al., 2012). In N. attenuata, this plastidial metabolic route also supplies the production of 17-HGL-DTG, an important defensive molecule increasing in concentration during insect herbivory (Heiling et al., 2010). The organization of the molecular processes within this OS-specific gene network supports known metabolic interactions between the nonmevalonate pathway, photosynthesis, and chloroplast functions (Vranová et al., 2012) and, more importantly, highlights that the induction of 17-HGL-DTG structural genes represents one of the major reorientations of the gene network dynamics triggered by OS elicitation. The de novo production of 17-HGL-DTGs during OS elicitation documented in this study relies on the biogenesis of the GGPP backbone by a specific GGPPS, NaGGPPS2 (Jassbi et al., 2008). Here, we show that expression of the gene coding for this protein is part of the hub region of a gene network, while the two other NaGGPPS copies (NaGGPPS1 and NaGGPPS3) exhibit reduced connectivity with this hub region. We predicted the subcellular location of these three proteins based on the presence of chloroplast transit peptide, mitochondrial targeting peptide, or secretory pathway signal peptide (Emanuelsson et al., 2007). Therefore, NaGGPPS2 and NaGGPPS3 with high chloroplast transit peptide scores (0.369 and 0.457) are most likely localized in the chloroplast, while NaGGPPS1 showed insignificant scores for chloroplast transit peptide, mitochondrial targeting peptide, and secretory pathway signal peptide. These predictions further support our findings on the differential activation of these three GGPPS genes in response to OS elicitation.
The ability to reconstruct tissue-specific gene-to-metabolite dynamics with high confidence underscores the importance of extracted time-response patterns for features of interest, which single-point analysis or pooled data using time series as a third factor would fail to identify (Supplemental Fig. S6). This novel method of combining multifactorial analysis with the information extracted from time-series data is broadly applicable to investigate signaling/metabolic pathways in other biological systems with time-series data to deduce the activation times of particular response elements required for understanding complex physiological processes. This strategy can further be used for improving clustering analyses by applying a dimension reductionist approach, for different cell/tissue types, developmental stages, or genetic backgrounds, based on the time-response metric.
MATERIALS AND METHODS
Plant Material
Wild-type Nicotiana attenuata from an inbred line in its 30th generation was used for all gene expression and metabolite profiling experiments. All seeds were first sterilized and incubated with diluted smoke and 0.1 m GA3, as described (Krugel et al., 2002), and then germinated on plates containing Gamborg B5 medium. Ten-day-old seedlings were transferred to small pots (TEKU JP 3050 104 pots; Pöppelmann) with Klasmann plug soil (Klasmann-Deilmann), and after 10 d, seedlings were transferred to 1-L pots with sand to facilitate the sampling of roots. Plants were grown in the glasshouse with a day/night cycle of 16 h (26°C–28°C)/8 h (22°C–24°C) under supplemental light from Master Sun-T PIA Agro 400 or Master Sun-TPIA Plus 600-W sodium lights (Philips Sun-T Agro).
Plant Treatment Experimental Design
A scheme for plant treatments and the work flow for data collection/analysis are shown in Figure 1. Briefly, plant treatments (no treatment, mechanical wounding, and simulation of Manduca sexta feeding) were randomly applied to plants in the early elongating stage of growth. To simulate M. sexta feeding, the laminas of three leaves per plant (two source leaves at nodes +2 and +1 and one source-sink transition leaf at node 0) were mechanically wounded with a fabric pattern wheel on both sides of the midrib, and immediately, 20 µL of M. sexta OS (diluted 1:10 in water) was applied to the fresh wounds (W+OS). This procedure, which is referred to as OS elicitation, has been shown to recapitulate most of the reconfigurations occurring in the leaf transcriptome, proteome, and metabolome during M. sexta feeding (for review, see Wu et al., 2010). M. sexta OS were collected from third to fourth instar larvae reared on N. attenuata wild-type leaves as described (Roda et al., 2004), and eggs of this insect species were obtained from North Carolina State University. Responses inherent to the mechanical damage were monitored by applying 20 µL of deionized water onto the wounds (W+W). For each time point (1, 5, 9, 13, 17, and 21 h after treatment), treated leaves or control ones at the same nodal positions, systemic leaves (two sink leaves at nodes −1 and −2), and the complete root system were collected from six plants and immediately flash frozen in liquid nitrogen. Roots were washed in a water tank for a few seconds to remove sand.
Analysis of Leaf Metabolites by UHPLC-ESI/qTOFMS
Metabolites were extracted from all local and systemic leaf samples. We used a 40% methanol extraction procedure optimized for the recovery of a wide range of metabolites of interest in N. attenuata (Gaquerel et al., 2010). Approximately 100-mg aliquots of liquid nitrogen-ground leaf powder were extracted by adding 1 mL of acidified 40% methanol prepared with 0.5% acetic acid water to each sample in 2-mL microcentrifuge tubes with metal balls. The samples were homogenized in a ball mill (Genogrinder 2000; SPEX CertiPrep) for 45 s at 250 strokes min−1. Homogenized samples were then centrifuged at 16,000g and 4°C for 30 min, and supernatants were transferred into 1.5-mL microcentrifuge tubes. Two microliters of the extracts prepared as above was separated using a Dionex rapid separation liquid chromatography system equipped with a Dionex Acclaim 2.2-μm, 120-A, 2.1- × 150-mm column, applying the following binary gradient: 0 to 6 min, isocratic 70% A (deionized water, 0.1% [v/v] acetonitrile [Baker; HPLC grade], and 0.05% formic acid), 30% B (acetonitrile and 0.05% formic acid); 6 to 13 min, isocratic 20% A, 80% B and 70% A, 30% B; 13 to 18 min, isocratic 70% A, 30% B. Flow rate was 200 µL min–1. Eluted compounds were detected by a MicroToF quadrupole time-of-flight mass spectrometer (qTOFMS; Bruker Daltonics) equipped with an electrospray ionization source. To maximize metabolome coverage, mass spectral detection was performed in both positive and negative ionization modes. Typical instrument settings were as follows: capillary voltage, 4,500 V; capillary exit, 130 V; dry gas temperature, 200°C; and dry gas flow, 8 L min–1. m/z values were detected within a range from m/z 200 to 1,400 at a repetition rate of 1 Hz. Mass calibration was performed using sodium formate clusters (10 mm solution of NaOH in 50:50 [v/v] isopropanol:water containing 0.2% formic acid).
Microarray Data Analysis
Three biological replicates from six harvested replicates were used for RNA isolation. Total RNA was isolated with TRIZOL reagent and labeled copy RNA with the Quick Amp labeling kit (Agilent). Each sample was hybridized on Agilent single-color technology arrays (4×44K 60-mer oligonucleotide microarray designed for N. attenuata transcriptome analysis; http://www.agilent.com; accession no. GPL13527). All microarray data with each probe name were deposited in the National Center for Biotechnology Information Gene Expression Omnibus database (accession no. GSE30287). Raw intensities were log2 and baseline transformed and normalized to their 75th percentile using the R software package, prior to statistical analysis.
Processing of Metabolomics Data
Raw data files were converted to netCDF format using the export function of the Data Analysis version 4.0 software (Bruker Daltonics) and processed using the XCMS package in R (Smith et al., 2006). Peak detection was performed using the centwave algorithm with the following parameter settings: ppm = 20, snthresh = 10, peakwidth = c(5,18). Retention time correction was accomplished using the XCMS retcor function with the following parameter settings: mzwid = 0.01, minfrac = 0.5, bw = 3. Areas of missing features were estimated using the fillPeaks method. Annotation of compound spectra derived from in-source fragmentation during ionization and corresponding ion species was performed with the BioConductor package CAMERA (version 1.9.8; Kuhl et al., 2012). Compound spectra were built with CAMERA according to the retention time similarity, the presence of detected isotopic patterns, and the strength of the correlation values among extracted ion currents of coeluting m/z features. CAMERA grouping and correlation methods were used with default parameters. Clustered features were annotated based on the match (±5 ppm) of calculated m/z differences versus an ion species and neutral loss transitions rule set (Supplemental File S2). Consistent mass features that were at least present in four out of the six biological replicates with a retention time greater than 1 min were considered for further analysis. Zero values, which remained after application of the “filling in” function in XCMS, were replaced by one-half of the minimum positive value of the ion across all time points and conditions in the original data. Raw intensity values were 75th percentile normalized before statistical analysis. Metabolite fragmentation patterns were annotated as described in Supplemental Materials and Methods S1.
Statistical Analysis and Data Visualization


BL-SOM for transcriptomic data were constructed using BL-SOM software (http://prime.psc.riken.jp/?action=blsom_index) with X coordinates sized 40. Networks representing associations between genes and metabolites were visualized with Cytoscape (http://www.cytoscape.org/) using organic layouts. Topological properties of the networks were analyzed using the NetworkAnalyzer plugin in the Cytoscape software. HCA for all heat maps is based on Euclidean distance measures and average linkage aggregation methods. All heat maps and box plots were created using R.
Supplemental Data
The following materials are available in the online version of this article.
Supplemental Figure S1. Examples of the structures obtained (interactive, additive, and major effects) by fitting ANOVA model.
Supplemental Figure S2. Interactive effect responses of phenylpropanoid pathway genes are highly coordinated.
Supplemental Figure S3. SOM-based classification of FAC-responsive and hormone and secondary metabolism genes in leaves.
Supplemental Figure S4. Enriched GO terms for a few important motifs extracted from SOM analysis unravels large OS-specific gene expression responses in treated leaves and untreated systemic tissues (leaves and roots).
Supplemental Figure S5. Power law distribution plot of the network representation obtained for genes extracted from motif 5c, showing many genes with few connections but a small set of genes with many connections.
Supplemental Figure S6. Gene-gene Pearson correlation for six genes from the nonmevalonate pathway using five different metrics.
Supplemental Figure S7. Temporal profiles for m/z signals corresponding to the class O-acyl sugars exhibit high correlation and colocalize with those of 17-HGL-DTG in the network.
Supplemental Figure S8. Temporal profiles of NaLOX3, functionally characterized for the production of JA and m/z signal of JA.
Supplemental File S1. Multifactorial analysis and BL-SOM results for gene expression data.
Supplemental File S2. UHPLC-TOFMS metabolomic positive and negative mode data.
Supplemental File S3. Multifactorial analysis results for metabolomic data.
Supplemental Materials and Methods S1. Identification of metabolites from UHPLC-TOFMS data.
ACKNOWLEDGMENTS
We thank Eva Roth and Felipe Yon for their help with sample preparation as well as Dr. Matthias Schöttner, Dr. Klaus Gase, and Wibke Krober for technical assistance with metabolomics and microarray analyses.
Glossary
- GRN
gene regulatory networks
- BL
batch-learning
- SOM
self-organizing maps
- OS
oral secretions
- FDR
false discovery rate
- TvR
treated leaf versus untreated root
- TvS
treated (source) leaf versus untreated systemic (sink) leaf
- GO
Gene Ontology
- JA
jasmonic acid
- JA-Ile
Ile conjugate of jasmonic acid
- HCA
hierarchical clustering analysis
- FAC
fatty acid-amino acid conjugate
- 17-HGL-DTG
17-Hydroxygeranyllinalool diterpene glycoside
- m/z
mass-to-charge ratio
- UHPLC- qTOFMS
ultra-high performance liquid chromatography coupled to a quadrupole time-of-flight mass spectrometer
LITERATURE CITED
Author notes
This work was supported by the Max Planck Society and by the European Research Council (grant no. 293926 to I.T.B.).
Corresponding author; e-mail [email protected].
The author responsible for distribution of materials integral to the findings presented in this article in accordance with the policy described in the Instructions for Authors (www.plantphysiol.org) is: Emmanuel Gaquerel ([email protected]).
Some figures in this article are displayed in color online but in black and white in the print edition.
The online version of this article contains Web-only data.
Open Access articles can be viewed online without a subscription.
