


Abstract
Although a number of plant natural products are derived from benzoic acid, the biosynthesis of this structurally simple precursor is poorly understood. Hypericum calycinum cell cultures accumulate a benzoic acid-derived xanthone phytoalexin, hyperxanthone E, in response to elicitor treatment. Using a subtracted complementary DNA (cDNA) library and sequence information about conserved coenzyme A (CoA) ligase motifs, a cDNA encoding cinnamate:CoA ligase (CNL) was isolated. This enzyme channels metabolic flux from the general phenylpropanoid pathway into benzenoid metabolism. HcCNL preferred cinnamic acid as a substrate but failed to activate benzoic acid. Enzyme activity was strictly dependent on the presence of Mg2+ and K+ at optimum concentrations of 2.5 and 100 mm, respectively. Coordinated increases in the Phe ammonia-lyase and HcCNL transcript levels preceded the accumulation of hyperxanthone E in cell cultures of H. calycinum after the addition of the elicitor. HcCNL contained a carboxyl-terminal type 1 peroxisomal targeting signal made up by the tripeptide Ser-Arg-Leu, which directed an amino-terminal reporter fusion to the peroxisomes. Masking the targeting signal by carboxyl-terminal reporter fusion led to cytoplasmic localization. A phylogenetic tree consisted of two evolutionarily distinct clusters. One cluster was formed by CoA ligases related to benzenoid metabolism, including HcCNL. The other cluster comprised 4-coumarate:CoA ligases from spermatophytes, ferns, and mosses, indicating divergence of the two clades prior to the divergence of the higher plant lineages.
Benzoic acids and related aromatic aldehydes and alcohols constitute a class of natural products, known as benzenoids. The C6-C1 benzenoid building block is found in a number of plant constituents, such as the anticancer drug paclitaxel, the local anesthetic agent cocaine, the red naphthoquinone pigment shikonin, and the antihypertensive drug reserpine (Dewick, 2009). Derivatives playing roles in primary metabolism are ubiquinones and cytokinins (Threlfall and Whistance, 1970; Werbrouck et al., 1996). Major groups of tannins, namely gallotannins and ellagitannins, are derived from gallic acid (3,4,5-trihydroxybenzoic acid; Dewick, 2009). Salicylic acid (2-hydroxybenzoic acid) functions as an endogenous signal molecule in systemic acquired resistance and thermogenesis (Raskin et al., 1987; Klessig and Malamy, 1994). Simple phenols, such as hydroquinone, are likely to arise by oxidative decarboxylation of benzoic acids (Dewick, 2009). Volatile derivatives, such as methyl benzoate and methyl salicylate, are involved in plant-insect and plant-plant interactions. They serve as attractants for pollinators and seed dispersers in floral and fruit scents, respectively (Pichersky and Gershenzon, 2002; Dudareva and Pichersky, 2008).
Although the chemical structure of benzenoids is simple, their biosynthesis is poorly understood, which is mainly due to the existence of multiple pathways between species and even within a species (Boatright et al., 2004; Wildermuth, 2006). Benzoic acids arise either from intermediates of the shikimate pathway or from l-Phe, which is an end product of the shikimate pathway. Benzoic acids that are formed via branch points in the shikimate pathway are salicylic acid in Arabidopsis (Arabidopsis thaliana) and Nicotiana benthamiana, 3-hydroxybenzoic acid in Centaurium erythraea and Swertia chirata, 2,3-dihydroxybenzoic acid in Catharanthus roseus, and gallic acid in Rhus typhina (Moreno et al., 1994; Werner et al., 1997; Abd El-Mawla et al., 2001; Wang et al., 2001; Wildermuth et al., 2001; Catinot et al., 2008).
The formation of benzoic acids from l-Phe starts with a deamination reaction to give trans-cinnamic acid, catalyzed by the first enzyme of the general phenylpropanoid pathway, l-Phe ammonia-lyase (PAL; Fig. 1; Hanson and Havir, 1981). Subsequent shortening by a C2 unit of the propyl side chain of cinnamic acid proceeds by two major pathways. The CoA-dependent and β-oxidative route mirrors the β-oxidation of fatty acids, the intermediates being maintained as CoA thioesters. This pathway is used to form benzoic acid in cucumber (Cucumis sativus) and Nicotiana attenuata and 4-hydroxybenzoic acid in Lithospermum erythrorhizon (Löscher and Heide, 1994; Ribnicky et al., 1998; Jarvis et al., 2000). Very recently, a cDNA encoding cinnamate:CoA ligase (CNL) from Petunia hybrida has been isolated and functionally expressed (Klempien et al., 2012). A similar sequence (greater than 99% amino acid sequence identity) has been cloned by Colquhoun et al. (2012); however, an early stop codon resulted in the formation of a truncated insoluble protein. In addition, Arabidopsis BZO1, a putative benzoate:CoA ligase (BZL), has very recently been identified as CNL (Kliebenstein et al., 2007; Lee et al., 2012). Furthermore, the gene encoding 3-ketoacyl-CoA thiolase, which catalyzes the cleavage of 3-phenyl-3-ketopropionyl-CoA to give benzoyl-CoA, was identified by gene silencing in P. hybrida (Van Moerkercke et al., 2009). The alternative CoA-independent and non-β-oxidative pathway involves hydration of the free acid, side chain degradation via a reverse aldol reaction, and oxidation of the intermediate aldehyde, a key intermediate of this route. This reaction sequence leads to the formation of benzoic acid in Antirrhinum majus and 4-hydroxybenzoic acid in carrot (Daucus carota) and potato (Solanum tuberosum; French et al., 1976; Schnitzler et al., 1992; Sircar and Mitra, 2008; Long et al., 2009). A cDNA encoding benzaldehyde dehydrogenase has recently been cloned from A. majus, the flowers of which emit high levels of methylbenzoate (Long et al., 2009). The enzyme has also been detected in cell cultures of Sorbus aucuparia, and its properties have been studied (Gaid et al., 2009). Furthermore, a gene encoding aldehyde oxidase, which was purified from Arabidopsis and exhibited high affinity for benzaldehyde, was identified (Ibdah et al., 2009). In flowers of P. hybrida, both the β-oxidative and the non-β-oxidative routes contribute to benzenoid production (Boatright et al., 2004; Orlova et al., 2006; Van Moerkercke et al., 2009). A combination of the two pathways, CoA-dependent and non-β-oxidative, was observed in cell cultures of Hypericum androsaemum (Abd El-Mawla and Beerhues, 2002).
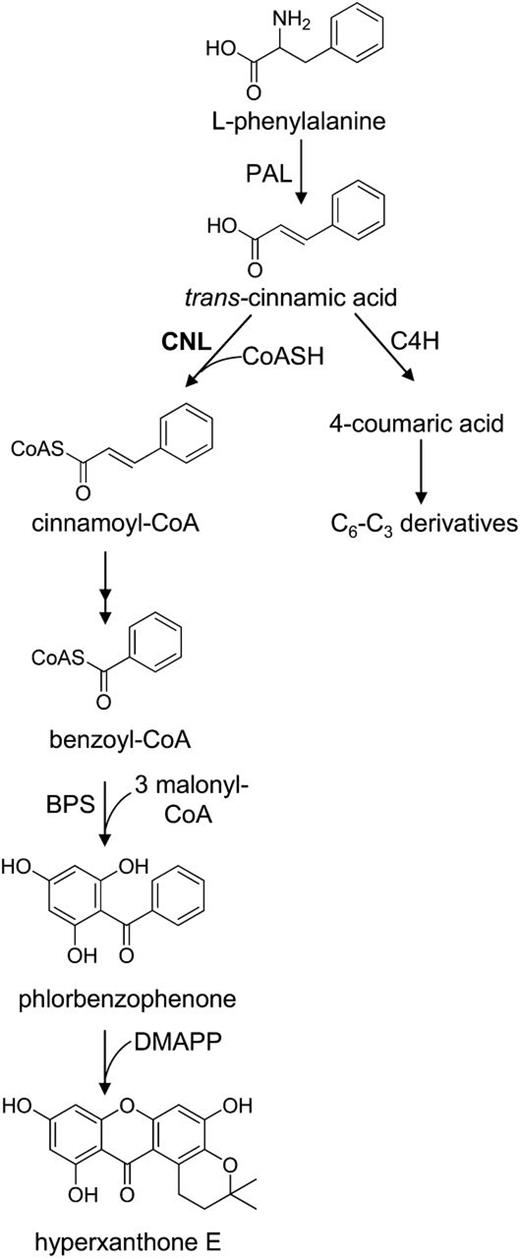
Proposed biosynthesis of hyperxanthone E in H. calycinum cell cultures. Cinnamic acid is the precursor of both C6-C1 benzenoids and C6-C3 phenylpropanoids. BPS, Benzophenone synthase; C4H, cinnamate 4-hydroxylase; CoASH, coenzyme A; DMAPP, dimethylallyl pyrophosphate.
Here, we report the elicitor-stimulated accumulation of a benzoate-derived phytoalexin in Hypericum calycinum cell cultures and the cDNA cloning, characterization, and reporter-based localization of CNL, which resides at a branch point of the general phenylpropanoid pathway and directs carbon flow to benzenoid metabolism.
RESULTS
Elicitor-Induced Xanthone Accumulation
H. calycinum cell cultures grown in Linsmaier and Skoog medium responded to yeast (Saccharomyces cerevisiae) extract treatment with the accumulation of one major metabolite, as shown by HPLC analysis (Fig. 2). The elicitor-inducible compound was isolated and identified by UV spectroscopy, mass spectrometry, and 1H- and 13C-NMR spectroscopy. The spectra obtained matched those published for hyperxanthone E (Supplemental Fig. S1; Tanaka et al., 2004). The isolated compound was used to quantify changes in the xanthone level in H. calycinum cell cultures after the addition of the elicitor (Fig. 3A). The accumulation of hyperxanthone E started 12 h after the onset of elicitation, reached the maximum level of approximately 4 mg g−1 dry weight after 20 h, and stayed constant up to 28 h. Hyperxanthone E was accumulated inside the cultivated cells, and only traces of the phytoalexin compound were found in the culture medium, probably due to occasional cell death.

HPLC analysis of methanolic extracts from elicitor-treated (A) and nontreated (B) H. calycinum cell cultures. Detection was at 254 nm. mAU, Milliabsorbance units.

Cloning of a CNL cDNA Starting with a Subtracted cDNA Library
The mRNA pools from elicitor-treated (8 h post elicitation) and nontreated H. calycinum cell cultures were used to construct a subtracted cDNA library. cDNA clones were sequenced and bioinformatically processed (Supplemental Fig. S2). Alignment with data bank entries for CoA ligases related to secondary metabolism identified seven ESTs, which belonged to a single contig representing the 1,616-bp 5′ sequence of a CoA ligase cDNA. Using gene-specific primers, this fragment was amplified from the H. calycinum mRNA pool present after elicitor stimulation and extended toward the 3′ end by 3′ RACE. The resulting full-length cDNA comprised a 1,719-bp open reading frame (ORF), 309- and 121-bp 5′ and 3′ untranslated regions, respectively, and a 28-bp poly(A) tail. The ORF reamplified with proofreading polymerase encoded a protein of 572 amino acids with a predicted molecular mass of 62.6 kD and an pI of 8.62. The deduced amino acid sequence contained a putative AMP-binding motif (box I) and a box II domain at a distance of 189 amino acids (Fig. 4). Sequence similarity with 4-coumarate:CoA ligases (4CLs) was low (26%–30%); however, the protein shared 70% homology with predicted ortho-succinylbenzoate:CoA ligase1 (OSBZL1) from Medicago truncatula (XP_003600627) and 61% homology each with CNL from Arabidopsis (Q9SS01) and putative BZL from Brassica rapa (ACR10278). The H. calycinum polypeptide contained a C-terminal type 1 peroxisomal targeting signal (PTS1) consisting of the tripeptide Ser-Arg-Leu, as revealed by PTS predictor software (Fig. 4; Neuberger et al., 2003; Rottensteiner et al., 2004).
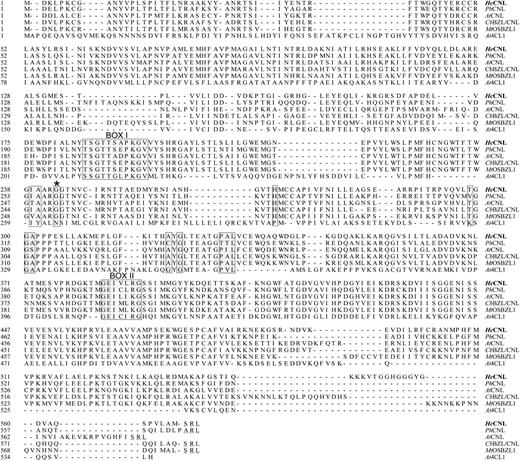
Alignment of the amino acid sequences of H. calycinum CNL (HcCNL; AFS60176), P. hybrida CNL (PhCNL; AEO52693), Arabidopsis CNL (AtCNL, AtBZO1; Q9SS01), predicted BZL/CNL from C. breweri (CbBZL/CNL; AEO52695), predicted OSBZL1 from M. truncatula (MtOSBZL1; XP_003600627), and 4CL1 from Arabidopsis (At4CL1; NP_001077697). The conserved peptide motifs (box I and box II) and 12 amino acids proposed to function as a 4CL substrate specificity code (Schneider et al., 2003) are shaded. C-terminal peroxisomal targeting sequences (S/ARL) are underlined. The asterisk marks a residue whose hydrophobicity in CNLs was anticipated (Schneider et al., 2003). Gaps introduced to maximize the alignment are indicated by dashes. OSBZL numbering refers to that in Figure 7.
Functional Analysis and Characterization
The coding sequence of the cloned cDNA was heterologously expressed in Escherichia coli as a glutathione S-transferase fusion protein, which was purified by affinity chromatography. Enzyme activity was first studied using a luciferase-based assay that takes advantage of the adenylate-forming property of CoA ligases (Schneider et al., 2005). ATP left over in the enzyme assay is quantified and inversely proportional to the CoA ligase activity studied. Incubation of the S. aucuparia 4CL isoenzyme 1 with the nonsubstrate benzoic acid (Gaid et al., 2011) served as a negative control, and luciferase activity measured was set as 100% (Fig. 5A). The enzyme from H. calycinum cell cultures was incubated in 100 mm potassium phosphate buffer with an array of cinnamic acids and benzoic acids and some other acids in the presence of CoA, ATP, and 2.5 mm Mg2+. The preferred substrate was cinnamic acid, followed by 4-coumaric acid. No enzyme activity was observed with benzoic acid, identifying the enzyme as CNL. The preference of CNL for cinnamic acid was confirmed in spectrophotometric assays (Fig. 5B). In relation to the activity with cinnamic acid, 4-coumaric acid led to approximately 22% activity. Caffeic acid and ferulic acid were poor substrates, and sinapic acid failed to be accepted. The identity of CNL-formed cinnamoyl-CoA was established by liquid chromatography (LC)-electrospray ionization (ESI)-mass spectrometry (MS) in negative ion mode under the conditions previously used (Beuerle and Pichersky, 2002a). The molecular ion [M−H]– at mass-to-charge ratio 896.3, which is indicative of cinnamoyl-CoA, was subjected to fragmentation, and the resulting MS/MS spectrum matched the data previously reported (Supplemental Fig. S3; Beuerle and Pichersky, 2002a). In the luciferase-based assay, CNL seemed to be active with hydroxybenzoic acids and some other acids that are marked by asterisks in Figure 5A. To verify this observation, these compounds were incubated with CNL in the presence of cinnamic acid (Fig. 5C). These competition assays did not result in significant differences in the amounts of enzymatically formed cinnamoyl-CoA, indicating that the asterisk-marked acids in Figure 5A did not serve as substrates for CNL. Furthermore, the question of the reliability of the luciferase-based assay for this application arose. As a direct way of verifying CoA thioester formation, enzyme assays were analyzed by LC-ESI-MS (Table I). While traces of CoA esters of gallic acid and malic acid were detected, no CoA esters were found for the other asterisk-marked acids. Thus, the results of luciferase-based assays have to be considered with caution.
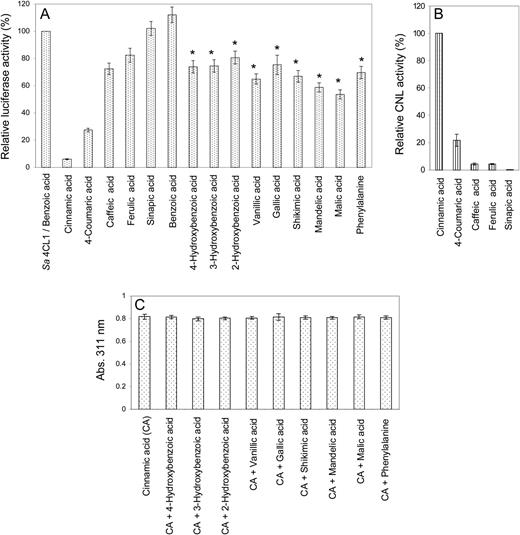
Substrate specificity of H. calycinum CNL, as determined by luciferase-based (A), spectrophotometric (B), and substrate competition (C) assays. A, ATP left over in the CNL-catalyzed reaction was measured as luciferase-dependent bioluminescence, which inversely correlated with CNL activity. A reference reaction with S. aucuparia 4CL1 and its nonsubstrate benzoic acid was used to normalize bioluminescence. B, CNL activities were calculated using the extinction coefficients of the respective CoA esters, cinnamoyl-CoA formation being set as 100%. C, CNL was incubated with either cinnamic acid only or combinations of cinnamic acid and the acids indicated by asterisks in A. sd values are indicated (n = 3).
Product analysis by LC-ESI-MS
CNL assays containing substrates that caused unexpected enzyme activity in the luciferase-based assay and are marked by asterisks in Figure 5A were analyzed for CoA ester formation by LC-ESI-MS (negative ion mode). The results are presented as percentages of cinnamoyl-CoA formation, which was set as 100%. ND, Not detectable.
| Substrate | CoA Ester Formation |
|---|---|
| Cinnamic acid | 100 |
| 4-Hydroxybenzoic acid | ND |
| 3-Hydroxybenzoic acid | ND |
| 2-Hydroxybenzoic acid | ND |
| Vanillic acid | ND |
| Gallic acid | <0.01% of cinnamoyl-CoA formation |
| Shikimic acid | ND |
| Mandelic acid | ND |
| Malic acid | <0.05% of cinnamoyl-CoA formation |
| l-Phe | ND |
The pH optimum of CNL was 6.5, and half-maximum activities were observed at approximately pH 6 and 7.5. The temperature optimum was 30°C to 35°C. Enzyme activity was linear with time up to 6 min and with the protein concentration up to 5 µg in the standard assay (1 mL). CNL activity was strictly dependent on the presence of cations (Fig. 6A). Of divalent cations, Mg2+ led to maximum activity, whereas Cu2+ caused inactivity. Of monovalent cations, K+ most efficiently stimulated CNL, whereas Na+ failed to accomplish activity. The optimum concentrations of Mg2+ and K+ were 2.5 and 100 mm, respectively (Fig. 6B). Testing increasing Mg2+ concentrations in the presence of 100 mm K+ led to 6.5-fold increased CNL activity, and examining increasing K+ concentrations in the presence of 2.5 mm Mg2+ resulted in 2.5-fold increased enzyme activity (Fig. 6C). Thus, maximum CNL activity was detected in assays containing both 2.5 mm Mg2+ and 100 mm K+ (Fig. 6, A and C). Under the optimum conditions detected, the kinetic properties of CNL were studied for cinnamic acid and 4-coumaric acid (Table II). Both the affinity and the turnover number for cinnamic acid were higher, resulting in a 30-fold greater catalytic efficiency (k cat/K m) for cinnamic acid than for 4-coumaric acid. The K m values for CoA and ATP were 95.6 and 104.7 µm, respectively. No appreciable loss in CNL activity was observed upon storage at −80°C for several months. At 4°C, enzyme activity decreased by 20% to 25% within 24 h.
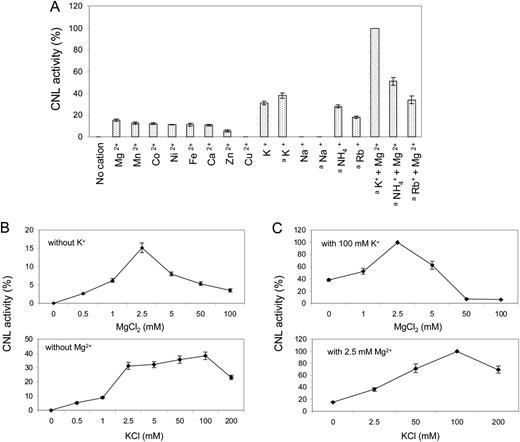
Effect of cation supplementation on CNL activity. A, Assays contained either 2.5 or 100 (a) mm concentrations of monovalent and divalent cations. B, The effect of increasing concentrations was studied for the most efficient cations, Mg2+ and K+. C, Similar experiments were carried out in the presence of the optimum concentration of either the monovalent or the divalent cation. sd values are indicated (n = 3).
Steady-state kinetic parameters of CNL
Values are means (n = 4).
| Substratea | K m | V max | k cat | k cat/K m |
|---|---|---|---|---|
| µm | nkat mg−1 | s−1 | µm −1 s−1 | |
| Cinnamic acid | 11.14 | 27.45 | 1.73 | 0.155 |
| 4-Coumaric acid | 90.16 | 6.95 | 0.44 | 0.005 |
| Substratea | K m | V max | k cat | k cat/K m |
|---|---|---|---|---|
| µm | nkat mg−1 | s−1 | µm −1 s−1 | |
| Cinnamic acid | 11.14 | 27.45 | 1.73 | 0.155 |
| 4-Coumaric acid | 90.16 | 6.95 | 0.44 | 0.005 |
For the cosubstrates CoA and ATP, the K m values were 95.6 and 104.7 µm, respectively.
Elicitor-Induced PAL and CNL Expression
Changes in the PAL and CNL transcript levels after treatment of H. calycinum cell cultures with elicitor were studied by reverse transcription (RT)-PCR. The cycle number and the template concentration were optimized. Gene-specific primer pairs resulted in the amplification of 388- and 389-bp fragments of PAL and CNL transcripts, respectively. The level of 18S rRNA, which was detected as a 485-bp PCR product, served as a control for equal RNA template amounts. CNL mRNA started to accumulate 4 h after the onset of elicitation, peaked at 8 h, and declined thereafter (Fig. 3, B and D). The accumulation of PAL mRNA was similar but started from a basal level already present before elicitation. Furthermore, a slower decrease in the PAL transcript level was observed (Fig. 3, B and C).
Phylogenetic Reconstruction of CNL and Related Amino Acid Sequences
The construction of a phylogenetic tree was based on a number of CoA ligases that actually or putatively act on benzoic acid and derivatives (Fig. 7). The accession numbers of the amino acid sequences included are listed in Supplemental Table S1. In addition, a large number of 4CL sequences from angiosperms, gymnosperms, pteridophytes, and mosses were included, giving preference to members of gene families and functionally established sequences. Fatty acid-CoA ligase from Arabidopsis lyrata served to root the tree. The resulting neighbor-joining tree consisted of two major evolutionarily distinct clusters. One cluster was formed by benzenoid-related CoA ligases including CNL from H. calycinum. The sequences most closely related to HcCNL, which formed a clade, were CNLs from P. hybrida and Arabidopsis, putative BZL from B. rapa, predicted BZL/CNL from Clarkia breweri, and putative OSBZL1 from M. truncatula. Interestingly, putative OSBZL2 to OSBZL8 from M. truncatula grouped together with predicted OSBZL1 and OSBZL2 from soybean (Glycine max) in a second clade, suggesting that M. truncatula OSBZL1 probably functions as BZL/CNL, which has to be studied. The second major cluster comprised 4CL sequences and was subdivided into three classes, as observed previously (Kumar and Ellis, 2003). Class I 4CLs are functionally related to growth and development, primarily lignin formation, whereas class II enzymes occur upon environmental stresses (Ehlting et al., 1999). Class III consisted of enzymes from monocots.
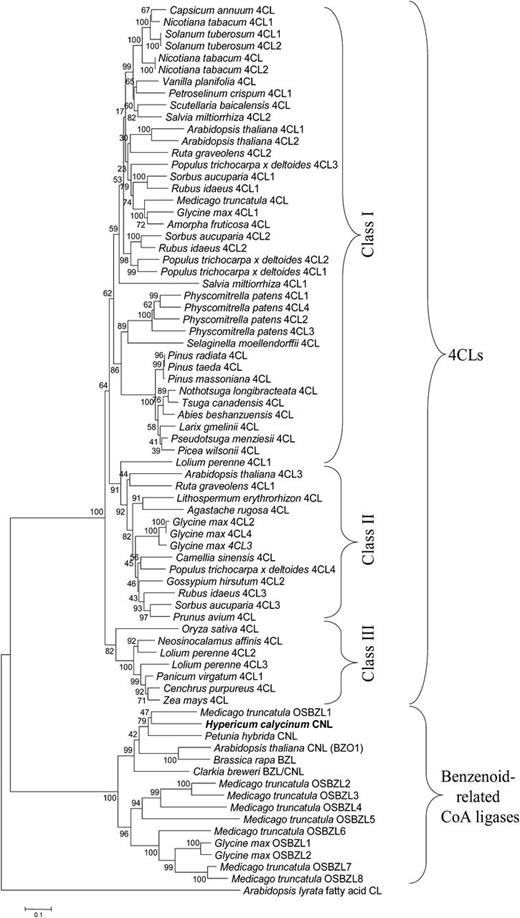
Phylogenetic tree illustrating the evolutionary relationships between H. calycinum CNL and other benzenoid-related CoA ligases as well as 4CLs. The accession numbers of the sequences included are listed in Supplemental Table S1. The neighbor-joining tree was constructed using amino acid sequences through MEGA 5.05 with 1,000 bootstrapped value support and a Poisson correction. The bootstrap values are indicated at the branch points. The scale bar represents 0.1 amino acid substitutions per site. OSBZL sequences were numbered in the order of appearance.
Subcellular Localization of HcCNL
To examine the functionality of the C-terminal PTS1, constructs encoding fusion proteins of CNL with yellow fluorescent protein (YFP) were generated and transiently expressed in epidermis cells of N. benthamiana leaves. The coding sequence of HcCNL was fused with YFP at either the N terminus (YFP-CNL) or the C terminus, the stop codon being deleted (CNL-DEL-YFP). For colocalization, cyan fluorescent protein (CFP) as a fluorochrome was N-terminally fused with the PTS1 tripeptide and used as a peroxisomal marker protein (Nowak et al., 2004). All constructs were placed under the control of the 35S promoter from Cauliflower mosaic virus. The products of the constructs were localized by confocal laser scanning microscopy. For YFP-CNL, punctate fluorescence was observed, suggesting peroxisomal localization (Fig. 8A). In contrast, fluorescence was present throughout the cytoplasm when YFP was fused with the C terminus of HcCNL, thereby masking PTS1 (Fig. 8B). To verify the peroxisomal localization of HcCNL, N. benthamiana leaves were cotransformed with YFP-CNL and the marker construct CFP-PTS1. The products of both constructs were targeted to the peroxisomes (Fig. 8, C and D). When merged, the majority of YFP dots exactly overlaid with CFP dots, giving white dots (Fig. 8F). Autofluorescence of chlorophyll (Fig. 8E) did not overlay with these white dots (Fig. 8F). When the intensities of YFP and CFP fluorescence were recorded in three closely spaced peroxisomes (marked by a white arrow in Fig. 8G), the multichannel profiles of the two fluorochromes matched perfectly (Fig. 8H). The λ mode was used to detect the spectral signatures of CFP, YFP, and chlorophyll, with peaks at 480, 525, and 680 nm, respectively (Fig. 8, I and J).
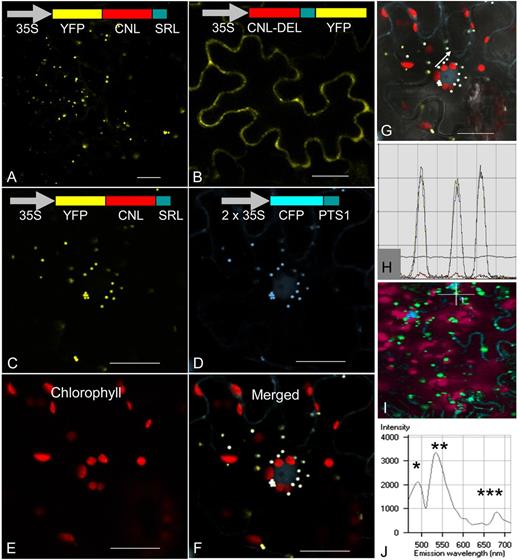
Subcellular localization of H. calycinum CNL in N. benthamiana leaf epidermis cells. A and B, Transient expression of YFP-CNL (A) and CNL-DEL-YFP (B) constructs resulted in the formation of peroxisomal and cytosolic CNL proteins, respectively. C to F, Cotransformation with YFP-CNL (C) and the marker construct CFP-PTS1 (D) led to overlayable white fluorescence in peroxisomes (F), which did not match the autofluorescence of chloroplasts (E). G and H, Fluorescence intensities of YFP and CFP in three peroxisomes marked by a white arrow (G) were recorded (H). J, Emission fingerprints of CFP (*), YFP (**), and chlorophyll (***) are documented. Bars = 20 µm.
DISCUSSION
CNL catalyzes the thioesterification of cinnamic acid formed by PAL from l-Phe (Fig. 1). This amino acid is a building block for both protein synthesis and phenylpropanoid formation. Thus, PAL channels metabolic flux from primary to secondary metabolism. Cinnamic acid is the first branch point of phenylpropanoid metabolism. A well-known reaction is its conversion by cinnamate 4-hydroxylase to 4-coumaric acid, which is linked with CoA by 4CL (Vogt, 2010). CoA esters of hydroxycinnamates are precursors of a number of natural products, such as lignin, flavonoids, and cell wall-bound phenolics. As an alternative, cinnamic acid is thioesterified with CoA by CNL, which then directs carbon flow from the general phenylpropanoid pathway into benzenoid metabolism (Fig. 1). HcCNL contains a conserved putative AMP-binding domain that is common to members of the superfamily of adenylate-forming enzymes, such as 4CLs, luciferases, and acetate- and fatty acid-CoA ligases (Fulda et al., 1994). This so-called box I is also present in CNLs from P. hybrida and Arabidopsis and putative OSBZL1 from M. truncatula (Kliebenstein et al., 2007; Young et al., 2011; Klempien et al., 2012). In addition, all these proteins contain a second conserved motif, referred to as box II. In a phylogenetic tree, the benzenoid-related CoA ligases formed an evolutionarily separate cluster, indicating their origin from a common ancestral gene. A second cluster consisted of 4CLs, which thus derive from another ancestral gene. Since the 4CL clade included sequences from angiosperms, gymnosperms, pteridophytes, and mosses, the clusters comprising 4CLs and benzenoid-related CoA ligases appear to have separated prior to the divergence of the higher plant lineages. The 4CL cluster consisted of three classes, as reported previously (Kumar and Ellis, 2003). While class I isoenzymes are involved in growth and development, mainly lignin formation, class II 4CLs are formed in response to environmental stresses (Ehlting et al., 1999). Class III comprised 4CLs from monocots.
Very recently, cDNA cloning and functional expression of CNL from P. hybrida petals has been reported (Klempien et al., 2012). Both the affinity of PhCNL for cinnamic acid (K m = 285.7 µm) and the turnover number (k cat = 0.472 s−1) were markedly lower than those reported here for HcCNL (K m = 11.1 µm, k cat = 1.73 s−1). For both enzymes, 4-coumaric acid was the second best substrate, and notably, benzoic acid did not serve as a substrate. The affinity of PhCNL for CoA (K m = 775.2 µm) was also lower than that of HcCNL (K m = 95.6 µm). The K m value of PhCNL for ATP was not reported. Both HcCNL and PhCNL activities were strictly dependent on the presence of cations, the combination of Mg2+ and K+ being most efficient. A similar observation was previously made with xenobiotic carboxylic acid:CoA ligases of bovine liver mitochondria (Vessey and Kelley, 1998). For activity toward benzoic acid, these enzymes had an absolute requirement for both monovalent and divalent cations. Since the divalent cation is required to complex with ATP, its optimum concentration was found to be directly related to the concentration of ATP in the assay. An excess of divalent cation was inhibitory due to the availability of uncomplexed ions to lower affinity sites. The requirement of the bovine liver enzymes for monovalent cation was satisfied by 50 mm K+, and this ion was found to enhance the affinity for CoA (Vessey and Kelley, 1998; Vessey et al., 2000). Maximum activity of HcCNL was observed at 100 mm K+. For PhCNL, 10.5 mm was reported to support half-maximum activity in the presence of 2.5 mm Mg2+ (Klempien et al., 2012).
The preferred substrate for the two CNLs, cinnamic acid, is a poor substrate for 4CLs (Schneider et al., 2003). N. benthamiana stem extracts even contained a component that selectively repressed the activity of 4CL toward cinnamic acid and did not affect the activity toward the other substrates (Lee and Douglas, 1996). Of three 4CL isoenzymes from Rubus idaeus, 4CL2 preferred cinnamic acid (153%) over 4-coumaric acid (100%; Kumar and Ellis, 2003). Furthermore, Arabidopsis has a CoA ligase (At4CL3) that exhibits a high rate of reaction with cinnamic acid; however, the K m value was high (2.07 mm; Ehlting et al., 1999). Twelve amino acids lining the substrate-binding pocket of 4CL were identified to function as a signature motif that generally determines 4CL substrate specificity (Stuible and Kombrink, 2001; Schneider et al., 2003). The 12 residues are exclusively located within a region of 189 amino acids that is flanked by the conserved peptide motifs box I and box II. A 4CL variant that displayed 30-fold improvement of cinnamic acid conversion was generated from caffeate-preferring At4CL2 by site-directed mutagenesis (Schneider et al., 2003). The triple mutation N256A/M293P/K320L increased the hydrophobicity of the substrate-binding pocket. It was anticipated that CNL enzymes may particularly carry a hydrophobic residue at the position that corresponds to Asn-256 in At4CL2 (marked by an asterisk in Fig. 4; Schneider et al., 2003). Indeed, HcCNL, PhCNL, AtCNL, CbBZL/CNL, and MtOSBZL1 have Gly residues at the corresponding positions. In contrast, cinnamate-preferring Ri4CL2 and CNL from Streptomyces coelicolor carry Asn and Thr residues, respectively (Kaneko et al., 2003; Kumar and Ellis, 2003). The other two positions that were altered in the triple mutant are occupied by hydrophilic His and Thr residues in the above-listed benzenoid-related CoA ligases, except for PhCNL, which has His and Val residues.
In cell cultures of H. androsaemum, side-chain shortening of cinnamic acid appeared to proceed via a CoA-dependent and non-β-oxidative route, yielding free benzoic acid (Abd El-Mawla et al., 2001; Abd El-Mawla and Beerhues, 2002). This pathway thus involves both CNL and BZL activities, which were separated from cell-free extracts of methyl jasmonate-treated H. androsaemum cell cultures using anion-exchange chromatography. While CNL was inactive with benzoic acids, BZL lacked activity with cinnamic acids. Increases in both enzyme activities preceded the elicitor-induced accumulation of 1,3,6,7-tetrahydroxy-8-prenylxanthone, which functions as a phytoalexin in a number of Hypericum species (Franklin et al., 2009). A structurally related phytoalexin, hyperxanthone E, was formed in H. calycinum cell cultures after treatment with elicitor. Its accumulation was preceded by coordinated increases in the transcript levels of CNL and PAL. While CNL transcripts were not detectable before elicitation, a basal level of PAL mRNA was present, because this enzyme also supplies precursors for other phenylpropanoid derivatives, such as lignin. The changes in the PAL and CNL transcript levels provide evidence for the involvement of these enzymes in the formation of hyperxanthone E and hence intermediate benzoic acid. Three plant enzymes exhibiting affinity for benzoic acids were previously purified and characterized: BZL from C. breweri, 3-hydroxybenzoate:CoA ligase from C. erythraea, and OSBZL from Galium mollugo (Sieweke and Leistner, 1992; Barillas and Beerhues, 1997, 2000; Beuerle and Pichersky, 2002b). The two first-mentioned CoA ligases were AMP-forming enzymes and lacked affinity for (hydroxy)cinnamic acids. OSBZL was an ADP-forming enzyme and failed to activate benzoic acid and 4-coumaric acid as the only tested (hydroxy)cinnamic acid. A putative BZL gene (BZO1; At1g65880), which is related to benzoyloxyglucosinolate biosynthesis, was detected in Arabidopsis, although the encoded enzyme has very recently been identified as CNL (Kliebenstein et al., 2007; Lee et al., 2012).
HcCNL was present in the peroxisomes, which are the site of β-oxidation in plants. Blockade of the C-terminal tripeptide SRL, which functions as a PTS1, by C-terminal fusion with a reporter protein resulted in cytoplasmic localization. The same observations were made with PhCNL, which carries the functional C-terminal tripeptide ARL (Klempien et al., 2012). While CNL from Arabidopsis (Kliebenstein et al., 2007; Lee et al., 2012) and BZL/CNL from C. breweri also contain a PTS1 (SRL), the putative BZL from B. rapa lacks a PTS1 (the accession numbers of these polypeptides are listed in Supplemental Table S1). Similarly, a PTS1 is absent from the predicted OSBZL sequences 3, 4, 7, and 8 in the recently published genome sequence of M. truncatula (Young et al., 2011), whereas it is present in the sequences 1, 2, 5, and 6 as well as in the two isoenzymes from soybean. Peroxisomes also accommodate P. hybrida 3-ketoacyl-CoA thiolase catalyzing the conversion of 3-oxo-3-phenylpropionyl-CoA to benzoyl-CoA in the β-oxidative pathway (Van Moerkercke et al., 2009). Furthermore, the Arabidopsis enzyme Chy1, which exhibits strong affinity for cinnamoyl-CoA, although its exact role in benzoic acid biosynthesis is open, is a peroxisomal protein (Ibdah and Pichersky, 2009). In contrast, benzaldehyde dehydrogenase from A. majus, which is involved in the non-β-oxidative route and catalyzes the formation of benzoic acid, was localized in mitochondria, and subsequent methylation of benzoic acid to give methylbenzoate for emission was detected in the cytoplasm (Kolosova et al., 2001; Long et al., 2009).
CONCLUSION
Benzenoid metabolism is complex not only due to the use of alternative biosynthetic pathways but also due to the involvement of various subcellular compartments. Further enzymes of benzoic acid biosynthesis need to be studied at the molecular level in order to gain deeper insight into the spatial and temporal regulation of this important branch of plant secondary metabolism. An open question is also the transport of intermediates, such as free acids and CoA esters, across the membranes of the cell compartments involved. In the genus Hypericum, which encompasses 484 species, benzoic acid is a precursor of benzophenones and xanthones (Beerhues and Liu, 2009; Beerhues, 2011; Crockett and Robson, 2011). Since these two classes of compounds include a number of complex prenylated metabolites with challenging chemical structures and intriguing biological activities, a better understanding of benzoic acid metabolism may also contribute to biotechnological perspectives.
MATERIALS AND METHODS
Chemicals
All chemicals and reagents were purchased from Sigma-Aldrich, Roth, and Merck, unless otherwise stated.
Plant Material and Elicitor Treatment
Cell cultures of Hypericum calycinum (Hypericaceae) were grown in liquid Linsmaier and Skoog medium (Linsmaier and Skoog, 1965), as described previously (Klingauf et al., 2005). Four-day-old cell cultures were treated with yeast extract (Roth) as elicitor at a final concentration of 3 g L−1. The elicitor solution was replaced with an equal volume of water in control cell cultures.
Extraction and HPLC Analysis of Xanthone Phytoalexins
Cell cultures were harvested at various times after elicitation (0, 4, 8, 12, 16, 20, 24, and 28 h) and dissected by suction filtration into cells and medium, both of which were examined for the presence of xanthones by HPLC (Beerhues and Berger, 1995). An Agilent 1260 Infinity Quaternary LC System was coupled to a diode array detector (G4212A) and equipped with a HyperClone ODS column (C18; 250 × 4.6 mm, 5 µm; Phenomenex). The mobile phase consisted of water acidified with 0.05% (v/v) formic acid (A) and methanol (B). The following gradient was employed at a flow rate of 0.5 mL min−1: 70% B for 5 min, 70% to 100% B in 10 min, 100% B for 5 min. Elution of compounds was monitored at 254 nm.
For preparative isolation, yeast extract-treated cells (40 g) were harvested 24 h after elicitation and ground in 100 mL of acetone for 15 min. The residue after filtration was reextracted with 50 mL of acetone. The combined organic phase was concentrated under vacuum, and the resulting brownish oily residue was extracted twice with 10 mL of methanol. The combined methanol phase was separated on thin-layer silica gel 60 F254 plates (Merck) using dichloromethane:methanol:formic acid (89:10:1, v/v/v) as the mobile phase. The major band (RF = 0.67) detected under UV light (254 nm) was scraped off, and the material was repeatedly extracted with ethyl acetate. The combined organic phase was filtered and evaporated to dryness under an air stream. The residue was dissolved in methanol and subjected to semipreparative HPLC using an ELITE LaChrom HPLC system (VWR) equipped with a semipreparative HyperClone column (C18 120A; 250 × 10 mm, 5 µm; Phenomenex). The above gradient was used. The flow rate, the injection volume, and the concentration of the solution were 5 mL min−1, 100 µL, and 5 µg µL−1, respectively. The effluent containing the target compound was collected and evaporated to dryness under an air stream. The residue was lyophilized and analyzed by spectroscopic techniques.
MS and NMR Spectroscopy
LC-MS was carried out on a QTrap 3200 system (Applied Biosystems/MDS Sciex). Samples were directly introduced to an ESI source (Turbo V; Applied Biosystems/MDS Sciex) using a Hamilton syringe pump and a flow rate of 5 µL min−1. The mass spectrometer was operated in the positive mode with a source voltage and declustering potential of 5.5 kV and 76 V, respectively. Nitrogen gas was used for nebulization, with the curtain gas, gas 1, and gas 2 settings at 10, 14, and 0, respectively. All parameters were optimized using a reference mixture of 1,3,5,6- and 1,3,6,7-tetrahydroxyxanthones at 10 µg mL−1 methanol:water (9:1, v/v) containing 0.1% formic acid. Putative product molecular ion peaks [M+H]+ were further analyzed by MS/MS experiments in the enhanced product ion mode of the instrument using nitrogen gas for collision-induced dissociation at the high-level setting. The collision energy was 76 V. Data acquisition and processing were performed using the Analyst software (version 1.4.2; Applied Biosystems/MDS Sciex).
NMR spectra (600 MHz 1H and 151 MHz 13C including two-dimensional 1H-13C-heteronuclear single quantum correlation and -heteronuclear multiple bond correlation) of a solution of hyperxanthone E in [D6]acetone were obtained on a Bruker Avance II 600 spectrometer with a 5-mm TCI CryoProbe at a sample temperature of 20°C. Chemical shifts were referenced to the solvent peaks [CD3COCD2 H, δH = 2.07 ppm; (CD3)2CO, δC = 29.84 ppm].
Construction of a Subtracted cDNA Library
Suppressive subtractive hybridization (SSH) was performed using the PCR-Select cDNA Subtraction Kit (Clontech). Poly(A)+ RNA (mRNA) was isolated from both yeast extract-treated and control suspension cells of H. calycinum using the QuickPrep Micro mRNA Purification Kit (Amersham). Aliquots of 2 µg of mRNA were used for cDNA synthesis. cDNA of the treated cells served as the tester and cDNA of control cells as the driver in forward subtraction aimed at isolating yeast extract-induced transcripts. The resulting SSH cDNA library was cloned into the pGEM-T Easy vector (Promega), and the ligation product was transferred to Escherichia coli DH5α. Prior to sequencing, preliminary evaluation of the library with respect to insert size and complexity was carried out by visual comparison of clone restriction fragments with a DNA size marker on a 1% (w/v) agarose gel. Finally, clones (2,000) were randomly picked for plasmid isolation and analysis. DNA sequencing as well as sequence assembly and annotation were done at the Beijing Genomics Institute.
Cloning and Expression of a CNL cDNA
Total RNA was isolated from H. calycinum cell cultures (8 h post elicitation) using the RNeasy Plant Mini Kit (Qiagen). RNA (2 µg) was reverse transcribed with RevertAid H Minus Moloney murine leukemia virus reverse transcriptase (Fermentas) and an oligo(dT) primer. Based on putative CNL ESTs present in the SSH cDNA library, forward primer 1 and reverse primer 2 (Table III) were designed to amplify the 5′ fragment of the CNL cDNA. PCR was carried out with Dream Taq DNA polymerase (Fermentas). The PCR conditions were 94°C for 2 min, followed by 30 cycles of 94°C for 45 s, 56°C for 45 s, and 72°C for 2 min, and a final extension of 15 min at 72°C. The PCR product of the expected size (1,616 bp) was excised from an ethidium bromide-stained 1% (w/v) agarose gel, purified using the innuPREP DOUBLEpure Extraction Kit (Analytic Jena), and ligated into the pGEM-T Easy vector for sequencing. A forward primer (primer 3; Table III) was designed for 3′ RACE with the SMART RACE cDNA Amplification Kit (Clontech). Alignment of the 5′ and 3′ fragments gave a full-length cDNA that was verified by reamplification of the ORF using forward primer 1 and reverse primer 4 (Table III). DNA sequencing was done by MWG Biotech.
Primers used
| Primer | Sequence |
|---|---|
| 1 | 5′-ATGGATAAGCTCCCAAAATGTGGTGCC-3′ |
| 2 | 5′-TTAGCCATATCCCTCAACTGGGCC-3′ |
| 3 | 5′-TCAGCAGCGTGGAGGTCGAGTCG-3′ |
| 4 | 5′-TTAAAGACGAGACATGGCAAG-3′ |
| 5 | 5′-ATTGAATTCTTAAAGACGAGACATGGCAAG-3′a |
| 6 | 5′-CTGCATTCCTTGATCTTGTTC-3′ |
| 7 | 5′-ACATCGAGGAGAATCTGAAGAG-3′ |
| 8 | 5′-TGATGGTATCTACTACTCGG-3′ |
| 9 | 5′-AATATACGCTATTGGAGCTGG-3′ |
| 10 | 5′-GGGGACAAGTTTGTACAAAAAAGCAGGCTTAACCATGGATAAGCTCCCAAAATGTGG-3′ |
| 11 | 5′-GGGGACCACTTTGTACAAGAAAGCTGGGTCTTAAAGACGAGACATGGCAAGAAC-3′ |
| 12 | 5′-GGGGACCACTTTGTACAAGAAAGCTGGGTCAAGACGAGACATGGCAAGAACAGG-3′ |
EcoRI restriction site is underlined.
| Primer | Sequence |
|---|---|
| 1 | 5′-ATGGATAAGCTCCCAAAATGTGGTGCC-3′ |
| 2 | 5′-TTAGCCATATCCCTCAACTGGGCC-3′ |
| 3 | 5′-TCAGCAGCGTGGAGGTCGAGTCG-3′ |
| 4 | 5′-TTAAAGACGAGACATGGCAAG-3′ |
| 5 | 5′-ATTGAATTCTTAAAGACGAGACATGGCAAG-3′a |
| 6 | 5′-CTGCATTCCTTGATCTTGTTC-3′ |
| 7 | 5′-ACATCGAGGAGAATCTGAAGAG-3′ |
| 8 | 5′-TGATGGTATCTACTACTCGG-3′ |
| 9 | 5′-AATATACGCTATTGGAGCTGG-3′ |
| 10 | 5′-GGGGACAAGTTTGTACAAAAAAGCAGGCTTAACCATGGATAAGCTCCCAAAATGTGG-3′ |
| 11 | 5′-GGGGACCACTTTGTACAAGAAAGCTGGGTCTTAAAGACGAGACATGGCAAGAAC-3′ |
| 12 | 5′-GGGGACCACTTTGTACAAGAAAGCTGGGTCAAGACGAGACATGGCAAGAACAGG-3′ |
EcoRI restriction site is underlined.
The coding sequence was finally PCR amplified with Platinum Pfx polymerase (Invitrogen) using forward primer 1 and reverse primer 5 (Table III). The EcoRI-digested PCR product was ligated into a StuI- and EcoRI-linearized pGEX-G expression vector (Görlach and Schmid, 1996), which generated the expression plasmid pGEX-G-CNL. After verification by sequence analysis, the expression construct was transferred to competent E. coli BL21-Codon-Plus-(DE3)-RIL cells (Stratagene). Induction of expression and affinity purification on Protino Glutathione Agarose 4B (Macherey-Nagel) were carried out as described previously (Liu et al., 2003). The purification efficiency was monitored by SDS-PAGE. Protein concentration was determined by the method of Bradford (1976) with bovine serum albumin as the standard.
Spectrophotometric Enzyme Assay and ESI-MS Analysis
The rate of increase in the absorption of cinnamoyl-CoA was spectrophotometrically determined. The standard assay (1 mL) consisted of 100 mm potassium phosphate buffer, pH 6.5, 2.5 mm MgCl2, 2.5 mm ATP, 0.4 mm cinnamic acid (dissolved in 50% ethanol), and 5 µg of affinity-purified CNL protein. After the addition of 0.2 mm CoA, cinnamoyl-CoA formation at room temperature was monitored at 311 nm up to 5 min. Enzyme activity was calculated using the previously reported extinction coefficient of cinnamoyl-CoA (ε = 22 cm−1 mm −1; Gross and Zenk, 1966; Stöckigt and Zenk, 1975). When cinnamic acid was replaced with 4-coumaric, caffeic, ferulic, and sinapic acids, the ε values of the corresponding CoA esters were used (Gross and Zenk, 1966; Stöckigt and Zenk, 1975). For enzyme characterization, pH values ranged from 5.5 to 11.5, temperatures from 15°C to 60°C, incubation times from 1 to 20 min, and protein concentrations in the assay from 0.5 to 40 µg. The stability of the enzyme was examined at room temperature and at 4 and −80°C for 24 h. Substrate competition assays contained a competitor substrate at 0.4 mm in addition to cinnamic acid. Cinnamoyl-CoA formation was measured at 311 nm. Control assays lacked the competitor substrate. For validation, 4-coumaric acid and caffeic acid served as competitor substrates, coumaroyl-CoA and caffeoyl-CoA formation being measured at 333 and 345 nm, respectively.
The K m values for cinnamic acid and 4-coumaric acid were determined using concentrations from 1 to 500 µm, while keeping ATP at 2.5 mm and CoA at 0.2 mm. To measure the K m values for the cosubstrates, the concentration of ATP varied from 10 to 3,000 µm and that of CoA from 1 to 800 µm, cinnamic acid being constant at 400 µm. Enzyme concentration and incubation time were adjusted to give a linear reaction velocity during the assay period. The kinetic constants K m and V max were calculated by the Lineweaver-Burk method using the Hyper 32 software (http://homepage.ntlworld.com/john.easterby/software.html).
For ESI-MS of enzymatic products, the assay volume was increased to 5 mL. CoA esters were purified and analyzed as described previously (Beuerle and Pichersky, 2002a). A 3200 QTrap mass spectrometer (Applied Biosystems/MDS Sciex) was equipped with an ESI interface (Turbo V). Samples were directly introduced using a Hamilton syringe pump and a flow rate of 5 µL min−1. The mass spectrometer was operated in the negative ion mode with a source voltage and declustering potential of −4.5 kV and −85 V, respectively. Nitrogen gas was used for nebulization, with the curtain gas, gas 1, and gas 2 settings at 10, 14, and 0, respectively. All parameters were optimized using authentic cinnamoyl-CoA ester as the reference compound at 10 µg mL−1 methanol:water (9:1, v/v). Analyst software (version 1.4.2; Applied Biosystems/MDS Sciex) was used for data acquisition and evaluation.
Luciferase-Based Enzyme Assay
To test an array of potential substrates, a luciferase-based assay was used (Schneider et al., 2005). The standard assay (200 µL) contained 200 µm carboxylic acid substrate, 50 µm ATP, 250 µm MgCl2, 100 µm CoA, 2 µg of purified protein, and 100 mm potassium phosphate buffer, pH 6.5. After incubation at room temperature for 2 h, samples (2 µL) were withdrawn, diluted to 100 µL with dilution buffer (100 mm Tris-HCl, pH 7.5), and pipetted onto a 96-microwell plate for analysis in a luminometer (Victor2 multilabel counter; Wallac 1420). A second reaction mixture (100 µL) containing 1 µg of firefly luciferase, 4.6 µg of luciferin (Roche Diagnostics), and 100 mm Tris-HCl, pH 7.5, was placed in the well at the measurement position. After shaking and delay for 10 s, luminescence was measured in the above photon-counting multiplier. The raw data were presented as counts per second and expressed as relative luciferase activity, which correlates with the ATP concentration. ATP quantification was normalized by a reaction containing Sorbus aucuparia 4CL1 (ADF30254; Gaid et al., 2011) and benzoic acid. This reaction failed to utilize ATP; thus, the ATP content was considered as 100%.
Construction of a Phylogenetic Tree
Phylogenetic reconstruction was based on a number of 4CL amino acid sequences and benzenoid-related CoA ligases, whose accession numbers are listed in Supplemental Table S1. Multiple sequence alignment was performed using the ClustalW platform in the BioEdit software (Campos et al., 2009). The alignment result was fit into MEGA 5.05 (Tamura et al., 2011) to construct a phylogenetic tree by the neighbor-joining method. Amino acid differences were computed using the Poisson correction distance (Zuckerkandl and Pauling, 1965) to estimate evolutionary similarity. The pairwise deletion method was used to nullify gaps and missing data. Statistical robustness was ensured by the bootstrap test with 1,000 replicates.
Expression Analysis by RT-PCR
Total RNA was extracted from yeast extract-treated H. calycinum cell cultures at defined times post elicitation (0, 4, 8, 12, 16, and 20 h). On-column DNase (Qiagen) treatment was carried out to eliminate contaminating genomic DNA. The absence of genomic DNA was verified by PCR using the RNA pools prior to RT. First-strand cDNA was synthesized as described above (“Cloning and Expression of a CNL cDNA”). Sample cDNAs were 20-fold diluted with DNase-free water. CNL transcript levels were analyzed by RT-PCR in 25-µL volumes containing 2 µL of cDNA solution, 0.2 µm concentrations of forward primer 3 and reverse primer 4 (Table III), and 1 unit of Taq DNA polymerase (Peqlab). To analyze PAL transcript levels, forward primer 6 and reverse primer 7 (Table III) were designed based on sequence information from the SSH cDNA library and the Hypericum perforatum transcriptome assemblies (http://medicinalplantgenomics.msu.edu/index.shtml). 18S ribosomal DNA (rDNA; AF206934) served to normalize RT-PCR results and was amplified with forward primer 8 and reverse primer 9 (Table III). To maintain RT-PCR amplification within the exponential phase, 22 cycles were run. The PCR conditions for the amplification of CNL transcripts were as follows: 4 min of denaturation at 94°C, then 22 cycles of 94°C for 30 s, 60°C for 30 s, and 72°C for 30 s, and then a final 6-min extension at 72°C. Similar PCR conditions were used for the amplification of PAL and 18S rDNA transcripts, except that the annealing temperature was 51°C. The PCR products (12-µL aliquots) were analyzed by electrophoresis on a 1% (w/v) agarose gel, stained with ethidium bromide, and photographed using a gel-imaging system (Infinity-3000; Vilber Lourmat). ImageJ software (version 1.36; http://rsb.info.nih.gov/ij/), which analyzes the pixel intensity of PCR bands, was used to compare the CNL and PAL expression levels relative to that of 18S rDNA. At least three technical repetitions were performed.
Agrobacterium tumefaciens-Mediated Transient Expression and Subcellular Localization
To make the CNL coding region compatible with the Gateway cloning system (Invitrogen), PCR amplification involved either a stop codon (primer 10, forward primer attB1; primer 11, reverse primer attB2a) or no stop codon (primer 10, forward primer attB1; primer 12, reverse primer attB2b) for subsequent generation of N- and C-terminal fusions with YFP, respectively. Details of attB primers (primers 10–12) are listed in Table III. The modified PCR products (CNL, with stop codon; CNL-DEL, without stop codon) were first cloned into a donor vector (pDONR/Zeo) by the Gateway BP reaction to create entry clones and then into the destination vectors by the Gateway LR reaction (Invitrogen). The CNL entry clone was used to transfer the coding sequence into the pEarly-Gate 104 (http://www.arabidopsis.org/abrc/catalog/vector_1.html) destination vector, leading to the N-terminal fusion of CNL with YFP (35S::YFP-CNL). Similarly, the coding sequence of the CNL-DEL entry clone was transferred to the pEarly-Gate 101 destination vector to allow for C-terminal fusion of CNL with YFP (35S::CNL-DEL-YFP).
A. tumefaciens-mediated transient expression in leaves of Nicotiana benthamiana was performed with slight modifications of the previously described procedure (Bendahmane et al., 1999). The binary Gateway expression vectors carrying the constructs YFP-CNL and CNL-DEL-YFP were transferred to the A. tumefaciens strain C58C1 by electroporation. Correct clones were identified by colony PCR using the attB1 and attB2a/attB2b primers. Positive transformants were inoculated into 10 mL of yeast mannitol broth medium supplemented with 50 µg mL−1 kanamycin and 100 µg mL−1 rifampicin, grown overnight at 28°C, washed, and resuspended in activation medium to give an optical density at 600 nm of 1 (Bendahmane et al., 1999). A helper A. tumefaciens strain carrying a p19 construct was used to increase the transformation efficiency (Voinnet et al., 2003) and was grown under similar conditions until the optical density at 600 nm was 0.6. A. tumefaciens cultures harboring either the YFP-CNL or the CNL-DEL-YFP construct were mixed with the helper strain carrying the p19 construct in a 1:1 (v/v) ratio prior to infiltration. For colocalization, A. tumefaciens C58C1 cultures harboring YFP-CNL, CFP-PTS1 (peroxisomal marker construct; Nowak et al., 2004), and p19 were mixed 1:1:1 (v/v/v) prior to infiltration (final optical density at 600 nm values for YFP-CNL, CFP-PTS1, and p19 were 0.5, 0.5, and 0.3, respectively). Leaf infiltration was carried out using a 10-mL needleless syringe. Two days after infiltration, leaves were analyzed for YFP/CFP expression by confocal laser scanning microscopy (CLSM-510META; Carl Zeiss). The argon laser (458 nm for CFP, 488 nm for both YFP and autofluorescence of chlorophyll) and the primary beam-splitting mirrors (458/514 or 488 nm) were used. The emitted light was separated by a secondary beam splitter at 545 nm. Fluorescence was detected with filter sets on channel 2 for CFP with band pass 475 to 525 and on channel 3 for YFP with band pass 505 to 550. The META channel was used for the selection of red chlorophyll autofluorescence. When appropriate, a bright-field image was taken using the transmitted light photomultiplier. The λ mode was used to examine the spectral signature of fluorophores. The specimens were examined using a C-Apochromat 40×/1.2 water immersion objective. All images were processed using the LSM Image Browser Release 4.2 (Carl Zeiss).
Sequence data from this article for HcCNL can be found in the GenBank/EMBL data libraries under the accession number AFS60176.
Supplemental Data
The following materials are available in the online version of this article.
Supplemental Figure S1. Spectroscopic data of hyperxanthone E.
Supplemental Figure S2. Proposed functions of unigenes in a subtracted cDNA library.
Supplemental Figure S3. LC-ESI-MS analysis of CNL-formed cinnamoyl-CoA.
Supplemental Table S1. Accession numbers of the sequences used in phylogenetic reconstruction.
Glossary
- PAL
phenylalanine ammonia-lyase
- CNL
cinnamate:CoA ligase
- BZL
benzoate:CoA ligase
- ORF
open reading frame
- LC
liquid chromatography
- ESI
electrospray ionization
- MS
mass spectrometry
- RT
reverse transcription
- YFP
yellow fluorescent protein
- CFP
cyan fluorescent protein
- SSH
suppressive subtractive hybridization
- rDNA
to be defined
LITERATURE CITED
Author notes
This work was supported by the Deutsche Forschungsgemeinschaft.
These authors contributed equally to the article.
Present address: Department of Pharmacognosy, Faculty of Pharmacy, Assiut University, Assiut 71525, Egypt.
Corresponding author; e-mail [email protected].
The author responsible for distribution of materials integral to the findings presented in this article in accordance with the policy described in the Instructions for Authors (www.plantphysiol.org) is: Ludger Beerhues ([email protected]).
The online version of this article contains Web-only data.
Open Access articles can be viewed online without a subscription.
