


Abstract
Plants, like animals, use several lines of defense against pathogen attack. Prominent among genes that confer disease resistance are those encoding nucleotide-binding site-leucine-rich repeat (NB-LRR) proteins. Likely due to selection pressures caused by pathogens, NB-LRR genes are the most variable gene family in plants, but there appear to be species-specific limits to the number of NB-LRR genes in a genome. Allelic diversity within an individual is also increased by obligatory outcrossing, which leads to genome-wide heterozygosity. In this study, we compared the NB-LRR gene complement of the selfer Arabidopsis thaliana and its outcrossing close relative Arabidopsis lyrata. We then complemented and contrasted the interspecific patterns with studies of NB-LRR diversity within A. thaliana. Three important insights are as follows: (1) that both species have similar numbers of NB-LRR genes; (2) that loci with single NB-LRR genes are less variable than tandem arrays; and (3) that presence-absence polymorphisms within A. thaliana are not strongly correlated with the presence or absence of orthologs in A. lyrata. Although A. thaliana individuals are mostly homozygous and thus potentially less likely to suffer from aberrant interaction of NB-LRR proteins with newly introduced alleles, the number of NB-LRR genes is similar to that in A. lyrata. In intraspecific and interspecific comparisons, NB-LRR genes are also more variable than receptor-like protein genes. Finally, in contrast to Drosophila, there is a clearly positive relationship between interspecific divergence and intraspecific polymorphisms.
Resistance (R) gene-dependent recognition of avirulence (Avr) determinants is a cornerstone of plant defense against pathogens. There are at least five diverse classes of R proteins, the largest of which encodes proteins that have a nucleotide-binding (NB) site along with leucine-rich repeats (LRRs; Dangl and Jones, 2001). NB-LRR proteins can be subdivided into two types based on structural features of the N terminus: TIR-NB-LRR (TNL) proteins have a domain that resembles the intracellular signaling domains of Drosophila Toll and mammalian IL-1 receptors, while CC-NB-LRR (CNL) proteins contain a putative coiled-coil domain. The predominant function of NB-LRR genes is in disease resistance (Kunkel et al., 1993; Grant et al., 1995; Botella et al., 1998; Bittner-Eddy et al., 2000; van der Biezen et al., 2002; Slusarenko and Schlaich, 2003; Allen et al., 2004; Sinapidou et al., 2004; McDowell and Simon, 2006), although they can sometimes mutate to produce phenotypes not clearly related to immunity (Faigón-Soverna et al., 2006; Huang et al., 2010; Yang et al., 2010). Because of their diversity, NB-LRR and other R genes are also prone to cause autoimmunity problems in hybrids, due to inappropriate recognition of proteins encoded in an unmatched parental genome (Bomblies and Weigel, 2007, 2010).
Comparative genomic analyses have indicated that plant genomes can encode several hundred NB-LRR genes, but there is great diversity in the total number of NB-LRR genes as well as in the distribution of subclasses of NB-LRR genes. An interesting example is provided by TNL genes, which are absent from grass genomes surveyed to date (Bai et al., 2002; McDowell and Simon, 2006; Bomblies and Weigel, 2010). Since this subfamily is present in conifers and mosses, it appears that it was lost in grasses and perhaps other monocots (Meyers et al., 1999, 2002; Akita and Valkonen, 2002). In contrast, dicot genomes typically contain more TNL than CNL genes (Meyers et al., 2003; Yang et al., 2008; Porter et al., 2009).
Most NB-LRR genes reside in clusters (Meyers et al., 2005). NB-LRR genes within clusters can be divided into two types based on their phylogenetic relationships: tandem duplicates, so that genes group together in a species-wide gene tree; and mixed clusters that contain genes from different branches of a species-wide tree (McDowell and Simon, 2006). Two models have been proposed to explain NB-LRR distribution patterns that are inconsistent with simple tandem duplications (Leister, 2004): ectopic duplications and large-scale segmental duplications with subsequent local rearrangements.
Gene conversion is another important process that influences the evolution of gene families, including NB-LRR genes (Bendahmane et al., 2000; Baumgarten et al., 2003; Mondragon-Palomino and Gaut, 2005; Kuang et al., 2008). The extent of gene conversion is correlated with high levels of sequence identity, close physical clustering, gene orientation, and recombination rate (Mondragon-Palomino and Gaut, 2005; Xu et al., 2008), although close physical proximity is not a conditio sine qua non (Kuang et al., 2008).
LRRs are also found in receptor-like proteins (RLPs), which have extracellular LRRs, a transmembrane helix, and a short cytoplasmic region. In several plant species, RLP genes can encode R proteins. In Arabidopsis thaliana, several RLP genes have been implicated in developmental processes, but no R gene has been mapped to an RLP locus (Jones et al., 1994; Yang and Sack, 1995; Jeong et al., 1999; Nadeau and Sack, 2002; Wang et al., 2008). However, one RLP gene has been shown to confer nonhost resistance, while another one can mutate to a dominant form that activates responses normally associated with defense (Wang et al., 2008; Zhang et al., 2010).
In our study, we used high-quality whole-genome sequences from reference strains of two closely related species, A. thaliana and Arabidopsis lyrata, to address several questions regarding the evolution of NB-LRR genes. (1) Has the mating system shift affected the number of NB-LRR genes? (2) How does their arrangement as single genes, in tandem clusters or in mixed clusters, affect the diversification of NB-LRR genes? (3) What is the relative importance of gene conversion? (4) Is there any correlation between the interspecies divergence of orthologs and the intraspecies polymorphism within A. thaliana? (5) How do the evolutionary patterns of NB-LRRs and RLPs compare? Our work complements a recent study (Chen et al., 2010) that had accessed an early draft of the A. lyrata genome sequence and that lacked extensive synteny information.
RESULTS
Identification, Classification, and Phylogenetic Analysis of NB-LRR Genes
We used the most conserved portion of NB-LRR proteins, a domain that includes the NB site, for an initial round of identification of NB-LRR-encoding genes in A. lyrata and A. thaliana. We then built an Arabidopsis-specific hidden Markov model (HMM) profile based on sequences of both species to identify additional NB-LRR genes (see “Materials and Methods”). We found 159 members of the NB-LRR gene family in A. thaliana. In the A. lyrata genome, we could identify 185 NB-LRR genes (Table I). Note that not all NB-LRR family members have both NB and LRR domains. Previous studies in A. thaliana reported 166 (Richly et al., 2002), 174 (Yang et al., 2008; Chen et al., 2010), or 178 (Meyers et al., 2003) NB-LRR genes, while The Arabidopsis Information Resource (TAIR) annotation contains 127 (Swarbreck et al., 2008). The differences in our study resulted from more stringent criteria, in addition to exclusively using an HMM model instead of BLAST-based approaches. In A. lyrata, 182 have been reported (Chen et al., 2010); because the same methodology was not applied to A. thaliana, it is difficult to compare that number with our results.
Classification of NB-LRR genes
| Protein Domains | A. thaliana | A. lyrata |
| CC-NB-LRR (CNL) | 43 | 21 |
| CC-NB (CN) | 7 | 17 |
| TIR-NB-LRR (TNL) | 83 | 103 |
| TIR-NB (TN) | 15 | 20 |
| NB-LRR (NL) | 11 | 14 |
| NB (N) | 0 | 10 |
| Total | 159 | 185 |
| Protein Domains | A. thaliana | A. lyrata |
| CC-NB-LRR (CNL) | 43 | 21 |
| CC-NB (CN) | 7 | 17 |
| TIR-NB-LRR (TNL) | 83 | 103 |
| TIR-NB (TN) | 15 | 20 |
| NB-LRR (NL) | 11 | 14 |
| NB (N) | 0 | 10 |
| Total | 159 | 185 |
Consistent with a recent study (Chen et al., 2010), only the CNL subfamily has more members in A. thaliana than A. lyrata (Table I; Supplemental Tables S1 and S2). There are 10 A. lyrata genes but no A. thaliana genes that only encode the NB site portion. We produced phylogenetic trees of the encoded NB domains for the CNL and TNL subgroups, combining genes that encode complete proteins with ones lacking the LRR domains (CN and TN; Figs. 1 and 2; Supplemental Figs. S1 and S2). Most branches include genes from both species, but several terminal branches consist of NB-LRR genes from only one of the two species.
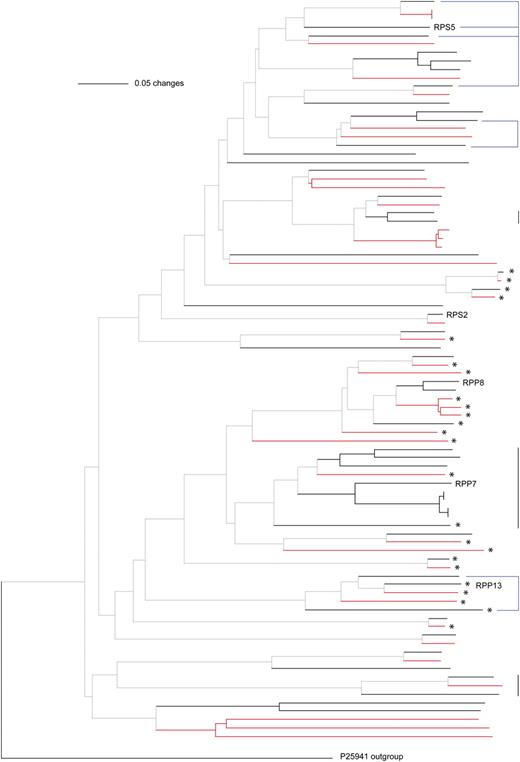
Phylogeny of CNL and CN proteins based on the NB domain. Vertical lines on the right side indicate several examples of proteins encoded in tandem (black) and mixed (blue) clusters in A. thaliana (for cluster assignments, see Supplemental Tables S3 and S4). Branches in red indicate A. lyrata sequences, and those in black indicate A. thaliana sequences. Asterisks indicate proteins without LRR domains. For complete names at each branch, see Supplemental Figure S1.
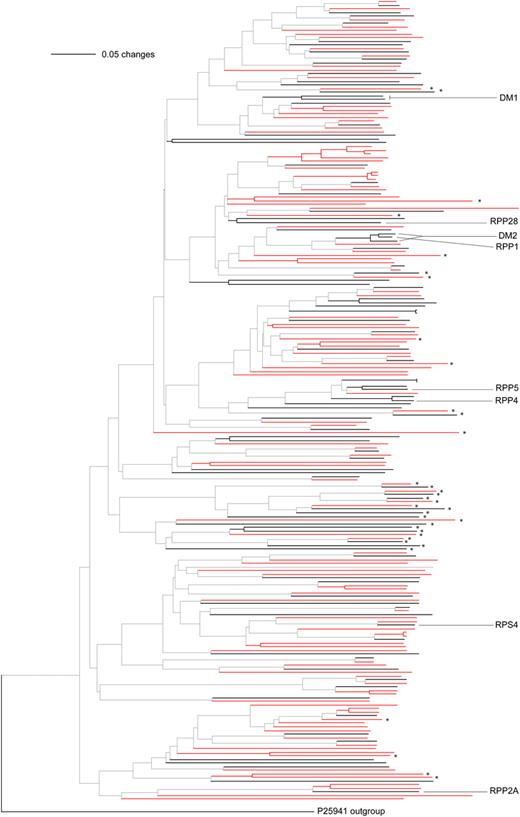
Phylogeny of TNL and TN proteins based on the NB domain. Annotation is as for Figure 1. For complete names at each branch, see Supplemental Figure S2.
Analysis of NB-LRR Gene Clusters
Slightly less than two-thirds of the A. lyrata NB-LRR genes, 118, are found in 35 clusters, each containing between two and 23 genes (mean of 3.4, median of 2.0). The proportion of NB-LRR genes in clusters is higher in A. thaliana, with 113 genes arranged in 38 clusters, each consisting of two to nine genes (mean of 3.0, median of 2.0; Table II). The largest cluster in A. lyrata is the RPS4 locus, a mixed cluster with 23 genes of both the CNL/CN and TNL/TN types. The RPS4 cluster in A. thaliana includes only six genes. One of its members, the namesake RPS4 gene, endows A. thaliana with specific resistance to Pseudomonas syringae pv tomato expressing avrRps4 (Gassmann et al., 1999). The largest cluster in A. thaliana contains nine TNL genes of unknown function, from AT1G72840 to AT1G72950. A. thaliana also has more mixed clusters, altogether 27, than does A. lyrata, which has 21 mixed clusters in total (Table III; Supplemental Tables S3 and S4).
Cluster types
Number of genes in clusters is given in parentheses.
| Cluster Type | A. thaliana | A. lyrata |
| CNL | 8 (24) | 4 (9) |
| TNL | 21 (63) | 22 (66) |
| Other | 9 (26) | 9 (43) |
| Total clusters | 38 (113) | 35 (118) |
| Mean cluster size | 2.97 | 3.37 |
| Median cluster size | 2.00 | 2.00 |
| Singletons | 46 (19 CNL/CN, 22 TNL/TN) | 67 (24 CNL/CN, 30 TNL/TN) |
Tandem duplication and mixed clusters
Number of genes in clusters is given in parentheses.
| Species | CNL/CN | TNL/TN | Mixed CNL/CN and TNL/TN | Genes in Clusters | ||
| Tandem | Mixed | Tandem | Mixed | |||
| A. thaliana | 4 (14) | 5 (12) | 3 (7) | 20 (60) | 2 (9) | 102 |
| A. lyrata | 1 (2) | 3 (7) | 6 (15) | 16 (52) | 2 (25) | 101 |
| Species | CNL/CN | TNL/TN | Mixed CNL/CN and TNL/TN | Genes in Clusters | ||
| Tandem | Mixed | Tandem | Mixed | |||
| A. thaliana | 4 (14) | 5 (12) | 3 (7) | 20 (60) | 2 (9) | 102 |
| A. lyrata | 1 (2) | 3 (7) | 6 (15) | 16 (52) | 2 (25) | 101 |
While we could identify a similar number of gene conversion events in TNL clusters (42 in A. thaliana and 37 in A. lyrata), we found many more such events in A. thaliana CNL clusters (45) than in A. lyrata CNL clusters (three; Table IV). In each class, the median length of conversion tracts is longer in A. lyrata than in A. thaliana (Fig. 3; Table IV). A significant positive correlation between cluster size and gene conversion frequency was found in A. thaliana (Spearman’s correlation test; ρ = 0.55, P = 0.03) but not in A. lyrata (ρ = 0.28, P = 0.30).
Gene conversion events
| Cluster Type | Clusters | Gene Conversion Events | Affected Genes | Mean (Median) Size of Conversion Tracts |
| bp | ||||
| CNL A. thaliana | 6 | 45 | 17 | 174.4 (104.0) |
| CNL A. lyrata | 2 | 3 | 4 | 916.0 (502.0) |
| TNL A. thaliana | 8 | 42 | 23 | 196.4 (111.0) |
| TNL A. lyrata | 11 | 37 | 28 | 148.2 (129.0) |
| Other A. thaliana | 2 | 3 | 4 | 97.0 (119.0) |
| Other A. lyrata | 3 | 9 | 8 | 310.9 (196.0) |
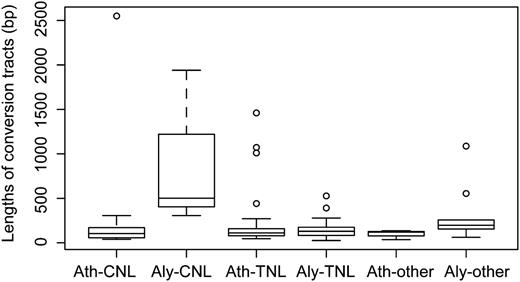
Lengths of gene conversion tracts. Whiskers above boxes indicate the greatest value after excluding outliers; those below boxes indicate the least value after excluding outliers.
Divergence of Orthologs
We identified 88 NB-LRR gene pairs of orthologs shared between A. lyrata and A. thaliana (Table V). For CNL/CN and TNL/TN types, about three-quarters of gene pairs at the terminal branches of the phylogeny were orthologous between species (11 of 16 for CNL/CN and 36 of 48 for TNL/TN). There are great differences, however, in sequence divergence among orthologs (Fig. 4A; Supplemental Table S5). The nonsynonymous divergence (dN) values of the 88 ortholog pairs range from 0.02 to 0.35 (mean of 0.11, median of 0.09), while the synonymous divergence (dS) values range from 0.08 to 0.84 (mean of 0.26, median of 0.18). The resulting dN/dS ratios range from 0.09 to 1.17 (mean of 0.43, median of 0.40), with only one CNL ortholog pair being above 1 (AT5G43730/497178).
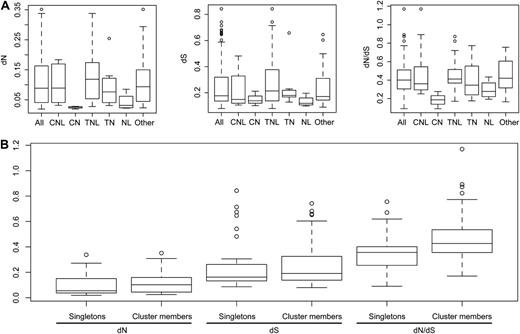
Divergence of NB-LRR genes. A, Divergence of different classes. B, Divergence of singletons and cluster members.
We determined synteny based on orthology of the five genes upstream and the five genes downstream of the focal locus. Most of the orthologs (86.4%) are found in syntenic regions (Supplemental Table S6). The dN values of the 76 syntenic ortholog pairs range from 0.02 to 0.35 (mean of 0.10, median of 0.07), while the dN values of the 12 nonsyntenic ortholog pairs range from 0.09 to 0.34 (mean of 0.19, median of 0.18). The dS values range from 0.08 to 0.74 (mean of 0.23, median of 0.17) for syntenic ortholog pairs and from 0.11 to 0.84 (mean of 0.47, median of 0.51) for nonsyntenic ortholog pairs. The resulting dN/dS ratios range from 0.09 to 0.89 (mean of 0.42, median of 0.39) for syntenic ortholog pairs and from 0.34 to 1.17 (mean of 0.49, median of 0.40) for nonsyntenic ortholog pairs. The dN and dS values of syntenic ortholog pairs are significantly lower than in nonsyntenic ones (Wilcoxon rank sum test; P < 0.01 in both cases).
Importantly, dN and dS values as well as dN/dS (P = 0.02) ratios are generally greater for ortholog pairs that reside in clusters than for singletons (Fig. 4B). The dN/dS ratios of the 27 singletons range from 0.09 to 0.76 (median of 0.36, mean of 0.37), while the 61 genes in clusters have dN/dS ratios from 0.17 to 1.17 (median of 0.43, mean of 0.46).
Correlation between Within- and Between-Species Deletions
In the context of the 1,001 Genomes Project for A. thaliana (Weigel and Mott, 2009), 80 Eurasian accessions have recently been resequenced using Illumina short-read technology (Cao et al., 2011). Since presence-absence polymorphisms are frequent within A. thaliana (Bakker et al., 2006; Shen et al., 2006), we were interested to learn whether this group of genes was overrepresented among the ones that lack orthologs in A. lyrata, as a possible indication of similar evolutionary processes shaping NB-LRR gene diversity over different time scales.
For all 159 NB-LRR genes present in the reference genome of A. thaliana, we calculated the fraction of missing calls (which can result from sequences either having been deleted or being very divergent) across all 80 resequenced accessions. As expected from previous whole-genome studies (Clark et al., 2007; Ossowski et al., 2008), the NB-LRR genes had on average many more missing calls (median of 0.11, mean of 0.19) than the genome-wide average (median of 0.01, mean of 0.03; P < 2.2e-16; Fig. 5A; Supplemental Table S7). Furthermore, we found that NB-LRR genes within clusters are substantially more likely to have missing calls than singletons: the median of missing calls for 46 singletons is 0.05 and the mean is 0.13 (range of 0.0001–0.66), while for the 113 genes in clusters, it is 0.14 and 0.22 (range of 0.0001–0.90; P = 0.02; Fig. 5A). The CN class has on average the fewest missing calls (significantly different from all NB-LRR genes; P = 0.03), and the CNL class has the most (Fig. 5A; Supplemental Table S6). A significantly positive correlation between dS and missing calls was found for NB-LRR genes with A. lyrata orthologs (Spearman’s correlation test; ρ = 0.41, P = 8.0e-05). In addition, we assessed potential copy number variations of NB-LRR genes in the 80 resequenced A. thaliana genomes (Cao et al., 2011). Using a cutoff of 85% missing calls across the entire length of the gene, 33.3% (53 genes) of NB-LRR genes in the reference genome appeared to be deleted in at least one of the 80 accessions, with an allele frequency of one to 72 (median of 14.0, mean of 23.5). In comparison, only 12.5% (3,389) of genes in the entire genome are potentially deleted in at least one accession, with an allele frequency of 1 to 80 (median of 6.0, mean of 13.7; P = 0.002; Fig. 5B).
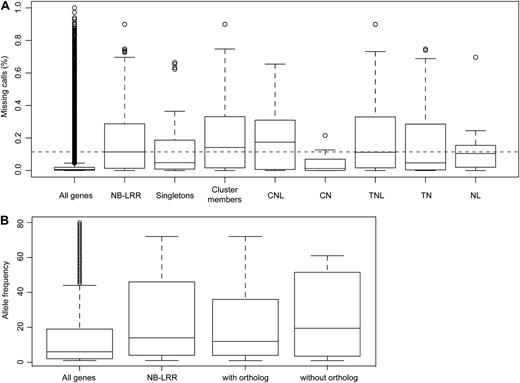
Potential deletions in 80 A. thaliana genomes. A, Missing calls. Dashed lines indicate the median of all NB-LRR genes. B, Allele frequencies of potential deletions in 80 genomes (Cao et al., 2011).
We then asked whether genes that are deleted in at least one of the 80 resequenced A. thaliana accessions are more likely to be missing from A. lyrata. Of the 106 A. thaliana genes without potential deletions, 43 lacked clear orthologs (40.6%). Of the 53 NB-LRR genes that are potentially deleted in at least one A. thaliana accession, this was the case for 28 genes (52.8%). Also, the median frequency of potential deletion alleles among these 28 genes was higher than for the 25 genes with A. lyrata orthologs (19.5 versus 12; Fig. 5B).
To obtain additional insights into within- and between-species NB-LRR gene evolution, we shotgun sequenced a bacterial artificial chromosome (BAC) containing the RPP7 cluster from the A. thaliana accession Cape Verde Islands (Cvi-0). Specific alleles of RPP7 are linked to resistance of Hyaloperonospora arabidopsidis ex parasitica in accessions Columbia (Col-0) and Landsberg erecta of A. thaliana (Speulman et al., 1998; Nemri et al., 2010). The Cvi-0 BAC contains a tandem cluster of NB-LRR genes residing in contig 1 (AT1G58370–AT1G59530; hereafter Cvi1), separated from another NB-LRR gene, AT1G59620, by five intervening genes residing in contig 2 (AT1G59590–AT1G59630; hereafter Cvi2; Fig. 6A; Supplemental Table S8). At 108.2 kb and 22 genes, contig 1 is much shorter in Cvi-0 than in the reference sequence from the Col-0 strain, with 184.0 kb and 34 genes, while contig 2 is similar in size (20.1 compared with 20.0 kb; Fig. 6B). While such size differences are dramatic, similar differences have been reported for other A. thaliana clusters (Bomblies et al., 2007; Alcázar et al., 2009). In A. lyrata, the region syntenic to contig 1 is only slightly longer than in Col-0, 220.3 kb with 33 genes, while the region syntenic to contig 2 is about three times as long, at 67.2 kb (Fig. 6; Supplemental Table S8; Supplemental Fig. S3).
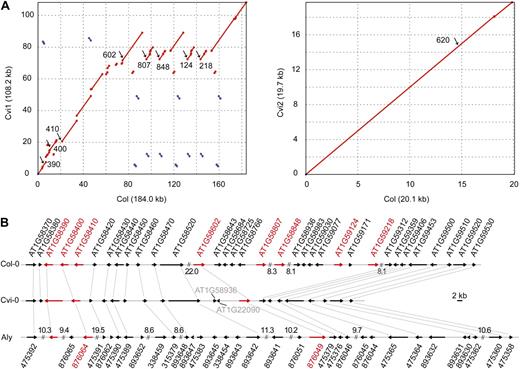
Comparison of the RPP7 region in three haplotypes from A. thaliana and A. lyrata. A, Dot plots comparing two A. thaliana alleles. B, Annotation. The closest Col-0 homologs of two Cvi-0 genes in the center of the cluster are indicated in gray. NB-LRR genes are in red. Numbers indicate the sizes of gaps in kb (not to scale).
In the RPP7 cluster proper, Col-0 has eight NB-LRR genes, while Cvi-0 and A. lyrata both have only three. A phylogeny across the three genomes indicates an ongoing birth/death process and variation in domain composition (Fig. 7A). Based on the phylogeny and similarity comparisons, we reconstructed the evolutionary history of the RPP7 cluster, which experienced several tandem duplications and deletions (Fig. 7B).
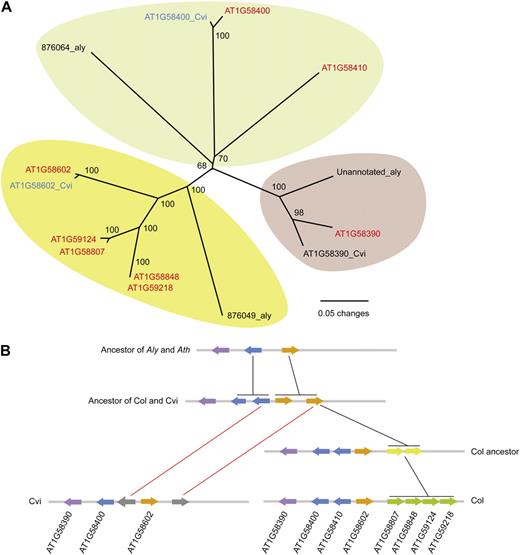
Inferred evolutionary history of the RPP7 cluster. A, Phylogeny of NB-LRR genes in the RPP7 region based on the NB domain. Red, CNL; blue, CN; black, NB. B, Proposed history of the RPP7 cluster. A. lyrata constitutes the ancestral state. Color change indicates tandem duplications (black connectors), and gray indicates loss of gene (red connectors).
Evolution of RLP Genes
Slightly more than two-thirds of the 57 A. thaliana RLPs, 35, are found in 13 clusters, each containing two to five genes (mean of 2.7, median of 2.0; Supplemental Table S9). We identified 22 RLPs that were orthologous between A. lyrata and A. thaliana. While there are great differences in sequence divergence among orthologs, they are generally not as divergent as NB-LRR orthologs (Fig. 8A). The dN values of the 22 ortholog pairs range from 0.01 to 0.10 (mean and median of 0.04), and the dS values range from 0.10 to 0.23 (mean and median of 0.14). The resulting dN/dS ratios range from 0.05 to 0.60 (mean and median of 0.31). Importantly, dN and dS values as well as dN/dS ratios are generally greater for orthologs that reside in clusters, and dN/dS and dN for these are also significantly greater than for singletons (P = 0.05 and 0.01, respectively; Fig. 8A). The dN/dS ratios of the 10 singletons range from 0.05 to 0.60 (median of 0.23, mean of 0.25), while the 12 genes in clusters have dN/dS ratios from 0.25 to 0.57 (median and mean of 0.36). The dN value of the 10 singletons ranges from 0.01 to 0.07 (median and mean of 0.03), while the 12 genes in clusters have dN values from 0.04 to 0.10 (median and mean of 0.05).
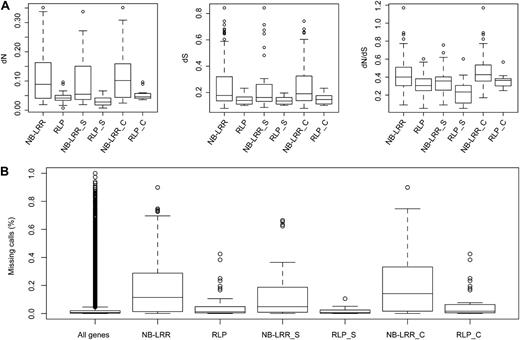
Divergence of RLPs compared with NB-LRRs. A, Divergence of singletons (S) and cluster members (C). B, Missing calls in 80 resequenced A. thaliana genomes (Cao et al., 2011). NB-LRR data are the same as in Figures 4 and 5.
Turning to within-species variation, as assessed with 1,001 Genomes Project data (Cao et al., 2011), we found that RLP genes had more missing calls in 80 A. thaliana accessions (median of 0.01, mean of 0.05) than the genome-wide average (median of 0.01, mean of 0.03; P = 0.03; Fig. 8B). We furthermore found that RLP genes within clusters are slightly more likely to have missing calls than singletons: the median and mean of missing calls for 22 singletons are 0.005 and 0.018 (range of 0–0.11), while they are a little higher for the 35 genes in clusters, 0.016 and 0.067 (range of 0.0003–0.425; Fig. 8B). In contrast to NB-LRR genes, there was no clear correlation between dS between species and missing calls in A. thaliana for genes with orthologs in both species.
We also assessed potential copy number variation of RLP genes in the 80 resequenced A. thaliana genomes. Using a cutoff of 85% missing calls across the entire length of the gene, only four RLP genes (AT1G71390, AT1G17250, AT1G07390, and AT3G23010; 7.0% of all RLPs) appear to be deleted in at least one of the 80 accessions, with an allele frequency of one to five. These numbers are significantly lower than for NB-LRR genes in terms of both the total number of deleted genes and the allele frequency of deletions.
DISCUSSION
Similar Numbers of NB-LRR Genes in A. thaliana and A. lyrata
Our careful annotation of high-quality genome sequences revealed that the transition to selfing in A. thaliana has not substantially changed the number of NB-LRR genes, with 185 in the A. lyrata reference genome and 159 in the A. thaliana reference genome. This is similar to another recent comparison of NB-LRR genes in A. lyrata and A. thaliana (Chen et al., 2010). In other species, the NB-LRR gene complement appears to vary from as few as 54 (in papaya [Carica papaya]) to 535 (in grapevine [Vitis vinifera]), with the NB-LRR gene families in Brassica rapa, Medicago truncatula, poplar (Populus species), and rice (Oryza sativa) falling between these two extremes (Ameline-Torregrosa et al., 2008; Yang et al., 2008; Mun et al., 2009; Porter et al., 2009). Our findings for Arabidopsis confirm that there does not seem to be a strong correlation between genome size and NB-LRR gene number. However, A. thaliana has more CNL-type NB-LRR genes than A. lyrata, perhaps because the latter more easily loses sequences encoding the coiled-coil domain. This appears to be the case for the RPP7 cluster (Fig. 7), where most genes from two A. thaliana accessions are of the CN or CNL type but the genes from A. lyrata are all of the NB type.
A common cause for genetic incompatibility in F1 hybrids of A. thaliana is hybrid necrosis, which results from inappropriate activation of the immune system in the absence of a pathogen attack. As in other species, this seems to be caused by the aberrant recognition of other plant proteins by specific NB-LRR alleles, either because they resemble pathogen proteins or because they resemble pathogen-modified plant proteins (Krüger et al., 2002; Bomblies et al., 2007; Bomblies and Weigel, 2007; Jeuken et al., 2009). Obligatory outcrossing species are always heterozygous and therefore express at all times a greater spectrum of NB-LRR gene alleles than selfers, which are mostly homozygous. Therefore, one might speculate that the potential for such aberrant NB-LRR interactions is higher in outcrossing species. Given the highly dynamic nature of NB-LRR genes, with frequent copy number variation in A. thaliana and not much more than half of all NB-LRR genes having orthologs in A. lyrata, it may seem plausible that the 1 million or so years since A. thaliana became selfing (Tang et al., 2007; Bomblies and Weigel, 2010; Yamamoto et al., 2010) could have sufficed to substantially alter the number of NB-LRR genes. However, this is clearly not the case.
Abundant Mixed Clusters and Frequent Gene Conversion
In A. lyrata, about two-thirds of NB-LRR genes reside in clusters, as described earlier for A. thaliana (Meyers et al., 2003). Mixed clusters, which are thought to result from ectopic duplications and large-scale segmental duplication with subsequent rearrangement (Leister, 2004), are the largest class in both species. Gene conversion, which is affected by high levels of sequence similarity, close physical clustering, gene orientation, and local recombination rate, is an important factor in NB-LRR gene evolution (Bendahmane et al., 2000; Mondragon-Palomino and Gaut, 2005; Xu et al., 2008; Chen et al., 2010). Consistent with larger clusters providing more potential donor sequences, cluster size and gene conversion frequency are positively correlated in A. thaliana. We also observed that the median length of conversion tracts is higher in A. lyrata than in A. thaliana. Because of fewer structural differences, selfers have higher rates of recombination than related outcrossers (Roze and Lenormand, 2005; Glémin et al., 2006; Ross-Ibarra, 2007), and increased recombination might more easily break long conversion tracts into smaller ones.
Different Evolutionary Patterns for Singleton and Clustered NB-LRR Genes
NB-LRR genes show much higher rates of dS and dN and show higher dN/dS ratios than the average gene in the genome (Hu et al., 2011). Importantly, NB-LRR genes in clusters are more diverged between A. lyrata and A. thaliana than are singletons, although there is only limited evidence that entire NB-LRR genes are under positive selection. This is different for the sequences encoding the LRR domains, which are responsible for direct or indirect interaction with pathogen factors (Bakker et al., 2006; Chen et al., 2010).
NB-LRR genes constitute the most variable class of genes in A. thaliana genomes (Rose et al., 2004; Bakker et al., 2006; Clark et al., 2007; Ossowski et al., 2008). This is further supported by our analysis of 80 resequenced A. thaliana genomes (Cao et al., 2011), where we found NB-LRR genes within clusters to be more polymorphic than singletons, which also proved to be true for the specific alleles at the RPP7 cluster that we compared. Using missing calls from Illumina sequencing as an indication of potential deletions, we found for NB-LRR genes a positive relationship between interspecific synonymous substitutions and presence-absence polymorphisms within A. thaliana, which contrasts with the situation in Drosophila, where the relationship is negative (Hahn, 2008). We did not, however, find a clear correlation between the frequency of potential presence-absence polymorphisms in A. thaliana and missing orthologs in A. lyrata. Nevertheless, among genes with presence-absence polymorphisms, A. thaliana genes without orthologs in A. lyrata had a higher frequency of potential deletion alleles than the ones with orthologs.
Both NB-LRR and RLP genes vary substantially in sequence divergence between species. Also similar to NB-LRR genes, RLP genes within clusters are more likely to have missing calls across 80 A. thaliana accessions than do singletons, although NB-LRR genes are much more often deleted (33% compared with 7% for RLP genes). Furthermore, even though NB-LRR genes are overall more divergent between species than RLP genes, genes from both families that are located within clusters are generally more divergent than singletons.
CONCLUSION
The comprehensive analysis of NB-LRR genes provides a valuable resource for many questions related to the evolution of the immune system, including natural variation in innate immunity (Holub, 2007) and hybrid failure (Bomblies and Weigel, 2007). That only little more than half of all A. thaliana NB-LRR genes clearly have orthologs in A. lyrata provides additional evidence for rapid births and deaths of NB-LRR genes (Michelmore and Meyers, 1998). The total number of NB-LRR genes, however, does not differ greatly between the outcrosser A. lyrata and the selfer A. thaliana, indicating that mating system shifts do not have dramatic short-term consequences for the immune gene repertoire.
MATERIALS AND METHODS
Identification of NB-LRR and RLP Genes
NB-LRR proteins encoded in the reference genomes of Arabidopsis thaliana (Col-0; TAIR8) and Arabidopsis lyrata (MN47; FM6 annotation; http://genome.jgi-psf.org/Araly1/Araly1.home.html) were identified using BLASTP (E < 1e-10) against the NB domain (based on the HMMEMIT profile available at http://niblrrs.ucdavis.edu/At_RGenes/). A total of 142 proteins were found in A. thaliana and 162 in A. lyrata. After alignment with ClustalX version 2.0 (Thompson et al., 1997), the NB domains were extracted and used to build an Arabidopsis-specific HMM profile with hmmbuild implemented in HMMER version 2.3.2 (http://hmmer.janelia.org/), which was then used to identify proteins encoded in each genome with hmmsearch (E < 1e-5).
RLP gene annotation in A. thaliana was based on previous studies (Fritz-Laylin et al., 2005; Wang et al., 2008). Orthologous genes from A. lyrata were extracted from a whole-genome alignment analysis (Hu et al., 2011).
Domain Annotation
NB-LRR proteins were characterized using SMART (http://smart.embl-heidelberg.de/). In addition, based on the alignment of proteins, we extracted NB and adjacent domains separately. All three data sets were clustered independently using mcxdeblast implemented in mcl-06-058 (http://micans.org/mcl/src/) with default parameters.
For clusters of N-terminal domains, COILS (http://www.ch.embnet.org/software/COILSform.html) was used to identify CC domains when no CC or TIR domain had been detected with SMART in the previous step, using default parameters and a stringency of 90% threshold. Pfam version 23.0 (July 2008; http://pfam.sanger.ac.uk/) was used to confirm the identity of the CC and TIR domains. As long as the N-terminal domain clustered with other CC (TIR)-containing proteins, we considered it a CC (TIR)-containing protein. Similarly, as long as the C-terminal domain clustered with other LRR domains or the NB domain clustered with other NB domains, we considered it as LRR or NB containing, even when SMART and Pfam results were insignificant. The work flow of domain annotation is outlined in Supplemental Figure S4.
Phylogenetic Analyses
For phylogenetic analyses, NB-LRR protein sequences were aligned with T-Coffee version 7.54 (Notredame et al., 2000) and trimmed to retain only the NB domains. Trees were rooted using a sequence from Streptomyces coelicolor (P25941) as in a previous study (Meyers et al., 2003). PAUP* version 4.0b10 (Swofford, 2003) was used to reconstruct phylogenetic trees using the neighbor-joining method with the Kimura two-parameter model (Kimura, 1980; Saitou and Nei, 1987). Topological robustness was assessed by bootstrapping with 1,000 replicates (Felsenstein, 1985).
Cluster Analyses
The same definition as in a previous study (Richly et al., 2002) was used (i.e. linked NB genes that were not interrupted by more than eight non-NB proteins).
Detection of Gene Conversion
We first collected coding sequences of NB-LRR genes in each cluster, aligned the sequences, and then used GENECONV version 1.81a (Sawyer, 1989) to detect gene conversion with default settings. A global value of P ≤ 0.05 was used as in previous studies (Drouin, 2002; Mondragon-Palomino and Gaut, 2005). GENECONV cannot distinguish between gene conversion and unequal crossing over.
Divergence and Polymorphism
Orthologs were extracted from a whole-genome alignment analysis (Hu et al., 2011). Next, a codon-based alignment of orthologous coding sequences was performed with PAL2NAL (Suyama et al., 2006). Finally, dN, dS, and dN/dS ratios were calculated for ortholog pairs using the codeml program implemented in PAML version 3.15 (Yang, 1997). Synteny was determined based on orthology of five genes each upstream and downstream of the focal locus. If at least one flanking gene was orthologous, orthologs were accepted as syntenic.
Polymorphisms within A. thaliana were identified in whole-genome Illumina resequencing data of 80 accessions (http://1001genomes.org; Cao et al., 2011) based on TAIR9 annotation (which is identical to the TAIR8 annotation, on which we based our initial NB-LRR gene analyses; Swarbreck et al., 2008). Missing call frequencies were calculated as sum_missed/total_length = (sum_z + sum_n)/((80*gene_length) − sum_del − sum_svdel), where z indicates zero coverage, n indicates no call (with reads mapped to this region but no base called because of ambiguous alignments; this excludes repetitive regions, which are coded as n in the initial matrix), sum_del indicates the sum of deleted bases predicted from alignments, and sum_svdel indicates the sum of deleted bases based on structural variant predictions.
BAC Sequencing, Assembly, Annotation, and Analysis of the Cvi-0 RPP7 Cluster
An AT1G58602-derived 900-bp probe, which was produced from Col-0 genomic DNA as a template with primers G11766 (5′-CAACAAAGAATAGCAGCTTGGAGGA-3′) and G11767 (5′-GGGCATGGAGCCTTGTTTTACTATC-3′), was used to screen a BAC library of A. thaliana Cvi-0. End sequencing was used to map the borders of positive BAC clones, and a clone that flanks the region from At1g58370 to At1g59630 was chosen for shotgun sequencing. BAC DNA was prepared using the Large Construct DNA Preparation Kit (Qiagen). After physical shearing of high-quality BAC DNA, the TOPO Shotgun Subcloning Kit (Invitrogen) was used to construct a shotgun library. T7 and SP6 primers were used to sequence clones on an ABI 3730XL DNA Analyzer. Sequence assembly was performed using Phred for base calling, CROSS_MATCH for removing vector sequences, and Phrap and Consed for assembly (Ewing and Green, 1998; Ewing et al., 1998; Gordon et al., 1998). Primer walking and PCR were used to fill or polish gaps and ambiguous regions. Annotation was performed using FGENESH and FGENESH+ (http://linux1.softberry.com/berry.phtml). Spidey (http://www.ncbi.nlm.nih.gov/spidey/) was used to confirm the annotation based on the alignment with A. thaliana mRNA when needed. Mummer version 3.19 (Kurtz et al., 2004) was used to compare BAC sequences with the reference genomes of A. lyrata and A. thaliana.
The two Cvi BAC contigs have been deposited in GenBank (accession nos. JN389445 and JN389516).
Supplemental Data
The following materials are available in the online version of this article.
Supplemental Figure S1. Phylogenetic relationships of CNL and CN proteins across two species.
Supplemental Figure S2. Phylogenetic relationships of TNL and TN proteins across two species.
Supplemental Figure S3. Comparison of three RPP7 haplotypes.
Supplemental Figure S4. Flow chart for domain annotation of NB-LRR proteins.
Supplemental Table S1. Domain annotation of A. thaliana NB-LRR proteins.
Supplemental Table S2. Domain annotation of A. lyrata NB-LRR proteins.
Supplemental Table S3. Cluster assignment in A. thaliana.
Supplemental Table S4. Cluster assignment in A. lyrata.
Supplemental Table S5. Mean (median) of dN, dS, and dN/dS for different NB-LRR gene types.
Supplemental Table S6. Syntenic and nonsyntenic orthologs.
Supplemental Table S7. Mean (median) of missing calls in 80 resequenced A. thaliana genomes.
Supplemental Table S8. Summary of BACs of the RPP7 region across the three alleles.
Supplemental Table S9. Cluster assignment of RLPs in A. thaliana.
ACKNOWLEDGMENTS
We thank the Department of Energy-Joint Genome Institute for sequencing the A. lyrata genome under their Community Sequencing Program and all members of the A. lyrata Genome Analysis Consortium, especially Tina Hu, Pedro Pattyn, Brandon Gaut, Jeremy Schmutz, Yves van de Peer, Igor Grigoriev, and Magnus Nordborg, for their efforts in assembling and annotating the genome sequence. We are indebted to Maarten Koornneef for providing access to the Cvi-0 BAC library; Christa Lanz for her help with the sequencing; Stijn van Dongen for his help with mcxdeblast analysis; Andrei Lupas for his help with coiled-coil domain annotation; Erica Bakker and Joy Bergelson for providing information on NB-LRR gene annotation; and Carmen Melchers for proofreading the manuscript.
LITERATURE CITED
Author notes
This work was supported by ERA-NET on Plant Genomics grant ARelatives from the Deutsche Forschungsgemeinschaft, the Human Frontiers in Science Program Organization (grant no. RGP0057/2007), and the Max Planck Society.
Present address: Max Planck Institute for Plant Breeding Research, Carl-von-Linné-Weg 10, 50829 Cologne, Germany.
Present address: Center for Genomic Regulation and Universitat Pompeu Fabra, 08003 Barcelona, Spain.
Corresponding author; e-mail [email protected].
The author responsible for distribution of materials integral to the findings presented in this article in accordance with the policy described in the Instructions for Authors (www.plantphysiol.org) is: Detlef Weigel ([email protected]).
The online version of this article contains Web-only data.
Open Access articles can be viewed online without a subscription.
