


Abstract
Biofuels provide a promising route of producing energy while reducing reliance on petroleum. Developing sustainable liquid fuel production from cellulosic feedstock is a major challenge and will require significant breeding efforts to maximize plant biomass production. Our approach to elucidating genes and genetic pathways that can be targeted for improving biomass production is to exploit the combination of genomic tools and genetic diversity in rice (Oryza sativa). In this study, we analyzed a diverse set of 20 recently resequenced rice varieties for variation in biomass traits at several different developmental stages. The traits included plant size and architecture, aboveground biomass, and underlying physiological processes. We found significant genetic variation among the 20 lines in all morphological and physiological traits. Although heritability estimates were significant for all traits, heritabilities were higher in traits relating to plant size and architecture than for physiological traits. Trait variation was largely explained by variety and breeding history (advanced versus landrace) but not by varietal groupings (indica, japonica, and aus). In the context of cellulosic biofuels development, cell wall composition varied significantly among varieties. Surprisingly, photosynthetic rates among the varieties were inversely correlated with biomass accumulation. Examining these data in an evolutionary context reveals that rice varieties have achieved high biomass production via independent developmental and physiological pathways, suggesting that there are multiple targets for biomass improvement. Future efforts to identify loci and networks underlying this functional variation will facilitate the improvement of biomass traits in other grasses being developed as energy crops.
Developing a sustainable biofuels program that makes significant contributions to our current and future national energy budget requires unprecedented inputs of biomass for energy conversion. At present, the U.S. fuel-ethanol industry produces its bioethanol from corn (Zea mays) grain; however, this is not considered a sustainable source of energy, as an increase in demand for corn-based ethanol will have significant land requirements, compete with food and feed industries, and reduce exports of animal products (Sun and Cheng, 2002; Elobeid et al., 2007). Because of these issues, liquid fuel production from plant lignocellulose is considered a better alternative and is being pursued from both agronomic and engineering perspectives.
Plants display a variety of architectures that encompass branching (tillering) patterns, plant height, arrangement and size of leaves, and structure of reproductive organs. Widespread adoption of wheat (Triticum aestivum) and rice (Oryza sativa) cultivars with altered plant architecture (semidwarf varieties) averted severe food shortages in the 1960s and was an essential component of the “Green Revolution” (Khush, 1999). Continued use of these semidwarf varieties in conjunction with higher rates of nitrogen application has resulted in doubled grain yields; these gains are due to increased allocation of resources to grain rather than vegetative tissues and also greater resistance to lodging in extreme weather events (Khush, 1999, 2001; Reinhardt and Kuhlemeier, 2002). In many ways, improvement of plants for both food and fuel or for dedicated biofuel feedstock purposes will require new breeding and selection emphases that are different from those targeted during the Green Revolution. Therefore, understanding the genetic and molecular processes that control key morphological and physiological processes will facilitate the breeding of high-biomass-yielding crops. Leaf traits, such as leaf thickness, size, and shape, leaf number, and orientation, are key factors influencing biomass formation (Yang and Hwa, 2008). In rice, erect leaves have a higher leaf area index that increases photosynthetic carbon assimilation rates through increased light capture and nitrogen use efficiency (Sinclair and Sheehy, 1999; Sakamoto et al., 2006). Leaves are the predominant photosynthetic organ and, thus, are critical targets for maximizing carbon assimilation by improving morphological traits and/or improving photosynthetic efficiency (Zhu et al., 2010).
Many nonfood crops, including perennial C4 rhizomatous grass species such as switchgrass (Panicum virgatum) and Miscanthus, have potential to serve as viable, long-term sources of energy. Rice shares patterns of growth and development (plant architecture, flowering and maturity timelines, and senescence patterns) and physiological processes (photosynthetic light reactions, assimilate partitioning, and secondary metabolism) with these other grasses. Unfortunately, many of these perennial grasses have very large genomes, and the genetic and genomic resources necessary to propel their development forward as biomass crops do not exist. Rice, in contrast, has all these tools readily available (Bush and Leach, 2007), and, despite large differences between genome size and chromosome number, gene content and order are well conserved among the grasses (Gale and Devos, 1998; Feuillet and Keller, 2002; Jannoo et al., 2007). In addition, available rice germplasm collections contain genetic and phenotypic variation accumulated over years of domestication and selection under very diverse environments (e.g. well watered, flooded, water limited; Leung et al., 2007). Thus, rice serves as an excellent model grass for biomass gene discovery, and that information can be transferred to the new energy crops (Bush and Leach, 2007). However, current understanding regarding the magnitude of genetic variation for biomass traits in all plants is limited, including the variability in rice.
Here, we investigate biomass variation in the OryzaSNP set (Table I), a collection 20 rice varieties that are genetically and agronomically diverse and that were resequenced for the purpose of identifying single nucleotide polymorphisms (SNPs; McNally et al., 2009). This diversity set contains varieties that are widely used in a number of international breeding programs and that are representative of the two major lineages, indica and japonica. The set also includes aus, deep water, and aromatic rice groups. The OryzaSNP set also can be divided into two varietal classes based on their breeding history and usage, advanced and landrace varieties. Landraces are varieties that have little modern breeding but have persisted over generations through farmer maintenance. Advanced varieties have complex breeding histories and are products of breeding programs that enhance specific and desirable traits. An interesting outcome of the OryzaSNP resequencing project was the detection of chromosomal regions introgressed from one varietal lineage into another, revealing the effects of rice’s long breeding history (McNally et al., 2009). Some introgressions contained genes responsible for important agronomic traits; given this, it has been hypothesized that other introgressed regions might contain additional traits important for agriculture. To capture and investigate the diversity represented in this collection (McNally et al., 2006, 2009), populations of recombinant inbred lines based on pairwise crosses of the 20 lines in the OryzaSNP set are being developed. These resources are valuable tools to assess the diversity of traits related to biomass accumulation.
Sample information on the 20 diverse rice lines of the OryzaSNP set used in this study
| IRGCa Accession No. | Variety Name | Country of Origin | Varietal Groupb | Variety Class |
| 117283 | Rayada | Bangladesh | aus | Landrace |
| 117273 | N22 | India | aus | Landrace |
| 117267 | FR13A | India | aus | Landrace |
| 117266 | Dular | India | aus | Landrace |
| 117271 | Minghui 63 | China | indica | Advanced |
| 117280 | Zhenshan 97B | China | indica | Advanced |
| 117268 | IR64-21 | Philippines | indica | Advanced |
| 117277 | Shan-Huang Zhan-2 (SHZ-2) | China | indica | Advanced |
| 117278 | Swarna | India | indica | Advanced |
| 117281 | Aswina | Bangladesh | indica | Landrace |
| 117276 | Sadu-Cho | Korea | indica | Landrace |
| 117275 | Pokkali | India | indica | Landrace |
| 117279 | Tainung 67 | Taiwan | japonica | Advanced |
| 117274 | Nipponbare | Japan | japonica | Advanced |
| 117269 | Li-Jiang-Xin-Tuan-Hei-Gu (LTH) | China | japonica | Advanced |
| 117270 | M202 | United States | japonica | Advanced |
| 117281 | Cypress | United States | japonica | Advanced |
| 117265 | Dom Sufid | Iran | japonica | Landrace |
| 117272 | Moroberekan | Guinea | japonica | Landrace |
| 117264 | Azucena | Philippines | japonica | Landrace |
International Rice Genebank Collection.
Bayesian clustering predicted that the population was composed of three groups (McNally et al., 2009).
| IRGCa Accession No. | Variety Name | Country of Origin | Varietal Groupb | Variety Class |
| 117283 | Rayada | Bangladesh | aus | Landrace |
| 117273 | N22 | India | aus | Landrace |
| 117267 | FR13A | India | aus | Landrace |
| 117266 | Dular | India | aus | Landrace |
| 117271 | Minghui 63 | China | indica | Advanced |
| 117280 | Zhenshan 97B | China | indica | Advanced |
| 117268 | IR64-21 | Philippines | indica | Advanced |
| 117277 | Shan-Huang Zhan-2 (SHZ-2) | China | indica | Advanced |
| 117278 | Swarna | India | indica | Advanced |
| 117281 | Aswina | Bangladesh | indica | Landrace |
| 117276 | Sadu-Cho | Korea | indica | Landrace |
| 117275 | Pokkali | India | indica | Landrace |
| 117279 | Tainung 67 | Taiwan | japonica | Advanced |
| 117274 | Nipponbare | Japan | japonica | Advanced |
| 117269 | Li-Jiang-Xin-Tuan-Hei-Gu (LTH) | China | japonica | Advanced |
| 117270 | M202 | United States | japonica | Advanced |
| 117281 | Cypress | United States | japonica | Advanced |
| 117265 | Dom Sufid | Iran | japonica | Landrace |
| 117272 | Moroberekan | Guinea | japonica | Landrace |
| 117264 | Azucena | Philippines | japonica | Landrace |
International Rice Genebank Collection.
Bayesian clustering predicted that the population was composed of three groups (McNally et al., 2009).
While breeding for seed yield may also select for biomass traits, the high-yielding dwarf varieties are examples where seed production and biomass are not invariably linked. Selection for high harvest index is expected to favor alleles that reduce vegetative biomass and favor grain yield. Although increased vegetative biomass per se has not been a target of standard grass crop breeding programs, selection for vigorous crop establishment in modern cultivation may have favored genes and alleles optimizing vegetative growth. A number of morphological traits (height, tiller number, dry biomass) are routinely measured to investigate disease resistance, drought tolerance, hybrid vigor, root traits, seedling characteristics, and yield (Albar et al., 1998; Hemamalini et al., 2000; Li et al., 2001; Xing et al., 2002; Courtois et al., 2003; Xu et al., 2004; Lian et al., 2005; Cui et al., 2008). Gas exchange has been compared in many rice studies to look for physiological differences, specifically in water use efficiency (WUE), nitrogen deficiency, and increasing atmospheric CO2 (Sage, 1994; Huang et al., 2004; Xu et al., 2009). However, no comprehensive investigation of biomass and underlying traits in diverse rice germplasm has been reported. To achieve maximal biomass production in the new energy crops, it is important to identify genes and genetic pathways that are critical to biomass yield, understand the selective forces that have shaped the frequencies of these genes in modern varieties, and determine which physiological and morphological traits lead to larger and denser plants. Using the diverse OryzaSNP set, we systematically assessed which of these traits contribute to biomass accumulation in greenhouse conditions. Here, we report the variation and heritability of key traits that significantly impact biomass and the genomic regions associated with this variation.
RESULTS
Large Natural Variation Exists in Biomass Traits in Rice
By growing the 20 OryzaSNP varieties in a common greenhouse, we show that they display many plant architectural and morphological differences that are predicted to underlie variation in biomass production (Fig. 1). We measured wet and dry biomass, harvest index, and percentage water content for all 20 varieties (Table II). The cell wall polymer composition (ratio of cellulose, hemicellulose, and lignin) and ash content were determined for leaves and stems. We also measured a series of physiological traits related to growth and carbon capture, including leaf-area-based photosynthesis, transpiration, stomatal conductance, and WUE. Morphological traits assessed were leaf length and width, height, tiller diameter, tiller length, tiller number, and plant girth (Table II).
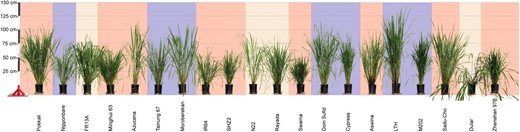
Diversity of morphological and physiological traits in the OryzaSNP set. Plants were photographed 100 d after sowing and are sorted by the weight of dry biomass at maturity (ordered highest to lowest from the left). Background color indicates varietal group, as described in Table I: red (indica), blue (japonica), and tan (aus).
Mean and heritability estimate trait values for the OryzaSNP collection
| Trait | Aswina | Azucena | Cypress | Dom Sufid | Dular | FR13 | IR64 | LTH | M202 | Minghui 63 | Moroberekan | N22 | Nipponbare | Pokkali | Rayada | Saducho | SHZ-2 | Swarna | Tainung 67 | Zhanshen 97B | H2 |
| Photosynthesis (μmol CO2 m−2 s−1) | 23.0 | 16.8 | 23.9 | 18.6 | 19.9 | 16.8 | 19.6 | 21.0 | 27.8 | 17.0 | 23.1 | 18.2 | 23.4 | 15.2 | 19.2 | 20.2 | 19.5 | 21.3 | 22.2 | 22.0 | 0.17 |
| Ci (μmol CO2 m−2 s−1) | 316 | 333 | 285 | 327 | 306 | 339 | 322 | 259 | 294 | 319 | 312 | 313 | 291 | 325 | 328 | 304 | 317 | 304 | 309 | 323 | 0.29 |
| Transpiration (mmol water m−2 s−1) | 9.6 | 8.7 | 7.5 | 9.3 | 7.8 | 10.0 | 9.3 | 5.6 | 8.6 | 8.2 | 8.6 | 8.1 | 7.6 | 6.9 | 8.8 | 7.5 | 8.4 | 8.3 | 8.8 | 9.5 | 0.19 |
| Stomatal conductance (mol water m−2 s−1) | 0.7 | 0.7 | 0.5 | 0.7 | 0.6 | 0.8 | 0.7 | 0.3 | 0.7 | 0.6 | 0.7 | 0.6 | 0.5 | 0.5 | 0.7 | 0.5 | 0.6 | 0.6 | 0.7 | 0.8 | 0.18 |
| Instantaneous WUE (μmol CO2 m−2 s−1)/(mmol water m−2 s−1) | 2.4 | 1.9 | 3.4 | 2.0 | 2.7 | 1.7 | 2.1 | 3.9 | 3.3 | 2.2 | 2.8 | 2.4 | 3.4 | 2.2 | 2.3 | 2.8 | 2.4 | 2.7 | 2.6 | 2.3 | 0.33 |
| Height (cm) | 126 | 154 | 112 | 173 | 140 | 132 | 100 | 180 | 110 | 104 | 138 | 140 | 105 | 152 | 118 | 124 | 102 | 91 | 109 | 96 | 0.77 |
| Tiller no. | 27 | 21 | 34 | 26 | 26 | 37 | 49 | 23 | 29 | 72 | 16 | 46 | 46 | 30 | 66 | 33 | 49 | 43 | 32 | 21 | 0.51 |
| Final tiller no. | 22 | 23 | 86 | 29 | 32 | 37 | 75 | 30 | 36 | 99 | 25 | 53 | 139 | 31 | 52 | 35 | 124 | 89 | 102 | 23 | 0.74 |
| Tiller diameter (mm) | 6.9 | 9.6 | 5.3 | 5.3 | 5.3 | 5.2 | 5.6 | 6.1 | 5.7 | 6.0 | 8.7 | 4.9 | 4.8 | 8.8 | 4.6 | 5.4 | 5.4 | 4.8 | 5.5 | 5.2 | 0.90 |
| Tiller length (cm) | 59 | 79 | 53 | 80 | 80 | 54 | 52 | 122 | 60 | 42 | 77 | 78 | 46 | 75 | 39 | 68 | 57 | 46 | 58 | 43 | 0.84 |
| Leaf length (cm) | 73 | 88 | 61 | 72 | 68 | 79 | 60 | 66 | 60 | 67 | 78 | 71 | 69 | 85 | 77 | 71 | 58 | 58 | 69 | 54 | 0.88 |
| Leaf width (cm) | 1.5 | 2.0 | 1.5 | 1.6 | 1.7 | 1.7 | 1.6 | 1.6 | 1.8 | 1.8 | 2.0 | 1.7 | 1.5 | 1.8 | 1.3 | 1.3 | 1.6 | 1.5 | 1.5 | 1.9 | 0.77 |
| Girth (cm) | 23 | 26 | 23 | 22 | 15 | 22 | 23 | 19 | 17 | 30 | 25 | 21 | 33 | 25 | 20 | 21 | 27 | 25 | 28 | 12 | 0.69 |
| Wet biomass (g) | 259 | 525 | 366 | 398 | 314 | 490 | 465 | 386 | 317 | 537 | 496 | 478 | 633 | 640 | 338 | 269 | 505 | 374 | 510 | 124 | 0.53 |
| Dry biomass (g) | 125 | 234 | 147 | 167 | 92 | 241 | 197 | 121 | 101 | 236 | 204 | 184 | 294 | 364 | 181 | 98 | 194 | 172 | 219 | 32 | 0.74 |
| Percentage water content | 0.52 | 0.55 | 0.60 | 0.58 | 0.71 | 0.51 | 0.58 | 0.69 | 0.68 | 0.56 | 0.59 | 0.62 | 0.53 | 0.43 | 0.47 | 0.64 | 0.62 | 0.54 | 0.57 | 0.74 | 0.60 |
| Harvest indexa | |||||||||||||||||||||
| Leaf | 0.22 | 0.30 | 0.34 | 0.26 | 0.33 | 0.26 | 0.28 | 0.34 | 0.35 | 0.33 | 0.28 | 0.30 | 0.35 | 0.22 | 0.31 | 0.31 | 0.32 | 0.31 | 0.31 | 0.37 | 0.84 |
| Sheath | 0.29 | 0.28 | 0.28 | 0.27 | 0.31 | 0.33 | 0.30 | 0.26 | 0.29 | 0.29 | 0.33 | 0.27 | 0.31 | 0.23 | 0.31 | 0.25 | 0.30 | 0.31 | 0.29 | 0.29 | 0.42 |
| Stem | 0.49 | 0.41 | 0.39 | 0.46 | 0.37 | 0.41 | 0.43 | 0.40 | 0.35 | 0.38 | 0.39 | 0.43 | 0.34 | 0.55 | 0.38 | 0.44 | 0.38 | 0.38 | 0.41 | 0.34 | 0.66 |
| Seed | –b | 0.21 | – | 0.23 | 0.48 | – | 0.70 | 0.33 | 0.48 | – | 0.13 | 0.26 | – | – | – | 0.47 | – | – | 0.22 | 0.62 | 0.91 |
| Stem | |||||||||||||||||||||
| Cellulose (%) | 26.1 | 18.7 | 30.7 | 23.2 | 23.5 | 31.7 | 19.1 | 33.1 | 22.3 | 23.4 | 22.9 | 20.2 | 16.5 | 18.2 | 23.8 | 30.9 | 27.1 | 28.5 | 23.3 | 30.8 | 0.58 |
| Hemicellulose (%) | 27.0 | 27.2 | 32.3 | 24.4 | 26.1 | 28.0 | 28.7 | 26.1 | 24.1 | 35.0 | 33.1 | 24.9 | 27.2 | 27.8 | 31.8 | 26.7 | 27.3 | 35.1 | 36.3 | 23.9 | 0.49 |
| Lignin (%) | 2.6 | 2.4 | 2.7 | 2.7 | 2.5 | 1.7 | 2.0 | 4.3 | 3.0 | 3.1 | 2.5 | 2.3 | 2.0 | 1.3 | 1.9 | 3.8 | 3.3 | 3.7 | 3.3 | 2.1 | 0.59 |
| Ash (%) | 13.6 | 10.8 | 10.6 | 4.5 | 7.7 | 11.9 | 6.4 | 14.9 | 11.9 | 8.1 | 3.5 | 9.1 | 5.0 | 5.0 | 15.9 | 13.3 | 12.3 | 10.9 | 5.0 | 15.2 | 0.56 |
| Soluble fiber (%) | 30.6 | 41.0 | 23.7 | 45.2 | 40.2 | 26.7 | 43.7 | 21.6 | 38.7 | 30.5 | 38.1 | 43.5 | 49.4 | 47.8 | 26.6 | 25.4 | 30.0 | 21.8 | 32.2 | 28.0 | 0.57 |
| Leaf | |||||||||||||||||||||
| Cellulose (%) | 18.9 | 32.8 | 18.9 | 24.7 | 24.4 | 25.6 | 24.5 | 29.5 | 27.0 | 28.4 | 25.3 | 27.0 | 26.5 | 26.5 | 22.2 | 30.2 | 25.1 | 20.6 | 28.4 | 28.8 | 0.31 |
| Hemicellulose (%) | 28.5 | 31.3 | 26.9 | 32.4 | 32.8 | 25.7 | 36.1 | 31.0 | 29.7 | 36.2 | 36.1 | 30.4 | 34.8 | 34.8 | 30.6 | 27.0 | 24.6 | 32.1 | 36.2 | 26.1 | 0.53 |
| Lignin (%) | 1.4 | 2.0 | 1.0 | 4.6 | 4.6 | 2.2 | 4.8 | 4.4 | 4.1 | 3.8 | 4.3 | 2.6 | 2.1 | 2.1 | 2.3 | 2.5 | 2.6 | 2.2 | 3.8 | 4.4 | 0.36 |
| Ash (%) | 5.4 | 16.7 | 4.9 | 8.6 | 15.1 | 4.3 | 15.7 | 12.9 | 12.6 | 7.6 | 9.6 | 15.9 | 10.1 | 10.1 | 5.8 | 16.9 | 5.8 | 4.3 | 7.6 | 14.0 | 0.66 |
| Soluble fiber (%) | 45.8 | 17.2 | 48.3 | 29.6 | 23.2 | 42.2 | 18.9 | 22.1 | 26.7 | 23.9 | 24.8 | 24.1 | 26.5 | 26.5 | 39.0 | 23.5 | 41.8 | 40.8 | 23.9 | 26.8 | 0.74 |
| Intrinsic WUE (δ13C) | −29.1 | −28.5 | −28.2 | −28.9 | −28.6 | −29.7 | −29.6 | −26.6 | −29.4 | −28.7 | −28.3 | −29.2 | −29.2 | −28.7 | −29.1 | −29.6 | −30.1 | −30.4 | −30.7 | −30.3 | 0.62 |
| Days to flag leaf | – | 126 | 95 | 109 | 73 | – | 131 | 95 | 83 | 139 | 119 | 89 | 89 | – | – | 73 | 119 | 164 | 131 | 66 | 0.96 |
| Days to heading | – | 139 | 110 | 119 | 83 | – | 145 | 110 | 89 | 145 | 131 | 95 | 202 | – | – | 83 | 124 | 172 | 145 | 83 | 0.96 |
| Days to full emergence | – | 172 | 124 | 124 | 89 | – | 165 | 119 | 95 | 165 | 135 | 110 | 207 | – | – | 89 | 131 | 197 | 150 | 89 | 0.98 |
| Days to mature seed | – | 181 | 197 | 181 | 119 | – | 242 | 165 | 139 | 242 | 215 | 165 | 252 | – | – | 165 | 215 | 252 | 242 | 139 | 0.97 |
| Days to cut down | 187 | 181 | 199 | 181 | 135 | 205 | 242 | 165 | 163 | 242 | 244 | 165 | 254 | 240 | 184 | 165 | 221 | 254 | 242 | 139 | – |
Harvest index for vegetative biomass (leaf, sheath, stem) = yield (leaf, sheath, stem)/total vegetative biomass. Grain harvest index = grain yield/(grain + vegetative biomass).
Dashes indicate plants that did not reproduce in our greenhouse.
| Trait | Aswina | Azucena | Cypress | Dom Sufid | Dular | FR13 | IR64 | LTH | M202 | Minghui 63 | Moroberekan | N22 | Nipponbare | Pokkali | Rayada | Saducho | SHZ-2 | Swarna | Tainung 67 | Zhanshen 97B | H2 |
| Photosynthesis (μmol CO2 m−2 s−1) | 23.0 | 16.8 | 23.9 | 18.6 | 19.9 | 16.8 | 19.6 | 21.0 | 27.8 | 17.0 | 23.1 | 18.2 | 23.4 | 15.2 | 19.2 | 20.2 | 19.5 | 21.3 | 22.2 | 22.0 | 0.17 |
| Ci (μmol CO2 m−2 s−1) | 316 | 333 | 285 | 327 | 306 | 339 | 322 | 259 | 294 | 319 | 312 | 313 | 291 | 325 | 328 | 304 | 317 | 304 | 309 | 323 | 0.29 |
| Transpiration (mmol water m−2 s−1) | 9.6 | 8.7 | 7.5 | 9.3 | 7.8 | 10.0 | 9.3 | 5.6 | 8.6 | 8.2 | 8.6 | 8.1 | 7.6 | 6.9 | 8.8 | 7.5 | 8.4 | 8.3 | 8.8 | 9.5 | 0.19 |
| Stomatal conductance (mol water m−2 s−1) | 0.7 | 0.7 | 0.5 | 0.7 | 0.6 | 0.8 | 0.7 | 0.3 | 0.7 | 0.6 | 0.7 | 0.6 | 0.5 | 0.5 | 0.7 | 0.5 | 0.6 | 0.6 | 0.7 | 0.8 | 0.18 |
| Instantaneous WUE (μmol CO2 m−2 s−1)/(mmol water m−2 s−1) | 2.4 | 1.9 | 3.4 | 2.0 | 2.7 | 1.7 | 2.1 | 3.9 | 3.3 | 2.2 | 2.8 | 2.4 | 3.4 | 2.2 | 2.3 | 2.8 | 2.4 | 2.7 | 2.6 | 2.3 | 0.33 |
| Height (cm) | 126 | 154 | 112 | 173 | 140 | 132 | 100 | 180 | 110 | 104 | 138 | 140 | 105 | 152 | 118 | 124 | 102 | 91 | 109 | 96 | 0.77 |
| Tiller no. | 27 | 21 | 34 | 26 | 26 | 37 | 49 | 23 | 29 | 72 | 16 | 46 | 46 | 30 | 66 | 33 | 49 | 43 | 32 | 21 | 0.51 |
| Final tiller no. | 22 | 23 | 86 | 29 | 32 | 37 | 75 | 30 | 36 | 99 | 25 | 53 | 139 | 31 | 52 | 35 | 124 | 89 | 102 | 23 | 0.74 |
| Tiller diameter (mm) | 6.9 | 9.6 | 5.3 | 5.3 | 5.3 | 5.2 | 5.6 | 6.1 | 5.7 | 6.0 | 8.7 | 4.9 | 4.8 | 8.8 | 4.6 | 5.4 | 5.4 | 4.8 | 5.5 | 5.2 | 0.90 |
| Tiller length (cm) | 59 | 79 | 53 | 80 | 80 | 54 | 52 | 122 | 60 | 42 | 77 | 78 | 46 | 75 | 39 | 68 | 57 | 46 | 58 | 43 | 0.84 |
| Leaf length (cm) | 73 | 88 | 61 | 72 | 68 | 79 | 60 | 66 | 60 | 67 | 78 | 71 | 69 | 85 | 77 | 71 | 58 | 58 | 69 | 54 | 0.88 |
| Leaf width (cm) | 1.5 | 2.0 | 1.5 | 1.6 | 1.7 | 1.7 | 1.6 | 1.6 | 1.8 | 1.8 | 2.0 | 1.7 | 1.5 | 1.8 | 1.3 | 1.3 | 1.6 | 1.5 | 1.5 | 1.9 | 0.77 |
| Girth (cm) | 23 | 26 | 23 | 22 | 15 | 22 | 23 | 19 | 17 | 30 | 25 | 21 | 33 | 25 | 20 | 21 | 27 | 25 | 28 | 12 | 0.69 |
| Wet biomass (g) | 259 | 525 | 366 | 398 | 314 | 490 | 465 | 386 | 317 | 537 | 496 | 478 | 633 | 640 | 338 | 269 | 505 | 374 | 510 | 124 | 0.53 |
| Dry biomass (g) | 125 | 234 | 147 | 167 | 92 | 241 | 197 | 121 | 101 | 236 | 204 | 184 | 294 | 364 | 181 | 98 | 194 | 172 | 219 | 32 | 0.74 |
| Percentage water content | 0.52 | 0.55 | 0.60 | 0.58 | 0.71 | 0.51 | 0.58 | 0.69 | 0.68 | 0.56 | 0.59 | 0.62 | 0.53 | 0.43 | 0.47 | 0.64 | 0.62 | 0.54 | 0.57 | 0.74 | 0.60 |
| Harvest indexa | |||||||||||||||||||||
| Leaf | 0.22 | 0.30 | 0.34 | 0.26 | 0.33 | 0.26 | 0.28 | 0.34 | 0.35 | 0.33 | 0.28 | 0.30 | 0.35 | 0.22 | 0.31 | 0.31 | 0.32 | 0.31 | 0.31 | 0.37 | 0.84 |
| Sheath | 0.29 | 0.28 | 0.28 | 0.27 | 0.31 | 0.33 | 0.30 | 0.26 | 0.29 | 0.29 | 0.33 | 0.27 | 0.31 | 0.23 | 0.31 | 0.25 | 0.30 | 0.31 | 0.29 | 0.29 | 0.42 |
| Stem | 0.49 | 0.41 | 0.39 | 0.46 | 0.37 | 0.41 | 0.43 | 0.40 | 0.35 | 0.38 | 0.39 | 0.43 | 0.34 | 0.55 | 0.38 | 0.44 | 0.38 | 0.38 | 0.41 | 0.34 | 0.66 |
| Seed | –b | 0.21 | – | 0.23 | 0.48 | – | 0.70 | 0.33 | 0.48 | – | 0.13 | 0.26 | – | – | – | 0.47 | – | – | 0.22 | 0.62 | 0.91 |
| Stem | |||||||||||||||||||||
| Cellulose (%) | 26.1 | 18.7 | 30.7 | 23.2 | 23.5 | 31.7 | 19.1 | 33.1 | 22.3 | 23.4 | 22.9 | 20.2 | 16.5 | 18.2 | 23.8 | 30.9 | 27.1 | 28.5 | 23.3 | 30.8 | 0.58 |
| Hemicellulose (%) | 27.0 | 27.2 | 32.3 | 24.4 | 26.1 | 28.0 | 28.7 | 26.1 | 24.1 | 35.0 | 33.1 | 24.9 | 27.2 | 27.8 | 31.8 | 26.7 | 27.3 | 35.1 | 36.3 | 23.9 | 0.49 |
| Lignin (%) | 2.6 | 2.4 | 2.7 | 2.7 | 2.5 | 1.7 | 2.0 | 4.3 | 3.0 | 3.1 | 2.5 | 2.3 | 2.0 | 1.3 | 1.9 | 3.8 | 3.3 | 3.7 | 3.3 | 2.1 | 0.59 |
| Ash (%) | 13.6 | 10.8 | 10.6 | 4.5 | 7.7 | 11.9 | 6.4 | 14.9 | 11.9 | 8.1 | 3.5 | 9.1 | 5.0 | 5.0 | 15.9 | 13.3 | 12.3 | 10.9 | 5.0 | 15.2 | 0.56 |
| Soluble fiber (%) | 30.6 | 41.0 | 23.7 | 45.2 | 40.2 | 26.7 | 43.7 | 21.6 | 38.7 | 30.5 | 38.1 | 43.5 | 49.4 | 47.8 | 26.6 | 25.4 | 30.0 | 21.8 | 32.2 | 28.0 | 0.57 |
| Leaf | |||||||||||||||||||||
| Cellulose (%) | 18.9 | 32.8 | 18.9 | 24.7 | 24.4 | 25.6 | 24.5 | 29.5 | 27.0 | 28.4 | 25.3 | 27.0 | 26.5 | 26.5 | 22.2 | 30.2 | 25.1 | 20.6 | 28.4 | 28.8 | 0.31 |
| Hemicellulose (%) | 28.5 | 31.3 | 26.9 | 32.4 | 32.8 | 25.7 | 36.1 | 31.0 | 29.7 | 36.2 | 36.1 | 30.4 | 34.8 | 34.8 | 30.6 | 27.0 | 24.6 | 32.1 | 36.2 | 26.1 | 0.53 |
| Lignin (%) | 1.4 | 2.0 | 1.0 | 4.6 | 4.6 | 2.2 | 4.8 | 4.4 | 4.1 | 3.8 | 4.3 | 2.6 | 2.1 | 2.1 | 2.3 | 2.5 | 2.6 | 2.2 | 3.8 | 4.4 | 0.36 |
| Ash (%) | 5.4 | 16.7 | 4.9 | 8.6 | 15.1 | 4.3 | 15.7 | 12.9 | 12.6 | 7.6 | 9.6 | 15.9 | 10.1 | 10.1 | 5.8 | 16.9 | 5.8 | 4.3 | 7.6 | 14.0 | 0.66 |
| Soluble fiber (%) | 45.8 | 17.2 | 48.3 | 29.6 | 23.2 | 42.2 | 18.9 | 22.1 | 26.7 | 23.9 | 24.8 | 24.1 | 26.5 | 26.5 | 39.0 | 23.5 | 41.8 | 40.8 | 23.9 | 26.8 | 0.74 |
| Intrinsic WUE (δ13C) | −29.1 | −28.5 | −28.2 | −28.9 | −28.6 | −29.7 | −29.6 | −26.6 | −29.4 | −28.7 | −28.3 | −29.2 | −29.2 | −28.7 | −29.1 | −29.6 | −30.1 | −30.4 | −30.7 | −30.3 | 0.62 |
| Days to flag leaf | – | 126 | 95 | 109 | 73 | – | 131 | 95 | 83 | 139 | 119 | 89 | 89 | – | – | 73 | 119 | 164 | 131 | 66 | 0.96 |
| Days to heading | – | 139 | 110 | 119 | 83 | – | 145 | 110 | 89 | 145 | 131 | 95 | 202 | – | – | 83 | 124 | 172 | 145 | 83 | 0.96 |
| Days to full emergence | – | 172 | 124 | 124 | 89 | – | 165 | 119 | 95 | 165 | 135 | 110 | 207 | – | – | 89 | 131 | 197 | 150 | 89 | 0.98 |
| Days to mature seed | – | 181 | 197 | 181 | 119 | – | 242 | 165 | 139 | 242 | 215 | 165 | 252 | – | – | 165 | 215 | 252 | 242 | 139 | 0.97 |
| Days to cut down | 187 | 181 | 199 | 181 | 135 | 205 | 242 | 165 | 163 | 242 | 244 | 165 | 254 | 240 | 184 | 165 | 221 | 254 | 242 | 139 | – |
Harvest index for vegetative biomass (leaf, sheath, stem) = yield (leaf, sheath, stem)/total vegetative biomass. Grain harvest index = grain yield/(grain + vegetative biomass).
Dashes indicate plants that did not reproduce in our greenhouse.
Both wet and dry biomass were measured to determine the percentage water content of biomass for each variety (Table II). Total percentage water content ranged between 43% and 74% of the wet biomass in the 20 rice varieties, revealing large genetic variation in leaf and stem water content (Table II). Overall biomass production also varied considerably. For example, the dry biomass yield of Pokkali was 11-fold higher than that of the smallest variety, Zhenshan 97B (Fig. 1).
Other morphological traits that might be involved in biomass accumulation also exhibited large trait variation across the 20 varieties. Leaf lengths ranged from 53.6 cm in the advanced variety Zhenshan 97B to 88.2 cm in the landrace Azucena. For all varieties, leaf width ranged between 1.3 and 2.0 cm, but the average was 1.6 cm. LTH, the tallest plant of all 20 lines (180 cm), was twice the height of the smallest plant, Swarna (90 cm). Tiller diameter of most varieties was approximately 5 mm, but three landraces (i.e. Moroberekan, Pokkali, and Azucena) had larger tiller diameters (8.7, 8.8, and 9.6 mm, respectively). Girth of plants was measured 2 cm above the soil line and ranged from 12 to 33 cm. We also observed several phenotypes that are unfavorable for agricultural development. For example, var Dular displayed severe lodging and high propensity for seed shattering in the greenhouse (Fig. 1).
The harvest index for vegetative biomass was determined using the mass of a specific tissue relative to total biomass (Table II). The 20 varieties vary in how they allocate biomass to leaves, sheaths, and stems (23%–37%, 23%–33%, and 34%–55% of the total biomass, respectively). In all but three varieties, stems constituted the largest component of total dry biomass. For these three varieties, dry biomass was split almost evenly among the three tissues. In Pokkali, the plant with the most biomass, approximately 55% of the weight is in the stems, with the remaining partitioned evenly between the leaves and sheaths.
Not all varieties reproduced and set seed in our greenhouse conditions, so a subset of 10 flowering varieties was analyzed for partitioning of resources between seed and biomass. The harvest index for seed (grain dry weight to total aboveground dry weight) ranged from 0.13 to 0.70. Not surprisingly, there was a strong negative relationship between harvest index and total dry biomass (r = −0.79993, P = 4.3 × 10−37).
Cell wall polymer composition among higher plants can differ substantially in quality and quantity (Pauly and Keegstra, 2008) and is an important consideration for bioenergy production. The amounts of cell wall structural polymers and ash content were determined for leaf and stem tissues gravimetrically after treatment with either neutral or acidic detergent. Cellulose, hemicellulose, lignin, ash, and soluble fiber content varied widely among the varieties. Cell wall polymers (cellulose, hemicellulose, and lignin) constituted 45% to 67% of both the stem and leaf tissues. Lignin levels in these greenhouse-grown plants were low relative to reports from field-grown plants and ranged from 1.3% to 4.3% total dry weight. The remaining portion consists of proteins, nonstructural carbohydrates (starch and sugar), and ash. Ash levels ranged from about 4% to 16% of total dry weight in both leaves and stems.
Several physiological traits varied across the 20 varieties, including photosynthesis, instantaneous WUE, and carbon isotope ratio. Particularly notable was the large variation in leaf area-based photosynthetic rate across the 20 lines. The landrace Pokkali and the U.S. advanced var M202 had the lowest and highest rates, respectively, with Pokkali having half the photosynthetic rate of M202. Instantaneous WUE was measured on all plants during the vegetative stage, and integrated WUE across the growing season was determined from the carbon isotope ratio measured postharvest. Both integrated and instantaneous WUE measures predict that the advanced varieties Cypress and LTH have the highest WUE.
All morphological traits had higher heritabilities than those for physiological traits. Morphological traits (not including total biomass) were all greater than 0.50, with six out of seven being greater than 0.69 (Table II). Heritability estimates were relatively similar for stem structural polymer composition, ranging from approximately 0.5 to 0.6, but were highly variable for leaf polymer composition. Heritability estimates for fresh weights were lower than the corresponding dry material, indicating environmental contributions to variation in water content.
Traits Related to Biomass Covary
Among the 37 traits tested for genetic correlation with total biomass, final tiller number, girth, leaf length, individual tissue weights (leaves, sheaths, and stems), and days to maturity were the most positively correlated to final biomass (Fig. 2; Supplemental Table S1). Percentage water content and leaf area-based photosynthesis were negatively correlated to total biomass. Biomass of leaves, sheath, and stem tissues as well as total dry biomass were all positively correlated to leaf length and negatively correlated to lignin levels in the stems. Tiller diameter was negatively correlated to tiller number. Many of the physiological traits were correlated to each other, but only photosynthesis was significantly correlated to dry biomass.
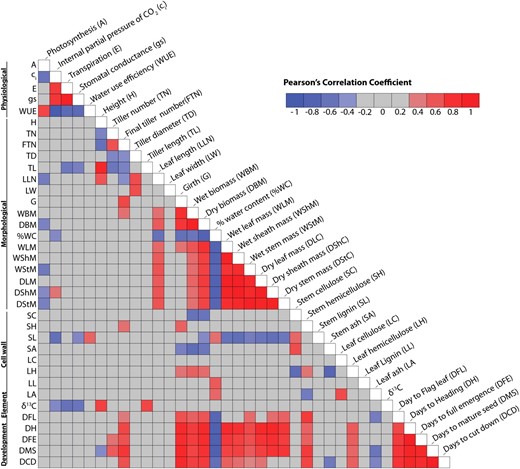
Heat map showing Pearson’s correlation coefficients for biomass traits. Self-self correlations are identified in white. Significant correlations (−0.44 ≤ r ≥ 0.44) are colored either in red (positive) or blue (negative) hues, while correlations that were not significant are shown in gray. Numerical values are shown in Supplemental Table S1.
In cell wall fractions of stems (but not leaves), cellulose, lignin, and ash were negatively correlated to total dry biomass (Fig. 2; Supplemental Table S1). In contrast, hemicellulose was positively correlated to biomass in both stems and leaves. Quantities of cell wall polymers were often not correlated among tissue types; only the quantity of hemicellulose was correlated between leaves and stems. Comparison of cell wall components in leaves versus stems revealed different cellulose content and lignin content in each of these tissues. The lack of correlation between cell wall polymers in these two tissues suggests independent genetic regulation in the leaves and stems. Thus, for improvement of biomass traits, alteration of cellulose and lignin content could be targeted independently in leaves and stems.
As expected, wet and dry weights for partial tissue and total plant weight positively covaried across all of the growth and developmental stages. Biomass measures at each time point were also positively correlated to tiller number, plant girth, and hemicellulose levels in both stems and leaves. Leaf ash levels were negatively correlated to many growth stages as well as height and days to mature seed (Fig. 2; Supplemental Table S1).
Sources of Trait Variation Are Linked to Varietal Class and Genotype But Not to Varietal Grouping
The genetic makeup of modern rice varieties has been shaped through directed selection by breeders. The OryzaSNP set population can be divided into two varietal classes (advanced and landrace) and structured into three distinct clades (indica, japonica, and aus; McNally et al., 2009). We investigated these divisions within the 20 lines to identify potential sources of trait variation.
Trait values were compared between landrace and advanced varieties. Overall, landraces had lower water content than advanced lines (Table III). Morphological traits, such as plant height, final tiller number, tiller diameter, tiller length, and leaf length, also differed between landraces and advanced varieties. In general, landraces were taller, with longer leaves and stems, but only half as many tillers as advanced varieties. Because several varieties continue to tiller after the main tillers begin to senesce, we counted tiller number at two times, first at 135 d after sowing and again at maturity (as many as 252 d after sowing). This continual tillering phenotype is primarily seen in advanced varieties, which had twice as many tillers at maturity than at 135 d. In contrast, tiller numbers of landraces did not change between the two time points. Advanced varieties have an average grain harvest index of 0.46, while landraces average a harvest index of 0.30. The shift to higher harvest index in the advanced varieties reflects a shift of resources to seed versus vegetative development seen in all high-yielding grain crops. On average, the girth of landrace plants was smaller than in advanced varieties (Table III). Wet and dry biomass, the majority of the cell wall structural components, and carbon isotope ratio did not differ between landrace and advanced varieties.
Influence of varietal class (landrace and advanced) on biomass traits
Mean ± se and P values for varietal classes for biomass traits are shown.
| Trait | Advanced | Landrace | P |
| Photosynthesis (μmol CO2 m−2 s−1) | 20.4 ± 0.4 | 19.2 ± 0.4 | 0.041 |
| Ci (μmol CO2 m−2 s−1) | 305.9 ± 3.1 | 321.4 ± 1.6 | <0.0001 |
| Transpiration (mmol water m−2 s−1) | 8.3 ± 0.2 | 8.9 ± 0.123 | 0.0095 |
| Stomatal conductance (mol water m−2 s−1) | 0.6 ± 0.02 | 0.7 ± 0.01 | 0.021 |
| Instantaneous WUE (μmol CO2 m−2 s−1)/(mmol water m−2 s−1) | 2.6 ± 0.1 | 2.2 ± 0.05 | 0.0001 |
| Height (cm) | 109.8 ± 3.2 | 139.8 ± 2.2 | <0.0001 |
| Tiller no. | 40.6 ± 2.8 | 30.8 ± 2.3 | 0.007 |
| Final tiller no. | 80.0 ± 5.8 | 31.7 ± 1.9 | <0.0001 |
| Tiller diameter (mm) | 5.4 ± 0.1 | 6.8 ± 0.2 | <0.0001 |
| Tiller length (cm) | 57.5 ± 3.0 | 68.6 ± 2.1 | 0.0002 |
| Leaf length (cm) | 62.1 ± 0.9 | 76.6 ± 1.2 | <0.0001 |
| Leaf width (cm) | 1.6 ± 0.02 | 1.7 ± 0.03 | 0.1639 |
| Girth (cm) | 23.7 ± 0.8 | 22.5 ± 0.6 | 0.0005 |
| Percentage water content | 0.60 ± 0.011 | 0.55 ± 0.011 | 0.0037 |
| Dry biomass (g) | 173.6 ± 10.6 | 192.8 ± 11.7 | 0.4114 |
| Harvest indexa leaf | 0.33 ± 0.007 | 0.28 ± 0.009 | <0.0001 |
| Sheath | 0.29 ± 0.004 | 0.29 ± 0.008 | 0.4998 |
| Stem | 0.38 ± 0.008 | 0.44 ± 0.013 | 0.0004 |
| Seed | 0.46 ± 0.02 | 0.30 ± 0.02 | <0.0001 |
| Lignin (%) | 3.0 ± 0.2 | 2.4 ± 0.2 | 0.0221 |
Harvest index for vegetative biomass (leaf, sheath, stem) = yield (leaf, sheath, stem)/total vegetative biomass. Grain harvest index = grain yield/(grain + vegetative biomass).
Like biomass, many of the physiological traits differed between landraces and advanced varieties. Landrace varieties had lower rates of CO2 assimilation, increased transpiration via greater stomatal conductance, and a higher ratio of internal to atmospheric CO2 than advanced varieties. Landraces have slightly lower WUE than those seen in advanced varieties.
Using a nested ANOVA (genotype nested within clade), we calculated the relative contribution of genotype and clade to variation in measured traits. Genotype nested within clade was highly significant for all physiological traits and a subset of morphological traits (Table IV). In contrast, clade was only significant for photosynthetic assimilation, height, and tiller number and size.
Total amount of variation associated with clade and genotype by trait
| Trait | Clade | Genotype | ||||
| F Ratio | P< | Percentage Variance | F Ratio | P< | Percentage Variance | |
| Photosynthesis | 16.6 | 9.7 × 10−09 | 24.7 | 4.2 | 4.3 × 10−06 | 28.2 |
| Ci | 20.3 | 3.0 × 10⁻¹⁰ | 9.3 | 15.0 | 2.2 × 10⁻¹⁹ | 65.2 |
| Transpiration | 15.0 | 4.5 × 10−08 | 0.0 | 11.8 | 3.1 × 10⁻¹⁶ | 68.2 |
| Stomatal conductance | 6.9 | 2.8 × 10−04 | 0.0 | 12.1 | 1.6 × 10⁻¹⁶ | 66.4 |
| Instantaneous WUE | 31.0 | 4.6 × 10⁻¹⁴ | 20.6 | 12.9 | 2.2 × 10⁻¹⁷ | 54.3 |
| Height | 140.2 | 4.5 × 10⁻²⁹ | 16.1 | 57.6 | 2.3 × 10−42 | 76.7 |
| Tiller no. | 20.5 | 4.0 × 10−08 | 13.3 | 9.7 | 3.1 × 10⁻¹⁴ | 50.4 |
| Tiller diameter | 65.0 | 1.6 × 10⁻¹⁸ | 3.2 | 51.0 | 4.1 × 10−40 | 86.8 |
| Tiller length | 42.8 | 5.7 × 10⁻¹⁴ | 8.1 | 25.5 | 4.4 × 10⁻²⁸ | 76.0 |
| Leaf length | 12.0 | 2.3 × 10−05 | 1.1 | 10.9 | 1.3 × 10⁻¹⁵ | 63.6 |
| Leaf width | 6.0 | 3.6 × 10−03 | 0.0 | 15.7 | 1.4 × 10⁻²⁰ | 70.7 |
| Girth | 15.4 | 1.7 × 10−06 | 0.0 | 12.1 | 5.3 × 10⁻¹⁷ | 69.4 |
| Wet biomass | 3.1 | 4.9 × 10−02 | 0.0 | 7.8 | 1.0 × 10⁻¹¹ | 53.6 |
| Dry biomass | 3.2 | 4.6 × 10−02 | 0.0 | 17.2 | 6.9 × 10⁻²² | 74.0 |
Genome Introgressions Are Enriched for Biomass Traits
The genomes of the OryzaSNP varieties are mosaics, containing historical introgressions from multiple clades (McNally et al., 2009). For example, an indica variety may contain multiple introgressed regions from the japonica or aus clade. To determine if any biomass traits were associated with regions introgressed from indica, japonica, or aus, we used a single marker regression method (logarithm of the odds ratio [LOD] threshold of 2.0). We found three distinct introgression blocks from japonica correlated with carbon assimilation, CO2 internal partial pressure (Ci), or WUE based on a permutation-based LOD cutoff (α = 95% at 1,000 permutations; Table V; Supplemental Table S2). Several other aus and japonica introgressions were identified, but they were not significant after the permutation-based LOD cutoff (Supplemental Table S2). There were no introgressions from indica associated with phenotypes measured in this analysis.
Segments introgressed from japonica that are associated with biomass traits enriched for biomass-related QTLs
| Chromosome | Block Starta | Block Size | Associated Biomass-Related Traitb | No. of QTLs Associated with Introgression Blocks | |
| Biomass Relatedc | Non Biomass Related | ||||
| Mb | kb | ||||
| 3 | 15.3 | 300 | A, Ci, WUE | 43 | 18 |
| 5 | 19.5 | 200 | A, Ci, WUE | 26 | 35 |
| 6 | 13.2 | 100 | A, Ci, WUE | 34 | 21 |
Introgressions significantly associated with biomass-related traits using a permutation-based LOD threshold (1,000 permutations, 95% α).
A, Carbon assimilation.
QTLs annotated as affecting anatomy, vigor, and yield from Gramene release 31.
| Chromosome | Block Starta | Block Size | Associated Biomass-Related Traitb | No. of QTLs Associated with Introgression Blocks | |
| Biomass Relatedc | Non Biomass Related | ||||
| Mb | kb | ||||
| 3 | 15.3 | 300 | A, Ci, WUE | 43 | 18 |
| 5 | 19.5 | 200 | A, Ci, WUE | 26 | 35 |
| 6 | 13.2 | 100 | A, Ci, WUE | 34 | 21 |
Introgressions significantly associated with biomass-related traits using a permutation-based LOD threshold (1,000 permutations, 95% α).
A, Carbon assimilation.
QTLs annotated as affecting anatomy, vigor, and yield from Gramene release 31.
To determine if the introgressed regions identified above were enriched for biomass-related quantitative trait loci (QTLs), we used the QTL enrichment analysis method described by McNally et al. (2009). Indeed, QTLs that were biomass related (i.e. vigor, anatomy, and yield as curated in Gramene QTLs release 31; http://gramene.org) were enriched in 10 of 11 introgressed regions (Table V; Supplemental Table S2).
DISCUSSION
Targeted genetic improvement of new bioenergy feedstocks depends on identifying genetic variation in critical morphological, structural, and physiological traits. Here, we demonstrated substantial genetic variation for biomass traits in 20 diverse rice varieties, and, based on genetic correlations among these traits and total biomass, we determined that multiple routes can be used to achieve increased biomass. A powerful incentive for using rice as a model for studying biomass is that this information can easily be translated to emerging breeding programs of promising bioenergy grasses. Genetic loci can be identified in rice and subsequently targeted for biomass improvement in other grasses.
Among the 20 OryzaSNP varieties, variation in percentage water content ranged from 43% to 74% (Table II), and, significantly, varieties with the lowest percentage water content also had the highest total biomass. This result suggests that targeting reduced water content may be a selection regime to increase total biomass. In addition, varieties with reduced water content at harvest will have reduced transport and handling costs.
Another approach to increase biomass is to increase plant girth. Among the OryzaSNP set, plants with high biomass exhibited two contrasting phenotypes relative to girth. The first group had a large number of thin tillers, while the other displayed a small number of large-diameter tillers. Continuous tillering associated with high grain yield is characteristically selected for in advanced varieties. Indeed, these high-biomass varieties exhibited a large number of small tillers with high grain harvest index. In contrast, landrace varieties are characterized by “determinant” tillering and low grain yield and exhibit a small number of large-diameter tillers with low grain harvest index. For cellulosic biomass, selection for an increased number of thick tillers is warranted. Interestingly, no variety among the 20 exhibited a combination of high tiller number with large diameters.
Compared with efforts focused on downstream processing technologies, less has been invested in improving the profile of structural carbohydrates in cell walls of bioenergy crops. Most breeding efforts for biofuel feedstocks are focused on increased plant size (increased total biomass) or higher yields per acre (Ragauskas et al., 2006). However, to maximize the efficiency of energy conversion, future breeding efforts should also target cell wall composition optimized for various processing methods. For example, cell walls with high cellulose and low lignin may be preferred for fermentation but not for pyrolysis. In alfalfa (Medicago sativa) and poplar (Populus spp.), reducing carbon partitioned to lignin resulted in increased carbon partitioned to cellulose and, therefore, increased cellulose-lignin ratios (Hu et al., 1999; Chen and Dixon, 2007). The outcome of altering the cellulose-lignin ratios on final biomass can vary. In poplar, increased cellulose-lignin ratios led to increased plant size (Hu et al., 1999), whereas some mutations in alfalfa that increased cellulose-lignin ratios led to decreased plant size (Chen and Dixon, 2007). High cellulose-lignin ratios can lead to lodging problems (Pedersen et al., 2005). Across the 20 rice varieties, cell wall polymer composition varied, suggesting the potential for targeted improvement. We note that our lignin values, obtained from individual varieties grown in a greenhouse, were low (1.3%–4.3% total dry weight) compared with studies using field-grown mixtures of rice varieties (14% total dry weight; Jin and Chen, 2007), suggesting that environmental conditions may greatly influence lignin content.
In the 20 rice varieties, cell wall polymer composition in leaves differs from that measured in stems and, in general, wall polymer composition is not genetically correlated among tissue types. This suggests that the compositions of leaf and stem structural carbohydrates are under separate genetic control, and, based on complementary studies with maize and sorghum (Sorghum bicolor), this may be a common characteristic in monocots (Krakowsky et al., 2005, 2006; Murray et al., 2008). Like sorghum (Murray et al., 2008), most of the OryzaSNP varieties (17 out of 20) contain more biomass in their stems than in leaves. Together, these results emphasize that improvement strategies must take into consideration the differences in how stems and leaves contribute to total biomass as well as how changing cell wall composition may alter harvest indices for specific vegetative tissues. Based on the fact that stems make up the bulk of biomass, our whole-plant girth observation may point to a tractable field-based screen for increased biomass. However, field-based selection for carbohydrate structure in specific tissues would not be trivial, because wall polymer composition is under separate genetic control between leaves and stems.
As early as the 1980s, rice straw and hulls were recognized as the largest agricultural wastes in Asia, particularly in countries producing as many as three crops of rice per year (Ponnamperuma, 1984). For this reason, farmers burn stover in the fields. This is necessary because the natural rate of decomposition is not sufficient for turnover, and burning reduces plant pathogen pressure on subsequent crops (Ponnamperuma, 1984). Thus, despite its availability, rice stover has not been fully exploited as an energy feedstock. Likewise, rice hulls, which can make up to 20% of the total dry weight of a rice field, have not been widely used, although they are sometimes feedstock for energy production through gasification (Beagle, 1978; Lin et al., 1998).
The composition and quantity of cell wall components are primary factors determining whether or not a feedstock can be burned effectively for a particular application. For example, alkali metals, in combination with silica and sulfur, are primary factors responsible for clogging gasification equipment when heated at relatively low temperatures (Jenkins et al., 1998). Total ash content of grasses varies greatly, from less than 1% to greater than 15% (for review, see Pauly and Keegstra, 2008). In rice, the ash content is primarily composed of silica, the largest mineral component of perennial grasses (Samson et al., 2005; Jin and Chen, 2007). Silica content is influenced by soil type and water uptake as well as by genetic variation. For example, in our controlled conditions, we observed a wide range of ash content (4%–16%) in the OryzaSNP collection, suggesting noteworthy genetic variation in ash content. Apart from forage crops, few breeding efforts have targeted ash compositional changes in grass species. A long-term breeding effort would be necessary to change ash composition, and improvements would have to be balanced against negative effects, because silica is believed to help prevent animal herbivory (Salim and Saxena, 1992; Cotterill et al., 2007; Keeping et al., 2009).
On a global scale, the largest restriction to plant production is the availability of water; therefore, the ability of plants to use water efficiently is of great importance to agriculture (Boyer, 1982; Pennisi, 2008). We found significant differences in both instantaneous WUE and integrated WUE (δ13C) among the 20 lines, and both methods of measuring WUE predicted the same highly efficient varieties. However, varieties that were less efficient at water use did not rank the same between methods. WUE is calculated as the ratio of carbon assimilation to transpirational water loss, while δ13C is measured from the relative abundance of 13C in the tissue. Both WUE and δ13C are negative functions of Ci/Ca under constant atmospheric CO2 (Ca) and the vapor pressure difference between the inside of the leaf and ambient air, but the correlations between WUE and δ13C are never equal to 1 (Farquhar et al., 1989; Ehleringer and Monson, 1993; Araus et al., 2002). Differences in δ13C are due to photosynthetic capacity (A max) and/or stomatal conductance. The genetic differences in A max are partially explained by differences in carboxylation capacity or the regeneration of ribulose bisphosphate (Farquhar and von Caemmerer, 1981).
Substantial increases in productivity of major grain crops over the last 50 years have contributed significantly to the world’s ability to feed an increasing human population. This was achieved primarily through reducing plant size and reallocation of assimilated carbon to seed yield in conjunction with increased nitrogen fertilization. Because past breeding focused primarily on increasing photoassimilate partitioning to harvested tissues, little effort directly targeted improving photosynthesis, although new initiatives to improve photosynthetic rates are considered a frontier for grain and biomass yields (Hibberd and Covshoff, 2010; Zhu et al., 2010). However, simply increasing daytime carbon assimilation rates may not have the desired effect if enhancements are not coupled with positive changes in shoot architecture and carbon metabolism, such as decreasing rates of respiration. We found a negative correlation between photosynthetic CO2 assimilation rates and biomass accumulation in the OryzaSNP set. Although counterintuitive, this result is not unique to rice; strong negative correlations have been observed between photosynthetic rates and total leaf area in field-grown soybean (Glycine max; Hesketh et al., 1981) and among photosynthetic rates and leaf size in field-grown wheat and goatgrass (Aegilops spp.; Austin et al., 1982). Photosynthetic rates were also negatively correlated with biomass accumulation in greenhouse-grown common cocklebur (Xanthium strumarium; Wassom et al., 2003). This suggests that multiple, semiindependent components contribute to carbon capture and allocation. One possibility is that respiration rates are substantially different among the OryzaSNP set. Further investigation is necessary to understand the negative relationship between photosynthetic rates and biomass accumulation in the OryzaSNP set.
Rice varieties are commonly grouped based on geographic distribution as well as plant and grain morphology. As early as 200 B.C.E., rice varieties in China were recorded as “hsien” and “keng,” and, in the late 1920s, Japanese scientists divided cultivated rice into two subspecies, “indica” and “japonica” (Kato et al., 1928; Chang et al., 1965). The indica (hsien) group was characterized as profusely tillering, tall-stature plants with light green leaves, while the japonica (keng) group was a medium tillering, short-stature plant with dark green leaves (Chang et al., 1965). Molecular and genetic methods support the phenotypic characteristics that differentiate various rice varieties, including indica and japonica, as well as landrace and advanced modern varieties (McNally et al., 2009; Zhao et al., 2010). In contrast to the above, examination of physiological and morphological traits associated with high biomass did not follow the same clade topology, suggesting that high biomass production may be achieved via multiple, independent developmental and physiological pathways. This supports our hypothesis that novel genetic loci with major effects on biomass yield have not been uncovered in traditional breeding programs.
One reason for selecting the 20 OryzaSNP varieties for detailed characterization was the potential to relate detailed phenotypic measurements to the high-density SNP data that are available for these varieties. The small sample size of the OryzaSNP varieties is not suitable for formal association mapping. However, as shown by McNally et al. (2009), it is possible to identify chromosomal regions that reflect the breeding history of key rice clades. In some instances, the distinct japonica, indica, and aus introgressions align well with known traits under strong selection in rice breeding (McNally et al., 2009). Using single marker regression analysis, we tested for significant effects of introgressions from japonica, indica, or aus on our measured phenotypes. Of 3,838 blocks tested, three chromosomal regions we identified had significant associations to photosynthetic assimilation and its correlated traits (e.g. Ci/Ca). It is not clear why significant associations were not detected for morphological traits or why there were no associations between indica introgressions and biomass traits, although lack of power is certainly a factor. To reduce false positives with this limited sample size, we used a conservative permutation-based LOD score as a threshold cutoff for calling associations. Interestingly, the identified regions were enriched with QTLs reported to be related to plant vigor, anatomy, and yield, providing promising leads for future studies. A limitation of this analysis is that introgressed regions were broadly categorized only into japonica, indica, and aus clades. Thus, each region carries heterogeneous genetic loci from diverse backgrounds rather than the unique chromosomal loci found in biparental mapping populations. Nonetheless, the results from this analysis suggest considerable benefits from detailed phenotyping of a small set of “founder varieties,” such that specific regions can be identified for validation using recombinant populations sharing those introgression regions.
CONCLUSION
Creating a successful program that makes significant contributions to the national energy budget requires unprecedented inputs of biomass for energy conversion. The data presented here identify physiological and morphological traits that vary with biomass across a broad spectrum of rice varieties. We identified a suite of traits in rice that have a substantial impact on “biomass” yield. Moreover, different varieties achieved high yields by employing unique combinations of different traits, supporting the hypothesis that multiple genetic loci contribute to overall productivity. Efforts are under way to exploit genomic tools in rice to identify loci responsible for the observed trait variation. Finally, the traits identified here exhibited a significant level of genetic variation, supporting the idea that they are good targets for traditional breeding to enhance yield in new energy crops.
MATERIALS AND METHODS
Plant Materials
The OryzaSNP collection (Table I), a set 20 varieties, germplasm lines, and landraces that are genetically and agronomically diverse, was chosen to represent the biomass diversity found within rice (Oryza sativa; McNally et al., 2009). The complete OryzaSNP set was analyzed for biomass traits (July 2008–April 2009; n = 5) and for vegetative harvest index (leaf, sheath, and stems; January–October, 2009; n = 2). A subset of flowering varieties (Azucena, Dom Sufid, Dular, IR64, LTH, M202, Moroberekan, N22, Sadu-Cho, Tainung 67, and Zhenshan 97B) were used to determine grain harvest index (April–October 2008; n = 15).
Growth Conditions
Plants were grown in a greenhouse environment with controlled temperature and relative humidity (approximately 78°C and 55%) at Colorado State University. To standardize total irradiance levels across experiments, supplemental high-intensity discharge lighting was used to maintain a 16-h-light/8-h-dark photoperiod. Rice seeds were pregerminated in fungicide Maxim XL (Syngenta) for 3 d prior to planting in potting mixture (4:4:1 Canadian sphagnum peat:Pro-Mix BX:sand). Pro-Mix BX is a general purpose peat-based growing medium (Premier Horticulture). Greenhouse-grown rice plants were fertilized twice weekly with Peters Excel 15-5-15 Cal-Mag (Scotts), starting at 1 month of age at a rate of 300 mg L−1.
Trait Screening
Plant height was measured from the soil surface to the tip of the longest leaf. Height and tiller number were measured weekly from 6 weeks after germination to maturity. At maturity, tiller diameter and length were determined from five individual tillers and averaged. Tiller length was measured from the soil surface to the node of the most distant leaf. Tiller diameter was measured using a caliper. Leaf length and width were measured at least three times throughout the growing season, and the maximum measure is reported. Girth was measured 2 cm above the soil surface 135 d after sowing and at plant maturity.
All aboveground biomass was harvested, transferred to a paper bag, and then weighed. The samples were oven dried at 93°C until they achieved a constant weight. Percentage dry weight was calculated as dry weight divided by wet sample weight. To determine the allocation of aboveground biomass, plants were stripped into leaves, sheaths, and stems, and wet and dry weights were determined. Leaf harvest index was calculated by dividing the leaf dry yield value by the total vegetative plant weight. Sheath and stem harvest indices were calculated as above, substituting the appropriate tissue. Grain harvest index was calculated as the total grain dry weight divided by the total aboveground biomass weight (vegetative and grain weight).
For cell wall polymer determination, 5 g of leaves and stems for each plant was separately ground to produce a fine powder using a Braun Aromatic KSM 2 coffee grinder. Tissue powder was sent to the Soil and Forage Analysis Laboratory of the University of Wisconsin (Marshfield). The cell wall structural components were determined by using acid detergent fiber, lignin acid detergent fiber, and neutral detergent fiber procedures. Acid detergent fiber is the fiber portion of plants (cellulose and lignin), while neutral detergent fiber values are the acid detergent fiber fraction plus hemicelluloses.
Dried plant tissue was processed for carbon isotope analysis by randomly sampling dried leaves at maturity. Leaf sample (50 mg) from each individual was cut into 2-mm strips and then transferred into a 2-mL microfuge tube containing stainless-steel BBs. Tissue was ground to a fine powder by shaking for 5 min on a paint shaker. The resulting uniform powder was then subsampled, and 2 mg for each plant was analyzed. Samples were analyzed for δ13C at the University of California Davis Stable Isotope Facility. Isotope ratio data were provided as ratios relative to the Pee Dee Belemnite standard (PDB), where δ13C = (Rs/RPDB − 1) × 1,000 (Hubick et al., 1986).
Gas-Exchange Measurements
Gas-exchange measurements including CO2 fixation rate, stomatal conductance, transpiration rate, and Ci were obtained using a LI-6400 portable photosynthesis system (LI-COR) with a leaf chamber fluorometer cuvette. Short-term, intrinsic WUE was calculated from the corrected CO2 fixation rate and transpiration rate. Measurements were taken in the greenhouse on the youngest fully expanded leaf of each plant. The mid part of the selected leaf was enclosed in the leaf chamber, and the measurements were logged after stability was attained in the chamber. Measurements were taken under constant leaf temperature (20°C) and photosynthetic photon flux density (1,200 μmol m–2 s–1), and CO2 was maintained at 400 μmol mol−1. Five individuals per genotype were measured weekly in a stratified manner over the course of 2 d from 9 am to 4 pm for 6 weeks, while all the plants were in the vegetative stage. The plants were measured five times at each measurement session. We logged a total of 3,000 measurements from 100 individual plants. These data were checked for technical error, and then a mean for each plant each day was calculated. A general linear model was calculated with time as a covariate.
Statistical Analysis
For each trait, data were transformed to improve normality using a box-cox transformation. ANOVA was calculated using the statistical software package JMP V8.0 (SAS Institute). For evaluation of varietal group effects, all traits were analyzed in ANOVA, where varietal group was entered as the primary model effect and group nested within genotype were considered as fixed effects. To calculate the relative contributions of genotype and varietal groupings to the total variation in biomass traits, both varietal group and genotype nested within varietal group were considered random effects. The genetic correlation between traits is presented as Pearson’s correlation coefficients among genotype means. The estimation of broad-sense heritability for each trait is based on the resemblance among full sibs within each variety and was calculated from variance components obtained through mixed-model ANOVAs using restricted maximum likelihood with models including only variety, which was considered a random effect (Falconer and Mackay, 1996).
Introgression Analysis
To estimate the association of biomass-related traits with introgressed genome regions from indica, japonica, or aus origins, we used the single marker regression method, which is usually used to identify markers linked to QTLs (Collard et al., 2005). This method is suited to the OryzaSNP varieties because it does not require marker position information and does not assume linkage between markers. Previously, McNally et al. (2009) used SNP data from the 20 OryzaSNP varieties to define introgressed genome blocks of 100 kb from indica, japonica, or aus clades. For the analysis of phenotypes in this study, we generated three independent genotype data sets of the 20 varieties for each type of introgression (i.e. from indica, japonica, or aus; Supplemental Table S3). We illustrate the construction of the introgressed genotype data set using two indica varieties, SHZ-2 and Minghui 63, as an example. If, after comparing a chromosome 1 genome block of 100 kb from variety SHZ-2 with the other 19 OryzaSNP varieties, no introgressed indica segment was detected, then this SHZ-2 block would be scored as <nonintrogressed> (score = 3). In contrast, for the same genome block, if comparison of Minghui 63 with the other 19 OryzaSNP varieties shows an indica introgression, then the Minghui 63 100-kb block would be scored as <introgressed> (score = 1). These comparisons were repeated for contiguous 100-kb blocks on the whole genome (3,838 blocks in all) for each variety, and each introgression type was identified (Supplemental Table S3). A linear model was then fitted to each introgression block using the biomass trait data and the introgression score per 100-kb block, and the coefficient of determination (r 2) that explains the phenotypic variation attributed to the introgressed segment was determined. This marker regression analysis was implemented using the R/qtl package (Broman et al., 2003). Regions of introgression significantly associated with biomass-related traits were determined at an initial LOD threshold of 2.0. The permutation-based LOD threshold was also determined at 95% α for 1,000 permutations. Enrichment of Gramene-curated QTLs in introgressed segments with significant effect on biomass traits was determined by comparing for a higher frequency of occurrence of QTLs within these segments against the genome-wide occurrence of QTLs using a one-sided Fisher exact test (McNally et al., 2009).
Supplemental Data
The following materials are available in the online version of this article.
Supplemental Table S1. Pearson’s correlation coefficients among the total biomass traits measured.
Supplemental Table S2. LOD scores and r 2 values for biomass traits correlated to segments introgressed from aus and japonica.
Supplemental Table S3. Three independent genotype data sets of the 20 varieties for each type of introgression.
ACKNOWLEDGMENTS
We thank Bryant Mason and Emily Peachy for technical support.
LITERATURE CITED
Author notes
This work was supported by a Colorado Center for Biorefining and Biofuels-Chevron fellowship (to C.E.J.), by the Colorado Agricultural Experiment Station (to J.K.M. and J.E.L.), and by grants from the U.S. Department of Agriculture-Cooperative State Research, Education, and Extension Service (grant no. 2008–35504–04852), the Office of Science (Biological and Environmental Research), the U.S. Department of Energy (grant no. DE–FG02–08ER64629), and Colorado State University’s Clean Energy Supercluster.
Corresponding author; e-mail [email protected].
The author responsible for distribution of materials integral to the findings presented in this article in accordance with the policy described in the Instructions for Authors (www.plantphysiol.org) is: Jan E. Leach ([email protected]).
The online version of this article contains Web-only data.
Open Access articles can be viewed online without a subscription.
