


Abstract
Plant Resistance (R) genes encode immune receptors that recognize pathogens and activate defense responses. Because of fitness costs associated with maintaining R protein-mediated resistance, expression levels of R genes have to be tightly regulated. However, mechanisms on how R-gene expression is regulated are poorly understood. Here we show that MODIFIER OF snc1, 1 (MOS1) regulates the expression of SUPPRESSOR OF npr1-1, CONSTITUTIVE1 (SNC1), which encodes a Toll/interleukin receptor-nucleotide binding site-leucine-rich repeat type of R protein in Arabidopsis (Arabidopsis thaliana). In the mos1 loss-of-function mutant plants, snc1 expression is repressed and constitutive resistance responses mediated by snc1 are lost. The repression of snc1 expression in mos1 is released by knocking out DECREASE IN DNA METHYLATION1. In mos1 mutants, DNA methylation in a region upstream of SNC1 is altered. Furthermore, expression of snc1 transgenes using the native promoter does not require MOS1, indicating that regulation of SNC1 expression by MOS1 is at the chromatin level. Map-based cloning of MOS1 revealed that it encodes a novel protein with a HLA-B ASSOCIATED TRANSCRIPT2 (BAT2) domain that is conserved in plants and animals. Our study on MOS1 suggests that BAT2 domain-containing proteins may function in regulation of gene expression at chromatin level.
Plant Resistance (R) genes encode immune receptors that directly or indirectly recognize pathogen effectors (Jones and Dangl, 2006). The largest class of predicted intracellular plant immune receptors is the nucleotide binding site-Leu-rich repeat (NB-LRR) type of R proteins (Meyers et al., 2003), which share structural similarity with mammalian innate immunity receptor NOD proteins. Activation of R proteins often results in quick and robust defense responses including the accumulation of salicylic acid (SA), induction of PATHOGENESIS-RELATED (PR) gene expression, and localized programmed cell death known as hypersensitive response (Hammond-Kosack and Jones, 1997). Most NB-LRR R proteins contain either a Toll/interleukin receptor (TIR) domain or a coiled-coil domain at the N terminus that probably functions in downstream defense signaling. Interestingly, overexpression of the TIR domain by itself is sufficient to activate cell death (Swiderski et al., 2009).
Arabidopsis (Arabidopsis thaliana) SUPPRESSOR OF npr1-1, CONSTITUTIVE1 (SNC1) encodes a TIR-NB-LRR type of R protein (Zhang et al., 2003a). The gain-of-function mutation snc1 leads to constitutive activation of the R protein and downstream defense responses without the presence of pathogens. snc1 mutant plants accumulate high levels of SA, constitutively express PR genes, and display enhanced resistance to pathogens (Li et al., 2001). An epiallele of SNC1 known as bal also exhibits similar phenotypes as snc1 (Stokes et al., 2002). Whereas the phenotypes in snc1 are caused by the deregulated activation of the R protein, the phenotypes of bal are caused by increased expression of SNC1 in the mutant. bal was recovered from plants carrying the decrease in DNA methylation1 (ddm1) loss-of-function mutation, which results in a reduction in cytosine methylation throughout the genome (Vongs et al., 1993). But no specific methylation change has been found to correlate with the increased expression of SNC1 in bal. Recently it was shown that the overexpression of SNC1 in bal plants is caused by a 55-kb duplication within the SNC1 locus (Yi and Richards, 2009).
A field test comparing isogenic lines that differ in the presence or absence of RPM1, an R gene conferring gene-for-gene resistance against the bacterial pathogen Pseudomonas syringae carrying the avirulence gene AvrRpm1 or AvrB, showed that RPM1+ plants had reduced seed production and shoot biomass, suggesting that there is a fitness cost associated with maintenance of R gene loci in plants (Tian et al., 2003). In addition, overexpression of R genes Prf1 and SNC1 leads to constitutive activation of defense responses (Oldroyd and Staskawicz, 1998; Stokes et al., 2002), which is detrimental to plant growth. On the other hand, underexpression of R genes can result in loss of R protein function. For example, mutations in EDM2 lead to reduced expression of the resistance gene RPP7 and loss of RPP7-mediated resistance to Hyaloperonospora arabidopsidis isolate Hiks1 (Eulgem et al., 2007). EDM2 belongs to a plant-specific protein family with typical features of transcriptional regulators.
In rice (Oryza sativa), expression of the R gene Xa3 is regulated by both genetic backgrounds and developmental stages and expression levels of Xa3 correlate with the levels of resistance to Xanthomonas oryzae pv oryzae (Cao et al., 2007). Moreover, avrXa27 activates resistance responses through induction of the expression of its cognate R gene Xa27 (Gu et al., 2005). Thus, controlling the expression levels of R genes plays important roles in the regulation of plant defense responses. In a snc1 suppressor screen that identified multiple mos mutants affecting signal transduction downstream of snc1 (Zhang and Li, 2005), we also found multiple alleles of modifier of snc1, 1 (mos1) that inactivate snc1 through repression of the SNC1 locus, suggesting that MOS1 plays an important role in maintaining the expression of SNC1.
RESULTS
Identification and Characterization of mos1 Mutant Alleles
Arabidopsis npr1 is required for SA-induced PR gene expression (Dong, 2004). In snc1 npr1-1 mutant plants, PR gene expression and pathogen resistance are constitutively activated (Li et al., 2001). A classical suppressor screen was carried out to identify genes required for activation of defense responses in the snc1 or snc1 npr1 mutant using fast neutron-mutagenized populations (Zhang and Li, 2005). Multiple genes have been reported to be required for snc1-mediated resistance (Zhang et al., 2005; Palma et al., 2005; Zhang and Li, 2005; Goritschnig et al., 2007; Palma et al., 2007; Goritschnig et al., 2008; Monaghan et al., 2009). From the same mutant screen, two alleles of mos1 (mos1-1 and mos1-2) were also identified. A third allele of mos1, mos1-3, was recovered from a T-DNA mutant population in the snc1 background. The mos1-1 snc1 npr1-1, mos1-2 snc1, and mos1-3 snc1 plants are similar to wild-type Columbia-0 (Col-0) plants in size (Fig. 1A). Backcrossing of mos1-1 snc1 npr1-1 and mos1-2 snc1 to snc1 showed that all F1 plants were snc1 like, indicating that mos1-1 and mos1-2 are both recessive mutations.
![Suppression of snc1 phenotypes by mos1 mutants. A, Morphology of 5-week-old soil-grown plants of wild type (WT), mos1-1 snc1 npr1-1, mos1-2 snc1, mos1-3 snc1, snc1, and snc1 npr1-1. B and C, PR gene expression in wild type, mos1-1 snc1 npr1-1, mos1-2 snc1, mos1-3 snc1, and snc1 seedlings. Total RNA was extracted from 12-d-old seedlings grown on Murashige and Skoog media. Relative expression levels of PR1 (B) or PR2 (C) were determined by real-time PCR. Values were normalized to the expression of ACTIN1. Error bars represent sd from three measurements. The gene expression analysis was performed on three batches of independent grown plants. Similar results were obtained from different batches of plants and data shown are representatives from one of the experiments. *, P < 0.001, significant difference from snc1. D and E, SA levels in wild type, mos1-1 snc1 npr1-1, mos1-2 snc1, and snc1 plants. SA was extracted from 4-week-old soil-grown plants. Error bars represent sd from four measurements. *, P < 0.001, significant difference from snc1. F, Growth of H. arabidopsidis Noco2 on wild type, npr1-1, mos1-1 snc1 npr1-1, mos1-2 snc1, snc1, and snc1 npr1-1 plants. Two-week-old seedlings were sprayed with H. arabidopsidis Noco2 spores (5 × 10⁴ spores/mL). Infection was scored 7 d after inoculation by counting the number of conidia spores. Error bars represent sds from averages of three measurements. Statistical differences among the samples are labeled with different letters (P < 0.01). [See online article for color version of this figure.]](https://oup.silverchair-cdn.com/oup/backfile/Content_public/Journal/plphys/153/3/10.1104_pp.110.156240/2/m_plphys_v153_3_1425_f1.jpeg?Expires=1750533040&Signature=Cn68-NhyYVGfCInfg2KJfvmuurYHLSs3sUj4331fkP24EsnqW91hJCHUPQhQRoo6nND549xgulZTJEzwFf~TdjY6AjgKbNbrM9mxSfCtPe~a1POoVpl2Ll7kIOpuq~~NhFLudv6yFeYiJAYsn5M95aZUJT1MJbBSiN9f4P0Aow3lFBHTQvIX-FoRazn6U-qZKvJLxoXHMB4LjltMTsF99ZL0MlrIf4QP3alY51rkWbmZGcBMoBng34sxSPNkI5lT7GxX20gYImcwt1ddVqqPFiVYtPQRgGoqadIbs1YXyoAfmPKDKAIHfTI~Lt7gbj77kPanr8aFWskj5S1IyeUH3g__&Key-Pair-Id=APKAIE5G5CRDK6RD3PGA)
Suppression of snc1 phenotypes by mos1 mutants. A, Morphology of 5-week-old soil-grown plants of wild type (WT), mos1-1 snc1 npr1-1, mos1-2 snc1, mos1-3 snc1, snc1, and snc1 npr1-1. B and C, PR gene expression in wild type, mos1-1 snc1 npr1-1, mos1-2 snc1, mos1-3 snc1, and snc1 seedlings. Total RNA was extracted from 12-d-old seedlings grown on Murashige and Skoog media. Relative expression levels of PR1 (B) or PR2 (C) were determined by real-time PCR. Values were normalized to the expression of ACTIN1. Error bars represent sd from three measurements. The gene expression analysis was performed on three batches of independent grown plants. Similar results were obtained from different batches of plants and data shown are representatives from one of the experiments. *, P < 0.001, significant difference from snc1. D and E, SA levels in wild type, mos1-1 snc1 npr1-1, mos1-2 snc1, and snc1 plants. SA was extracted from 4-week-old soil-grown plants. Error bars represent sd from four measurements. *, P < 0.001, significant difference from snc1. F, Growth of H. arabidopsidis Noco2 on wild type, npr1-1, mos1-1 snc1 npr1-1, mos1-2 snc1, snc1, and snc1 npr1-1 plants. Two-week-old seedlings were sprayed with H. arabidopsidis Noco2 spores (5 × 10⁴ spores/mL). Infection was scored 7 d after inoculation by counting the number of conidia spores. Error bars represent sds from averages of three measurements. Statistical differences among the samples are labeled with different letters (P < 0.01). [See online article for color version of this figure.]
In snc1 mutant plants, PR gene expression is constitutively activated. As shown in Figure 1, B and C, the expression of PR1 and PR2 in snc1 is suppressed by the mos1 mutations. In snc1 mutant plants, SA also accumulates to high levels (Li et al., 2001). To determine whether mos1-1 and mos1-2 affects the SA level in snc1, total SA and free SA in mos1-1 snc1 npr1 and mos1-2 snc1 plants were extracted and quantified. As shown in Figure 1, D and E, both free SA and total SA in snc1 are dramatically reduced by the mos1-1 and mos1-2 mutations.
To test whether constitutive pathogen resistance in snc1 is affected by the mos1 mutations, mos1-1 snc1 npr1 and mos1-2 snc1 plants were inoculated with the virulent oomycete pathogen H. arabidopsidis Noco2. While snc1 and snc1 npr1 plants were resistant to the pathogen, the mos1-1 snc1 npr1 and mos1-2 snc1 plants completely lost the enhanced resistance in snc1 (Fig. 1F).
MOS1 Encodes a Protein with a HLA-B ASSOCIATED TRANSCRIPT2 Domain That Is Conserved in Plants and Animals
To map the mos1-1 mutation, mos1-1 snc1 (in the Col-0 ecotype background) was crossed with Landsberg erecta (Ler) in which the snc1 locus has been introgressed to generate a segregating F2 population. Crude mapping showed that mos1-1 is located south of snc1 on chromosome 4. Unfortunately the region where mos1-1 is located is derived from the Col-0 ecotype in the Ler-snc1 line. Thus, for fine mapping, mos1-1 snc1 was crossed with Ler. Plants with snc1-like morphology were selected from the F2 population. These plants should be homozygous for the snc1 mutation and heterozygous for the mos1-1 mutation due to recombination. About 800 F3 plants derived from the F2 lines that were homozygous for snc1 and heterozygous for mos1-1 were genotyped with the markers T13J8 and F16G20. The mos1-1 mutation was further mapped to a 110-kb region between marker F22K18 and F6I7 after analyzing recombinants between T13J8 and F16G20 (Fig. 2A).
![Map-based cloning of mos1. A, Map position of mos1-1 on chromosome 4. BAC clones and markers are indicated. B, Gene structure of MOS1 (At4g24680). Exons are indicated by boxes. Introns and untranslated regions are represented by solid lines. The locations of mos1-1 and mos1-2 deletions and the T-DNA insertion in mos1-3, mos1-4 (salk_126709), and mos1-5 (salk_074876) are indicated. The positions of the T-DNA were confirmed by PCR. C, MOS1 expression in wild type, mos1-1 snc1 npr1-1, mos1-2 snc1, and mos1-3 snc1 plants. Total RNA was extracted from 2-week-old seedlings grown on Murashige and Skoog medium. Relative expression level of MOS1 was determined by real-time PCR. The positions of the primers (forward [F] and reverse [R]) are shown in B. Values were normalized to the expression of ACTIN1. Error bars represent sd from three measurements. The gene expression analysis was performed on three batches of independent grown plants. Similar results were obtained from different batches of plants and data shown are representatives from one of the experiments. D, Protein structure of MOS1. a.a., Amino acids; WT, wild type.](https://oup.silverchair-cdn.com/oup/backfile/Content_public/Journal/plphys/153/3/10.1104_pp.110.156240/2/m_plphys_v153_3_1425_f2.jpeg?Expires=1750533040&Signature=21n~UjCkbnW~vAuS-BJSZPxDrqUi4QRP1VqY-Xbu1kLgOsazOj-2bVe1T~BMFev0sKzsGLqSdvmiwLhoKXoznsJ0yGY09duxkpdvRlQrH7RmuODMYiQbgVE6mt9W~jETfcOT0MkBX3M87wZ30lukXhjph7p0TCY6bUuys2gLYvHlLi5sLo3lbrE65eP1iKwJ4sCw6Z076y9ht4YbtCwI~jHawS0DPi2GbJfIxwukUx3cXrwKHfpnqk50F2tk2H4uGMlJY3mHnSeCMbCRAbJR-KN4WsNJXThx9M81YCPfFrGzupLs3nGPua3NqRC5IKIX4Lq6WQ6d9BkxiZ4ONzKfFA__&Key-Pair-Id=APKAIE5G5CRDK6RD3PGA)
Map-based cloning of mos1. A, Map position of mos1-1 on chromosome 4. BAC clones and markers are indicated. B, Gene structure of MOS1 (At4g24680). Exons are indicated by boxes. Introns and untranslated regions are represented by solid lines. The locations of mos1-1 and mos1-2 deletions and the T-DNA insertion in mos1-3, mos1-4 (salk_126709), and mos1-5 (salk_074876) are indicated. The positions of the T-DNA were confirmed by PCR. C, MOS1 expression in wild type, mos1-1 snc1 npr1-1, mos1-2 snc1, and mos1-3 snc1 plants. Total RNA was extracted from 2-week-old seedlings grown on Murashige and Skoog medium. Relative expression level of MOS1 was determined by real-time PCR. The positions of the primers (forward [F] and reverse [R]) are shown in B. Values were normalized to the expression of ACTIN1. Error bars represent sd from three measurements. The gene expression analysis was performed on three batches of independent grown plants. Similar results were obtained from different batches of plants and data shown are representatives from one of the experiments. D, Protein structure of MOS1. a.a., Amino acids; WT, wild type.
To search for the molecular lesion in mos1-1, the region between F22K18 and F6I7 in mos1-1 snc1 was amplified by PCR and sequenced. Comparison with the Col-0 sequence showed that mos1-1 contains an 8-bp deletion in the coding region of AT4G24680 (Fig. 2B). PCR analysis on mos1-2 snc1 revealed that the 3′ half of At4g24680 was deleted in mos1-2 snc1. Expression of MOS1 in mos1-2 was dramatically reduced (Fig. 2C). The third allele of mos1, mos1-3, was isolated after we cloned the MOS1 gene. Inverse PCR showed that mos1-3 contains a T-DNA insertion in the promoter region of MOS1, which abolished MOS1 expression in mos1-3 (Fig. 2C). Two T-DNA alleles of mos1, mos1-4, and mos1-5, were also found in the Salk T-DNA collection. Reverse transcription (RT)-PCR analysis showed that the expression of MOS1 was blocked in mos1-4 and mos1-5 (Supplemental Fig. S1), indicating they are loss-of-function alleles.
Analysis of the cDNA sequence of MOS1 revealed that it encodes a large protein with 1,412 amino acids. The N terminus of MOS1 contains a conserved HLA-B ASSOCIATED TRANSCRIPT2 (BAT2) domain (Fig. 2D). BLAST search of the GenBank showed the N-terminal domain of MOS1 is similar to the mouse BAT2 protein with an E value of 8 × 10⁻⁵. The rest of the protein is rich in hydrophilic residues. A nuclear localization signal (PKKGNKR, amino acid 1,192–1,198) was found at the C terminus of MOS1. Proteins with BAT2 domains are present in most multicellular organisms, most of which contain the BAT2 domain at the N terminus and a large region with mainly hydrophilic residues at the C terminus. The function of the BAT2 domain is unknown. Alignment of the BAT2 domains from various proteins containing this domain is shown in Figure 3.
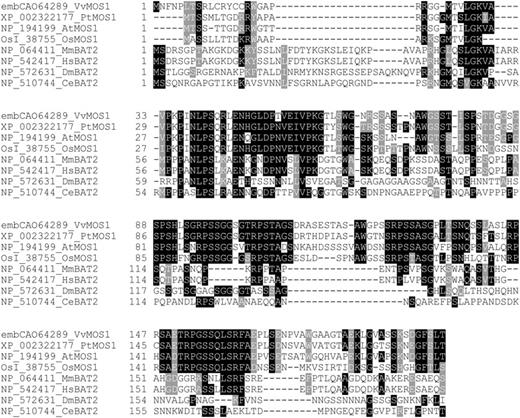
Alignment of BAT2 domains of proteins from different eukaryotic species. The BAT2 domains from Arabidopsis MOS1 (AtMOS1), rice MOS1 (OsI_38755_OsMOS1), grapevine (Vitus vinifera) MOS1 (embCAO64289_VvMOS1), poplar (Populus trichocarpa) MOS1 (XP_002322177_PtMOS1), human BAT2 (NP_542417_HsBAT2), mouse BAT2 (NP_064411_MmBAT2), and two BAT2-domain-containing protein from Drosophila melanogaster (DmBAT2) and C. elegans (CeBAT2) were aligned with ClustalX 2.0.11 and shaded with BOXSHADE (http://www.ch.embnet.org/software/BOX_form.html).
To detect MOS1 protein, we generated a MOS1-specific antibody in rabbit using a fragment of MOS1 containing the N-terminal 235 amino acid. The antibody was capable of detecting 0.006 ng of recombinant protein expressed in Escherichia coli (Supplemental Fig. S2). The steady-state protein levels of MOS1 in plants appear to be very low, as we were not able to detect the protein using this antibody. In addition, we were not able to detect the MOS1 protein in transgenic plants expressing MOS1-GFP or MOS1-3xFLAG fusion protein under either its native promoter or the constitutive 35S promoter using commercial anti-GFP and anti-FLAG antibodies, suggesting that the level of MOS1 is extremely low in Arabidopsis. Analysis of MOS1 expression using the microarray database at The Arabidopsis Information Resource found no obvious induction of its expression under various biotic and abiotic treatments.
MOS1 Regulates SNC1 Expression Levels at Chromatin Level
Since mos1 was one of the most complete suppressors of snc1, we first hypothesized that MOS1 may function in defense signal transduction. However, we found that mos1 single mutants exhibit no defects in basal resistance against the bacterial pathogen P. syringae pv maculicola ES4326 (Fig. 4A). In addition, resistance to H. arabidopsidis Emwa1 mediated by RPP4, an R protein closely related to SNC1, is not affected by the mos1 mutations (Fig. 4B), suggesting that MOS1 may not be a general signaling regulator functioning downstream of snc1.
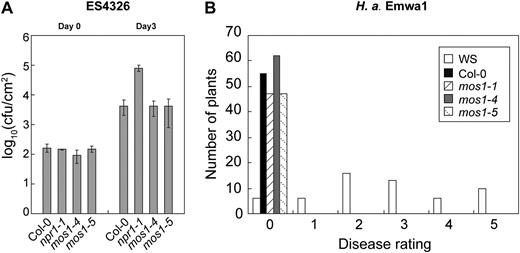
Analysis of pathogen resistance in mos1 single-mutant plants. A, Growth of P. syringae pv maculicola ES4326 in Col-0, npr1-1, mos1-4, and mos1-5 plants. The leaves of 4-week-old soil-grown plants were infiltrated with a suspension of the bacteria at OD600 = 0.0001. Leaf discs within the inoculated areas were taken 3 d after inoculation. Error bars represent sd from measurements of four independent samples. Each sample contained two leaf discs from two different infiltrated leaves on the same plant. cfu, Colony-forming units. B, Growth of H. arabidopsidis Emwa1 on Wassilewskija (WS), Col-0, mos1-1, mos1-4, and mos1-5 plants. Two-week-old seedlings were sprayed with Emwa1 spores at a conidiospore suspension concentration of 50,000 spores per mL of water. The infection was rated as follows on 20 plants 7 d after infection by counting the number of conidiophores per infected leaf: 0, no conidiophores on the plants; 1, no more than five conidiophores per infected leaf; 2, six to 20 conidiophores on a few of the infected leaves; 3, six to 20 conidiophores on most of the infected leaves; 4, five or more conidiophores on all infected leaves; 5, 20 or more conidiophores on all infected leaves.
We then tested whether mos1 mutations affect the expression of snc1 by comparing the expression levels of snc1 in mos1-1 snc1 npr1-1, mos1-2 snc1, mos1-3 snc1, snc1, snc1 npr1, and wild-type plants. As shown in Figure 5, snc1 expression is reduced about 3-fold in mos1-1 snc1 npr1-1, mos1-2 snc1, and mos1-3snc1 mutant plants compared to that in wild type, suggesting that MOS1 is required for maintaining proper expression levels of snc1. Reduction of SNC1 expression was also observed in the mos1 single mutants (Supplemental Fig. S3).
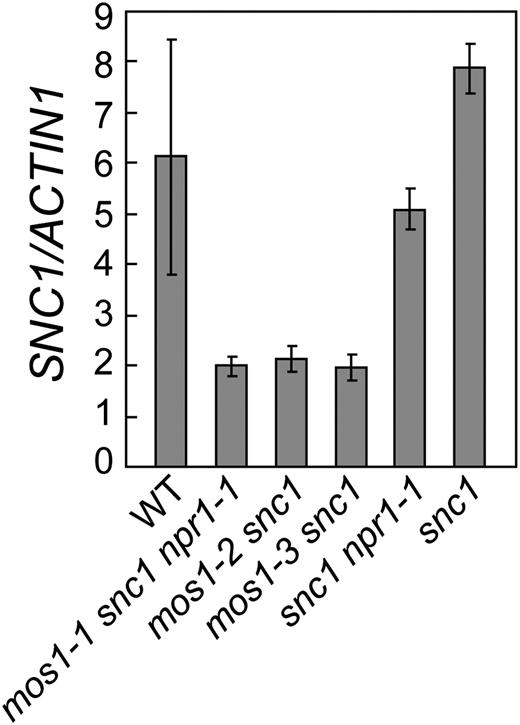
mos1 mutations suppress snc1 expression. SNC1/snc1 expression in wild type (WT), mos1-1 snc1 npr1-1, mos1-2 snc1, mos1-3 snc1, snc1 npr1-1, and snc1. Total RNA was extracted from 12-d-old seedlings grown on Murashige and Skoog medium. Relative expression levels of snc1 were determined by real-time PCR. Values were normalized to the expression of ACTIN1. Error bars represent sd from three measurements. The gene expression analysis was performed on three batches of independent grown plants. Similar results were obtained from different batches of plants and data shown are representatives from one of the experiments.
To determine whether mos1 mutations affect SNC1 expression in a locus-specific manner, we transformed a genomic clone (pSNC1::snc1) expressing the snc1 mutant gene under its own promoter into wild-type and mos1-2 snc1 plants (Zhang et al., 2003a). The size of the promoter fragment used is 1.8 kb. As shown in Table I, about 70% of transgenic plants in the wild-type background exhibited snc1-like morphology. A similar percentage of transgenic plants was found to display snc1-like morphology in the mos1-2 snc1 background (Fig. 6A). Similar results were obtained when snc1 was expressed under a 2.5-kb promoter fragment. These data suggest that mos1-2 is not able to suppress the expression of the snc1 transgene inserted elsewhere in the genome.
Percentage of transgenic plants expressing the snc1 transgene that exhibited snc1-like morphology
Summary of T1 Transgenic plants.
| Transgenic Type | Wild-Type Like | snc1 Like | Total |
| snc1 in wild type | 37 (37.8%) | 61 (62.2%) | 98 |
| snc1 in mos1-2 snc1 | 20 (37.0%) | 34 (63.0%) | 54 |
| Transgenic Type | Wild-Type Like | snc1 Like | Total |
| snc1 in wild type | 37 (37.8%) | 61 (62.2%) | 98 |
| snc1 in mos1-2 snc1 | 20 (37.0%) | 34 (63.0%) | 54 |
![Suppression of snc1 expression by mos1 is locus specific. A, Morphology of 5-week-old soil-grown plants of wild type (WT), mos1-2 snc1, a representative line of mos1-2 snc1 transformed with the snc1 genomic clone, and snc1. B, Morphology of 5-week-old soil-grown plants of wild type, mos1-3 snc1, the snc1::GFP line, mos1-3 snc1 with the snc1::GFP transgene, and snc1. C, PR1 expression in the indicated genotypes. Total RNA was extracted from 12-d-old seedlings grown on Murashige and Skoog medium. Relative expression levels of PR1 were determined by real-time PCR. Values were normalized to the expression of ACTIN1. Error bars represent sd from three measurements. The gene expression analysis was performed on three batches of independent grown plants. Similar results were obtained from different batches of plants and data shown are representatives from one of the experiments. [See online article for color version of this figure.]](https://oup.silverchair-cdn.com/oup/backfile/Content_public/Journal/plphys/153/3/10.1104_pp.110.156240/2/m_plphys_v153_3_1425_f6.jpeg?Expires=1750533040&Signature=EneTh~swqQofUuZvjMoKeflLWsbNBsmSFQtnXyoZ1glBhflIaapFGWeyXxAsnyF9oSYHP5K3-uji0HrRIdxHNwgQDhBX6xhYI4dw16Vp6NWVXLQn3dUqUJj4dZ1sT0pB96~MqA6zSHjJwpcF51l4~KQVwSxdZjcfN6qgdu~qpNzY8ueE2UAuS7lMtG4Ct-MCR1xLqXXxAPn4tewUMizjQagUToCtISCUqsY60CuD~wNaeDjwnJoKxtxM5oVHNdUVd087QGwJ2nfRQCiZjDmq4a-P6vyKUaa6ysmmS4FD5-3~zKlA5Xr65JfJJWWxEH8JzL8wM4fqKDYwWVIHPePHFg__&Key-Pair-Id=APKAIE5G5CRDK6RD3PGA)
Suppression of snc1 expression by mos1 is locus specific. A, Morphology of 5-week-old soil-grown plants of wild type (WT), mos1-2 snc1, a representative line of mos1-2 snc1 transformed with the snc1 genomic clone, and snc1. B, Morphology of 5-week-old soil-grown plants of wild type, mos1-3 snc1, the snc1::GFP line, mos1-3 snc1 with the snc1::GFP transgene, and snc1. C, PR1 expression in the indicated genotypes. Total RNA was extracted from 12-d-old seedlings grown on Murashige and Skoog medium. Relative expression levels of PR1 were determined by real-time PCR. Values were normalized to the expression of ACTIN1. Error bars represent sd from three measurements. The gene expression analysis was performed on three batches of independent grown plants. Similar results were obtained from different batches of plants and data shown are representatives from one of the experiments. [See online article for color version of this figure.]
To further confirm that expression of snc1 in transgenic plants does not require MOS1, we crossed the mos1-3 mutation into a transgenic line expressing the mutant snc1-GFP fusion protein under its own promoter. The expression level of the snc1-GFP transgene is comparable to that of the endogenous wild-type SNC1 (Supplemental Fig. S4). As shown in Figure 6B, the snc1-like morphology in the transgenic plants is not affected by the mos1-3 mutation. In addition, the expression levels of PR1 in the transgenic line are not altered by the mos1-3 (Fig. 6C). These data suggest that MOS1 regulates the expression of snc1 in a locus-specific manner, probably at the chromatin level.
ddm1 Releases the Repression of snc1 Expression in mos1-1 snc1 npr1 Plants
Arabidopsis ddm1 was originally identified in a screen for mutants with decreased cytosine methylation (Vongs et al., 1993). ddm1 mutations lead to reduced 5-methylcytosine levels throughout the genome. DDM1 encodes a SWI2/SNF2-like protein that most likely functions in chromatin remodeling (Jeddeloh et al., 1999) and it is required for maintenance of gene silencing in Arabidopsis (Jeddeloh et al., 1998). To test whether silencing of the snc1 locus caused by the loss of MOS1 function requires DDM1, we crossed mos1-1 snc1 npr1-1 with ddm1-8 (SALK_093009), an allele of ddm1 that contains a T-DNA insertion at the 3′ end of DDM1 (Supplemental Fig. S5A). RT-PCR analysis showed that the full-length cDNA of DDM1 was no longer expressed in the mutant (Supplemental Fig. S5B). Like other ddm1 alleles, ddm1-8 causes hypomethylation of the 180-bp centromere repeats in addition to the 5SRNA locus (Supplemental Fig. S5, C and D).
As shown in Figure 7A, ddm1-8 reverted mos1-1 snc1 npr1-1 back to snc1-like morphology. The snc1-like morphology was not caused by duplication of the snc1 locus like that in bal since no duplication of the locus was found in ddm1-8 mos1-1 snc1 (Supplemental Fig. S6). Constitutive expression of PR1 and PR2 and resistance to H. arabidopsidis Noco2 were also restored in ddm1-8 mos1-1 snc1 (Fig. 7, B–D). Real-time RT-PCR analysis showed that snc1 expression in ddm1-8 mos1-1 snc1 is reverted to the level in wild type (Fig. 7E), suggesting that ddm1 releases the silencing of the snc1 locus in mos1-1 snc1 npr1-1. These results indicate that MOS1 may be involved in regulating chromatin structure at the snc1 locus antagonistic to DDM1.
![ddm1 releases the repression of snc1 expression by mos1-1. A, Morphology of 5-week-old soil-grown plants of wild type (WT), ddm1-8, mos1-1 snc1 npr1-1, ddm1-8 mos1-1 snc1, and snc1 npr1-1. B and C, PR gene expression in wild type, ddm1-8, mos1-1 snc1 npr1-1, ddm1-8 mos1-1 snc1, snc1, and snc1 npr1-1. Total RNA was extracted from 12-d-old seedlings grown on Murashige and Skoog medium. Relative expression levels of PR1 (B) or PR2 (C) were determined by real-time PCR. Values were normalized to the expression of ACTIN1. Error bars represent sd from three measurements. D, Growth of H. arabidopsidis Noco2 on wild type, ddm1-8, mos1-1 snc1 npr1-1, ddm1-8 mos1-1 snc1, snc1, and snc1 npr1-1 plants. Twelve-day-old seedlings were sprayed with H. arabidopsidis Noco2 (5 × 10⁴ spores/mL). Infection was scored 7 d post inoculation by counting the number of conidia spores. Error bars represent sds from averages of three measurements. Statistical differences among the samples are labeled with different letters (P < 0.01). E, SNC1/snc1 expression in wild type, ddm1-8, mos1-1 snc1 npr1-1, ddm1-8 mos1-1 snc1, snc1, and snc1 npr1-1 plants. Total RNA was extracted from 12-d-old seedlings grown on Murashige and Skoog medium. Relative expression levels of SNC1/snc1 were determined by real-time PCR. Values were normalized to the expression of ACTIN1. Error bars represent sd from three measurements. All gene expression analysis was performed on three batches of independent grown plants. Similar results were obtained from different batches of plants and data shown are representatives from one of the experiments. [See online article for color version of this figure.]](https://oup.silverchair-cdn.com/oup/backfile/Content_public/Journal/plphys/153/3/10.1104_pp.110.156240/2/m_plphys_v153_3_1425_f7.jpeg?Expires=1750533040&Signature=UDh5SuQWN22P7hIcvZs5VilsM7ERiQFLXqnkfhsNfVGR2TPSkbpViYOiW1Y26jefZU7os3GN7LStzo03RW5IhcMzeKw5Dz0Mcg4aUFp3kdyuedj3WYpVEEfZeI23K0quYpr5CCDAWSchWdmPZrzB-KEHf3c-jZliAeik58NChIa~TQvD67lLDgl7MgqEM~QwCXViFWb5rduK~8PxQdIxkZCS7Pq0YZ4q9frx~gT5zbz2D4uRijCCVKnKT3SIkThniW96PuXkX9yvIzDDYVMa-ZHgU1WFAsCotNzyVBwCD4HLOfFNcJ~d1gk-i6xyO3LLNshK0wQvOYbGmQZMYhiBEw__&Key-Pair-Id=APKAIE5G5CRDK6RD3PGA)
ddm1 releases the repression of snc1 expression by mos1-1. A, Morphology of 5-week-old soil-grown plants of wild type (WT), ddm1-8, mos1-1 snc1 npr1-1, ddm1-8 mos1-1 snc1, and snc1 npr1-1. B and C, PR gene expression in wild type, ddm1-8, mos1-1 snc1 npr1-1, ddm1-8 mos1-1 snc1, snc1, and snc1 npr1-1. Total RNA was extracted from 12-d-old seedlings grown on Murashige and Skoog medium. Relative expression levels of PR1 (B) or PR2 (C) were determined by real-time PCR. Values were normalized to the expression of ACTIN1. Error bars represent sd from three measurements. D, Growth of H. arabidopsidis Noco2 on wild type, ddm1-8, mos1-1 snc1 npr1-1, ddm1-8 mos1-1 snc1, snc1, and snc1 npr1-1 plants. Twelve-day-old seedlings were sprayed with H. arabidopsidis Noco2 (5 × 10⁴ spores/mL). Infection was scored 7 d post inoculation by counting the number of conidia spores. Error bars represent sds from averages of three measurements. Statistical differences among the samples are labeled with different letters (P < 0.01). E, SNC1/snc1 expression in wild type, ddm1-8, mos1-1 snc1 npr1-1, ddm1-8 mos1-1 snc1, snc1, and snc1 npr1-1 plants. Total RNA was extracted from 12-d-old seedlings grown on Murashige and Skoog medium. Relative expression levels of SNC1/snc1 were determined by real-time PCR. Values were normalized to the expression of ACTIN1. Error bars represent sd from three measurements. All gene expression analysis was performed on three batches of independent grown plants. Similar results were obtained from different batches of plants and data shown are representatives from one of the experiments. [See online article for color version of this figure.]
mos1 Alters Methylation of DNA Upstream of SNC1
As DDM1 functions as a putative chromatin remodeling factor and loss of DDM1 function results in reduced DNA methylation, alteration of chromatin structure may cause changes in DNA methylation. To determine whether methylation of DNA upstream of SNC1 is altered in mos1 mutant plants, bisulfite conversion sequencing was performed on the regions upstream of SNC1. We only detected DNA methylation in a region about 3 kb away from the coding region of SNC1 (Supplemental Fig. S7). The methylation levels in various genotypes are shown in Figure 8. mCG level decreased dramatically in the first three CG sites in snc1, compared to that in wild-type plants. The mos1-1 mutation has no obvious effect on CG methylation at these sites (Fig. 8A). Interestingly, methylation levels at two of the eight CNG sites are clearly increased in snc1 plants and reduced in mos1-1 snc1 npr1 and mos1-1 snc1 mutants (Fig. 8B). The difference in methylation at the CHH sites is even more dramatic. As shown in Figure 8C, methylation levels at seven of the 10 CHH sites are increased in snc1 plants and reduced close to wild-type levels in mos1 - 1 snc1 npr1 and mos1-1 snc1 mutants. These data further support that MOS1 is involved in the regulation of the chromatin structure and DNA methylation at the SNC1 locus.
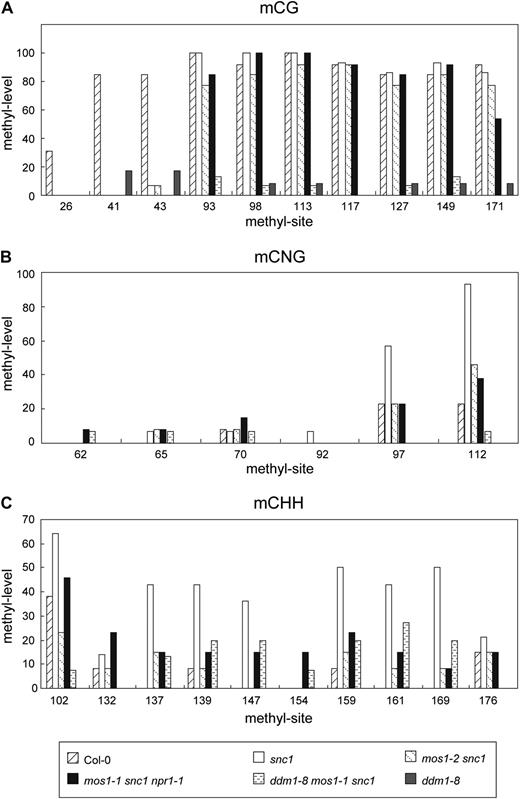
DNA methylation levels of a region upstream of SNC1. Bisulfite conversion sequencing results of mCG (A), mCNG (B), and mCHH (C) in wild type, snc1, mos1-2 snc1, mos1-1 snc1 npr1-1, ddm1-8 mos1-1 snc1, and ddm1-8 mutant plants. The sequenced region is about 3 kb upstream of the ATG of SNC1. N represents any base. H represents any base except for G. The unconverted original sequence and the position of different methyl sites are shown in Supplemental Figure S7.
DISCUSSION
Here we report that MOS1 regulates snc1-mediated resistance responses by fine-tuning SNC1 expression. Several lines of evidence suggest that MOS1 regulates the SNC1 locus at chromatin level. First, mos1 mutations reduce the expression of endogenous snc1 but not the snc1 transgene under its own promoter, indicating that MOS1 regulates the expression of snc1 in a locus-specific manner. Second, suppression of snc1 expression in the mos1 mutant plants can be reversed by knocking out the known epigenetic regulator DDM1, which functions in chromatin remodeling and DNA methylation (Vongs et al., 1993). Finally, mos1 mutations result in alterations of DNA methylation in a region upstream of SNC1.
MOS1 encodes a large protein with a BAT2 domain at its N terminus. BAT2 domains are found in large proteins with similar features from many plant and animal species. The BAT2 domain is found at the N terminus, and the rest of the protein consists of mainly hydrophilic residues. None of these proteins have previously been functionally characterized. Our studies on MOS1 suggest that this family of proteins may function in regulating gene expression at the chromatin level. In the mos1 mutants, the expression of RPP4, a resistance gene next to SNC1, was also modestly reduced (Supplemental Fig. S8). This is consistent with the previous report that genes in the RPP4 cluster are coordinately regulated at the transcription level (Yi and Richards, 2007). In addition to loss of snc1-mediated immune responses, the mos1 mutant plants also displayed late-flowering phenotype (Supplemental Fig. S9), suggesting that MOS1 also regulates gene expression at other loci.
In the mos1 mutants, alteration of DNA methylation was observed in a region upstream of SNC1. Because no obvious correlation was found between the observed methylation changes and the reduced expression levels of snc1, reduction of snc1 expression was not caused by these methylation changes. Since BAT2 domain-containing proteins similar to MOS1 are present in a wide range of eukaryotes including species with no DNA methylation such as Caenorhabditis elegans, MOS1 may not function on DNA methylation directly. Rather, MOS1 probably functions as a regulator of chromatin structure, and the silencing of SNC1 in mos1 mutants is probably caused by changes in the chromatin structure around the SNC1 locus. The alteration of DNA methylation may also be a result of chromatin structure change. Interestingly, we also observed methylation differences in some of the sites between wild type and snc1. It is unclear how these changes arose.
In ddm1 mutant plants, the expression of SNC1 is comparable to that in the wild-type plants, suggesting that ddm1 mutations do not directly cause up-regulation of the SNC1 locus. Interestingly, the suppression of snc1 expression in mos1 mutant plants was reversed by knocking out the function of DDM1, suggesting that MOS1 and DDM1 function antagonistically to fine-tune the expression of SNC1 at the chromatin level. It remains to be determined whether regulation of R gene expression at chromatin level is a common phenomenon.
MATERIALS AND METHODS
Mutant Screen and Characterization
All plants were grown under 16 h light at 23°C and 8 h dark at 20°C. mos1-1 snc1 npr1 was identified from a fast neutron-treated snc1 npr1 mutant population while mos1-2 snc1 was identified from a fast neutron-treated snc1 mutant population as previously described (Zhang et al., 2003a). mos1-3 was isolated from T2 plants of a T-DNA population consisting of approximately 60,000 independent T1 transgenic lines generated by transforming snc1 with pSKi015 (Weigel et al., 2000). The T-DNA insertion site in mos1-3 was identified by inverse PCR.
Seeds of mos1-4 (salk_126709), mos1-5 (salk_074876), and ddm1-8 (salk_093009) were obtained from the Arabidopsis Biological Resource Center. Homozygous plants were identified by PCR using primers flanking the insertion. ddm1 mos1-1 snc1 triple mutant was generated by crossing ddm1-8 with mos1-1 snc1-1 npr1 and genotyping the F2 population. The primers used to identify the mos1-1 mutation are MOS1-WT (5′-gttattgcttgagacaccttc-3′) and 43950R (5′-aaggcaatgatgcttggcag-3′).
Infection of Hyaloperonospora arabidopsidis Noco2 was performed on 2-week-old seedlings by spraying with a H. arabidopsidis Noco2 spore suspension at a concentration of 5 × 10⁴ spores per mL of water. The plants were kept at 18°C in 12-h light/12-h dark cycles with 95% humidity, and the infection was scored 7 d after inoculation by counting the number of conidiaspores per gram of leaf tissue using a hemocytometer.
For gene expression analysis, RNA was extracted from 12-d-old seedlings grown on Murashige and Skoog medium at 23°C under 16-h light/8-h dark cycles using Takara RNAiso reagent. RT was carried out using the M-MLV RTase cDNA synthesis kit from Takara. Real-time PCR was performed using the SYBR Premix Ex (Takara). All expression analysis was performed on three batches of independent grown plants. The primers used for amplification of Actin1, PR1, and PR2 were described previously (Zhang et al., 2003a, 2003b). The primers for amplification of SNC1 are SNC1-F (5′-gaatcgaatgtctctatctgc-3′) and SNC1-R (5′-ctgtaaagtcggcgagctca-3′). SA was extracted and measured using a previously described procedure (Li et al., 1999).
Map-Based Cloning of mos1
Mapping markers were designed based on the Monsanto Arabidopsis (Arabidopsis thaliana) polymorphism and Landsberg sequence collections (Jander et al., 2002). Marker primers used for PCR include T13J8, 5′-ttataagctcccttgtagtga-3′ and 5′-agtaagatctatgtgacttgg-3′; F16G20, 5′-caaaggcatgtacgtagttgca-3′ and 5′-cttattttttggcgtgctagttac-3′; F6I7, 5′-agcacgatcgtaagcactcc-3′ and 5′-agatgactgtcgacttgcca-3′; and F22K18, 5′-tcacggagcaaaagctcgca-3′ and 5′-cataactggaggtggtgttg-3′. Markers T13J8 and F16G20 are based on Indel polymorphisms. The polymorphisms between Col-0 and Ler for markers F6I7 and F22K18 were detected by restriction digestion of the PCR fragments with SalI and MboII, respectively.
Bisulfite Sequencing
Genomic DNA was extracted from 30-d-old seedlings using DNeasy plant mini kit (Qiagen catalog no. 69104). Bisulfite treatment of genomic DNA was performed using a DNA modification kit following the manufacturer's instructions (Chemicon catalog no. S7820). The primers (5′-TAAGGATATAGGTTTGAATAATGAT-3′ and 5′-TTACACTAAAAAATAAACCTCATAAATAAT-3′) used to amply DNA fragments after bisulfate treatment were designed using MethPrimer (http://www.urogene.org/methprimer/index1.html). PCR fragments amplified from the bisulfite-treated DNA were cloned into pGEM-T easy vector (Promega).
Sequence data from this article can be found in the GenBank/EMBL data libraries under accession number HM208348.
Supplemental Data
The following materials are available in the online version of this article.
Supplemental Figure S1. Expression of MOS1 in mos1-4, mos1-5, and wild-type plants.
Supplemental Figure S2. Western-blot analysis of recombinant MOS1 protein using an anti-MOS1 antibody.
Supplemental Figure S3. SNC1 expression in Col-0, mos1-1, mos1-4, and mos1-5.
Supplemental Figure S4. SNC1 expression in Col-0 wild type and the snc1-GFP transgenic line in wild-type background.
Supplemental Figure S5. Characterization of ddm1-8.
Supplemental Figure S6. Analysis of snc1 copy numbers in the wild type and ddm1-8 mos1-1 snc1.
Supplemental Figure S7. Alignment of the bisulfite converted sequences of a region about 3 kb upstream of SNC1.
Supplemental Figure S8. RPP4 expression in Col-0, mos1-1, mos1-4, and mos1-5.
Supplemental Figure S9. Mutations in MOS1 lead to a late-flowering phenotype in Arabidopsis.
ACKNOWLEDGMENTS
We thank the Arabidopsis Biological Resource Center for the T-DNA mutant ddm1-8 and Dr. Eric Richards for plasmids containing the 180-bp centromere repeats and 5S rDNA. We greatly appreciate Ms. Dongling Bi and Ms. Yu Ti Cheng for technical assistance, and Ms. Jacqueline Monaghan for critical reading of the manuscript.
LITERATURE CITED
Author notes
This work was supported by fundings from the Chinese Ministry of Science and Technology (to Y.Z.) and the Natural Sciences and Engineering Research Council of Canada (to X.L.).
Corresponding author; e-mail [email protected].
The author responsible for distribution of materials integral to the findings presented in this article in accordance with the policy described in the Instructions for Authors (www.plantphysiol.org) is: Yuelin Zhang ([email protected]).
Some figures in this article are displayed in color online but in black and white in the print edition.
The online version of this article contains Web-only data.
Open Access articles can be viewed online without a subscription.
