


Abstract
Transcriptome profiling has become a routine tool in biology. For Arabidopsis (Arabidopsis thaliana), the Affymetrix ATH1 expression array is most commonly used, but it lacks about one-third of all annotated genes present in the reference strain. An alternative are tiling arrays, but previous designs have not allowed the simultaneous analysis of both strands on a single array. We introduce AGRONOMICS1, a new Affymetrix Arabidopsis microarray that contains the complete paths of both genome strands, with on average one 25mer probe per 35-bp genome sequence window. In addition, the new AGRONOMICS1 array contains all perfect match probes from the original ATH1 array, allowing for seamless integration of the very large existing ATH1 knowledge base. The AGRONOMICS1 array can be used for diverse functional genomics applications such as reliable expression profiling of more than 30,000 genes, detection of alternative splicing, and chromatin immunoprecipitation coupled to microarrays (ChIP-chip). Here, we describe the design of the array and compare its performance with that of the ATH1 array. We find results from both microarrays to be of similar quality, but AGRONOMICS1 arrays yield robust expression information for many more genes, as expected. Analysis of the ATH1 probes on AGRONOMICS1 arrays produces results that closely mirror those of ATH1 arrays. Finally, the AGRONOMICS1 array is shown to be useful for ChIP-chip experiments. We show that heterochromatic H3K9me2 is strongly confined to the gene body of target genes in euchromatic chromosome regions, suggesting that spreading of heterochromatin is limited outside of pericentromeric regions.
Microarrays have revolutionized experimental biology and are an essential source of data for systems biology approaches. While the first microarrays for plant research were developed only 10 years ago, they already have become routine tools for model and crop plants such as Arabidopsis (Arabidopsis thaliana), poplar (Populus spp.), rice (Oryza sativa), and barley (Hordeum vulgare; Hilson et al., 2004; Redman et al., 2004; Ma et al., 2005; Galbraith, 2006; Busch and Lohmann, 2007; Hennig, 2007). Initially, microarrays were mainly used for profiling transcriptomes, but now they support a large range of other applications as well: from genome resequencing (Clark et al., 2007a), transcript discovery and transcript mapping (Yamada et al., 2003; Stolc et al., 2005; Li et al., 2007; Laubinger et al., 2008), to identification of parental sequence contributions to recombinant inbred lines, genetic mapping and profiling of DNA methylation (DIP-chip), histone modifications and transcription factor binding sites (chromatin immunoprecipitation coupled to microarrays [ChIP-chip]) flourish as well (Borevitz et al., 2003; Gong et al., 2004; Lippman et al., 2004; Hazen et al., 2005; Werner et al., 2005; Singer et al., 2006; Thibaud-Nissen et al., 2006; Zhang et al., 2006; Li et al., 2008). While dedicated microarrays for transcript profiling contain probes directed against transcribed sequences based on annotated gene models, microarrays for molecular mapping or DIP/ChIP-chip often contain probes for the entire genome (tiling arrays). For Arabidopsis research, several commercial and community microarray platforms are available, and the Affymetrix, Agilent, Complete Arabidopsis Transcriptome MicroArray (CATMA), and NimbleGen arrays are most widely used. Affymetrix distributes arrays for transcript profiling (ATH1) and tiling arrays (Arabidopsis Tiling 1.0R) composed of 440k and 6.4M (35-bp spacing) 25mer probes, respectively. Agilent distributes arrays for transcript profiling and tiling arrays composed of 44k and 244k (212-bp spacing) 60mer probes, respectively. NimbleGen distributes arrays for transcript profiling and tiling arrays composed of 135k 60mer probes and 3 × 385k (90-bp spacing) 50mer probes. The CATMA community project developed spotted microarrays containing more than 30,000 gene-specific sequence tags of 150 to 500 bp (Sclep et al., 2007). Although microarray data can be noisy and have platform-specific components, comparisons have shown that results are mostly consistent across platforms (Hennig et al., 2003; Allemeersch et al., 2005).
Among the various microarrays available for Arabidopsis transcriptome profiling, Affymetrix ATH1 arrays are most widely used (Redman et al., 2004). The online data warehouse Genevestigator, for instance, has the results from more than 4,300 hybridizations to ATH1 arrays (Zimmermann et al., 2005). However, ATH1 as well as other microarrays for transcript profiling probe only about two-thirds of the annotated genes in the Arabidopsis reference genome. In addition, testing correlation between chromatin states and expression often requires the use of two different microarrays. We sought to develop a new tiling microarray for Arabidopsis research that enables the measurement of transcript levels for most annotated genes and for genes yet to be discovered and that can be used for both gene expression and chromatin state profiling. Because existing Arabidopsis tiling arrays cover only one strand of the genome, this makes it impossible to obtain strand-specific information on transcription units with a single array per sample. Here, we describe the AGRONOMICS1 Affymetrix tiling array and provide benchmark comparisons with the ATH1 array. We find that the AGRONOMICS1 array yields very similar results to the ATH1 array in expression profiling experiments while providing information for many more genes and being compatible with ChIP-chip analysis.
RESULTS
Design of the New AGRONOMICS1 Array
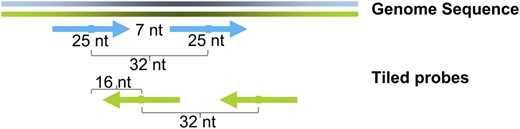
Design features of the AGRONOMICS1 array. Tiled probes form two paths, one for each strand. The average distance between adjacent probes on the same strand is 32 nucleotides (nt). Because most probes are 25 oligomers, the average gap between probes per path is seven nucleotides. The average distance between adjacent probes on opposite strands is 16 nucleotides.
The Affymetrix Arabidopsis genome tiling array 1.0R contains PM and mismatch probes. Because oligonucleotide microarray data can be analyzed robustly based on PM probes only (Irizarry et al., 2003), mismatch probes were not included in the AGRONOMICS1 array design. This made space available to tile both genome strands. In total, the new array contains 152,065 control probes (528 Arabidopsis, 1,665 bacterial, 115,612 human, and 34,260 technical probes), 5,894,089 Arabidopsis tiling probes (2,947,412 on the plus strand and 2,946,677 on the minus strand), and 250,103 PM probes from ATH1 arrays.
Custom CDF Files for Quantitative Transcriptome Profiling
For expression analyses, we first determined the unambiguous genome location and strand of 5,518,300 oligonucleotide probes, excluding those with more than one PM of length 19 nucleotides or greater or imperfect match (1-bp mismatch or insertion/deletion) of length 23 nucleotides or greater with the reference genome. After mapping the remaining probes onto gene models annotated in TAIR 8, we retained 923,491 probes that were entirely contained in annotated exons and matched the genomic strand of the corresponding gene. Furthermore, 401,066 probes from the ATH1 array matched the genomic strand in annotated exons on the AGRONOMICS1 array. Together, 1,324,557 AGRONOMICS1 probes could be used for transcription analysis of 31,084 annotated genes. Although the analyses in this work were done with TAIR 8-based CDF files (agronomics1_TAIR8_ATH1.cdf and agronomics1_TAIR8_gene.cdf), we also assembled CDF files based on the latest TAIR 9 Arabidopsis genome annotation (Table I
Properties of custom-made CDF files for AGRONOMICS1 arrays
CDF File | Genome Version | No. of Probes (atha + Control Probes) | No. of Probe Sets (ath + Control Probe Sets) | No. of Genes (Transcripts) | Description |
|---|---|---|---|---|---|
| agronomics1_ath1 | TIGR2b (2001) | 286,999 (250,103 + 36,896) | 22,911 (22,746 + 165) | 22,746 (n.a.c) | Gene-specific probe sets of PM probes from ATH1 |
| agronomics1_ ath1probes | TAIR 8 (2008) | 401,066 (248,398 + 152,668) | 22,962 (22,591 + 371) | 22,591 (n.a.) | Gene-specific probe sets of PM probes from ATH1 |
| agronomics1_ allprobes | TAIR 8 (2008) | 1,477,225 (1,324,557 + 152,668) | 31,455 (31,084 + 371) | 31,084 (n.a.) | Gene-specific probe sets of all suitable probes |
| agronomics1_ TAIR9_gene | TAIR 9 (2009) | 1,246,484 (1,093,816 + 152,668) | 30,608 (30,237 + 371) | 29,920 (30,237) | Gene-specific probe sets of all suitable probes, but only probes common to all annotated transcripts |
| agronomics1_ TAIR9_exon | TAIR 9 (2009) | 1,562,358 (1,409,690 + 152,668) | 116,199 (115,828 + 371) | 29,510 (35,528) | Exon-specific probe sets of all suitable probes |
ath probes are probes against Arabidopsis sequences.
TIGR, The Institute for Genomic Research.
n.a., Not applicable.
After the first hybridizations on the AGRONOMICS1 arrays (see below), we observed that some probes performed very poorly (Supplemental Fig. S1A). Such probes had very low signal or indicated no expression change, even if all other probes for that gene or exon had reliable and covarying signals. This is not unexpected, because the probes on the tiling array are restricted to fixed windows along the chromosome, the sequences of which may not contain a 25mer oligonucleotide with optimal hybridization properties. Location restriction is typically less constraining for dedicated gene expression arrays; consequently, there were no ATH1-derived poorly performing probes.
When computing Robust Multichip Average (RMA) probe set summaries, poorly performing probes were excluded. Flagging of poorly performing probes was done with the following algorithm. (1) Flag all probes with a signal below 32 (=25) in all samples. (2) If there are fewer than three probes per probe set left, repeatedly unflag the flagged probe with the highest mean signal until there are three unflagged probes. (3) Remove the flagged probes from the probe sets.
Technically, flagged probes were removed in memory from the loaded CDF. When this algorithm was applied to our data set of 12 hybridizations of dark-grown and light-treated seedling, leaf, and flower samples (TSU_2 data set), 101,533 (7.7%) of the 1.32 Mio probes were flagged. Note that this data-driven algorithm will exclude different probes in other data sets. An implementation of the algorithm in R is available as Supplemental Data S1.
The distribution of the number of probes per probe set of the TSU_2 data set before and after filtering is shown in Supplemental Figure S2. Probe filtering reduced the median probe number per probe set from 39 to 36; thus, even after filtering, the majority of probe sets contained many more probes than the 11 PM probes per probe set on the ATH1 array.
To estimate background hybridization, a control CDF file was generated using probes that were randomly selected from the human control probes, which do not have any matches in the Arabidopsis genome. RMA signals based on this control CDF were used to construct null distributions of RMA signals for each sample, and detection P values were calculated for each Arabidopsis gene probe set. Signals were considered as “detected” (i.e. above background) at P ≤ 0.05. With this definition, the detection call indicates whether a transcript was detected above background on the array; note that a detection call “not detected” does not imply that the gene was not transcribed. We tested the presence of transcripts corresponding to 10 probe sets with detection P values between 0.04 and 0.05 (i.e. at the border of the used threshold for the detection call) by reverse transcription-PCR (Supplemental Fig. S3). Transcripts were identified for all 10 genes, suggesting that most of the probe sets with significant detection calls correspond to transcribed genes. It is likely that many probe sets with nonsignificant detection calls correspond to transcribed genes as well but that these transcripts escaped detection by the microarray due to limits in sensitivity.
In summary, 31,084 TAIR 8 genes (29,920 TAIR 9 genes) are represented on the AGRONOMICS1 array by at least three probes (more than 90% of the annotated genes). Similarly, the Affymetrix Arabidopsis genome tiling array 1.0R was used to measure expression of 30,228 TAIR 8 genes (Laubinger et al., 2008). Thus, the AGRONOMICS1 array measured gene expression of an additional 7,646 TAIR9 genes not covered by the ATH1 platform.
Labeling and Hybridization Protocols
To establish robust wet-lab procedures for processing the AGRONOMICS1 arrays, we compared three different commercial labeling protocols: the WT Ovation Pico System (NuGEN), the GeneChip One-Cycle cDNA Synthesis kit, and the GeneChip 3′ IVT Express kit (Affymetrix). We used RNA samples from leaves and flowers, respectively. Labeling and hybridization were performed as technical triplicates (TSU_1 data set). The standard Affymetrix hybridization and washing protocol FS450_0004 proved to work well with the AGRONOMICS1 arrays (see “Materials and Methods”).
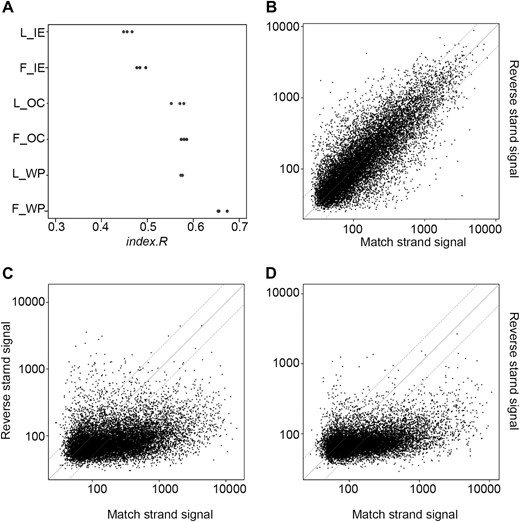
Comparison of RNA amplification and labeling methods. A, Two batches of RNA (flower and leaf) were used for amplification and labeling as technical replicates with the WT Ovation Pico System, the GeneChip One-Cycle cDNA Synthesis kit, and the GeneChip 3′ IVT Express kit. Pair-wise correlation of background-corrected and quantile-normalized probe signals was calculated within each set of triplicates. Correlation was expressed as index.R value (Kim et al., 2004). F and L represent data from flower and leaf RNA, respectively. WP, OC, and IE represent WT Ovation Pico System, One-Cycle cDNA Synthesis kit, and 3′ IVT Express kit, respectively. B to D, Correlation of signals from probes on the match strand and corresponding probes from the reverse strand for chromosome IV and flower RNA using WT Ovation Pico System (B), One-Cycle cDNA Synthesis kit (C), and 3′ IVT Express kit (D).
Next, we tested which labeling procedure would maximize strand-specific results. Probes in similar regions on sense and antisense strands gave strongly correlated signals for the WT Ovation Pico System (Fig. 2B), making it impossible to reliably identify the transcribed strand. In contrast, no or only very weak correlation was found for the GeneChip One-Cycle cDNA Synthesis and GeneChip 3′ IVT Express kits (Fig. 2, C and D). It has been proposed that inclusion of actinomycin D in the reverse transcription reaction could increase strand specificity in microarray experiments (Perocchi et al., 2007), but under our settings, actinomycin D had no effect on strand specificity (data not shown). We conclude that both GeneChip One-Cycle cDNA Synthesis and GeneChip 3′ IVT Express kits provide acceptable strand specificity.
Finally, we compared the sensitivity of the three labeling kits for transcript detection. We used custom CDF files and RMA (Irizarry et al., 2003) to calculate probe set summaries and detection calls (see above). The WT Ovation Pico System resulted in more significant detection calls than the One-Cycle cDNA Synthesis and the 3′ IVT Express kits (Table II
Number of detected transcripts and correlation of probe set summary signals
Mean and sd are listed for three technical replicates. Correlation was expressed as index.R value (Kim et al., 2004) and as pair-wise Pearson correlation coefficient. n.a., Not applicable.
Variable | WT Ovation Pico System | One-Cycle cDNA Synthesis | 3′ IVT Express | One-Cycle cDNA Synthesis Versus 3′ IVT Express |
|---|---|---|---|---|
| Transcript no. | ||||
| Leaves | 18,042 ± 263 | 13,619 ± 598 | 13,472 ± 373 | n.a. |
| Flowers | 22,138 ± 433 | 16,457 ± 225 | 17,592 ± 400 | n.a. |
| index.R | ||||
| Leaves | 0.882 ± 0.005 | 0.914 ± 0.006 | 0.870 ± 0.004 | 0.860 ± 0.006 |
| Flowers | 0.919 ± 0.002 | 0.935 ± 0.004 | 0.906 ± 0.004 | 0.886 ± 0.002 |
| Pearson correlation | ||||
| Leaves | 0.988 ± 0.001 | 0.993 ± 0.001 | 0.986 ± 0.001 | 0.982 ± 0.002 |
| Flowers | 0.993 ± 0.001 | 0.996 ± 0.001 | 0.991 ± 0.001 | 0.987 ± 0.001 |
The One-Cycle cDNA Synthesis and 3′ IVT Express kits are oligo(dT) primed and could result in a 3′:5′ bias. Although the expression signals had some 3′ bias (Supplemental Fig. S4, A and B), this affected the fold changes of only a minor set of genes (Supplemental Fig. S4C). Thus, for comparative analyses, oligo(dT)-primed amplification and labeling methods can be used with AGRONOMICS1 arrays. Nevertheless, other labeling kits can probably be used with AGRONOMICS1 arrays as well. In summary, the three tested labeling procedures each had their specific strengths and weaknesses. Because strand specificity is crucial for transcript profiling, we concluded that both the One-Cycle cDNA Synthesis and 3′ IVT Express kits are most appropriate for transcript profiling with AGRONOMICS1 arrays.
AGRONOMICS1 and ATH1 Arrays Yield Very Similar Expression Signals Present on Both Platforms
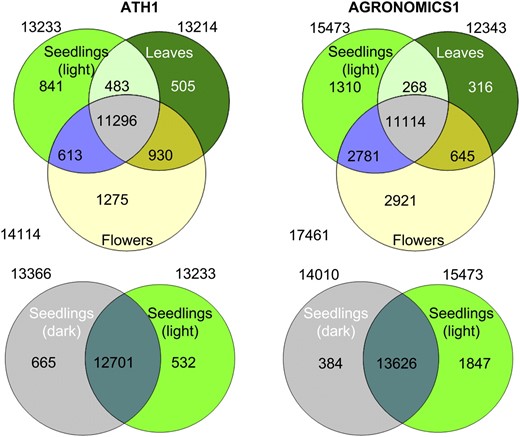
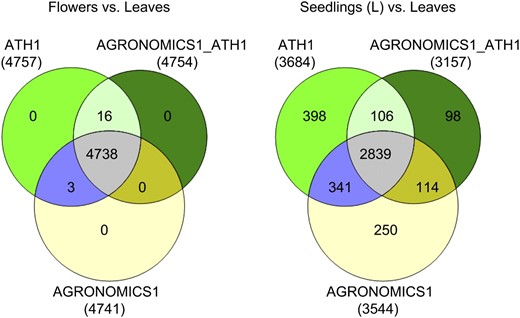
Comparison of transcript detection with ATH1 and AGRONOMICS1 arrays. Transcripts were counted if they were detected in all three biological replicates of a tissue. Tissues were dark-grown seedlings (gray), light-treated seedlings (light green), leaves (dark green), and flowers (yellow). Note that the numbers given in the text relate to overlaps between all four tissues and thus differ from the numbers here.
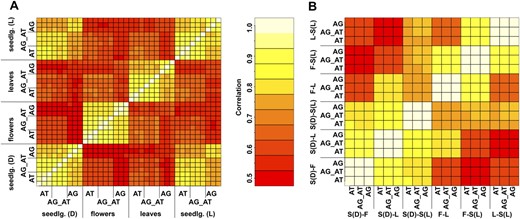
Correlation of probe set summary values (A) and fold changes (B). A, RMA-based probe set summaries for the gene probes on ATH1 (AT) and AGRONOMICS1 (AG_AT and AG) arrays were used, and pair-wise correlations (index.R) were calculated. For AGRONOMICS1 arrays, either only the ATH1 probes (AG_AT) or all probes (AG) were used. B, Log-transformed ratios of the means over the three replicates were used to calculate correlation coefficients. S(D), S(L), F, and L represent dark-grown and light-treated seedlings, flowers, and leaves, respectively. S(D)-F represents the comparison of dark-grown seedlings and flowers.
Together, detection calls and probe set summary signals on ATH1 and AGRONOMICS1 arrays were very similar for the transcripts represented on both platforms, and signals were most similar when only the ATH1 probes on the AGRONOMICS1 array were used.
AGRONOMICS1 and ATH1 Arrays Yield Nearly Identical Expression Fold Changes for the Commonly Probed Genes
Comparison of detection of differentially expressed genes on ATH1 and AGRONOMICS1 arrays. Transcripts were counted if differences were significant at the 0.05 level and fold changes were at least 1.5.
In summary, fold changes based on signals from ATH1 and AGRONOMICS1 arrays and sets of differentially expressed genes were comparable for the commonly probed transcripts. Our results indicate that differential expression can be compared between the new AGRONOMICS1 and the older ATH1 arrays.
AGRONOMICS1 Arrays Generate Novel Hypotheses for Functional Genomics Studies
Data analysis including all useful probes provided information about the transcription of many annotated genes not represented in the ATH1 array. Seventy, 36, 35, and 430 of these genes had expression signals that were at least 4-fold higher in the dark-grown seedlings, light-treated seedlings, leaves, and flowers, respectively, than in any of the other tissues (Supplemental Tables S1–S4). The genes specific to dark-grown seedlings include, among others, a set of four ROTUNDIFOLIA-like genes, seven DNA-binding protein/transcription factor genes (e.g. PHYTOCHROME-INTERACTING FACTOR3-LIKE1, which previously has been reported to be rapidly light repressed; Khanna et al., 2006; Roig-Villanova et al., 2006), 29 unknown genes (41%), and, notably, six transposable element-like genes. The latter are of potential interest because proteins with similarity to Mutator family transposase were described to function in the deetiolation response and to be repressed by light (Hudson et al., 2003). In addition, a pyruvate decarboxylase gene is specifically expressed in dark-grown seedlings. Pyruvate decarboxylase is required for pollen tube elongation growth in Petunia, possibly in a novel metabolic pathway that bypasses pyruvate dehydrogenase for high rates of lipid generation under certain conditions (Gass et al., 2005). Although this pathway was previously suggested to be specific to pollen tubes, it is possible that rapid hypocotyl elongation growth of dark-grown seedlings relies on the same pathway to generate lipids for cell membranes. The genes specific to light-treated seedlings, to leaves, and to flowers include, among others, 17 (46%), 10 (29%), and 17 (40%) unknown genes, respectively. In addition, the genes specific to flowers encode several potential extracellular peptide/protein signals, such as 16 low-molecular-weight Cys-rich proteins and six rapid alkalinization factor-like proteins. Flower-specific expression of potential peptide signaling components was observed before (Hennig et al., 2004), and peptide signaling appears to be important during plant reproductive development (Kachroo et al., 2001; Takayama et al., 2001; Okuda et al., 2009).
These observations demonstrate the power of AGRONOMICS1 arrays to yield specific genome-wide transcription profiles and to generate novel hypotheses for functional genomics studies.
Detection of Exon-Specific Expression and Alternative Splicing
To measure exon-specific expression and detect alternative splicing events, exon-specific probe sets were defined. After mapping all probes to the TAIR 9 genome release, an exon-specific CDF file was constructed that contains probe sets of at least three probes for 108,215 of the 164,379 exons annotated in TAIR 9. The exon probe sets cover 20,019 genes with more than one exon-specific probe set per gene.
The CDF file was used to screen for alternative splicing events between flowers and dark-grown seedlings. After computing the splicing index (Clark et al., 2007b), 623 genes with a splicing index above 1 or below ™1 were found. For example, five exons of gene AT1G31120 had higher signals in seedlings than in flowers, but the remaining exon (exon 2) had lower signals in seedlings than in flowers (Supplemental Fig. S6). This suggests that an exon-skipping event occurs in seedlings. In gene AT1G32120, the exons showed an inconsistent behavior: the first two exons had higher signals in flowers, while the last two exons had higher signals in seedlings. Additional experiments will be required to establish the biological relevance of these findings.
In summary, the high density of tiling probes makes AGRONOMICS1 arrays useful for the detection of alternative splicing and differential transcripts.
ChIP-Chip Analysis with AGRONOMICS1
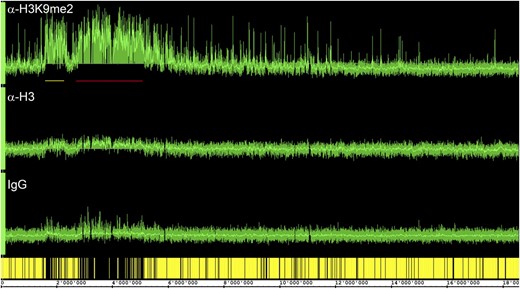
ChIP-chip profile over chromosome IV. Traces show results from anti-H3K9me2, anti-H3, and unspecific IgG antibodies. Gene models are at the bottom in yellow. Note the two large heterochromatic regions, the centromeric/pericentromeric region (red bar) and the heterochromatic “knob” (yellow bar), that are gene poor and have high H3K9me2 signals.
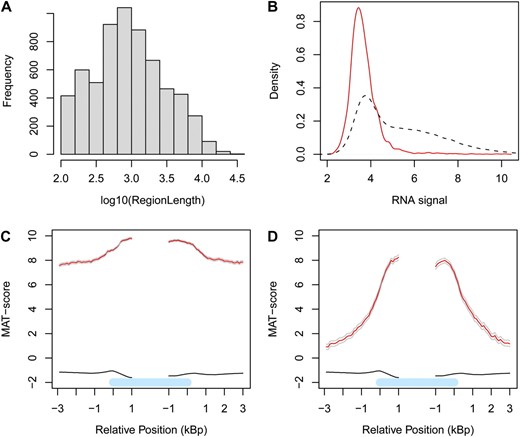
Characterization of H3K9me2-enriched regions. A, Size distribution of H3K9me2-enriched regions. B, Distribution of transcript signals for all genes (black broken line) and H3K9me2-marked genes (red solid line). C and D, Average H3K9me2 profiles (red lines) at H3K9me2-marked genes in the pericentromeric heterochromatin (C) and the euchromatic chromosome arms (D). The black lines represent the H3K9me2 profiles of genes not marked by H3K9me2; the gray lines indicate 95% confidence intervals. The light blue bars represent the annotated gene body from transcription start (left) to transcription end (right). Profiles are shown around annotated start (™3 kb…+1 kb) and end (™1 kb…+3 kb) positions.
To identify H3K9me2-marked genes, we calculated an average H3K9me2 enrichment score for each gene with the Model-based Analysis of Tiling-arrays (MAT) algorithm (Johnson et al., 2006). Using a null distribution based on randomization of probe assignments to genes, we identified 3,490 H3K9me2-marked genes (i.e. 10.9% of all genes) at a false discovery rate of 5% (Supplemental Table S6). The H3K9me2-marked genes included 2,454 (70%) transposable element genes, 811 (23%) protein-coding genes, and 225 (6.5%) pseudogenes. Thus, H3K9me2-marked genes are strongly enriched with transposable element genes and pseudogenes, which account only for 12% and 2.6%, respectively, of all annotated genes.
H3K9me2 is believed to be a strong silencing mark in Arabidopsis (Fuchs et al., 2006), and because transcriptome data and ChIP-chip data were generated from identical samples (3 d-old light-treated seedlings), we could directly compare the relation between H3K9me2 and RNA signals (Fig. 7B). Generally, genes marked by H3K9me2 were only very weakly or even not at all expressed.
The vast majority of the H3K9me2-marked genes (3,145 genes, 90%) were located in the centromeric and pericentromeric heterochromatin as defined by Bernatavichute et al. (2008). However, there were 345 (10%) H3K9me2-marked genes in the euchromatic chromosome arms. We investigated whether the neighborhood of heterochromatic and euchromatic H3K9me2-marked genes differed. The H3K9me2-marked genes in a heterochromatin neighborhood were characterized by an average MAT score of about 10 in the gene body and 8 in the neighborhood (Fig. 7C). The H3K9me2-marked genes in a euchromatic neighborhood were characterized by an average MAT score of about 8 in the gene body and 1 in the neighborhood (Fig. 7D). In contrast, genes not marked by H3K9me2 were characterized by an average MAT score of about ™1 in the gene body and in the neighborhood. Thus, the H3K9me2 signal from the gene body was only slightly elevated over the signal in the neighborhood in heterochromatic regions, whereas the H3K9me2 signal from the gene body was strongly elevated over the signal in the neighborhood in euchromatic regions. Therefore, it appears that targeting of H3K9me2 is tightly linked to information residing in the gene body and that spreading of H3K9me2 in euchromatic chromosome arms is limited.
This study demonstrates that the AGRONOMICS1 array can be used not only for transcriptomics but also for ChIP-chip experiments.
DISCUSSION
During the past decade, microarrays have become the “working horses” for gene expression studies. However, many existing arrays are limited to a particular version of genome annotation and become decreasingly useful with their incremental updates. Even though probes can be remapped to newer genome annotations (e.g. via modified CDF files for oligonucleotide-based microarrays manufactured by Affymetrix; Dai et al., 2005), this approach is restricted to the sequences included in the original array design. Here, we present a new microarray for Arabidopsis. Because the AGRONOMICS1 array is based on a tiling design, it can be matched to past, current, and future genome annotations. In contrast to previously described Arabidopsis tiling arrays, the AGRONOMICS1 array tiles both strands of the genome, enabling strand-specific detection of transcripts.
Direct sequencing of transcripts with novel high-throughput sequencing technologies (RNA-Seq) has recently become a powerful alternative for transcriptome profiling (Wang et al., 2009). Despite the great power of RNA-Seq, microarrays and RNA-Seq will likely coexist for a while, because they offer complementary advantages. RNA-Seq is the preferred approach for transcript and splice-variant discovery as well as for nonmodel species. However, major challenges remain to be solved with RNA-Seq: cost per sample is higher for comparable sensitivity; more robust protocols for strand-specific library generation are needed; efficient methods to store, retrieve, and process large amounts of data must be improved; robust statistical algorithms to combine read counts into transcript abundance estimates are still perfectible (Coppee, 2008; Wang et al., 2009). In addition, RNA-Seq data can suffer from specific biases based on transcript lengths that could confound data interpretation if not corrected for appropriately (Oshlack and Wakefield, 2009). Thus, for routine transcriptome profiling experiments, in particular involving large numbers of samples, microarrays are often the preferred choice.
We have established an analysis work flow based on custom-generated CDF files and Bioconductor/R packages, in particular the Aroma package (Bengtsson et al., 2008). This work flow is designed for the analysis of raw data for an arbitrary number of samples by any researcher on any personal computer. Background correction, normalization, and calculation of probe set summaries are based on the popular RMA method (Irizarry et al., 2003).
When comparing the new AGRONOMICS1 array with the older ATH1 array, we found consistent transcript level estimates and fold change values for the commonly probed transcripts. However, the AGRONOMICS1 array probed an additional 7,646 TAIR 9 genes. Similar to previous studies (Laubinger et al., 2008; Naouar et al., 2008), we observed that many of these genes that are probed by AGRONOMICS1 but not by ATH1 were not or only weakly expressed in our samples, possibly because many of them are expressed in specific cell types and/or under specific conditions. Nevertheless, we detected transcripts for a considerable fraction of genes that were not tested with ATH1 arrays, and these were often tissue specific. Together, we found that the AGRONOMICS1 arrays can be used for efficient transcriptome profiling, and we have used this array in the context of a large multilaboratory experiment.
AGRONOMICS1 arrays also proved appropriate for ChIP-chip experiments. Recently, high-throughput sequencing coupled to ChIP (ChIP-Seq) was introduced as a powerful alternative to ChIP-chip (Park, 2009). However, results were found to usually agree well between ChIP-chip and ChIP-Seq (Kaufmann et al., 2009), and practical considerations, such as access to equipment and bioinformatic support as well as costs, will strongly influence the choice of method for a given experiment. Advantages of the AGRONOMICS1 arrays for ChIP-chip applications include an established work flow based on Affymetrix TAS software or on an implementation of the MAT algorithm (Johnson et al., 2006) in the Aroma R package. Parallel analysis of ChIP-chip and RNA-chip data generated on the same type of microarray facilitates the direct correlation between chromatin composition or protein-DNA binding and transcriptional activity. In addition, AGRONOMICS1 arrays have a considerably higher probe density than other available Arabidopsis tiling arrays. Thus, resolution is mostly limited by wet-lab procedures. For standard ChIP protocols (Gendrel et al., 2002; Haring et al., 2007), the extent of sonication (usually 500–1,000 bp) sets the lower limit of the resolution. For native ChIP protocols, where fragmentation is achieved by micrococcal nuclease (Bernatavichute et al., 2008), the resolution can approach mononucleosome level.
In conclusion, we introduce a new oligonucleotide-based tiling array for Arabidopsis that has been proven to support a wide range of applications.
MATERIALS AND METHODS
Plant Material
All experiments used Arabidopsis (Arabidopsis thaliana) accession Columbia-0 plants. Plants were grown on soil at 23°C in a photoperiod of 16 h of light and 8 h of darkness. Leaves (no. 4 from 10–15 plants per sample) and flowers were harvested after 10 and 25 d, respectively, at Zeitgeber 6 (i.e. 6 h after start of the photoperiod), and frozen in liquid nitrogen. Flowers (stage 15; 20–25 per sample) were collected from the main inflorescence. For the analysis of dark-grown and light-treated seedlings, seedlings were grown on half-strength Murashige and Skoog medium for 4 d at 23°C in complete darkness and then transferred for 4 h to constant cool-white light (light-treated seedlings) or kept in darkness (dark-grown seedlings) before whole seedlings (approximately 50 per sample) were harvested.
Array Design
For array design, Arabidopsis Columbia genome sequences (TAIR 8) were masked at positions identified as low-complexity sequences, and simple repeats were defined by RepeatMasker (version open 3.2.7). Regions matching known Arabidopsis transposable elements were left unmasked for probe design. Additionally, nucleotides for which the surrounding 25mer occurred multiple times as exact copies on either strand of the nuclear genome were also masked. Based on this masked nuclear genome and the mitochondrial and chloroplast genomes, tiling probes, varying in length between 17 and 25 nucleotides, were designed on alternating strands to equally cover both genomic strands. In addition to that, all 250,103 PM probes contained on the ATH1 expression array as well as 152,065 control probes (528 Arabidopsis, 1,665 bacterial, 115,612 human, and 34,260 technical control probes) were included on the AGRONOMICS1 tiling array. Based on the masked genome, Affymetrix designed the probes as they would be produced on the chip. Careful checking has been done of all the proposed probes: their distribution over the chromosomes, whether the masking was correctly taken into account, strandness, and correct coordinates. Managing the masked sequence for probe design by Affymetrix was done by skipping probes that had their central coordinates within the indicated masked region. Files with the probes mapped back onto the genome are available.
Total RNA Extraction and Quality Control
Total RNA was isolated using the Qiagen Plant RNeasy MiniKit according to the manufacturer's instructions. The quality of the isolated RNA was determined with a NanoDrop ND 1000 (NanoDrop Technologies) and a Bioanalyzer 2100 (Agilent). Only samples with a 260-nm:280-nm ratio between 1.8 and 2.1 and a 28S:18S ratio within 1.5 to 2 were processed further.
Microarray Target Preparation
Method 1. GeneChip One-Cycle cDNA Synthesis Kit
Total RNA samples (2 μg) were reverse transcribed into double-stranded cDNA with the One-Cycle cDNA Synthesis kit (Affymetrix; 900431) including poly(A) controls as recommended by the manufacturer. Samples prepared in the presence of actinomycin D were treated the same, except that the drug was added after the initial denaturing step at 70°C to a final concentration of 6 mg mL™1. The double-stranded cDNA was purified using a Sample Cleanup Module (Affymetrix). The purified double-stranded cDNA was in vitro transcribed in the presence of biotin-labeled nucleotides using the IVT Labeling kit (Affymetrix; 900449). The biotinylated copy RNA (cRNA) was purified using a Sample Cleanup Module (Affymetrix), and its quality and quantity were determined using NanoDrop ND 1000 and Bioanalyzer 2100. Biotin-labeled cRNA samples (15 μg) were fragmented randomly to 35 to 200 bp at 94°C in Fragmentation buffer (Affymetrix).
Method 2. WT Ovation Pico System
The cDNA was prepared from total RNA using a primer mix and reverse transcriptase (WT Ovation Pico System; NuGEN). Samples prepared in the presence of actinomycin D were treated the same, except that the drug was added after the initial denaturing step at 70°C to a final concentration of 6 mg mL™1. The primers have a DNA portion that hybridizes either to the 5′ portion of the poly(A) sequence or randomly across the transcript. SPIA amplification, a linear isothermal DNA amplification process, was used to prepare single-stranded cDNA in the antisense direction of the mRNA starting material. Single-stranded cDNA quality and quantity were determined using NanoDrop ND 1000 and Bioanalyzer 2100. Fragmented and biotin-labeled single-stranded cDNA targets were generated with the FL-Ovation cDNA Biotin Module V2 (NuGEN). Biotin-labeled cRNA samples (15 μg) were fragmented randomly to 35 to 200 bp at 94°C in Fragmentation buffer (Affymetrix).
Method 3. GeneChip 3′ IVT Express Kit
Total RNA samples (50 ng) were reverse transcribed into double-stranded cDNA and then in vitro transcribed in the presence of biotin-labeled nucleotides using the GeneChip 3′ IVT Express kit (Affymetrix; 901229) including poly(A) controls as recommended by the manufacturer. The quality and quantity of the biotinylated cRNA were determined using NanoDrop ND 1000 and Bioanalyzer 2100. Biotin-labeled cRNA samples (15 μg) were fragmented randomly to 35 to 200 bp at 94°C in Fragmentation buffer (Affymetrix).
Array Hybridization
Biotin-labeled cRNA samples were mixed in 300 μL of Hybridization Mix (Affymetrix; 900720) containing Hybridization Controls and Control Oligonucleotide B2 (Affymetrix; 900454). Samples were hybridized onto Affymetrix AGRONOMICS1 Arabidopsis tiling arrays and ATH1 arrays for 16 h at 45°C. Arrays were then washed using an Affymetrix Fluidics Station 450 using the FS450_0004 protocol. An Affymetrix GeneChip Scanner 3000 was used to measure the fluorescence intensity emitted by the labeled target.
ChIP and Analysis on Microarrays
ChIP was performed as described previously (Exner et al., 2009), with some modifications, using 100 mg of 4-d-old light-treated seedlings. After cross-linking the material with 1% formaldehyde under vacuum for 10 min, the reaction was quenched with excessive Gly under vacuum for 5 min. Cross-linked seedlings were washed twice with deionized water, blotted on filter paper to dry, and flash frozen using liquid nitrogen. Frozen plant material was ground to a fine powder. Ground plant material was then suspended with freshly prepared MEB buffer (1.0 m hexylene glycol, 20 mm PIPES-KOH [pH 7.4], 10 mm MgCl2, 1 mm EGTA, 15 mm NaCl, 0.5 mm spermidine, 0.15 mm spermine, 10 mm 2-mercaptoethanol, and 1× protease inhibitor cocktail) at 4°C for 10 min. The homogenate was filtered through four layers of Miracloth. An equal volume of MEB/0.6% Triton X-100 was mixed with the filtrate, and the mixture was incubated on ice for 15 min before centrifugation at 1,500g at 4°C for 5 min. The pellet (i.e. the crude nuclear extract) was used for ChIP using the LowCell# ChIP kit (Diagenode). Briefly, the nuclear extract was suspended in 130 μL of buffer B and sonicated for eight cycles of 30 s on/30 s off using a Bioruptor sonicator (Diagenode) to reach an average fragment size of 300 bp. The chromatin preparation was diluted with 870 μL of buffer A and centrifuged at 14,000g for 30 s. The supernatant was collected and precleared with 20 μL of protein A paramagnetic beads (Diagenode) at 4°C for 2 h. For each immunoprecipitation, 300 μL of precleared chromatin was used, and 50 μL was kept as input control. For each immunoprecipitation, appropriate antibodies were added (anti-H3, CT, pan, Millipore 07-690; anti-H3K9me2, Diagenode pAb-060–050; IgG, Sigma I50006), and immunoprecipitation mixtures were rotated overnight at 4°C. Immunocomplexes were collected with 30 μL of protein A paramagnetic beads at 4°C for 1 h. Beads were then washed and DNA was recovered according to the LowCell# ChIP kit instructions.
DNA recovered from ChIP (200 μL) was used for quantitative PCR (10 μL) and for amplification (190 μL). Amplification was done with the WGA2 kit (Sigma) according to the manufacturer's instructions with minor modification (the fragmentation step before library preparation was skipped and 100 μ m dUTP was included in the PCR amplification step). Amplified DNA was purified with the MinElute PCR Purification kit (Qiagen) and eluted with 25 μL of Elution buffer. DNA concentration was measured using a NanoDrop 1000. Amplified DNA (2 μL) was kept for quantitative PCR. Preservation of ChIP enrichment after amplification was confirmed by quantitative PCR. Amplified ChIP DNA was fragmented and labeled with the GeneChip WT Terminal Labeling kit (Affymetrix) according to the manufacturer's instructions. Fragmentation was confirmed using an RNA Nano 1000 kit on a 2100 Bioanalyzer lab-on-chip platform (Agilent), revealing an average fragment size of 88 nucleotides.
Labeled samples were mixed in 300 μL of Hybridization Mix (Affymetrix; 900720) containing Hybridization Controls and Control Oligonucleotide B2 (Affymetrix; 900454). Samples (input, anti-H3, anti-H3K9me2, and unspecific IgG antibodies) were hybridized onto Affymetrix AGRONOMICS1 Arabidopsis tiling arrays for 16 h at 45°C. Arrays were then washed using an Affymetrix Fluidics Station 450 using the FS450_0004 protocol. An Affymetrix GeneChip Scanner 3000 was used to measure the fluorescence intensity emitted by the labeled target. Test hybridizations revealed that 2 and 5 μg of labeled anti-H3K9me2 sample gave very similar results (data not shown), suggesting that 2 μg of labeled sample is sufficient for marks of this abundance (approximately 15% of the genome). Lower amounts of labeled sample will be sufficient when probing less abundant epitopes such as transcription factors.
Normalization and Generation of Probe Set Summaries
Prior to expression analysis, we masked repetitive probes on the AGRONOMICS1 array if they had more than one PM of length 19 nucleotides or greater or imperfect match (1-bp mismatch or insertion/deletion) of length 23 nucleotides or greater. These were identified using Vmatch (Abouelhoda et al., 2004) by calculating direct and reverse complementary matches of length 17 bp or greater with edit distance 1 bp or less between the five nuclear chromosomes and the mitochondrial and chloroplast genome sequences (TAIR 8). For the remaining probes, the unique genome location and strand were retained for the subsequent mapping to gene models annotated in TAIR 8. For each annotated gene, probe sets were constructed that contained all probes that were mapped to constitutive exons and did not span splice sites or transcript isoforms differing in the region complementary to the probe. Only genes with at least three probes were considered during expression profiling. Genes with a small number of probes are usually very short, have very long introns, or have many introns.
To construct CDF files based on TAIR 9, probes with more than one match after mapping to the TAIR 9 genome sequence were excluded. Because untranslated regions frequently had low signals even for genes with high average signals, probes that match in untranslated regions were not included in the probe sets. For the exon-specific CDF file (agronomics1_TAIR9_exon.cdf), all probes that entirely mapped onto exons were selected and a probe set was defined when there were at least three probes per exon. Note that exons can overlap in TAIR 9, for instance when there is more than one transcript per locus, and that probe sets for overlapping exons will have some probes in common. The probe set names were defined as <gene_model>.<chromosome>.<strand>.<exon_start_position>.<exon_end_position> (e.g. AT1G01010.1.Chr1.plus.3631.3913).
A second CDF file (agronomics1_TAIR9_gene.cdf) was constructed with the aim to have exactly one probe set representing each gene. For 208 genes with multiple transcripts with little overlap, more than one probe set per gene was generated per gene. The CDF file contains three types of probe sets, which can be discriminated by their names. The naming scheme is <locus name>.<variant>.<chromosome>.<strand>.<mRNA_start>.<mRNA_end> (e.g. AT1G01010.0.Chr1.plus.3631.5899). The meaning of the variant component is as follows: 0, there is only one transcript annotated for the gene, and the probe set matches this transcript (25,387 probe sets); X, there are multiple transcripts with a large overlap annotated for the gene, and the probe set matches the intersection of all these transcripts (4,325 probe sets); 1-N, there are multiple transcripts with little overlap annotated for the gene, and each probe set contains all probes that match the corresponding transcript (208 loci, 525 probe sets).
Background correction, normalization, and calculation of probe set summaries were based on the custom-made CDF files and RMA (Irizarry et al., 2003) implemented in the Aroma.Affymetrix package (Bengtsson et al., 2008). Nonperforming probes were dynamically masked during the analysis (see “Results”).
Bioinformatic Analysis
All analysis was performed in R 2.9.1 (R Development Core Team, 2009). To estimate background hybridization, a control CDF file was generated. This CDF file has the same number of probe sets and probes per probe set as the AGRONOMICS1 custom CDF, but the probes were randomly selected from the human control probes, which do not have any matches in the Arabidopsis genome. RMA signals based on this control CDF were used to construct null distributions of RMA signals for each sample. Differentially expressed genes were identified using the Limma package (Smyth, 2004) with multiple testing correction according to Storey and Tibshirani (2003). Genes were considered as differentially expressed at P < 0.05 and abs(fold change) > 1.5.
ChIP-chip data were normalized with MAT (Johnson et al., 2006) implemented in the Aroma.Affymetrix package (Bengtsson et al., 2008) with the window size parameter set to 500. Enriched regions were defined as continuous runs of probes with a MAT score of at least 4 and were selected using the package BAC (Gottardo et al., 2008) with minRun and maxGap parameters set to 100 and 200, respectively. To identify H3K9me2-marked genes, a gene-specific MAT score was defined as the 75th percentile of all probe-specific MAT scores for the probes located entirely within the transcribed region of a gene. A null distribution of gene-specific MAT scores, which was based on randomization of probe assignments to genes, was used to select H3K9me2-marked genes at a false discovery rate of 5%. Visualization of tiling array data was done using the Integrated Genome Browser at http://igb.bioviz.org/download.shtml (Nicol et al., 2009).
The AGRONOMICS1 array is commercially available through Affymetrix. Library files and scripts are freely available as Supplemental Data S2 and at http://www.agron-omics.eu/index.php/resource_center/tiling-array. The array design has been registered at ArrayExpress (accession no. A-AFFY-155). Microarray raw data are available at ArrayExpress (accession nos. E-MEXP-2472, E-MEXP-2480, and E-TABM-870). Processed microarray data will be visualized in Genevestigator (www.genevestigator.com; Zimmermann et al., 2005).
Supplemental Data
The following materials are available in the online version of this article.
Supplemental Figure S1. Examples of poorly performing probes.
Supplemental Figure S2. Distribution of number of probes per probe set before and after filtering.
Supplemental Figure S3. Relation between detection calls and transcript presence.
Supplemental Figure S4. Signal ratios do not show considerable 3′ bias.
Supplemental Figure S5. Comparison of fold change values based on data from different array types.
Supplemental Figure S6. Examples of differential transcript expression and alternative splicing.
Supplemental Figure S7. Averaged H3K9me2 signals (MAT scores) along Arabidopsis chromosomes.
Supplemental Table S1. Genes with specific expression in dark-grown seedlings.
Supplemental Table S2. Genes with specific expression in light-treated seedlings.
Supplemental Table S3. Genes with specific expression in leaves.
Supplemental Table S4. Genes with specific expression in flowers.
Supplemental Table S5. Chromosomal regions enriched in H3K9me2.
Supplemental Table S6. H3K9me2-marked genes.
Supplemental Data S1. R-script for RMA-type analysis including dynamic probe filtering.
Supplemental Data S2. Archive of CDF files for RMA-type analysis.
ACKNOWLEDGMENTS
We thank Matthias Prucha, Eric Shell, and Lucy Reynolds from Affymetrix for design of the AGRONOMICS1 microarray after our request for the tiling array release 2.0. We are grateful to Tao Liu (Dana-Farber Cancer Institute and Harvard School of Public Health) for providing the MAT-style BPMAP files and to Reݩmy Bruggmann (Functional Genomics Center Zurich) for help generating the CDF files.
LITERATURE CITED
Abouelhoda MI, Kurtz S, Ohlebusch E (
Bengtsson H, Simpson K, Bullard J, Hansen K (
Naouar N, Vandepoele K, Lammens T, Casneuf T, Zeller G, van Hummelen P, Weigel D, Ratsch G, Inze D, Kuiper M, et al (
Park PJ (
R Development Core Team (
Smyth GK (
Thibaud-Nissen F, Wu H, Richmond T, Redman JC, Johnson C, Green R, Arias J, Town CD (
Author notes
This work was supported by the Sixth Framework Program of the European Commission through the AGRON-OMICS Integrated Project (grant no. LSHG–CT–2006–037704).
Corresponding author; e-mail [email protected].
The author responsible for distribution of materials integral to the findings presented in this article in accordance with the policy described in the Instructions for Authors (www.plantphysiol.org) is: Lars Hennig ([email protected]).
The online version of this article contains Web-only data.
Open Access articles can be viewed online without a subscription.
