


Abstract
The Triticeae Full-Length CDS Database (TriFLDB) contains available information regarding full-length coding sequences (CDSs) of the Triticeae crops wheat (Triticum aestivum) and barley (Hordeum vulgare) and includes functional annotations and comparative genomics features. TriFLDB provides a search interface using keywords for gene function and related Gene Ontology terms and a similarity search for DNA and deduced translated amino acid sequences to access annotations of Triticeae full-length CDS (TriFLCDS) entries. Annotations consist of similarity search results against several sequence databases and domain structure predictions by InterProScan. The deduced amino acid sequences in TriFLDB are grouped with the proteome datasets for Arabidopsis (Arabidopsis thaliana), rice (Oryza sativa), and sorghum (Sorghum bicolor) by hierarchical clustering in stepwise thresholds of sequence identity, providing hierarchical clustering results based on full-length protein sequences. The database also provides sequence similarity results based on comparative mapping of TriFLCDSs onto the rice and sorghum genome sequences, which together with current annotations can be used to predict gene structures for TriFLCDS entries. To provide the possible genetic locations of full-length CDSs, TriFLCDS entries are also assigned to the genetically mapped cDNA sequences of barley and diploid wheat, which are currently accommodated in the Triticeae Mapped EST Database. These relational data are searchable from the search interfaces of both databases. The current TriFLDB contains 15,871 full-length CDSs from barley and wheat and includes putative full-length cDNAs for barley and wheat, which are publicly accessible. This informative content provides an informatics gateway for Triticeae genomics and grass comparative genomics. TriFLDB is publicly available at http://TriFLDB.psc.riken.jp/.
The recent accumulation of nucleotide sequences for agricultural species, including crops and domestic animals, now permits the application of genome-wide comparative analyses of model organisms with the goal of identifying key genes involved in phenotypic characteristics (Cogburn et al., 2007; Flicek et al., 2008; Paterson, 2008; Tanaka et al., 2008). The integration of genomic resources derived from various related species, such as large-scale collections of cDNAs and data from whole-genome sequencing projects, with various types of knowledge bases permits the sharing of information about gene function between models and applied organisms.
Integrative databases that house the sequences of systematically collected full-length cDNA clones have become fundamental initial resources for the bold promotion of the study of genomics in various organisms (Hayashizaki, 2003; Imanishi et al., 2004; Maeda et al., 2006; Tanaka et al., 2008; Yamasaki et al., 2008). In plants, full-length cDNA sequence resources are being used for a variety of purposes. For example, they are being used to create accurate genome annotations, for comparative analyses that link the genomic information of model and applied species, as sequence resources for protein sequence-based comparative analyses, and as sequence datasets for identifying proteins corresponding to peptides that have been detected using proteomics (Itoh et al., 2007; Ralph et al., 2008; Alexandrov et al., 2009; Seki and Shinozaki, 2009). Furthermore, collections of full-length cDNA clones have been used for systematic screening of characteristic gene functions by phenotyping overexpressor pools of full-length cDNA libraries. This technique was established recently in the Arabidopsis (Arabidopsis thaliana) “FOX hunting” (for Full-length cDNA Over-eXpressor gene hunting) system. Full-length cDNAs are key resources that provide a link between the genome, the transcriptome, and the proteome (Tochitani and Hayashizaki, 2007). Thus, full-length cDNAs and their annotations provide an initial gateway to various omics data (Sakurai et al., 2005; Maeda et al., 2006). To respond to the increasing amount of plant genome data, user interfaces that provide a seamless integration of comparative functions will be required to perform knowledge mining not only within community databases for specified organisms, but also across datasets integrated with multiple plant species (Spannagl et al., 2007; Ware, 2007). Full-length cDNA resources and modeled proteomes should be integrated with various types of representative sequence resources not only in the same species, but also in related species, thereby making it possible to exchange genomic knowledge and gain insight from comparative genomics (Dong et al., 2005). Furthermore, comparative allocation between transcripts from related species and the genome sequences of model organisms should be informative for both species, allowing for predictions and comparisons of gene structure and splicing patterns and assisting in the detection of genes and flanking sequences of possible counterparts (Mitchell et al., 2007; Zhu and Buell, 2007). The protein domain structure of modeled full-length protein sequences should also be compiled so that comparative sequence family analyses can be performed (Horan et al., 2005; Conte et al., 2008). Transfer of the genomic and genetic information of model organisms to related applied plant species should be promoted, particularly in the case of plant families that include both sequenced organisms and crops. This transfer should include full-length transcript-related datasets that are enriched with annotations, such as orthologous gene sequences and DNA markers (Sato and Tabata, 2006; Sato et al., 2007).
The Poaceae are a plant family that includes four major food staple crop species: wheat (Triticum aestivum), maize (Zea mays), rice (Oryza sativa), and barley (Hordeum vulgare). cDNA and/or genome sequence data for crops of the Poaceae have recently been accumulating in the public domain. Completion of the whole-genome sequencing of rice and its curated annotation using full-length cDNA data have benefited comparative plant genomics by increasing our understanding of genome-wide features and accelerating practical cereal breeding (International Rice Genome Sequencing Project, 2005; Itoh et al., 2007). The draft genome sequence of sorghum (Sorghum bicolor; in the Panicoideae subfamily) has been released and used for genomic comparisons with maize (Paterson et al., 2009). Large-scale EST and full-length cDNA collections of maize have also been used as resources to aid ongoing genome sequencing (Lai et al., 2004; Jia et al., 2006). ESTs of common wheat and barley (in the Pooideae subfamily) have been collected on a large scale to establish a comprehensive sequence resource for gene discovery and a reliable database of gene expression (Zhang et al., 2004; Mochida et al., 2006). Progress has now been made in both the barley and wheat genome sequencing projects, and full-length cDNA-related databases are expected to be key resources for genome annotation in these crops (Paux et al., 2008; Schulte et al., 2009). Sequence information from the large-scale collection of full-length cDNA clones of wheat and barley has been released to the public domain (Sato et al., 2009; K. Kawaura, K. Mochida, A. Enju, T. Totoki, A. Toyoda, Y. Sakaki, C. Kai, J. Kawai, Y. Hayashizaki, M. Seki, K. Shinozaki, and Y. Ogihara, unpublished data). As a result of these comprehensive efforts, there are now more than 15,000 nucleotide sequence entries available for the Triticeae (a tribe in the Pooideae), each of which potentially covers full-length coding sequences (CDSs).
To integrate our genomic knowledge of plants and facilitate further discoveries, many public databases that contain important plant genomics resources and that have effective interfaces have been established (Supplemental Fig. S1). PlantGDB, The Institute for Genomic Research (TIGR) Gene Indices, TIGR Plant Transcript Assemblies, and HarvEST provide clustered and representative transcript sequences resulting from advances in large-scale EST compilation. Each of these databases is useful not only for the provision of comprehensive transcripts, but also for comparisons among plant species (Liang et al., 2000; Lee and Quackenbush, 2003; Childs et al., 2007; Close et al., 2007; Duvick et al., 2008). The integration of genetic markers with corresponding genomic and/or transcriptomic sequences is facilitating genome-wide genetic approaches. Gramene is a database established for plant comparative genomics that provides genetic maps of various plant species (Jaiswal et al., 2006; Ware, 2007; Liang et al., 2008). GrainGenes is a popular site for information regarding genetic markers in Triticeae species (Carollo et al., 2005). We also recently released a new database (Triticeae Mapped EST Database [TriMEDB], http://TriMEDB.psc.riken.jp/) that focuses on genetically mapped cDNA markers of barley and diploid wheat. TriMEDB allows researchers to perform cDNA-based genetic knowledge comparisons among Triticeae species and syntenic regions of the rice genome (Mochida et al., 2008). Furthermore, genome annotations and modeled proteome datasets from the sequenced plant species (i.e. Arabidopsis and rice) can be used effectively for genome-wide comparative studies, such as comprehensive gene family constructions. Such studies can themselves yield databases that are useful for further phylogenetic studies (Horan et al., 2005; Conte et al., 2008; Wall et al., 2008). However, there are no databases that assemble the modeled proteome-based data of Triticeae species together with annotations based on comparative genomics that have effective links to knowledge databases of other plant species. The integration of resources for full-length CDSs of the Triticeae species will be important for comparative studies among Gramineae species, as well as a wide range of other species.
Therefore, to fill the gap in our knowledge of full-length CDSs of the Triticeae and, thus, to facilitate comparative grass genomics, we gathered the relational annotations of full-length CDSs of wheat and barley into a new database with the following specific properties. The first property was to provide predicted domain structures as well as other protein domain-oriented annotations of entire amino acid sequences that have been deduced from full-length CDSs and from CDSs clustered with proteome datasets of other plant species. The second was to provide seamless cross references to previously released sequence data resources, which was accomplished by annotating each of the database entries with possible identical sequences and/or counterparts in various transcripts and also by annotating the modeled proteome data resources of plant species, all with related reference links. The aim of this was to integrate knowledge and thus increase our understanding of gene annotations. Third, each of the entries in the database was related to the genetically mapped cDNAs of barley and diploid wheat, which in turn were bidirectionally integrated with TriMEDB. This yields a synergistic data relationship and extends the application of these resources to provide potential genetic positions of full-length transcripts on linkage maps of Triticeae in silico.
Here we describe our novel database. The Triticeae Full-Length CDS Database (TriFLDB) integrates knowledge of full-length CDSs of Triticeae crops with insights into comparative grass genomics. Currently, TriFLDB consists of 8,530 wheat and 7,341 barley putative full-length CDSs and related information. TriFLDB can be accessed via the Web interface at http://TriFLDB.psc.riken.jp/.
RESULTS AND DISCUSSION
Dataset, Design, and Search Interface of TriFLDB
The dataset integrated into the initial version of TriFLDB is summarized in Table I
Data sources for TriFLCDS
Organisms | DNA | CDS/Protein | Source |
|---|---|---|---|
| Barley | 2,348 | 2,348 | Genpept/GenBank |
| 5,006 | 4,993 | BarleyDB | |
| Barley total | 7,354 | 7,341 | |
| Wheat | 2,393 | 2,393 | Genpept/GenBank |
| 6,158 | 6,137 | RIKEN/NBRP Komugi | |
| Wheat total | 8,551 | 8,530 | |
| Total | 15,905 | 15,871 |
CDS predictions for barley and wheat full-length cDNAs using longest-frame prediction and DECODER
BarleyDB Barley Full-Length cDNA | RIKEN Wheat Full-Length cDNA | |
|---|---|---|
| No. sequences examined | 5,006 | 6,158 |
| Longest frames predicted | 5,002 | 6,142 |
| DECODER CDS frames predicted | 4,576 | 5,562 |
| DECODER fragments predicted | 430 | 596 |
| Consistent frames predicted | 4,397 | 5,360 |
| % of predicted full CDS-containing clones | 87.8 | 87.0 |
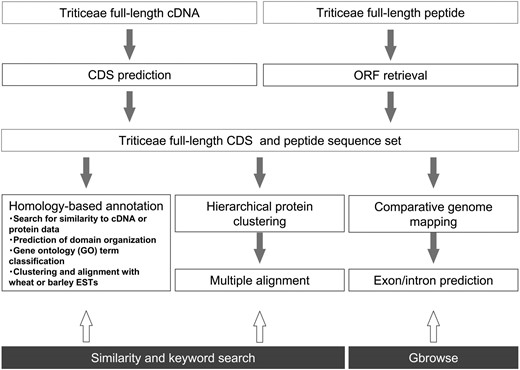
Schematic representation of the informatics workflow used to generate TriFLCDS entries and related annotations. The user can access the three types of TriFLDB content using sequence similarity and keyword searches or the genome browser Gbrowse to access data on homology mapping between TriFLCDSs and the rice and sorghum genomes (bottom).
![Search interfaces for accessing TriFLDB content. The user can search TriFLCDS not only with sequence identifiers, but also by using various types of strings, such as keywords in the descriptions of BLAST hit sequences, identifiers of conserved protein domains and related GO terms found by InterProScan searches, and the predicted allocated chromosome name (A). The user can also access sequence similarity searches for TriFLCDS entries and for sequence sets of other plant species (B). [See online article for color version of this figure.]](https://oup.silverchair-cdn.com/oup/backfile/Content_public/Journal/plphys/150/3/10.1104_pp.109.138214/3/m_plphys_v150_3_1135_f2.jpeg?Expires=1750225007&Signature=nBGxj-uPsFTpAtg9dUzAZsp5l2sHkfyo0391HhxfLdCd-gJeP4vBj-DHH4RUDtPMCyj8-k6MYsUgbItX~egdWpIlm2PSLW4eMkjJIS3mDzmIvmR7SggyWQTGmbx3C3gyuWGa65DUrSb70RFedFEwmHU2hehRZsBr9uJQrFIcrne~s5T6lBIGb1tcA1AQwH7nfUWp73rLpnA5R5kiEDFwGAFnVgMF9Rwi97lUc1iQJ56V5146mmFedSaECUlzZkqXdnyw50B40eeKXWx9Nvo5bjC0N1s0jqPl5P1b~s9ntlJ12tixesjKG~66~cpNx~68ofyOFJ9mL9jyNZZbpcIbMw__&Key-Pair-Id=APKAIE5G5CRDK6RD3PGA)
Search interfaces for accessing TriFLDB content. The user can search TriFLCDS not only with sequence identifiers, but also by using various types of strings, such as keywords in the descriptions of BLAST hit sequences, identifiers of conserved protein domains and related GO terms found by InterProScan searches, and the predicted allocated chromosome name (A). The user can also access sequence similarity searches for TriFLCDS entries and for sequence sets of other plant species (B). [See online article for color version of this figure.]
Annotation of Triticeae Full-Length CDSs
![Typical example of the detailed annotation of TriFLCDS entries. A, Summary table for a TriFLCDS entry, including the results of full-length CDS predictions. B, Nucleotide sequence and deduced protein sequence. C, Results of a similarity search against various sequence resources. D, List of the GO terms associated with the TriFLCDS entry. E, Domain structure predicted by InterProScan. [See online article for color version of this figure.]](https://oup.silverchair-cdn.com/oup/backfile/Content_public/Journal/plphys/150/3/10.1104_pp.109.138214/3/m_plphys_v150_3_1135_f3.jpeg?Expires=1750225007&Signature=bHtM1PxyCMC6ULRYr0la0Rn4QfkJrNAInZhjFUBEYsVAGix5Y35gVUE8G-jfUZ0ZtJ6pEWO2hwSenf4ZQaclheNg0NIKyKUJuInWTgdwOXHYQE5X-UKGRBj1lzI3RM6LthFqg8vL7qqTOQ4UP3ZYfLF7w3CCmhUdP9q2TCJ91UkmChl6hYw3vieeVfrMupTXp7Zitu3gwDh4GXCMhdWv9YT7naEuClwopF~l6bX36mF1sa4q2Sd3eHxeHLBS0UhRmL2k4IdisEhRXn46jfzkjT4KlCSVKBuyzN6MSJyEQoFkGg5dA2St6Dj8m8HYJsVp2tRsy09qtSigaRG9WKsAZQ__&Key-Pair-Id=APKAIE5G5CRDK6RD3PGA)
Typical example of the detailed annotation of TriFLCDS entries. A, Summary table for a TriFLCDS entry, including the results of full-length CDS predictions. B, Nucleotide sequence and deduced protein sequence. C, Results of a similarity search against various sequence resources. D, List of the GO terms associated with the TriFLCDS entry. E, Domain structure predicted by InterProScan. [See online article for color version of this figure.]
To obtain clues about gene function, TriFLCDS entries were also searched against the annotated protein datasets of Arabidopsis, rice (RAP-DB and TIGR), and sorghum, as well as against representative nonredundant protein data repositories (nr of NCBI and UniProt of the European Bioinformatics Institute [EBI]). We found hits with significant similarity to more than 80% of the TriFLCDS entries in Arabidopsis and to at least 87% in rice and sorghum (Supplemental Fig. S2B). The results of the similarity searches for each of the TriFLCDS entries are shown on the Web interface, and, whenever possible, links to the original data for each hit are provided so as to enable browsing of additional related information (Fig. 3C). For domain-based functional annotation, the deduced protein data were subjected to a domain search using InterProScan. In total, 13,162 (82.9%) entries were assigned to at least one identifier of the database used in InterPro. Using the Web interface, the user can browse each of the results of the domain search, along with the predicted GO classification (Fig. 3, D and E). A synopsis of the results of the similarity search against various sequence resources is shown on the Web interface, and this should allow researchers to determine the annotation status of the searched entries and the predicted annotation of the most likely counterparts in other databases. This should help users to build hypotheses that are related to gene function.
To construct a dataset that relates the proteins predicted in TriFLDB to those of other plant species, we grouped TriFLCDSs hierarchically into homologous clusters with the protein datasets for Arabidopsis, rice, and sorghum. Clustering with a 90% identity threshold produced 10,639 clusters containing one or more protein sequences derived from wheat or barley full-length CDSs. This indicates that the current version of TriFLDB contains putative full-length CDSs that correspond to more than 10,000 nonredundant genes (Supplemental Table S1).
![Example of a hierarchically clustered protein sequence TriFLDB entry containing sequences from Arabidopsis, rice, and sorghum, presented with the hyperlinked destination for each of the referenced annotations. The Web interface employs a tree-form viewer to provide the results of clustering with global amino acid sequence identity thresholds of 30%, 60%, and 90%. The viewer also provides identifiers for clustered sequences via four kinds of hyperlinks: multiple alignment, InterProScan domain search results, the annotation page of the original data resources, and each data resource for the protein domain families identified. [See online article for color version of this figure.]](https://oup.silverchair-cdn.com/oup/backfile/Content_public/Journal/plphys/150/3/10.1104_pp.109.138214/3/m_plphys_v150_3_1135_f4.jpeg?Expires=1750225007&Signature=TPZtQYI2Y8lMHVjK8N0PiACFCVebYcz-dHcDPUKTRgSX7uEVR2QIQgdnqvNryMJv5~qSVpIaGD6C4oKdfSdz4ly-azMoyKA4q1whPdra8ekT-xC0mCpBH1DmLSYOekPriX-nEuOXWX63-42AxieMZ0xSSCdFhXHbTlN5W6HXMvpvXZCU3FrSPd5dWdma1YDwbakkOlFRmpyKI0XslW3yxmdH0TyYWu7ao~clq1Zk1-hvSh6ykRwgOzXZhx5VfE8Hp9TDnr9b~3poujGmgTeY9RFVZRrVvWdRkjjVGN6Ec3pGjj497KGO3JqRvCrfDg66~iCB8RgRBhWC1u2Vn9WK4g__&Key-Pair-Id=APKAIE5G5CRDK6RD3PGA)
Example of a hierarchically clustered protein sequence TriFLDB entry containing sequences from Arabidopsis, rice, and sorghum, presented with the hyperlinked destination for each of the referenced annotations. The Web interface employs a tree-form viewer to provide the results of clustering with global amino acid sequence identity thresholds of 30%, 60%, and 90%. The viewer also provides identifiers for clustered sequences via four kinds of hyperlinks: multiple alignment, InterProScan domain search results, the annotation page of the original data resources, and each data resource for the protein domain families identified. [See online article for color version of this figure.]
The detailed annotations of each of the TriFLCDS entries that have been inferred via sequence similarity as well as predicted protein domains should facilitate the prediction of possible gene functions, as well as the configuration of further functional analyses and/or the narrowing down of candidate genes in Triticeae.
Integration of Full-Length CDS Data and Genetically Allocated cDNA Markers of Triticeae
Assignment of nonredundant EST markers of TriMEDB v. 2.0 (3,605 marker groups) to full-length CDS entries in TriFLDB
Organism | No. of Entries of TriFLDB Used for Similarity Search | No. of Marker Groups of TriMEDB Assigned to TriFLCDS (%) |
|---|---|---|
| Barley | 7,341 | 1,486 (41.2) |
| Wheat | 8,530 | 1,457 (40.4) |
| Total | 15,871 | 2,182 (60.5) |
Organism | No. of Entries of TriFLDB Used for Similarity Search | No. of Marker Groups of TriMEDB Assigned to TriFLCDS (%) |
|---|---|---|
| Barley | 7,341 | 1,486 (41.2) |
| Wheat | 8,530 | 1,457 (40.4) |
| Total | 15,871 | 2,182 (60.5) |
![Example of the interdatabase relationship between TriFLDB and TriMEDB. The user can search TriFLCDS entries using chromosome names as a result of the connection to genetically mapped cDNA markers in TriMEDB. A, The annotation page for each of the TriFLCDS entries provides a relational link to the assigned cDNA marker information. B, The user can browse detailed information related to the corresponding cDNA markers. The TriMEDB interface provides a link to TriFLDB for browsing corresponding full-length CDSs (C). [See online article for color version of this figure.]](https://oup.silverchair-cdn.com/oup/backfile/Content_public/Journal/plphys/150/3/10.1104_pp.109.138214/3/m_plphys_v150_3_1135_f5.jpeg?Expires=1750225007&Signature=RmlE5g9z-pVo39GuFaIz0iJYxnjda1i56sfqj3Ix4jYP~cv~VvDTPgkSbts2wJST3SBPRzP~yyfW9dfE8KQ-d8v2UC0ilt3bQGsYTLtzL41f45JIo-ncAW~Wj1DHmCAqWHVSPzNVY9nG~y77BUiW3lioHQauhK~YItSDJy3Ut~6MSa7ufceV5NJiOk79jt2dEa2vhpm09004SMLUYBItuuPURNpqe~AlMU8caCv0HWcezGN5tzrjgbLPgmT58~7wqVq8vbk7CSAXiyuPBLJGr-yWiM0WYKm8pg5TsgwGRkcr7BETnSgsHuHpeihNTEOSJ62ag7M9CCJlfTwRwR-z2Q__&Key-Pair-Id=APKAIE5G5CRDK6RD3PGA)
Example of the interdatabase relationship between TriFLDB and TriMEDB. The user can search TriFLCDS entries using chromosome names as a result of the connection to genetically mapped cDNA markers in TriMEDB. A, The annotation page for each of the TriFLCDS entries provides a relational link to the assigned cDNA marker information. B, The user can browse detailed information related to the corresponding cDNA markers. The TriMEDB interface provides a link to TriFLDB for browsing corresponding full-length CDSs (C). [See online article for color version of this figure.]
Assignment and Assembly of Wheat and Barley ESTs into TriFLCDSs
![Summarized results of EST assignment to TriFLCDSs on the basis of similarity searches, and a typical example of clustered ESTs assembled together with full-length CDSs to form a contig sequence. Pairwise alignments between ESTs and possible full-length counterpart TriFLCDSs with at least 80% identity and a HSP of at least 100 bp were plotted under each of the search conditions. The BLAST-searched combinations of queried ESTs and full-length CDSs indicated by asterisks (*) in the graph were used for sequence assembly against the wheat and barley entries provided in TriFLDB. TaEST and HvEST refer to the EST datasets of wheat and barley, respectively, that were used as query data in the BLAST search. TaFLCDS and HvFLCDS refer to the TriFLCDS entries for wheat and barley, respectively, that were used as the database in the BLAST search (A). Barley and wheat ESTs assigned to the TriFLCDSs of barley and wheat, respectively, were assembled, and each of these is shown in TriFLDB. A barley entry, AK251905, is shown as an example of the assembly of barley ESTs and TriFLCDS (B). [See online article for color version of this figure.]](https://oup.silverchair-cdn.com/oup/backfile/Content_public/Journal/plphys/150/3/10.1104_pp.109.138214/3/m_plphys_v150_3_1135_f6.jpeg?Expires=1750225007&Signature=JNxuHCWJk0NBnNSwOdLi0IKcFjcPE-AIAQR5wuEk9xYN993nW5zbJu4DvwKjheVTNeb0CAwtWjMU2NVofIInY-IsEmbKf03NnQqWN5LAhX3JNJEr6cOV9M9fWDEfFyAq~LfOs10PP5TUkfAf~yRcrd0ow71PHraqcgrFIQskXLKa3RlzZq4GE~yF1lbqQKIIuc11q~JTreCpaA1AmMnly8FBydN1QIT7GkjgtXYdhL21S8DYE78Q4qHpwye4QGLLPnkumAct8eQiBqK9xP2Zuc7hrrSV-owiPycmxV9viNWih2kkxmCwtnAi5fUfS8WdwMbEm2tk6xaH2G2UAEeXbg__&Key-Pair-Id=APKAIE5G5CRDK6RD3PGA)
Summarized results of EST assignment to TriFLCDSs on the basis of similarity searches, and a typical example of clustered ESTs assembled together with full-length CDSs to form a contig sequence. Pairwise alignments between ESTs and possible full-length counterpart TriFLCDSs with at least 80% identity and a HSP of at least 100 bp were plotted under each of the search conditions. The BLAST-searched combinations of queried ESTs and full-length CDSs indicated by asterisks (*) in the graph were used for sequence assembly against the wheat and barley entries provided in TriFLDB. TaEST and HvEST refer to the EST datasets of wheat and barley, respectively, that were used as query data in the BLAST search. TaFLCDS and HvFLCDS refer to the TriFLCDS entries for wheat and barley, respectively, that were used as the database in the BLAST search (A). Barley and wheat ESTs assigned to the TriFLCDSs of barley and wheat, respectively, were assembled, and each of these is shown in TriFLDB. A barley entry, AK251905, is shown as an example of the assembly of barley ESTs and TriFLCDS (B). [See online article for color version of this figure.]
Comparative Mapping of TriFLCDSs onto the Rice and Sorghum Genomes
![Typical example of the results of comparative mapping of TriFLCDSs onto the rice (A) and sorghum (B) genomes, shown here in the Gbrowse interface. The interface provides allocated TriFLCDS entries together with annotated gene information from the original data resources. [See online article for color version of this figure.]](https://oup.silverchair-cdn.com/oup/backfile/Content_public/Journal/plphys/150/3/10.1104_pp.109.138214/3/m_plphys_v150_3_1135_f7.jpeg?Expires=1750225007&Signature=tTw8v5xHQ8LQ5zfYljvw5Botu0elZAEWLOdAIj1P8ST48lA6pR-hLX-L0bbjGVh4rs3D9zxSo0wIZOWf4KhnU-8CH2iVNQ3dG0yu4ZPH3bAw654D3a5~bNceGnEWdRUtJfS3mFAArPrwG6w4vigjjJUr9AWpWkl0N5QA~Lr6ionOaaYP~XtqVG4tXwNYyIAc-3V5pAp-j6uamDC6iOa6AvtOKhgRB8sIm3TwF8yr6ESIHSk~33N57g0fod8R4Yj33s6imulu4IXPyEz42BpX0eNhTR~Fj~FxkH4L-jGRkFwHR~dqT6b1GF9ZJjCzqAQ5hUf4CpYdUyvpZhHsCy~AeQ__&Key-Pair-Id=APKAIE5G5CRDK6RD3PGA)
Typical example of the results of comparative mapping of TriFLCDSs onto the rice (A) and sorghum (B) genomes, shown here in the Gbrowse interface. The interface provides allocated TriFLCDS entries together with annotated gene information from the original data resources. [See online article for color version of this figure.]
The database structure of the current version of TriFLDB and its relationship with TriMEDB are depicted in a schematic diagram showing the data handling and generated relational datasets with corresponding Web interfaces (Supplemental Fig. S3). The genome resources related to Triticeae species will continue to accumulate (Schulte et al., 2009). Therefore, it is important that comparable datasets from related organisms be accessible and cross referenced (Childs, 2009). Because they feature segmentalized data tables and various types of interfaces for browsing, the database structures of TriFLDB and TriMEDB should be able to respond to such expected increases in genomic resources in Triticeae, as well as in other model plant species. The Poaceae are a good example of how genomic knowledge of crops, such as wheat, barley, and maize, is facilitated by comparative genomics with a model organism, such as rice (Paterson et al., 2005). Integration of the information present in our database, in which the modeled proteome data of applied crops is related to functional annotations of model species, increases the ability to cross reference between these species, and thereby facilitates knowledge exchange and application of databases to comparative crop genomics.
CONCLUSION
This integrative Web-based database interface provides information on putative full-length CDSs of wheat and barley that will facilitate the comparative genomics of grasses. The database should meet the broad demands of researchers who need to search for information related to Triticeae genes with the goal of a greater understanding of Gramineae species. The database should accelerate progress in Triticeae genomics and plant comparative genomics, as well as facilitate molecular breeding programs.
MATERIALS AND METHODS
Prediction and Retrieval of Full-Length CDSs
We retrieved cDNA sequences of completely sequenced wheat (Triticum aestivum) full-length cDNAs using a primer walking method with the Phred/Phrap package (Ewing and Green, 1998) to generate the assembly at RIKEN and the Kihara Institute for Biological Research, Yokohama City University, Japan (K. Kawaura, K. Mochida, A. Enju, T. Totoki, A. Toyoda, Y. Sakaki, C. Kai, J. Kawai, Y. Hayashizaki, M. Seki, K. Shinozaki, and Y. Ogihara, unpublished data). We also retrieved barley (Hordeum vulgare) sequences corresponding to the proper accession IDs that were reported by Sato et al. (2009) from the BarleyDB database (http://www.shigen.nig.ac.jp/barley/) of the Research Institute for Bioresources at Okayama University in Japan.
The sequences were first checked for sequence contamination and extensive simple repeats using the SeqClean script (http://compbio.dfci.harvard.edu/tgi/software/). Vector sequences were then trimmed using the univec_core db of NCBI (http://www.ncbi.nlm.nih.gov/VecScreen/UniVec.html) with the cross_match utility of the Phred/Phrap package. Contamination was identified via BLASTN sequence similarity searches against both the Escherichia coli K12 genome (U00096) and the bacteriophage phi_X174 (J02482) genome sequences. Sequences with a threshold e value less than 1e-100 were removed.
CDS prediction was performed based on the longest ORF using those sequences that had passed through the sequence cleaning step. As supporting information, we used the results for full-length CDS prediction from DECODER (Fukunishi and Hayashizaki, 2001). The nucleotide and deduced amino acid sequences corresponding to the predicted full-length ORFs were used to generate further annotations in TriFLDB. The deduced protein sequences and corresponding CDSs of GenPept entries (GenPept Release 165.0, ftp://ftp.ncifcrf.gov/) were also retrieved using the full-length CDS feature; 2,348 barley sequences and 2,393 wheat sequences were retrieved. Predicted CDSs less than 30 bp in length as well as disproportionately short CDSs (CDS/cDNA < 10%) were then removed. A total of 15,871 CDSs of barley and wheat were entered into TriFLDB (Table I).
Sequence Annotations
To annotate the CDSs of TriFLDB with predicted gene functions, we searched the sequence data against the following protein and nucleotide datasets using the BLAST algorithm (Altschul et al., 1997): the nr protein database of NCBI (ftp://ftp.ncbi.nih.gov/blast/db); UniProt/trembl of EBI (http://www.uniprot.org/downloads); the protein data of RAP-DB v. 2 (http://rapdb.dna.affrc.go.jp/); the TIGR Rice Genome Annotation Project (http://rice.plantbiology.msu.edu/); the protein data for predicted genes of the sorghum (Sorghum bicolor) genome in JGI v. 1.4 (http://genome.jgi-psf.org/Sorbi1/Sorbi1.home.html); the protein data present in TAIR release 7 (ftp://ftp.arabidopsis.org/home/tair/Sequences/blast_datasets/); the cDNA sequences of barley and wheat in UniGene (ftp://ftp.ncbi.nih.gov/repository/UniGene/); the TIGR Plant Transcript Assemblies (http://plantta.jcvi.org/); Plant GDB (http://www.plantgdb.org/); and HarvEST (http://harvest.ucr.edu/). All of the similarity searches using BLASTN were performed with threshold e values of less than 1e-200 for same-species combinations and 1e-100 for cross-species combinations among wheat and barley, and the top scoring hit for each query was applied. All similarity searches with BLASTX and BLASTP against protein datasets to find possible functional descriptions were performed with a threshold e-value of less than 1e-5, and the top scoring hit for each query was applied. The definition strings used for the similarity searches of each database have been assembled as a keyword database to allow users to specify queries with keywords to retrieve relevant gene information from TriFLDB.
Conserved domains in the deduced protein sequence of each TriFLCDS were identified with InterProScan and the InterPro database (http://www.ebi.ac.uk/interpro/). The domain data were also used to assign GO terms to each TriFLCDS, which are also available as search query terms for the TriFLCDSs. Links to each of the original datasets interrelated with the TriFLCDS entries are provided on the TriFLDB Web interface.
Hierarchical Clustering of Deduced Protein Sequences with Plant Proteome Data
The nonredundant set of TriFLCDSs and groupings with other plant proteins on the basis of sequence similarity assists in the identification of the unique genes of Triticeae plants, as well as in acquiring proteins with sequence similarity to those in other plants. Through the use of the CD-HIT package (Li and Godzik, 2006), the TriFLCDSs were hierarchically organized into protein clusters with the protein datasets from Arabidopsis (Arabidopsis thaliana), rice (Oryza sativa), and sorghum using global amino acid sequence identity thresholds of 100% to 30% in 10% decrements. The hierarchically clustered data were imported into a Web-based hierarchical structure-viewing interface.
Clustering of Wheat and Barley ESTs with TriFLCDSs
As of April 15, 2008, the dbEST database of NCBI (NCBI-GenBank Flat File Release 165.0) contained more than 0.5 million entries for barley and more than 1 million for wheat. These sequences were retrieved from GenBank and were cleaned up as follows. First, low-complexity and/or repetitive sequences were removed using SeqClean with the default parameter settings. Repetitive sequence regions of the remaining sequences were identified and masked with RepeatMasker (http://www.repeatmasker.org/), with optional use of the nonredundant Gramineae repeat-sequence dataset derived from TIGR as the target database (Ouyang and Buell, 2004). Vector sequences were then masked using the cross_match utility in the Phred/Phrap package (Ewing and Green, 1998) and the UniVec dataset of NCBI. A similarity search using cross_match against wheat mitochondrial and chloroplast genome sequences was also performed to eliminate contaminant organelle sequences. Finally, ESTs (482,904 for barley and 1,014,305 for wheat) containing ≥100 bp of unmasked sequences were clustered and assembled. Sequence similarity searches between the Triticeae ESTs and full-length CDS data were used to create potential realistic assemblies based on the full-length CDSs of barley and wheat using BLASTN with an e value of ≤1e-20. The ESTs grouped with the TriFLCDS were assembled into contigs using CAP3 (Huang and Madan, 1999) with the default parameter settings. Each ace format file for CAP3 output corresponding to TriFLCDS was applied to retrieve positional information for contig alignment of the assembled ESTs.
Comparative Mapping onto the Rice and Sorghum Genomes
To provide comparative sequence mapping information for the TriFLCDS entries that were allocated to the genome sequences of rice and sorghum, we mapped the nucleotide sequences of TriFLCDSs onto the genome sequences of rice (International Rice Genome Sequencing Project v. 4, http://rgp.dna.affrc.go.jp/IRGSP/download.html) and sorghum (JGI v. 1.4) based on nucleotide sequence similarity. A combination of BLASTN and SIM4 (Pidoux et al., 2003) was used to reduce any inconsistencies in the map positions. To ascertain the most similar regions of the rice and sorghum genomes, a BLASTN similarity search with a threshold e value of less than 1e-10 was conducted to find the highest hit. Then, all other HSPs that were found in a 10-kb window upstream and downstream of the endpoints of the top HSP obtained in the BLAST hit were collected along with the genome sequence. Finally, a region that encompassed a 5-kb window upstream and downstream of the endpoints of the collected HSPs was retrieved to generate pairwise alignments between the retrieved genomic sequence and TriFLCDS.
Pairwise alignment using SIM4 with default parameter settings was then performed to predict the genomic structure in the comparative alignment between the two sequences that were used as input. The comparative genome mapping results have been implemented in Gbrowse with the gene annotations for rice and sorghum provided by RAP-DB and JGI, respectively. To map TriFLCDSs onto the nonannotated regions of each genome, the TriFLCDSs homologous to the plant organelle sequences that were filtered out were mapped onto both genomes and compared with the mapped region using the genome annotations RAP-DB v. 2 and Sbi 1.4. The wheat and barley chloroplast genomes (AB042240, EF115541) and the wheat mitochondrial genome (AP008982) were searched using BLASTN with a threshold e value of less than 1e-20 to subtract possible FLCDSs derived from the organelle genomes.
Data Integration with the Triticeae Mapped EST Database
To assign genetically mapped ESTs to the full-length transcripts of the TriFLDB entries, we searched the dataset of 15,871 TriFLCDS nucleotide sequences with the mapped EST markers housed in TriMEDB (http://TriMEDB.psc.riken.jp/) using BLASTN with a threshold e value of less than 1e-130. The table of relationships between the mapped ESTs and the full-length transcripts generated by this homology search was imported into TriMEDB as a database for Cmap (http://gmod.org/wiki/Cmap) to visualize linkage map images. The comparative data from the mapping of cDNA markers of TriMEDB onto the rice genome were also integrated into the Gbrowse interface of TriFLDB. Cross referencing between the Web interfaces of TriMEDB and TriFLDB was also implemented.
Supplemental Data
The following materials are available in the online version of this article.
Supplemental Figure S1. Schematic overview of representative databases covering genome informatics areas for wheat and barley, together with those for rice and Arabidopsis.
Supplemental Figure S2. Summarized results of similarity-search-based annotation of TriFLCDSs against various sequence resources provided in public domains.
Supplemental Figure S3. A schematic diagram of the database structure of TriFLDB together with that of TriMEDB.
Supplemental Table S1. Distribution of deduced peptide sequences of TriFLCDS with proteome data of Arabidopsis, rice, and sorghum hierarchically clustered by threshold of amino acid identity.
Supplemental Table S2. Summarized results of mapping of similarity between TriFLCDS and the rice and sorghum genome sequences.
ACKNOWLEDGMENTS
The authors thank Dr. K. Sato of Okayama University, Japan, for permitting the integration of released data into TriFLDB. The authors also thank Dr. T. Close of the University of California for permitting integration of the released data from HarvEST barley v. 1.68 to update TriMEDB. We also thank Dr. Y. Hayashizaki of the RIKEN Omics Science Center for DECODER.
LITERATURE CITED
Close TJ, Wanamaker S, Roose ML, Lyon M (
Conte MG, Gaillard S, Lanau N, Rouard M, Perin C (
Donlin MJ (
Duvick J, Fu A, Muppirala U, Sabharwal M, Wilkerson MD, Lawrence CJ, Lushbough C, Brendel V (
Flicek P, Aken BL, Beal K, Ballester B, Caccamo M, Chen Y, Clarke L, Coates G, Cunningham F, Cutts T, et al (
Lee Y, Quackenbush J (
Liang C, Jaiswal P, Hebbard C, Avraham S, Buckler ES, Casstevens T, Hurwitz B, McCouch S, Ni J, Pujar A, et al (
Ozdemir BS, Hernandez P, Filiz E, Budak H (
Ralph SG, Chun HJ, Kolosova N, Cooper D, Oddy C, Ritland CE, Kirkpatrick R, Moore R, Barber S, Holt RA, et al (
Sakurai T, Satou M, Akiyama K, Iida K, Seki M, Kuromori T, Ito T, Konagaya A, Toyoda T, Shinozaki K (
Sato K, Shin IT, Seki M, Shinozaki K, Yoshida H, Takeda K, Yamazaki Y, Conte M, Kohara Y (
Seki M, Shinozaki K (
Tanaka T, Antonio BA, Kikuchi S, Matsumoto T, Nagamura Y, Numa H, Sakai H, Wu J, Itoh T, Sasaki T, et al (
Ware D (
Author notes
Corresponding author; e-mail [email protected].
The author responsible for distribution of materials integral to the findings presented in this article in accordance with the policy described in the Instructions for Authors (www.plantphysiol.org) is: Kazuo Shinozaki ([email protected]).
Some figures in this article are displayed in color online but in black and white in the print edition.
The online version of this article contains Web-only data.
Open access articles can be viewed online without a subscription.
