


Abstract
Mitochondrial complex I is a major avenue for reduced NAD oxidation linked to oxidative phosphorylation in plants. However, the plant enzyme has structural and functional features that set it apart from its counterparts in other organisms, raising questions about the physiological significance of this complex in plants. We have developed an experimental model in which rotenone, a classic complex I inhibitor, has been applied to Arabidopsis (Arabidopsis thaliana) cell suspension cultures in order to dissect early metabolic adjustments involved in cell acclimation to mitochondrial dysfunction. Rotenone induced a transitory decrease in cellular respiration (0–4 h after treatment). Cell respiration then progressively recovered and reached a steady state at 10 to 12 h after treatment. Complex I inhibition by rotenone did not induce obvious oxidative stress or cell death but affected longer term cell growth. Integrated analyses of gene expression, the mitochondrial proteome, and changes in primary metabolism indicated that rotenone treatment caused changes in mitochondrial function via alterations in specific components. A physical disengagement of glycolytic activities associated with the mitochondrial outer membrane was observed, and the tricarboxylic acid cycle was altered. Amino acid and organic acid pools were also modified by rotenone treatment, with a marked early decrease of 2-oxoglutarate, aspartate, and glutamine pools. These data demonstrate that, in Arabidopsis cells, complex I inhibition by rotenone induces significant remodeling of metabolic pathways involving the mitochondria and other compartments and point to early metabolic changes in response to mitochondrial dysfunction.
Complex I (NADH:ubiquinone oxidoreductase; EC 1.6.5.3) is a major entry point into the mitochondrial electron transport chain (ETC) of reductant generated within the mitochondrial matrix. Concomitant proton translocation by complex I is coupled to mitochondrial oxidative phosphorylation, generating ATP. Complex I is composed of over 40 different subunits in eukaryotes with a native mass of 800 to 1,000 kD (Brandt et al., 2003). It has a large hydrophobic arm integral to the inner mitochondrial membrane that contains most of the mitochondrially encoded subunits and a hydrophilic arm that protrudes into the matrix and contains the NADH-binding site and most of the Fe-S clusters.
As complex I represents the sole entry point of electrons from matrix NADH to the electron transport chain in mammals, mutation, damage, or inhibition of the complex has a profound effect on cellular energetics (DiMauro and Schon, 2003). Mutations in complex I subunits are linked to a variety of serious diseases, such as Leber's heredity optic neuropathy and leukodystrophy, and complete absence of complex I is considered lethal. Rotenone, the most potent member of the rotenoids, a family of isoflavonoids produced by Leguminosae plants, has become a classic inhibitor of complex I and a valuable tool to mimic complex I-associated disorders in mammalian systems (Ayala et al., 2007). Its mode of action has been extensively studied in mammals, including the impact of rotenone inhibition on mitochondria due to reverse electron flow through the ubiquinone pool from succinate dehydrogenase, leading to superoxide production from complex I and associated oxidative damage to cell components (Kussmaul and Hirst, 2006). Recent studies have shown that chronic exposure of rodents to rotenone causes Parkinson-like degenerative syndrome, suggesting a link between the disease and complex I function (Betarbet et al., 2000).
Key differences exist between animal and plant complex I, as the role of the complex in plants is complicated by a series of specific peripheral enzymatic associations and the presence of complex I respiratory bypasses. For instance, the final enzyme of ascorbate synthesis in plants, converting galactolactone to ascorbate, is physically associated with complex I (Heazlewood et al., 2003; Millar et al., 2003), as are a series of carbonic anhydrase-like proteins and a range of plant-specific proteins of unknown function (Heazlewood et al., 2003, Perales et al., 2005, Meyer et al., 2007). Complex I is also part of a supercomplex with complex III, in CI:CIII(2) and CI(2):CIII(4) configurations (Eubel et al., 2004; Dudkina et al., 2005). Plants contain bypasses of complex I in the form of type II nonproton pumping NADH and NADPH dehydrogenases, located on both sides of the inner membrane, that can deliver electrons to ubiquinone from the matrix or from the intermembrane space NAD(P)H pool (Rasmusson et al., 2004). These type II NAD(P)H dehydrogenases are rotenone insensitive and, consequently, plant respiration can continue in the presence of the poison (Roberts et al., 1995; Melo et al., 1996), but they do not translocate protons and do not generate ATP.
Plants containing complex I mutations exist and are viable, presumably due to the presence and activation of the type II bypass dehydrogenases that allow alternative means of oxidizing the matrix NADH pool, albeit with a lowered efficiency of coupled oxidative phosphorylation. The best studied case has been the CMSII (for cytoplasmic male sterile) mutant of tobacco (Nicotiana sylvestris), which harbors a deletion in the mitochondrial nad7 gene encoding the NAD7 subunit of complex I (Gutierres et al., 1997; Pineau et al., 2005). CMSII plants lack rotenone-sensitive complex I activity and structure and show a stable inherited phenotype involving delayed germination and development, light-dependent cytoplasmic male sterility, decreased photosynthetic efficiency, modified light acclimation responses, and altered organic acid and amino acid pools and antioxidant defenses (Sabar et al., 2000; Dutilleul et al., 2003a, 2003b, 2005). Interestingly, this mutant also shows enhanced expression of the cyanide-insensitive alternative oxidase (AOX) and enhanced resistance to ozone damage and tobacco mosaic virus infection, suggesting a complicated link between mitochondrial metabolism, cellular redox regulation, and plant stress tolerance mechanisms (Dutilleul et al., 2003b; Vidal et al., 2007).
However, it is extremely difficult to use the comparison of wild-type and mutant phenotypes to understand the short-term events resulting from changes in complex I activity in plants. Mutants and wild types represent distinct steady states separated by an unknown series of events and exhibit pleiotropic effects that do not necessarily portray direct roles of complex I or specific responses to complex I loss. Study of the early events associated with loss of complex I activity not only presents an opportunity to understand the transition from one metabolic state to another but also to uncover elements in the pathway of mitochondrion to nucleus signaling that must occur to initiate these events. In this study, we have used rotenone to inhibit complex I function in an Arabidopsis (Arabidopsis thaliana) cell suspension and have followed cell responses. By combining proteomic, transcriptomic, and metabolomic analyses, we provide a detailed view of how cells manage mitochondrial dysfunction. Complex I inhibition by rotenone led to the induction of alternative respiratory pathways; thus, overall cellular respiration was maintained. Transcript, protein, and metabolite analyses revealed complex metabolic adjustments, with a disengagement of mitochondria from glycolysis.
RESULTS
Rotenone Transiently Inhibits Cell Respiration and Affects Long-Term Cell Growth
![Treatment with rotenone caused a rapid inhibition of respiratory rate and a long-term lowering of cell dry weight (DW) without affecting cell viability. A, Oxygen consumption of intact cells measured at 1, 2 4, 8, 16, and 32 h after treatment with methanol (0.25% [v/v]; white squares, dashed line) or 40 μ m rotenone in methanol (0.25% [v/v]; black squares). Values correspond to means ± se of triplicate determinations. B and C, Cells were collected at time intervals (hours or days) from untreated cell suspensions or suspensions treated with methanol (0.25%, v/v) or 40 μ m rotenone. B, Ratio of cell dry weight of methanol-treated cells (MET) versus untreated cells (white columns) and rotenone-treated (ROT) versus methanol-treated cells (gray columns). Values are means ± se from six independent experiments. Dry weight of rotenone-treated cells was significantly decreased at all time points compared with methanol treatment at P < 0.01. C, Cell viability determined by propidium iodide staining of untreated cells (C; white columns), methanol-treated cells (M; gray columns), and rotenone-treated cells (R; black columns). The proportion of dead, fluorescent cells compared with the total number of cells was determined with an epifluorescence microscope, and data are expressed as percentage cell viability. At least 300 cells were scored per treatment, time point, and flask, with two aliquots per flask and two flasks analyzed per experiment. Data are means ± sd from two independent experiments.](https://oup.silverchair-cdn.com/oup/backfile/Content_public/Journal/plphys/148/3/10.1104_pp.108.125880/2/m_plphys_v148_3_1324_f1.jpeg?Expires=1750216836&Signature=CeRQFTuZqO0zwVFo1~KShx8Uz77k6-cHIaCYGqLGwX5GZl76U0dxmNJeo8SYcNiUzgxYtYF0kaNaH9OZFl2nhNawxJElVuuJSeWiV~U5Z3VHwL1vd1ZniznvdWsCXMLYeRg5EFAlTweoZz3cLFw--hqcLawjXjn1kiXd2~C-O5mFAAdvYYBEkH-8x7bfRRwPycMupzHn79Ntn~0sC0hxIBGY1HDiPG4LHOsCSL08q6TFTX3J77gGeDe-oYaOO9Vml6kMNg0jMg0459RCWQ1gbZr01KsylNVpVQDGPv~~OYxSnSiQdyKfcXKEv3JTSj3aW3GCScAj8yTGPR4P8W4JCg__&Key-Pair-Id=APKAIE5G5CRDK6RD3PGA)
Treatment with rotenone caused a rapid inhibition of respiratory rate and a long-term lowering of cell dry weight (DW) without affecting cell viability. A, Oxygen consumption of intact cells measured at 1, 2 4, 8, 16, and 32 h after treatment with methanol (0.25% [v/v]; white squares, dashed line) or 40 μ m rotenone in methanol (0.25% [v/v]; black squares). Values correspond to means ± se of triplicate determinations. B and C, Cells were collected at time intervals (hours or days) from untreated cell suspensions or suspensions treated with methanol (0.25%, v/v) or 40 μ m rotenone. B, Ratio of cell dry weight of methanol-treated cells (MET) versus untreated cells (white columns) and rotenone-treated (ROT) versus methanol-treated cells (gray columns). Values are means ± se from six independent experiments. Dry weight of rotenone-treated cells was significantly decreased at all time points compared with methanol treatment at P < 0.01. C, Cell viability determined by propidium iodide staining of untreated cells (C; white columns), methanol-treated cells (M; gray columns), and rotenone-treated cells (R; black columns). The proportion of dead, fluorescent cells compared with the total number of cells was determined with an epifluorescence microscope, and data are expressed as percentage cell viability. At least 300 cells were scored per treatment, time point, and flask, with two aliquots per flask and two flasks analyzed per experiment. Data are means ± sd from two independent experiments.
Respiration Acclimation to Rotenone (Phase II) Is Associated with the Induction of Alternative Respiratory Pathways
![Up-regulation of respiratory bypasses of complex I during cell respiratory acclimation to rotenone treatment. A, Quantitative RT-PCR expression profiles of genes encoding external (NDB1 [At4g28220] and NDB2 [At4g05020]) and internal (NDA2 [At2g29990]) alternative NAD(P)H dehydrogenases and an isoform of AOX (AOX1a [At3g22370]). Arabidopsis cell suspension cultures were treated with methanol (0.25% [v/v]; white columns) or 40 μ m rotenone in methanol (0.25% [v/v]; black columns). At time intervals (0, 3, and 12 h after treatment), cells were collected and transcript levels were quantified. Fold induction in transcript levels was calculated as ratio of the transcript abundance of the studied gene to the transcript abundance of actin2 (At3g18780). Asterisks indicate fold induction values that are significantly different (P < 0.01) in rotenone-treated samples compared with methanol samples. Error bars correspond to the se of biological triplicate determinations. B, Oxygen uptake measurements of mitochondria isolated from cell suspensions at 16 h after treatment with methanol (white columns) or 40 μ m rotenone (black columns). Respiration rates were recorded at 25°C on 200 μg of mitochondrial protein with a Clark oxygen electrode as described in “Materials and Methods.” Added substrates, cofactors, and inhibitors are indicated on the x axis. Values are means ± se from at least five independent experiments. Statistically different values (P < 0.01) between methanol and rotenone treatments are indicated by asterisks. C, Left, Immunoblots of AOX proteins in mitochondria purified from cells at 16 h after treatment with methanol (C) or 40 μ m rotenone (Rot). Equal amounts (50 μg) of mitochondrial proteins were loaded in each lane. Two independent sets of mitochondrial protein isolates as shown were loaded onto the same SDS-PAGE gel under reducing conditions (with DTT). Right, Immunoblots of AOX proteins in rapidly extracted membrane fractions from cell suspension cultures at 16 h after treatment with methanol (C) or rotenone (Rot). Cells were ground in an extraction buffer (−), supplemented with the reducing agent DTT or the oxidizing agent diamide (Dia). Replicate gels were stained with Coomassie Brilliant Blue in order to check protein loading. Data shown are representative of three independent experiments.](https://oup.silverchair-cdn.com/oup/backfile/Content_public/Journal/plphys/148/3/10.1104_pp.108.125880/2/m_plphys_v148_3_1324_f2.jpeg?Expires=1750216836&Signature=tHUGKwfNcNQWT9c78cncB7bvmQXvvgoUxwxVWmqDORbTTbuphX5UwT5jpSeKOkrmIvZHN7-ZmU~s4gsUFAvc2pAO1DZBJ96T9ALR4AMbLBdlChUcJoMwmzz5dM~GZxaSqj8fcJywSJF-Wzvy5GgyU6eOtPsxmiZfQsc~LghDangWCcYs9UbvGKn8POVkk8tG0caQ9RLTdVEI8L-lhV6tWsaARBmMr0oGLpKBgzOfIbmrM2nubPcP8JlcG6q2acYAW8qCW7By7-iWgk2X-cKrKbVXfHScggH-WC~kHMoqE7mdS2zVgxNQ6yGvJj12zOfgOslB7mLzdaNuJqUEtEFczg__&Key-Pair-Id=APKAIE5G5CRDK6RD3PGA)
Up-regulation of respiratory bypasses of complex I during cell respiratory acclimation to rotenone treatment. A, Quantitative RT-PCR expression profiles of genes encoding external (NDB1 [At4g28220] and NDB2 [At4g05020]) and internal (NDA2 [At2g29990]) alternative NAD(P)H dehydrogenases and an isoform of AOX (AOX1a [At3g22370]). Arabidopsis cell suspension cultures were treated with methanol (0.25% [v/v]; white columns) or 40 μ m rotenone in methanol (0.25% [v/v]; black columns). At time intervals (0, 3, and 12 h after treatment), cells were collected and transcript levels were quantified. Fold induction in transcript levels was calculated as ratio of the transcript abundance of the studied gene to the transcript abundance of actin2 (At3g18780). Asterisks indicate fold induction values that are significantly different (P < 0.01) in rotenone-treated samples compared with methanol samples. Error bars correspond to the se of biological triplicate determinations. B, Oxygen uptake measurements of mitochondria isolated from cell suspensions at 16 h after treatment with methanol (white columns) or 40 μ m rotenone (black columns). Respiration rates were recorded at 25°C on 200 μg of mitochondrial protein with a Clark oxygen electrode as described in “Materials and Methods.” Added substrates, cofactors, and inhibitors are indicated on the x axis. Values are means ± se from at least five independent experiments. Statistically different values (P < 0.01) between methanol and rotenone treatments are indicated by asterisks. C, Left, Immunoblots of AOX proteins in mitochondria purified from cells at 16 h after treatment with methanol (C) or 40 μ m rotenone (Rot). Equal amounts (50 μg) of mitochondrial proteins were loaded in each lane. Two independent sets of mitochondrial protein isolates as shown were loaded onto the same SDS-PAGE gel under reducing conditions (with DTT). Right, Immunoblots of AOX proteins in rapidly extracted membrane fractions from cell suspension cultures at 16 h after treatment with methanol (C) or rotenone (Rot). Cells were ground in an extraction buffer (−), supplemented with the reducing agent DTT or the oxidizing agent diamide (Dia). Replicate gels were stained with Coomassie Brilliant Blue in order to check protein loading. Data shown are representative of three independent experiments.
After 16 h, when the respiratory rate had recovered and reached an equilibrium (Fig. 1A, phase II), whole cell respiration was further dissected using respiratory inhibitors (Supplemental Fig. S2A). Total oxygen consumption rate, after addition of carbonyl cyanide m-chlorophenylhydrazone to remove adenylate control, was unchanged by rotenone treatment when expressed on a cell dry weight basis. Addition of 1 mm n-propyl gallate (nPG) to inhibit the AOX pathway showed that maximal respiration through the COX pathway was unchanged by rotenone treatment (Supplemental Fig. S2A). Blue-native PAGE (BN-PAGE) separation of respiratory complexes and detection of NADH dehydrogenase activity revealed that complex I was present and active in mitochondria isolated from rotenone-treated cells (Supplemental Fig. S2B), consistent with the evidence that rotenone is a reversible inhibitor and is lost during mitochondrial isolation (Singer, 1979). These gels also showed that the other classic mitochondrial OxPhos complexes were present and had similar total protein stain intensity in both control and rotenone-treated samples. This is consistent with the fact that there were scarcely any transcriptional responses to rotenone treatment by any of the mitochondrial (Supplemental Fig. S3) or nuclear genes encoding components of the OxPhos complexes (Table I
Changes in expression of nucleus-encoded genes for mitochondrial proteins following 3 and 12 h of rotenone treatment
A set of 556 transcripts for nucleus-encoded mitochondrial proteins were extracted from ATH1 microarray data and placed in 18 functional groups. Significant changes in the expression of each group are reported based on Benjamini-Hochberg correction of P values calculated by the Wilcoxon rank sum test. NS, P > 0.05. Details of genes in each category are given in Supplemental Table S2.
Category | 3 h | 12 h | ||||
|---|---|---|---|---|---|---|
| P | Regulation | P | Regulation | |||
| Complex I | NS | – | NS | – | ||
| Complex II | NS | – | NS | – | ||
| Complex III | NS | – | NS | – | ||
| Complex IV | NS | – | NS | – | ||
| ATP synthase | NS | – | NS | – | ||
| Alternative pathways | NS | – | 5.83E-05 | Up | ||
| Protein import and fate | NS | – | 3.33E-05 | Up | ||
| Heat shock proteins and chaperonin | NS | – | 3.33E-05 | Up | ||
| Stress-responsive proteins | NS | – | NS | – | ||
| TCA cycle | NS | – | NS | – | ||
| General metabolism | 6.89E-04 | Up/down | 3.30E-07 | Up | ||
| Translation | 0.01836 | Down | NS | – | ||
| Signaling and structure | NS | – | 3.30E-07 | Up | ||
| Carrier and transporter | NS | – | 0.028826 | Up/down | ||
| DNA replication and transcription | NS | – | 1.46E-04 | Up | ||
| Photorespiration and C1 metabolism | 2.41E-04 | Down | NS | – | ||
| Unknown proteins | NS | – | NS | – | ||
Addition of 1 mm KCN to whole cells to inhibit the COX pathway revealed that the maximal respiratory rate via the AOX pathway had doubled during rotenone treatment. Succinate-dependent respiratory rates of mitochondria isolated from the rotenone-treated and methanol control cells mirrored this selective induction of AOX by rotenone (Supplemental Fig. S2C). Using malate and Glu to provide substrates for complex I and internal NADH dehydrogenases through the tricarboxylic acid (TCA) cycle, we observed no change in the respiratory capacity and no change in the degree of rotenone sensitivity (Supplemental Fig. S2D), consistent with the relatively reversible nature of rotenone inhibition in vivo and its removal during mitochondrial isolation. Rates of external NADH oxidation by mitochondria isolated from rotenone-treated cells were not significantly different from those in control cell mitochondria, but again they showed that AOX activity was greatly enhanced by rotenone treatment (Fig. 2B). Western blots of isolated mitochondria using antibodies to AOX confirmed that AOX protein accumulated in mitochondria after rotenone treatment (Fig. 2C), consistent with the increased capacity of the alternative pathway. The in vivo redox state of AOX was investigated by performing rapid total membrane isolations from control and rotenone-treated cells according to Noguchi et al. (2005). AOX consists of a homodimer of 35-kD monomers covalently linked by a disulfide bridge. Cell membranes were quickly isolated in native conditions or in reducing conditions (extraction buffer supplemented with dithiothreitol [DTT]) or in oxidizing conditions (buffer supplemented with diamide). AOX proteins were immunodetected after separation on nonreducing gels. Increased levels of AOX protein were seen on the total membrane western blots after rotenone treatment, and these were predominantly in the reduced, active form (Fig. 2C). No obvious oxidation of AOX proteins was observed in the cells, indicating that not only was AOX protein induced by rotenone treatment but that it was likely to be in the fully activatable form.
Altogether, these data confirm that rotenone treatment induced an up-regulation of complex I respiratory bypasses [internal and external NAD(P)H dehydrogenases] and the AOX pathway, but without affecting the cytochrome pathway. Transcriptional changes for these components were significant at 12 h after treatment, suggesting that alternative pathway induction is involved in cell respiratory acclimation to rotenone during phase II (Fig. 1A).
Rotenone Affects Ascorbate Abundance But Not Its Redox Poise and Does Not Affect the Glutathione Pool
![Redox status of cells in ascorbate and glutathione content over 48 h after rotenone treatment. White columns, Control treatment (methanol, 0.25% [v/v]); black columns, treatment with 40 μ m rotenone in methanol (0.25% [v/v]). Values are means ± se from three independent experiments. A, Total ascorbate (Asc) content expressed as nmol ascorbate g−1 cell fresh weight (FW). The decrease in ascorbate content between rotenone-treated cells and control cells was significant at P < 0.01 at 1, 8, and 16 h after treatment. B, There was no significant change in the reduced to oxidized ascorbate ratio. C and D, There was no significant change in the total glutathione (GSH) content (C), but the reduced to oxidized glutathione ratio (D) was significantly increased (P < 0.01) in rotenone-treated cells compared with control cells at 4 and 48 h. Dashed lines on the columns indicate levels of the oxidized forms of ascorbate and glutathione.](https://oup.silverchair-cdn.com/oup/backfile/Content_public/Journal/plphys/148/3/10.1104_pp.108.125880/2/m_plphys_v148_3_1324_f3.jpeg?Expires=1750216836&Signature=RQj6mpAqn4bP-2Ht3IC6AcCs7mAgMW~9rhv4EoDGdtQz9qcm0MOtVDEf09pX0DMgPoobpnUmaMyHGJ5Dp2JuU5EQ3oe4zMbcTh98DPSGdjw0nB3~Ly3hLggGcLkQCRobaKuKOaM-U5EmumqsEFJkRwDt6WZxfSRjwZohZFUbty4QYf2P11nAgxDP97hcYWbkJj3nuRkfjP5aNear7rJ4ZyH6xc-QhVCrHwkktDpx1ddEoh5arTYwYN0crKo37p8WZC~LobafoaXebqVUpw6TVUL-mXoYf15C41TVXwYXW3~WZsRydj4TinQl~ZLCjyWyxxVhyFl~1rTRqew0MQDzmg__&Key-Pair-Id=APKAIE5G5CRDK6RD3PGA)
Redox status of cells in ascorbate and glutathione content over 48 h after rotenone treatment. White columns, Control treatment (methanol, 0.25% [v/v]); black columns, treatment with 40 μ m rotenone in methanol (0.25% [v/v]). Values are means ± se from three independent experiments. A, Total ascorbate (Asc) content expressed as nmol ascorbate g−1 cell fresh weight (FW). The decrease in ascorbate content between rotenone-treated cells and control cells was significant at P < 0.01 at 1, 8, and 16 h after treatment. B, There was no significant change in the reduced to oxidized ascorbate ratio. C and D, There was no significant change in the total glutathione (GSH) content (C), but the reduced to oxidized glutathione ratio (D) was significantly increased (P < 0.01) in rotenone-treated cells compared with control cells at 4 and 48 h. Dashed lines on the columns indicate levels of the oxidized forms of ascorbate and glutathione.
Rotenone Induces Changes in Mitochondrial Biogenesis
![Differential gel electrophoresis of changes in the mitochondrial proteome after 16 h of rotenone treatment. Quantitative comparison of mitochondrial samples isolated from control cells (methanol treatment, 0.25% [v/v]) or 40 μ m rotenone-treated cells with differential 2D-DIGE IEF/SDS-PAGE CyDye technology. Proteins from each treatment (50 μg) were bound to different fluorescent dyes, Cy2 (red fluorescence) for control samples and Cy5 (green fluorescence) for rotenone samples, and run through a standard procedure of IEF (pI 3-10NL)/SDS-PAGE. Gels were scanned using the Typhoon Trio Variable Mode Imager. Protein spots that reproducibly changed in abundance following rotenone treatment were selected for further analysis (numbered arrows at bottom). Top, Black and white images generated by the Typhoon Imager. Bottom, Superimposition of gels scanned with the fluorescence mode. Yellow spots, Both dyes present in equal abundance; green spots, up-regulated spots; red spots, down-regulated spots. Three independent sets of mitochondrial isolates and a set of three gels were run and analyzed using DyCyder quantitation software. Protein identification was performed from Coomassie Brilliant Blue-stained gels loaded with a mix of 150 μg of proteins for each treatment. Molecular weight scales are indicated at left of each image.](https://oup.silverchair-cdn.com/oup/backfile/Content_public/Journal/plphys/148/3/10.1104_pp.108.125880/2/m_plphys_v148_3_1324_f4.jpeg?Expires=1750216836&Signature=GGORDdSiGXX~Qz7XfuFq7XY2GScOjdZPGq2z9c4zjpwbL0XLVSID3Xq55ZTstP--ikOU6iPW9y0ri3gqz-8hwPY9YwJV80f~~X8DKXhm7cduYshu36XBpNsA5g-2xw6Cm0y2GYPFJZTIMJmTz3hGpg6glac9SJjHlnDrqNjZZCyU6HyNDRCrwk5chOvwr8SZ2MRtY4fp-RNWTyGr41ZEArSNTyVDnWcT12U33p86BLQys7xI3t-oaI2tqtD9XIWuVlJFbGyaLpbJepUR47Rgy~y1C99fHcPin9u-Pk76z6PZx-yCfTdFwjYCll1iQy4CZ6Mr8pfzmuLVv1LBcl-UHA__&Key-Pair-Id=APKAIE5G5CRDK6RD3PGA)
Differential gel electrophoresis of changes in the mitochondrial proteome after 16 h of rotenone treatment. Quantitative comparison of mitochondrial samples isolated from control cells (methanol treatment, 0.25% [v/v]) or 40 μ m rotenone-treated cells with differential 2D-DIGE IEF/SDS-PAGE CyDye technology. Proteins from each treatment (50 μg) were bound to different fluorescent dyes, Cy2 (red fluorescence) for control samples and Cy5 (green fluorescence) for rotenone samples, and run through a standard procedure of IEF (pI 3-10NL)/SDS-PAGE. Gels were scanned using the Typhoon Trio Variable Mode Imager. Protein spots that reproducibly changed in abundance following rotenone treatment were selected for further analysis (numbered arrows at bottom). Top, Black and white images generated by the Typhoon Imager. Bottom, Superimposition of gels scanned with the fluorescence mode. Yellow spots, Both dyes present in equal abundance; green spots, up-regulated spots; red spots, down-regulated spots. Three independent sets of mitochondrial isolates and a set of three gels were run and analyzed using DyCyder quantitation software. Protein identification was performed from Coomassie Brilliant Blue-stained gels loaded with a mix of 150 μg of proteins for each treatment. Molecular weight scales are indicated at left of each image.
Proteins from mitochondrial samples found to vary in abundance following 16 h of rotenone treatment
The identity of proteins was determined by MS/MS. the predicted molecular weight (MW) and pI of the matched protein and the gel sample are shown along with the MOWSE score, number of peptides matched by tandem mass spectra, and the percentage coverage of the matched sequence. Protein spots with at least 1.5-fold change are presented as increased (+) or decreased (−) by rotenone treatment. Spot numbers shown correspond to protein spots in Figure 4. No. Exp, Number of experiments in which this protein was detected from total of three experiments performed. X, The protein has not been detected in this experiment.
Category | Spot No. | Arabidopsis Genome Initiative No. | Identity | Score | Percentage Coverage | No. of Peptides | Matched MW | Expected MW | Matched pI | Expected pI | No. Exp (DIGE) | Ratio Rotenone/Control | Ratio Experiment 1 | Ratio Experiment 2 | Ratio Experiment 3 |
|---|---|---|---|---|---|---|---|---|---|---|---|---|---|---|---|
| Decreased | |||||||||||||||
| Known mitochondrial | |||||||||||||||
| 1 | At3g02090.1 | Mitochondrial processing peptidase β-subunit (MPP) | 796, 819 | 47, 53 | 25, 29 | 59,123 | 67,000 | 6.3 | 6.3 | 3 | −2.6 | −2.11 | −2.73 | −3.03 | |
| 2 | At4g02930.1 | Elongation factor Tu | 645, 758, 835 | 42, 51, 50 | 24, 29, 25 | 49,379 | 50,000 | 6.25 | 6 | 3 | −2.1 | −1.6 | −2.84 | −1.79 | |
| 3 | At1g08480.1 | Succinate dehydrogenase subunit 6 (SDH6) | 151 | 26 | 6 | 15,803 | 15,000 | 6.28 | 8.2 | 3 | −1.9 | −3.22 | −1.35 | −1.2 | |
| 4 | At5g14590.1 | IDHP-3 isocitrate dehydrogenase | 1,151, 1,275 | 59, 64 | 40, 45 | 54,162 | 55,000 | 8.05 | 6.4 | 3 | −1.5 | −1.67 | −1.46 | −1.47 | |
| 5 | At2g05710.1 | Aconitate hydratase | 197, 386, 118 | 6, 12,3 | 8, 15, 3 | 108,133 | 85,000 | 6.72 | 6.8 | 2 | −2.2 | −2.59 | −1.84 | X | |
| Glycolysis and cytosolic carbon metabolism | 6 | At3g52930.1 | Fru-bisP aldolase | 894, 1,001 | 64, 70 | 33, 35 | 38,516 | 45,000 | 6.05 | 6.6 | 3 | −3.6 | −3.55 | −4 | −3.17 |
| 7 | At3g04120.1 | Glyceraldehyde-3-P dehydrogenase (GAPC) | 674, 561 | 65, 55 | 31, 25 | 36,891 | 45,000 | 6.62 | 7.2 | 3 | −2.7 | −3.35 | −2.76 | −1.91 | |
| 8 | At2g36530.1 | Enolase | 642, 558, 472 | 48, 43, 40 | 22, 25, 19 | 47,689 | 65,000 | 5.54 | 5.5 | 3 | −1.7 | −1.46 | −2.02 | −1.6 | |
| 9 | At3g55440.1 | Triosephosphate isomerase | 510, 574 | 42, 53 | 16, 19 | 27,152 | 29,000 | 5.39 | 5.3 | 3 | −2.3 | −2.94 | −2.65 | −1.2 | |
| 10 | At1g04410.1 | MDH-1 malate dehydrogenase | 510, 412 | 44, 38 | 19, 14 | 35,548 | 45,000 | 6.11 | 6.5 | 3 | −3.5 | −4.32 | −2.71 | −3.55 | |
| 11 | At5g11670.1 | MOX-5 ME (AtNADP-ME2) | 269 | 13 | 8 | 64,372 | 70,000 | 6.01 | 6.3 | 2 | −3.4 | −4 | −2.85 | X | |
| 12 | At1g65930.1 | IDHP-2 isocitrate dehydrogenase | 640, 793, 1,128 | 50, 48, 59 | 23, 29, 36 | 45,717 | 60,000 | 6.13 | 6.8 | 3 | −3.7 | −5.57 | −3.4 | −2.14 | |
| Others | 13 | At5g09810.1 | Actin7/actin2 (ACT7/2) | 479, 654 | 44, 54 | 18, 27 | 41,709 | 55,000 | 5.31 | 5 | 3 | −2.0 | −2.56 | −2.05 | −1.4 |
| 14 | At1g62740.1 | Stress-inducible protein | 417, 817 | 35, 49 | 18, 32 | 64,479 | 80,000 | 5.85 | 6.1 | 3 | −3.2 | −4.2 | −3.36 | −2.16 | |
| 15 | At3g09440.1 | Heat shock 70-kD protein 3 (HSC70-3) | 214, 246 | 16, 15 | 9, 10 | 71,103 | 80,000 | 4.97 | 4.4 | 3 | −3.8 | −4.5 | −4.37 | −2.62 | |
| 16 | At3g17820.1 | Gln synthetase (GS1) | 120, 288 | 12, 18 | 6, 12 | 38,570 | 50,000 | 5.72 | 5.5 | 3 | −2.9 | −2.29 | −3.91 | −2.55 | |
| 17 | At1g62380.1 | 1-Aminocyclopropane-1-carboxylate oxidase | 252, 227 | 29, 22 | 9, 8 | 36,160 | 45,000 | 4.98 | 4.4 | 2 | −2.9 | −3.03 | −2.85 | X | |
| 18 | At3g52880.1 | Monodehydroascorbate reductase | 234, 379 | 27, 32 | 11, 16 | 46,458 | 55,000 | 6.41 | 6.8 | 3 | −4.6 | −4.17 | −5.57 | −4.08 | |
| Increased | |||||||||||||||
| Known mitochondrial | 19 | At4g08900.1 | Arginase | 392, 443 | 28, 32 | 12, 13 | 37,321 | 50,000 | 6.11 | 5.7 | 3 | +2.3 | +2.89 | +2.15 | +1.81 |
| 20 | At5g14780.1 | Formate dehydrogenase | 644, 604, 682 | 48, 43, 49 | 29, 25, 30 | 42,383 | 50,000 | 7.12 | 6.6 | 3 | +1.8 | +1.76 | +1.86 | +1.67 |
Two mitochondrial proteins increased in abundance following rotenone treatment: formate dehydrogenase and arginase (Table II). Three well-known mitochondrial proteins decreased in abundance following rotenone treatment: two belong to the respiratory chain (matrix processing peptidase [MPP] β-subunit and SDH6) and one is part of the translational apparatus (elongation factor Tu). SDH6 is a plant-specific isoform of a subunit of respiratory complex II, but a catalytic role has not been identified for this protein (Millar et al., 2004) and there was no change in succinate-dependent respiration of isolated mitochondria (Supplemental Fig. 2B), indicating that no clear alteration in SDH function occurred. The MPP β-subunit protein spot that decreased more than 2-fold following rotenone treatment is the main spot for this protein on isoelectric focusing (IEF)-SDS-PAGE gels (Millar et al., 2001). Our previous studies have shown that Arabidopsis cell cultures have a lowered in vitro import capacity following rotenone treatment (Lister et al., 2004), that in pea (Pisum sativum) plants import efficiency into mitochondria is decreased by a variety of abiotic environmental stresses that also cause a decrease in abundance of the MPP β-subunit (Taylor et al., 2003, 2005), and that MPP has a high control coefficient in the control of the rate of import in rice (Oryza sativa) during mitochondrial biogenesis (Howell et al., 2007). Thus, this loss of MPP β-subunit may be an important contributor to the lowered import rates after rotenone treatments (Lister et al., 2004).
The microarray analysis showed that none of 556 known mitochondrial components changed transcript abundance significantly at 3 h (P > 0.05 after false discovery rate correction); however, by 12 h, 98 of the 556 had changed, 89 by increasing in abundance (Supplemental Table S2). Analysis of these changes in functional BINs showed a significant induction of components of the alternative pathway, protein import and fate, signaling and structure, general metabolism, heat shock proteins, mitochondrial DNA replication and transcription, and MAM33 glycoproteins after 12 h. Transcripts of genes encoding proteins involved in translation and C1 metabolism, on the other hand, were slightly down at 3 h (Table I).
Rotenone Treatment Induces a Major Shift in Cellular Energy Metabolism
![Glycolytic enzyme activities in whole cells versus mitochondria after rotenone treatment. Measurements of GAPDH and Fru-1,6-bisP aldolase activities on isolated mitochondria and whole cell extracts were taken at 16 h after methanol (0.25% [v/v]; white columns) or 40 μ m rotenone (black columns) treatments. Values are expressed as nmol NADH min−1 mg−1 mitochondrial proteins or total proteins (whole cell extracts). Values are means ± se from three to four independent experiments. Statistical differences in rotenone treatment compared with control (methanol) treatment are indicated by different letters (level of significance: a, P < 0.01; b, P < 0.05).](https://oup.silverchair-cdn.com/oup/backfile/Content_public/Journal/plphys/148/3/10.1104_pp.108.125880/2/m_plphys_v148_3_1324_f5.jpeg?Expires=1750216836&Signature=o4uW0m38WqoagmW-98OsxWCk4BDj7PGuzb7FKdAws9IvhO9z8BBmmbyK3K2C6WNfWf4gTdQQDmnICQTjrSC5LCas6OMLBI3EZEq7NVpsQJAdO3oCWb7iXdwF7iq6tF3w~CR2SbXE3jZhazZ95spjVKVZXdReyRMNRH6FKVcNOnyVNEz5woBEObEGc3wMfFvul3CkiRJllNgFm4kWJ83QIQ6LDLzcWE28w0tMmokAOWR9~U0YGrNCjtscM8aPRCKi1SYQiQWvsBH4a5GC5NS6IuqAP3HoysIV52GXZmhHV5ifDzOAr3GBDTTktevx~wmCauz6-FXKMPbKZwFcIcpK6Q__&Key-Pair-Id=APKAIE5G5CRDK6RD3PGA)
Glycolytic enzyme activities in whole cells versus mitochondria after rotenone treatment. Measurements of GAPDH and Fru-1,6-bisP aldolase activities on isolated mitochondria and whole cell extracts were taken at 16 h after methanol (0.25% [v/v]; white columns) or 40 μ m rotenone (black columns) treatments. Values are expressed as nmol NADH min−1 mg−1 mitochondrial proteins or total proteins (whole cell extracts). Values are means ± se from three to four independent experiments. Statistical differences in rotenone treatment compared with control (methanol) treatment are indicated by different letters (level of significance: a, P < 0.01; b, P < 0.05).
Three other cytosolic carbon metabolism enzymes were also decreased in mitochondrial extracts: NAD-malate dehydrogenase, NADP-malic enzyme (ME), and NADP-isocitrate dehydrogenase (ICDH; Table II); all three of these are directly linked to the import and export of carbon skeletons in mitochondria. Cytosolic malate dehydrogenase and NAD-ME are involved in the connections between malate, OAA, and pyruvate provision to mitochondria and thus can be considered as extensions of the glycolytic pathway, while cytosolic ICDH is involved in converting isocitrate exported from mitochondria to 2-oxoglutarate as a carbon skeleton for nitrogen assimilation. By analogy with the claims made for the functional association of classical glycolytic enzymes with mitochondria, these proteins may also be associated in a functional manner, connecting mitochondrial metabolism with the broader cellular metabolism. The apparent dissolution of these linkages may indicate a degree of disengagement of mitochondria from cytosolic carbon metabolism.
![Time course of metabolite measurements. Quantitative GC-MS analysis of metabolite changes at different times (0, 1, 3, 6, 12, 16, and 24 h) after treatment of cells with 40 μ m rotenone. In parallel, methanol treatment (0.25% [v/v]) was performed as a control. Data are expressed as the ratio of rotenone to methanol signal values and standardized according to the yield of the ribitol internal standard. Ratios that increased significantly (P < 0.05; n = 5) in response to the stress treatment are highlighted in blue, while ratios that decreased significantly (P < 0.05; n = 5) are highlighted in red; boldface values indicates the fold change. Signals that showed no significant change (P > 0.05) are shown in black, while ratios that were significantly changed (P < 0.05) by less than the 20% threshold are shown as boldface values in a black box. Color intensities are related to metabolite response intensities, with more strongly responsive signals highlighted in brighter tones. Three independent experiments were performed. Data from one representative experiment are shown (with samples analyzed from five independently treated flasks of cells).](https://oup.silverchair-cdn.com/oup/backfile/Content_public/Journal/plphys/148/3/10.1104_pp.108.125880/2/m_plphys_v148_3_1324_f6.jpeg?Expires=1750216836&Signature=dHfLeKz8bkMo65JrAqbVIEbGmy8kria3n9xpoJdwyWZQBUf20Zjd0xFlDcL3k5yY2Hv~eSWOfi7fdsdp8tfc8snNNc6AmS2tNV99o~qOI-P4yEttVhqrezMQu82r2pio-tBJJ5jjmvv6AukO0l7e91HtzpxuJgNS9Qwy7TNjTukWhJ4JiL-hTgWChQXc7XDtH2wZROaHI9deOpD7RKx5m3VRyDdowHSKRi4obcvIeTbK62JniUKXMkcN5AX6KxEy4wj48EB7SH9MsghPQFy0~4ciVs04ijLBQ4BT1qUjSQ~RMe44VE-LyUEVkorarcVoeRtK6zm7oOnvJGnCRC5xmA__&Key-Pair-Id=APKAIE5G5CRDK6RD3PGA)
Time course of metabolite measurements. Quantitative GC-MS analysis of metabolite changes at different times (0, 1, 3, 6, 12, 16, and 24 h) after treatment of cells with 40 μ m rotenone. In parallel, methanol treatment (0.25% [v/v]) was performed as a control. Data are expressed as the ratio of rotenone to methanol signal values and standardized according to the yield of the ribitol internal standard. Ratios that increased significantly (P < 0.05; n = 5) in response to the stress treatment are highlighted in blue, while ratios that decreased significantly (P < 0.05; n = 5) are highlighted in red; boldface values indicates the fold change. Signals that showed no significant change (P > 0.05) are shown in black, while ratios that were significantly changed (P < 0.05) by less than the 20% threshold are shown as boldface values in a black box. Color intensities are related to metabolite response intensities, with more strongly responsive signals highlighted in brighter tones. Three independent experiments were performed. Data from one representative experiment are shown (with samples analyzed from five independently treated flasks of cells).
Difference in the specific activity of enzymes in mitochondria from control and rotenone-treated cells
Aconitate hydratase (aconitase), NAD-ME, NAD- and NADP-dependent ICDH, PDC, and OGDC activities were measured on 25 to 50 μg of mitochondrial proteins. Mitochondria were isolated from cells at 16 h after treatment with methanol (0.25% [v/v]; control) or 40 μ m rotenone in methanol (0.25% [v/v]). Asterisks indicate significant changes at P < 0.05 between mitochondrial activities from methanol- or rotenone-treated cells. Values are means ± se of data from four independent experiments.
Sample | Control Mitochondria | Rotenone-Treated Mitochondria | |
|---|---|---|---|
| nmol min−1 mg−1 protein | |||
| Aconitase | 350 ± 55 | 721 ± 160* | |
| NAD-ME | 112 ± 12 | 77 ± 8* | |
| NAD-ICDH | 119 ± 14 | 100 ± 9 | |
| NADP-ICDH | 160 ± 12 | 140 ± 16 | |
| PDC | 111 ± 32 | 82 ± 23 | |
| OGDC | 629 ± 90 | 558 ± 107 | |
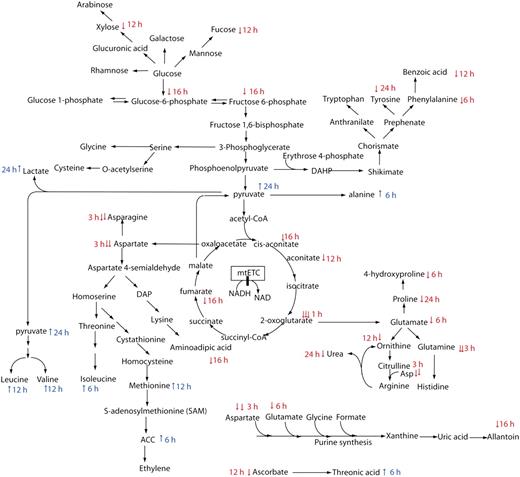
Cartoon of metabolite changes in biochemical pathways after rotenone treatment. The data from Figure 6 were layered onto a metabolic pathway cartoon and annotated by the timing of the first significant change in metabolite abundance after rotenone treatment.
Accumulation of carbon intermediates at the end of the glycolytic pathway led to the accumulation of Ala (first recorded at 6 h) and the pyruvate-derived branched chain amino acids Leu and Val (first recorded at 12 h). By 6 h, there were already net increases in the pyruvate-derived fermentation product lactate. This is consistent with transcriptional increases in the components of the glycolytic pathway (BINs 4.9 and 5) and branched chain amino acid degradation pathways (BINs 13.2.4.1 and 13.2.4.4; Supplemental Table S1) and increased whole cell glycolytic enzymatic activities at 16 h (Fig. 5).
Phosphoenolpyruvate-derived amino acids and compounds in the shikimate pathway decreased from 3 h (Fig. 6) with the exception of Trp, which first increased at 1 h before dropping over the time course. Despite the decrease in Asp and Asn, increases were noted in the homoserine branch of the Asp family of amino acids, notably in Ile, Met, and 1-aminocyclopropane carboxylic acid, while aminoadipic acid in Lys catabolism decreased by half within 16 h. Losses in both the Asp and Glu pools might be expected to alter the biosynthetic functions of the cell, and this can be seen in the decrease in allantoin from the purine synthesis pathway. Decreases in Glu were consistent with decreases in Orn, and the concomitant loss of Asp appears to have lowered the urea cycle and decreased urea abundance by 24 h. As Glu is also the precursor for Pro and thus 4-Hyp, the decrease of the latter compound was also likely to have stemmed from the lowering of TCA cycle activity and 2-oxoglutarate availability (Fig. 7). Late decreases (12–24 h) were also recorded in hexose phosphate pools that either fed, or were fed by, changes in several Glc-derived sugars. However, hexoses have largely reverted to control levels by 24 h.
DISCUSSION
The aim of this work was to identify the early responses of Arabidopsis cells involved in acclimation to complex I dysfunction. The long-term consequences of complex I loss have been studied in several mutant plants, but it is difficult to unravel the initial events involved in the modification of primary metabolism in these plants.
We showed that rotenone treatment induced a two-phase response of Arabidopsis cells: phase I, from 0 to 4 h after treatment, characterized by a strong inhibition of cellular respiration by rotenone; and phase II, from 4 to 32 h, characterized by a progressive recovery of cell respiration to initial rates (Fig. 1A). Phase II was associated with transcriptional and posttranscriptional induction of alternative respiratory pathways, complex I bypasses [NAD(P)H dehydrogenases], and AOX, suggesting that these processes were part of cell acclimation to complex I inhibition. Up-regulation of alternative pathways is a classic adaptive response of plants lacking functional complex I, such as the tobacco CMSII mutant or the Arabidopsis otp43 mutant (Sabar et al., 2000; Falcon de Longevialle et al., 2007), and has already been reported after treatment of Arabidopsis cell cultures with ETC inhibitors (Clifton et al., 2005).
The use of chemical inhibitors raises the possibility of pleiotrophic effects, as both mitochondria and chloroplasts can contain rotenone targets. We used a concentration of 40 μ m because previous experiments have optimized this concentration for cell culture growth and survival (Lister et al., 2004; Clifton et al., 2005) and because at least low micromolar concentrations are needed for maximal complex I inhibition in plant mitochondria (Rasmusson and Møller, 1991). Reports of the impact of rotenone on chloroplast electron transport are largely restricted to concentrations in the 200 μ m to 1 mm range (Igambardiev et al., 1997; Corneille et al., 1998; Ikezawa et al., 2002). The time course data and the molecular data are consistent with a response emanating from mitochondrial ETC inhibition.
From our data, changes in enzyme and protein were correlated with changes in metabolite and transcriptional profiles over the first 24 h of rotenone treatment. These changes included alterations of specific pathways of mitochondrial electron transport, the source of reductant in the matrix and cytosol, and the disengagement of mitochondria from glycolysis and related carbon metabolism. Although most of the changes in transcript, protein, and metabolite levels were observed during phase II “acclimation” (6–24 h), some changes occurred in phase I (1–3 h; Fig. 6), preceding measurable changes in nuclear gene transcription.
Alteration of Mitochondrial Metabolism
Loss of complex I appeared to lead to a degree of disconnection between glycolysis, the TCA cycle, and the electron transport chain. We saw this through a series of cellular changes that reflect this disconnection and that could also be interpreted as attempts to reconcile this problem through the enhancement of alternative metabolic pathways. Even with the availability of time series data, it has been relatively difficult to neatly place these events in series, but it is clear that progressive changes occur in only a few hours that lead to a new steady state appearing within 10 to 12 h. The early decreases in 2-oxoglutarate and Gln/Glu are consistent with slowing of the TCA cycle due to a loss of a major entry point for NADH, complex I. This appears to set in motion a series of changes in metabolism that alter the carbon sources used to drive respiration and also increase capacity to bypass complex I as an entry point, in a complex and interrelated manner.
The loss of glycolytic enzymes from mitochondria (Table II; Fig. 5) suggests a degree of physical disengagement of mitochondria from glycolysis. The observed accumulation of glycolytic end products and associated amino acid pools, together with decreases in early TCA cycle-derived products, suggests that this physical disengagement leads to a degree of functional disengagement. This is consistent with the recent evidence provided by Graham et al. (2007), who observed that the degree of association of glycolytic enzymes with Arabidopsis mitochondria was correlated with respiratory rates and showed a repartitioning of enzyme pools between mitochondria and the cytosol. Giegé et al. (2003) and Graham et al. (2007) provided strong evidence that mitochondrially associated glycolytic enzymes form a functioning glycolytic pathway that can support mitochondrial TCA cycle flux and electron transport chain activity, probably by providing pyruvate through substrate channeling to the mitochondria. If this disconnection of mitochondria from a source of reducing substrate was allowed to take its course, it would most likely have detrimental effects for the cell. Instead, we observed that this disconnection of glycolysis is followed by compensation. Alternative NADH dehydrogenases that can use reductants from the cytosol and the matrix are up-regulated (Fig. 2A). In addition, new dehydrogenases, like formate dehydrogenase, accumulate in mitochondria (Table II) and the branched chain amino acid degradation pathways are induced (Supplemental Table S1, BIN 13), providing new sources of matrix NADH independent of the TCA cycle. Enhanced branched chain amino acid catabolism provides another bypass of complex I, as the electron transfer flavoprotein delivers electrons from this pathway directly to ubiquinone (Ishizaki et al., 2006).
The substrates for these compensatory pathways may, in fact, be provided through the disconnection of glycolysis from mitochondria. As pyruvate cannot enter mitochondria or is not rapidly used in mitochondria, it can be used for the synthesis of Leu and Val, which are key substrates of the branched chain degradation pathway. There is clear transcriptional evidence for the induction of branched chain catabolism components located both within the mitochondria (Supplemental Table S2, BIN 12) and more generally in the cell (Supplemental Table S1, BIN 13) and clear metabolomic data for the increased availability of these amino acids (Figs. 6 and 7). Increased glycolytic flux disconnected from the mitochondria also leads to fermentation and lactate formation, shown by both the transcript and metabolite analysis (Fig. 6; Supplemental Table S1). This raises the potential for enhanced cytosolic NADH levels that could act as the substrate for the external rotenone-insensitive NADH dehydrogenases that are induced by rotenone treatment.
Formate oxidation generates NADH in the matrix, and formate could be provided as a consequence of glycolytic interruption, either from a fermentation aldehyde product or via the predicted pyruvate-lyase reaction. Alternatively, it could be generated via the Met salvage pathway/Yang cycle, as Met and 1-aminocyclopropane carboxylic acid are two of the more rapidly increased metabolites and Met was the only metabolite to significantly increase and then significantly decrease during the 24-h time course (Fig. 6). Interestingly, formate dehydrogenase is also elevated after disruption of a plant-specific subunit of complex I, which leads to a substantial loss of assembly of the respiratory complex (Perales et al., 2005).
Retrograde Signaling during Mitochondrial Dysfunction
Details of the signal transduction pathways that alter nuclear gene expression upon mitochondrial dysfunction remain elusive in plants. Mitochondrial dysfunction leads to changes in a large number of metabolites, and a single one or a combination of several might be involved in the signaling process.
Redox-based signaling is often raised as a key component in mitochondria-nucleus communication (Noctor et al., 2007; Rhoads and Subbaiah, 2007). The complex III inhibitor, antimycin A, has been shown to induce an increase in cellular ROS accumulation, leading to oxidative stress in Arabidopsis cells (Maxwell et al., 1999), and has various regulatory effects on mitochondrial and nuclear gene expression (Sweetlove et al., 2002; Clifton et al., 2005; Vidal et al., 2007). The induction of AOX1a by antimycin A has long been linked to increased mtROS production by complex III inhibition (Saisho et al., 1997; Maxwell et al., 1999). In our experiments, AOX induction by rotenone may suggest an increase in mtROS, although it did not affect whole cell redox status, as ascorbate and glutathione redox state was maintained (Fig. 3). In tobacco complex I mutants, AOX transcript and protein levels are also constitutively high but are also not associated with elevated global ROS levels and oxidative stress (Dutilleul et al., 2003b). It is possible that changes in carbon metabolism trigger the induction of AOX under these circumstances, as shown for soybean (Glycine max) suspension cells (Djajanegara et al., 2002). The lack of oxidative stress induced by rotenone is in stark contrast to the impact of rotenone on mammalian cells in initiating ROS production and oxidation of the GSH pool (Betarbet et al., 2000; Kussmaul and Hirst, 2006; Ayala et al., 2007).
Interestingly, many of the components transcriptionally induced by rotenone belong to the machinery involved in mitochondrial transcription, translation, ETC organization/assembly, and protein fate (Table I; Supplemental Table S2), showing that cells respond by increasing their capacity for mitochondrial biogenesis and ETC protection. Rotenone also induced HSP60s, HSP70s, and HSP90-related proteins, which act as chaperones and ensure the correct function of proteins by preventing the aggregation of denatured proteins, by refolding of stress-denatured proteins, and by assisting in the rapid assembly of the oligomeric protein structures. HSP60 and HSP70 have also been reported to be involved in Arabidopsis cell tolerance to heat stress and to respiration deficiency (Kuzmin et al., 2004; Rikhvanov et al., 2007). In the NCS2 mutant of maize (Zea mays), complex I impairment is also correlated with an increase in the expression of genes encoding a mitochondrial HSP60 and mitochondrial and cytosolic HSP70s (Kuzmin et al., 2004). It was suggested that the decrease in ETC deficiency due to AOX induction decreased the mitochondrial transmembrane potential, and this in turn activated signaling response(s), leading to increased expression of hsp genes. It was proposed that cytosolic HSP would control the cellular redox state and the integrity of mitochondria, while mitochondrial HSP would protect the respiratory complexes and sustain their assembly. A retrograde signal, other than a ROS-dependent one, was suggested to be involved in such a response.
Many stress-responsive genes are repressed during normal plant development, and stress-induced expression could be due to the unbinding of a repressor rather than the binding of an activator molecule. Given this, the initial signal might also be loss of a normally present component rather than either the extraordinary accumulation of a primary metabolite or the generation of a specific “stress signaling” component. In this context, 2-oxoglutarate, Asp, and Gln pools rapidly responded to rotenone inhibition, decreasing significantly by 1 h (Fig. 6) and preceding transcriptional responses of genes for nucleus-encoded mitochondrial components (Fig. 2A; Table I). Consistent and prolonged elevation of other metabolic components (Fig. 6) did not occur significantly until some hours later, and in many instances this could have been caused by the loss of these primary metabolites. In yeast, evidence has accumulated that 2-oxoglutarate and Glu are probable signals in retrograde regulation of mitochondrial function. Glu is a potent repressor of the retrograde-dependent expression of genes that leads to 2-oxoglutarate formation (notably peroxisomal and mitochondrial citrate synthase and mitochondrial aconitase and ICDH), so loss of Glu leads to enhanced expression of these enzymes in a pathway allowing truncated TCA cycle function during respiratory deficiency (Liu and Butow, 1999, 2006).
Links between the Effects of Short-Term Complex I Deficiency and the Phenotypes of Complex I Mutants
Complex I dysfunction has been reported to have various effects on plant growth and development. Rotenone treatment did not alter cell viability but reduced growth (Fig. 1). A similar growth reduction was seen in suspension cell cultures generated from Arabidopsis plants with a knockout of a γ-carbonic anhydrase-like complex I subunit (Perales et al., 2005). In the tobacco CMSII line, absence of complex I is correlated with partial male sterility, reduced germination, and slow growth (Gutierres et al., 1997; Sabar et al., 2000). More severe phenotypes are reported for the otp43 mutation (leading to a loss of mitochondrial nad1 expression) in Arabidopsis, which, while male fertile, is severely affected in seed development and plant growth rate (Falcon de Longevialle et al., 2007). In NCS2 maize plants, complex I mutation causes lethality during kernel development, and it was only possible to maintain them as heteroplasmic lines (Karpova et al., 2002). Our rotenone treatments confirm that complex I deficiency is not lethal for plant cells; however, the ensuing metabolic adjustments are not sufficient to sustain a high rate of growth and may prove unviable during specific points in the life cycle, such as seed set and germination.
As observed after rotenone treatment, AOX and/or alternative dehydrogenase pathways are increased in leaves of different complex I mutant plants, at the level of gene expression, protein accumulation, or respiration rates (Sabar et al., 2000; Karpova et al., 2002; Falcon de Longevialle et al., 2007). In CMSII plants lacking complex I activity, leaf respiration was not decreased in the dark when malate and pyruvate were used as substrates, suggesting that TCA cycle activity is sustained by alternative dehydrogenase and complex II activities (Dutilleul et al., 2003a; Sabar et al., 2000). Leaf respiration is even slightly increased, suggesting that CMSII mitochondria may have increased electron flux through the COX pathway in order to sustain ATP production (Dutilleul et al., 2003a; Vidal et al., 2007). This is consistent with the recovery of steady-state respiratory rates in response to rotenone over a 12- to 16-h period.
The metabolite profile of CMSII leaves is enriched in amino acids with low carbon to nitrogen ratios and depleted in both starch and 2-oxoglutarate (Dutilleul et al., 2005). Interestingly, the deficiency in 2-oxoglutarate in the CMSII plants occurred despite higher citrate and malate levels and increased NAD-ICDH capacity than in the wild type. Oxoglutarate content was also significantly reduced following rotenone treatment, showing that it is a common response to complex I deficiency (Figs. 6 and 7). Moreover, this change was one of the earliest changes recorded, suggesting that it may play a key role in metabolic adjustment and the signaling of ETC dysfunction. The shift in abundance to compounds with low carbon-nitrogen ratios in CMSII could be seen in the alteration of the 2-oxoglutarate-Glu-Gln and Asp-Asn ratios (Dutilleul et al., 2005). In this plant, a 2-fold increase in total free amino acids has been reported, most notably in Arg, whereas carbohydrate abundance, such as Suc and Glc, was reduced. We reported here different consequences of rotenone complex I inhibition on the carbon-nitrogen ratio. Indeed, although a decrease in carbohydrate content was detected and Arg was increased, we also observed decreased levels for some amino acids, especially Glu, Gln, Asp, and Asn, and for organic acids (Figs. 6 and 7). These contrasting effects between rotenone and mutation-induced complex I inhibition may have different explanations. First, a decrease in some amino acids may correspond to an early, transitory response to complex I inhibition and may later evolve to a readjustment correlated with acclimation to a new steady state, but proving this would need much more data. Second, it is difficult to compare Arabidopsis and N. sylvestris, as these two plants belong to different plant families, requiring different environmental conditions to grow and thus having different metabolism. Third, rotenone was applied on heterotrophic Arabidopsis cell suspension cultures grown in the dark, whereas the CMSII plants were analyzed in light conditions. As complex I has been shown to be involved in photosynthesis performance (Dutilleul et al., 2003a), it is thus highly probable that repercussion of complex I inhibition is different in the dark and in the light.
CONCLUSION
Using rotenone inhibition in Arabidopsis cell cultures, we have shown that plant cells respond to the loss of complex I function by readjusting their electron transport properties and general cellular carbon and nitrogen metabolism to minimize oxidative stress and allow cell survival. This provides insights into the molecular and metabolic phenotypes of complex I mutants and also highlights very early changes in metabolite concentrations that may function in retrograde signaling to the nucleus upon changes in mitochondrial function.
MATERIALS AND METHODS
Arabidopsis Cell Culture, Plant Growth, and Treatments
A heterotrophic cell suspension culture of Arabidopsis (Arabidopsis thaliana ecotype Landsberg erecta) was maintained on Murashige and Skoog basal salt medium as described by Sweetlove et al. (2002). Cells was routinely grown at 22°C under the light (100 μE m−2 s−1) on an orbital shaker (130 rpm) and subcultured every 7 d by transferring a volume (about 20 mL) corresponding to 3.5 g of fresh cell weight to 100 mL of fresh Murashige and Skoog medium in 250-mL flasks. Cell cultures used in the following experiments were then grown in the dark (22°C) with shaking (130 rpm). Cell cultures (4 d after subculture) were treated with 40 μ m (v/v) rotenone. Rotenone was purchased from Sigma-Aldrich, and stocks were made in methanol (final volume of methanol, 0.25% [v/v] in 120 mL of cell culture). Methanol (final volume, 0.25% [v/v]) was also applied on cell cultures as a control. Cells were collected at intervals by filtration and washed with fresh Murashige and Skoog medium. Fresh and dry weights of 10-mL aliquots of cell suspension were determined. Cell viability was also checked by staining aliquots with propidium iodide (2 μg mL−1 final). The proportion of dead cells was counted using an epifluorescence microscope (excitation, 546 nm; emission, 590 nm). At least 300 cells were scored per treatment, time point, and flask.
Transcript Analysis
Total RNA from treated and control samples was extracted using the Qiagen Plant RNeasy kit, and genomic DNA was removed using DNA-free DNase (Ambion). Complete removal of both mitochondrial and nuclear DNA was checked by PCR on diluted RNA prior to RT with random primers (SuperScript III; Invitrogen). Quantitative PCR was performed with the LightCycler 480 real-time PCR system (Roche) using the LightCycler 480 SYBR Green 1 Master Mix and the primer sets detailed in Supplemental Table S3, originally developed by Clifton et al. (2005) and Falcon de Longevialle et al. (2007). Microarray ATH1 chip hybridizations were conducted following Affymetrix instructions using the same RNA samples as for the quantitative RT-PCR. All experiments were done on three biological replicates. Microarray data analysis was conducted using AVADIS (Strands). Arrays were normalized using PLIER (for Probe Logarithmic Intensity Error). A stringent false discovery rate correction was applied to P values when individual fold changes were studied (Nettleton, 2006) but not when genes were studied in functional groups. The latter was conducted using MapMan (Thimm et al., 2004; http://gabi.rzpd.de/projects/MapMan/) with the Ath_AFFY_TAIR7 mapping file (Supplemental Table S1) or the functional groups defined in Supplemental Table S2. A Benjamini-Hochberg correction was applied to the P values calculated by the Wilcoxon rank sum test.
Isolation of Mitochondria from Arabidopsis Cell Culture
Mitochondria were isolated and purified by differential centrifugations followed by two Percoll step gradients according to the method of Millar et al. (2001). After two final washes in Suc buffer (0.3 m Suc and 10 mm TES-NaOH, pH 7.5) and centrifugations at 24,000g, 4°C, for 15 min, mitochondria were resuspended in a small volume of Suc buffer. Mitochondrial proteins were quantified using the Coomassie Plus Kit (Pierce). Aliquots of 50, 150, and 500 μg of mitochondrial proteins were immediately snap frozen in liquid nitrogen and stored at −80°C until use. Respiration rates were determined on the remaining fresh mitochondria.
Measurements of Oxygen on Whole Cells and Mitochondria
Oxygen consumption was measured using a Clark-type oxygen electrode (Hansatech Instrument) in 1 mL of reaction medium. Respiration on whole Arabidopsis cell culture was performed at 22°C by suspending 300 μL of cell culture in 700 μL of fresh cell medium. Total respiration was measured after the addition of the uncoupler carbonyl cyanide m-chlorophenylhydrazone (4 μ m). Subsequent addition of 1 mm nPG to inhibit the AOX pathway or 1 mm KCN to inhibit the COX pathway allowed measurements of maximal activity of the COX and AOX pathways, respectively. Respiration rates on isolated mitochondria were determined at 25°C on 200 μg of mitochondrial proteins suspended in the reaction medium (0.3 m Suc, 5 mm KH2PO4, 10 mm TES, 10 mm NaCl, 2 mm MgSO4, and 0.1% bovine serum albumin [w/v], pH 7.2). Different substrates, cofactors, and inhibitors were successively added to the reaction medium to modulate oxygen consumption by mitochondria. Total respiration was measured in the presence of succinate (10 mm) and ATP (0.5 mm). Maximal capacity of the AOX pathway was measured after successive additions of the complex III inhibitor myxothiazol (2.5 μ m), activators of AOX, pyruvate (10 mm), and the reductant DTT (5 mm), and finally the AOX inhibitor nPG (0.5 mm). Respiration rate through the COX pathway was measured in the presence of nPG (0.5 mm) and the complex IV inhibitor KCN (1 mm). Total respiration was also measured in the presence of Glu (10 mm) and malate (10 mm), which provide substrates for complex I and internal NADH dehydrogenases through the TCA cycle. In this case, the pH of the reaction medium was adjusted to 6.8. To Glu and malate were added coenzyme A (12 μ m), thiamine pyrophosphate (0.2 mm), NAD+ (2 mm), and ADP (0.3 mm) in order to initiate electron transport. Rotenone (5 mm), nPG (0.5 mm), and KCN (1 mm) were then added. The capacity of mitochondria to use external NADH was measured by additions of NADH (1 mm), CaCl2 (0.1 mm), and ADP (0.3 mm) and then myxothiazol (2.5 μ m), DTT (5 mm)/pyruvate (10 mm), and nPG (0.5 mm). Mitochondrial integrity was measured by following oxygen uptake after the addition of ascorbate (10 mm), cytochrome c (25 μ m), and Triton X-100 (0.05%, w/v). In all experiments, it was consistently better than 90%.
One-Dimensional SDS-PAGE and AOX Immunodetection
In order to study AOX content and redox state in treated cells, one-dimensional SDS-PAGE and western blot analysis were performed on mitochondrial proteins or on membrane proteins quickly extracted from whole cells. For mitochondrial proteins, 50 μg of proteins was solubilized in sample buffer (2% SDS, 125 mm Tris-HCl, 10% glycerol, 10% β-mercaptoethanol, and 0.002% bromphenol blue, pH 6.8) and heated at 95°C for 3 min before loading onto a polyacrylamide gel. For isolated cell membranes, 0.5 g of cells was ground at 4°C in 1 mL of an extraction buffer (0.45 m mannitol, 50 mm TES, 0.5% bovine serum albumin, 0.5% polyvinylpyrrolidone-40, 2 mm EGTA, 20 mm ascorbate, and a proteinase inhibitor tablet [Roche], pH 8.0) as described by Noguchi et al. (2005). The homogenate was centrifuged for 5 min at 1,100g, and the resulting supernatant was centrifuged for 5 min at 10,000g. The pellet was resuspended in 200 μL of sample buffer (without β-mercaptoethanol), and 50 μL was loaded onto a polyacrylamide gel. Cell samples were also ground in extraction buffer including DTT (50 mm) that reduces AOX in its monomer form or diamide (30 mm) that oxidizes AOX in its dimer form, and membranes were resuspended in sample buffer including DTT or diamide. Proteins were separated according to standard protocols using 12% (w/v) polyacrylamide and 0.1% (w/v) SDS gels. For immunodetection, separated proteins were transferred onto a polyvinylidene difluoride membrane (Immobilon-P; Millipore) and incubated with a primary monoclonal antibody raised against Sauromattum guttatum AOX (Elthon et al., 1989). A chemiluminescence detection system linked to horseradish peroxidase was used as a secondary antibody (GE Healthcare). Images of the membrane were recorded using a Luminescent Image Analyzer (LAS 100; Fuji).
BN-PAGE and Complex I Activity Assay
BN-PAGE was performed according to the method described by Jansch et al. (1996). Mitochondrial proteins (500 μg) were solubilized with digitonin (5% [w/v] digitonin, 150 mm acetate, 10% glycerol, and 30 mm HEPES-HCl, pH 7.4), and after 20 min at 4°C, Serva Blue G (5%, v/v) was added to the supernatant. The sample was then loaded onto a two-layer polyacrylamide gel with a stacking gel and a separation gel (respectively 4% and 4.5%−16% acrylamide:bis-acrylamide [33:1] gels). Gels were stained with colloidal Coomassie Brilliant Blue G250 or directly used for in-gel complex I activity assay.
Complex I (NADH dehydrogenase) activity was measured after protein separation by BN-PAGE according to Zerbetto et al. (1997). The gel was washed for 5 min, four times, with distilled water and incubated in the reaction medium (0.14 mm NADH, 1.22 mm nitroblue tetrazolium, and 0.1 m Tris-HCl, pH 7.4). When the complex was visible as a dark-blue color band, the reaction was stopped by transferring the gel in 40% methanol:10% acetic acid (v/v).
Two-Dimensional Fluorescence Difference Gel Electrophoresis
The two-dimensional fluorescence difference gel electrophoresis (2D-DIGE) technology was used to allow comparison on one gel of mitochondrial protein contents from two different samples: mitochondrial proteins from control cells (treated with methanol) and mitochondrial proteins from rotenone-treated cells. Proteins of each sample were first individually labeled with CyDye fluorophores according to the manufacturer's instructions (GE Healthcare). Proteins were precipitated by incubating purified mitochondria overnight at −20°C in acetone. After centrifugation at 20,000g, 4°C for 20 min, pellets were resuspended in 10 μL of DIGE lysis buffer (8 m urea, 4% CHAPS, and 40 mm Tris, pH 8.5) and centrifuged again at 12,000g, 4°C for 10 min in order to remove unsolubilized material. Fifty micrograms of proteins of each sample (proteins from methanol- and rotenone-treated cells) were stained with a different CyDye (Cy-2 or Cy-5) by addition of 400 pmol of dye (freshly diluted in dimethylformamide) and incubation on ice in the dark for 30 min. The reaction was stopped by incubating samples for 10 min on ice in the dark with 10 nmol of Lys. An equal volume (12 μL) of DIGE lysis buffer with 22 mm DTT was added to each sample. Each of the labeled protein samples was mixed, and rehydration buffer (8 m urea, 4% CHAPS, 0.5% 3–10 nonlinear immobilized pH gradient buffer, 18 mm DTT, and 0.001% [w/v] bromphenol blue) was added to give a final volume of 450 μL. The mix was loaded onto a strip of 24 cm in length with an immobilized nonlinear pH gradient of 3 to 10 (Immobiline DryStrip; GE Healthcare). Rehydration of the strips and the first IEF dimension electrophoresis were performed on an IPGphor Unit (GE Healthcare) using the following settings: 12 h at 30 V (rehydration step), 1 h at 500 V, 1-h gradient from 500 to 1,000 V, 1-h gradient from 1,000 to 3,000 V, 2-h gradient from 3,000 to 8,000 V, and 5 h at 8,000 V. After IEF, strips were incubated for 15 min in an equilibration buffer (6 m urea, 2% SDS, 26% glycerol, 65 mm DTT, 0.001% [w/v] bromphenol blue, and 50 mm Tris-HCl, pH 8.8) and then for 15 min in an equilibration buffer containing iodoacetamide (6 m urea, 2% SDS, 26% glycerol, 135 mm DTT, 0.001% [w/v] bromphenol blue, and 50 mm Tris-HCl, pH 8.8). The equilibrated strips were then loaded on top of a 12% acrylamide gel. Following separation, gels were scanned using the Typhoon Trio Variable Mode Imager at a resolution of 100 (pixel size) with the photomultiplier tube set to 500 V. Proteins were visualized using the Typhoon Scanner Control software (version 5.0) and processed (quantification) using DeCyder 2-D Differential Analysis software version 6.5 (GE Healthcare). In order to get statistical significance from these experiments, three sets of proteins (control and “rotenone” proteins) from three independent experiments were labeled and submitted to electrophoresis. Standard gels were also used, and precipitation, IEF, and SDS-PAGE were run in parallel with labeled samples. These standard gels were loaded with a mix of 150 μg of each protein sample (control and rotenone). After electrophoresis, proteins were visualized by colloidal Coomassie Brilliant Blue G250 staining (Sweetlove et al., 2002). The aims of these gels were to check profiles between labeled and unlabeled samples and to allow the identification of proteins by excising gel spots from colloidal Coomassie Brilliant Blue-stained gels.
Identification of Proteins by Liquid Chromatography-Tandem Mass Spectrometry
Gel spots to be analyzed were cut from colloidal Coomassie Brilliant Blue-stained gels. Proteins were digested with trypsin (trypsin sequencing grade; Roche Diagnostic) according to Sweetlove et al. (2001). Prior to mass spectrometry, peptides were resuspended in 5% acetonitrile/0.1% formic acid (v/v). Samples were analyzed with an Agilent 1100 series capillary liquid chromatography system and an Agilent Technologies XCT Ultra IonTrap with an electrospray ionization source equipped with a low-flow nebulizer in positive mode controlled by Chemstation (Rev B.01.03 [204]; Agilent Technologies) and MSD Trap Control version 6.0 (Build 38.15) software (Bruker Daltonik). Samples were loaded with the Agilent 1100 series capillary liquid chromatography system onto a 0.5- × 50-mm C18 (5 μm, 100 Å) reverse-phase column (Higgins Analytical) with a C18 OPTI-GUARD guard column (Optimize Technologies) at 10 μL min−1 equilibrated with 5% acetonitrile and 0.1% formic acid under a regulated temperature of 50°C. Peptides were eluted from the C18 reverse-phase column at 10 μL min−1 into the XCT Ultra by a 9-min acetonitrile gradient (5%−60%) in 0.1% formic acid at 50°C. Initial ion detection utilized a mass range of 200 to 1,400 mass-to-charge ratio (m/z) with a scan mode set to 8,100 m/z per second. Ions reaching an intensity of 80,000 counts per second were sent to tandem mass spectrometry (MS/MS) analysis, and two precursors were selected for the initial MS scan. MS/MS conditions employed SmartFrag for ion fragmentation (scan range, 70–2,200 m/z). Resulting MS/MS spectra were exported from the Data Analysis for the LC/MSD Trap version 3.3 (Build 149) software package (Bruker Daltonik) using default parameters for AutoMS(n) and compound Export. For protein identification, data generated from MS/MS spectra were blasted against The Arabidopsis Information Resource (release 6) Arabidopsis database using the Mascot search engine (Matrix Sciences). Searches were conducted with parameters set at error tolerances of ±1.2 for MS and ±0.6 for MS/MS and with “max. missed cleavages” set to 1. Results were filtered using “standard scoring,” “max. number of hits” set to 20, and “significance threshold” at P < 0.05.
TCA Cycle and Glycolysis Activity Measurements
Activities were measured on purified mitochondria according to methods optimized for plant mitochondrial activities: aconitase (EC 4.2.1.3), NAD-ME (EC 1.1.1.39), pyruvate dehydrogenase complex (PDC), and 2-oxoglutarate dehydrogenase complex (OGDC) as described by Millar et al. (1999); NAD- and NADP-dependent ICDH (EC 1.1.1.41 and 1.1.1.42) as described by Millar et al. (1999) and Rasmusson and Møller (1990). Fru-1,6-bisP aldolase (EC 4.1.2.13) and GAPDH (EC 1.2.1.12) activities were measured on isolated mitochondria and whole cell extracts as described by Bardey et al. (2005). Triton X-100 (0.05%, v/v) was added to reaction media in order to solubilize membranes. PDC, OGDC, NAD-ME, NAD(P)-ICDH, and aconitase activities were assessed on 25 to 50 μg of proteins, and GAPDH and Fru-1,6-bisP aldolase were assessed on 100 and 200 μg, respectively.
Metabolite Extraction and GC-MS Analysis
Metabolites were extracted from frozen Arabidopsis cells according to a method adapted from Roessner-Tunali et al. (2003). Frozen cells (approximately 50 mg) were ground to a fine powder (without thawing) in a ball mill and extracted with metabolite extraction medium (85% [v/v] HPLC-grade methanol [Sigma], 15% [v/v] untreated MilliQ water, and 100 ng μL−1 ribitol) for 15 min at 65°C with 1,400 rpm shaking. Tubes were centrifuged for 10 min at 20,000g and 4°C in order to pellet cell debris. Supernatants (50 μL) were dried for 2 h in a SpeedVac system. Prior to GC-MS analysis, polar metabolites were derivatized. A first derivatization was performed by addition of 20 μL of methoxyamine hydrochloride (stock solution of 20 mg mL−1 in pyridine) on the dry metabolite pellet and incubation for 90 min at 30°C with shaking (1,400 rpm). A second derivatization was performed by addition of 30 μL of N-methyl-N-(trimethylsilyl)trifluoroacetamide (Sigma Aldrich) and incubation for 30 min at 37°C with shaking (1,400 rpm). Ten microliters of a retention time standard mixture (0.29% [v/v] n-dodecane, 0.29% [v/v] n-pentadecane, 0.29% [w/v] n-nonadecane, 0.29% [w/v] n-docosane, 0.29% [w/v] n-octacosane, 0.29% [w/v] n-dotriacontane, and 0.29% [w/v] n-hexatriacontane dissolved in anhydrous pyridine) was then added to each tube, and the samples were transferred to GC-MS vials for analysis.
Derivatized metabolite samples were analyzed on an Agilent GC/MSD system composed of an Agilent GC 6890N gas chromatograph fitted with a 7683B Automatic Liquid Sampler and 5975B Inert MSD quadrupole MS detector (Agilent Technologies). The gas chromatograph was fitted with a 0.25-mm i.d., 0.25-μm film thickness, 30-m Varian FactorFour VF-5ms capillary column with 10 m integrated guard column (Varian). GC-MS run conditions were essentially as described for GC-quadrupole-MS metabolite profiling on the Golm Metabolome Database Web site (http://csbdb.mpimp-golm.mpg.de/csbdb/gmd/analytic/gmd_meth.html; Kopka et al., 2005). Samples were injected into the split/splitless injector operating in splitless mode with an injection volume of 1 μL, purge flow of 50 mL min−1, purge time of 1 min, and a constant inlet temperature of 300°C. Helium carrier gas flow rate was held constant at 1 mL min−1. The GC column oven was held at the initial temperature of 70°C for 1 min before being increased to 76°C at 1°C min−1 and then to 325°C at 6°C min−1 before being held at 325°C for 10 min. Total run time was 58.5 min. Transfer line temperature was 300°C. MS source temperature was 230°C. Quadrupole temperature was 150°C. Electron impact ionization energy was 70 eV, and the MS detector was operated in full scan mode in the range 40 to 600 m/z with a scan rate of 2.6 Hz. The MSD was pretuned against perfluorotributylamine mass calibrant using the “atune.u” autotune method provided with Agilent GC/MSD Productivity ChemStation Software (version D.02.00 SP1; Agilent Technologies). Raw GC-MS data preprocessing and statistical analysis were carried out using in-house Metabolome-Express software (version 1.0). Detailed methods are supplied as Supplemental Materials and Methods S1.
Ascorbate and Glutathione Assays
After collection, cells were snap frozen in liquid nitrogen and stored at −80°C. Frozen cells were ground to a fine powder with liquid nitrogen and homogenized in 1 m perchloric acid (with a cell biomass:perchloric acid ratio of 1:5 [w/v]). After centrifugation for 15 min at 15,000g and 4°C, a volume of 0.1 mL of 0.12 m NaH2PO4 (pH 5.6) was added to 0.5 mL of supernatant and the pH was adjusted to a value between 5 and 6 with 2.5 m K2CO3. Insoluble KClO4 was removed from samples by centrifugation at 15,000g for 5 min at 4°C. Ascorbate and glutathione were determined in the same supernatant by spectrophotometry as described by Dutilleul et al. (2003b).
Statistical Analysis
ANOVA was performed with StatBox 6.6 software (Grimmersoft). Data are expressed as means ± se or sd as specified.
Supplemental Data
The following materials are available in the online version of this article.
Supplemental Figure S1. Continuity of rotenone inhibition during the time course of cell treatment.
Supplemental Figure S2. Analysis of respiratory rates of whole cells and isolated mitochondria and analysis of mitochondrial OxPhos complexes by BN-PAGE after rotenone treatment.
Supplemental Figure S3. Transcriptional response of mitochondria-encoded genes for mitochondrial components following rotenone treatment.
Supplemental Table S1. Microarray analysis of the transcription response of nucleus-encoded genes to rotenone treatment.
Supplemental Table S2. Microarray analysis of the transcription response of nucleus-encoded genes for mitochondrial components to rotenone treatment.
Supplemental Table S3. Primer sequences used in the quantitative RT-PCR experiments.
Supplemental Materials and Methods S1. Detailed methodology of GC-MS data analysis.
ACKNOWLEDGMENTS
From the Australian Research Council Centre of Excellence in Plant Energy Biology, we thank Holger Eubel, Alison M. Winger, and Etienne H. Meyer for assistance with BN-PAGE and 2D-DIGE technologies and Joshua L. Heazlewood for advice and assistance with peptide mass spectrometry.
LITERATURE CITED
Bardey V, Vallet C, Robas N, Charpentier B, Thouvenot B, Mougin A, Hajnsdorf E, Regnier P, Springer M, Branlant C (
Brandt U, Kerscher S, Dröse S, Zwicker K, Zickermann V (
Gutierres S, Sabar M, Lelandais C, Chetrit P, Diolez P, Degand H, Boutry M, Vedel F, de Kouchkovsky Y, De Paepe R (
Igambardiev AU, Zhou G, Malmberg G, Gardestrom P (
Kopka J, Schauer N, Krueger S, Birkemeyer C, Usadel B, Bergmüller E, Dörmann P, Weckwerth W, Gibon Y, Stitt M, et al (
Melo AMP, Roberts TH, Møller AM (
Noguchi K, Taylor NL, Millar AH, Lambers H, Day DA (
Pineau B, Mathieu C, Gerard-Hirne C, De Paepe R, Chetrit P (
Author notes
This work was supported by the Australian Research Council (grant no. CE0561495 to A.H.M., I.D.S., and D.A.D.) through the Centre of Excellence program. M.G. was the recipient of an Australian Research Council Linkage International fellowship (no. LX0560236), A.J.C. was the recipient of a Grains Research and Development Corporation Postgraduate Award, I.D.S. was supported as a Western Australia Premier's Fellow, and A.H.M. is an Australian Research Council Australian Professorial Fellow (award no. DP0771156).
Present address: Institut de Biotechnologie des Plantes, Université Paris-Sud 11, CNRS, UMR 8618, Bâtiment 630, 91405 Orsay cedex, France.
Corresponding author; e-mail [email protected].
The author responsible for distribution of materials integral to the findings presented in this article in accordance with the policy described in the Instructions for Authors (www.plantphysiol.org) is: A. Harvey Millar ([email protected]).
The online version of this article contains Web-only data.
Open Access articles can be viewed online without a subscription.
