


Abstract
Calcium (Ca) and manganese (Mn) are essential nutrients required for normal plant growth and development, and transport processes play a key role in regulating their cellular levels. Arabidopsis (Arabidopsis thaliana) contains four P2A-type ATPase genes, AtECA1 to AtECA4, which are expressed in all major organs of Arabidopsis. To elucidate the physiological role of AtECA2 and AtECA3 in Arabidopsis, several independent T-DNA insertion mutant alleles were isolated. When grown on medium lacking Mn, eca3 mutants, but not eca2 mutants, displayed a striking difference from wild-type plants. After approximately 8 to 9 d on this medium, eca3 mutants became chlorotic, and root and shoot growth were strongly inhibited compared to wild-type plants. These severe deficiency symptoms were suppressed by low levels of Mn, indicating a crucial role for ECA3 in Mn nutrition in Arabidopsis. eca3 mutants were also more sensitive than wild-type plants and eca2 mutants on medium lacking Ca; however, the differences were not so striking because in this case all plants were severely affected. ECA3 partially restored the growth defect on high Mn of the yeast (Saccharomyces cerevisiae) pmr1 mutant, which is defective in a Golgi Ca/Mn pump (PMR1), and the yeast K616 mutant (Δpmc1 Δpmr1 Δcnb1), defective in Golgi and vacuolar Ca/Mn pumps. ECA3 also rescued the growth defect of K616 on low Ca. Promoter:β-glucuronidase studies show that ECA3 is expressed in a range of tissues and cells, including primary root tips, root vascular tissue, hydathodes, and guard cells. When transiently expressed in Nicotiana tabacum, an ECA3-yellow fluorescent protein fusion protein showed overlapping expression with the Golgi protein GONST1. We propose that ECA3 is important for Mn and Ca homeostasis, possibly functioning in the transport of these ions into the Golgi. ECA3 is the first P-type ATPase to be identified in plants that is required under Mn-deficient conditions.
Calcium (Ca) and manganese (Mn) are essential nutrients required for normal plant growth and development. Both Mn deficiency and excess Mn accumulation can result in severely decreased crop yield. Mn deficiency is one of the most widespread trace element deficiencies for arable crops, often seen in cereals such as wheat (Triticum aestivum) and barley (Hordeum vulgare; Jiang, 2006). Plants deficient in Mn appear chlorotic and growth is reduced (Shenker et al., 2004). Mn2+ is essential throughout all stages of plant development; it activates a number of different enzymes, such as decarboxylases and dehydrogenases in the Krebs cycle (Marschner, 1995), and several glycosyltransferases in the Golgi (White et al., 1993; Nunan and Scheller, 2003). Mn2+ is associated with PSII, where it is required for light-induced water oxidation through which oxygen is produced. Mn is also required for mitochondrial superoxide dismutase (MnSOD), which is involved in scavenging of superoxides (Bowler et al., 1991) and is important in the biosynthesis of fatty acids and carotenoids (Marschner, 1995). As well as being an essential element, Mn2+ is also toxic at higher concentrations causing chlorosis, brown speckles on mature leaves, and necrosis (Marschner, 1995).
Transport proteins play a crucial role in maintaining the correct concentrations of Mn in the cytoplasm and also in supplying Mn to particular subcellular compartments where it may be required to act as an enzyme cofactor. In yeast (Saccharomyces cerevisiae) and also in many bacterial systems, several pathways for Mn2+ transport have been identified (Kehres and Maguire, 2003; Culotta et al., 2005). In plants, the situation is less clear, but several proteins that may transport Mn have been identified in Arabidopsis (Arabidopsis thaliana), including AtECA1, an endoplasmic reticulum (ER) P2A-type ATPase; AtCAX2, a vacuolar cation/H+ antiporter; AtIRT1, a plasma membrane ZIP transporter; and AtNramp3, a vacuolar Nramp (for review, see Williams et al., 2000; Hall and Williams, 2003; Pittman, 2005). Certain members of the cation diffusion facilitator family also appear to transport Mn, including AtMTP11 (Delhaize et al., 2007; Peiter et al., 2007).
Ca is required at much higher concentrations than Mn and plays many fundamental roles in plants, including stabilization of cell walls and membranes, facilitating root extension, and protection against potentially damaging factors in the soil, such as salinity (Sanders et al., 1999). Ca deficiency is rare in nature, but disorders that are observed in horticulture tend to be seen in fast-growing tissues and include blossom-end rot in tomato (Solanum lycopersicum), tip-burn in leafy vegetables, and fruit cracking (Marschner, 1995). Ca is also important in signaling, coupling a wide range of extracellular stimuli to a vast array of intracellular responses (Sanders et al., 1999). As such, the cytosolic Ca concentration must be carefully regulated and resting levels are usually around 0.1–0.2 μ m. Ca2+ enters the cytoplasm through calcium channels present at both the plasma membrane and intracellular membranes (White, 2002). Ca2+ efflux is mediated by high-affinity P-type Ca-ATPases and lower affinity Ca/H antiporters (Evans and Williams, 1998; Geisler et al., 2000, Cheng et al., 2005). The complexity of Ca signaling and homeostasis is reflected in the diversity of Ca2+ transporters. Molecular analyses of Ca-ATPases in plants indicate that they divide into two types: P2A-type Ca-ATPases (also known as ECAs), which show homology to the sarcoplasmic/ER Ca-ATPases (SERCAs), and P2B-type Ca-ATPases (also known as ACAs), which are generally stimulated by calmodulin and show homology to the calmodulin-binding Ca-ATPases found at the plasma membranes of animal cells (PMCAs; Axelsen and Palmgren, 1998; Geisler et al., 2000). A subset of P2A-type Ca-ATPases, the secretory pathway Ca-transport ATPases (SPCAs), is found in other organisms (PMR1 is an example in yeast), but these do not appear to exist in plants.
Ca pumps may have a variety of functions: loading of Ca into intracellular stores, such as the ER and vacuole, for them to act as sources of Ca for signaling; shaping and terminating a Ca signal; providing Ca for vesicle trafficking and fusion; and supplying Ca and possibly other divalent cations, such as Mn and zinc (Zn), to organelles to support their biochemical reactions (Sze et al., 2000). Genetic studies using mutants are now starting to reveal specific functions for individual Ca pumps (Wu et al., 2002; Schiott et al., 2004).
There are four P2A-type ATPases in Arabidopsis (AtECA1–AtECA4). Of these, AtECA1 was the first to be studied (Liang et al., 1997) and was shown to function at the ER in the transport of Ca and Mn (Liang et al., 1997; Liang and Sze, 1998). The growth of the eca1-1 mutant is sensitive to low Ca and high Mn, suggesting that pumping of these cations into the ER is required to support plant growth under conditions of Ca deficiency and Mn toxicity (Wu et al., 2002). Having shown that additional P2A-type ATPases, ECA2 and ECA3, are expressed in Arabidopsis (Pittman et al., 1999), the main objective of this study was to investigate their physiological role. This was achieved by isolating T-DNA insertion mutants in which the genes encoding these proteins had been disrupted and comparing the phenotype of the mutants to wild-type Arabidopsis. We present evidence showing that eca3 mutants have a unique and distinct phenotype from eca1 and eca2 mutants and demonstrate that ECA3 has a crucial role in Mn nutrition.
RESULTS
Primary Structure of Arabidopsis ECA3
AtECA3 from ecotype ‘Columbia-0’ contains an open reading frame of 998 amino acids with a predicted molecular mass of 109.062 kD. It is identical to the sequence predicted from genome sequencing (The Arabidopsis Information Resource; http://arabdopsis.org), but differs from the ECA3 sequence (AJ132388) that we cloned previously from ‘Landsberg erecta’ (Pittman et al., 1999) in four bases: A336G, T453A, T1647G, and C2934T. In the ECA3 sequence from ‘Landsberg erecta’, the second- and fourth-base changes are silent, but the first and third give changes in the amino acid sequence: R46G and S549R. Conpred II, a consensus prediction method for obtaining transmembrane (TM) topology models (http://bioinfo.si.hirosaki-u.ac.jp/∼ConPred2), indicates that AtECA3 contains 10 TM domains, a small cytoplasmic loop between TMs 2 and 3 and a large cytoplasmic loop between TMs 4 and 5. The latter contains the highly conserved phosphorylation domain CSDKTGTLT, which includes the phosphorylated Asp residue (Asp-347 for AtECA3) that is phosphorylated during the reaction cycle in all P-type ATPases. This model is consistent with structural models that have been presented for the sarcoplasmic reticulum Ca-ATPase from animal cells (Toyoshima et al., 2000).
Isolation of T-DNA Insertion Mutant Alleles of ECA2 and ECA3
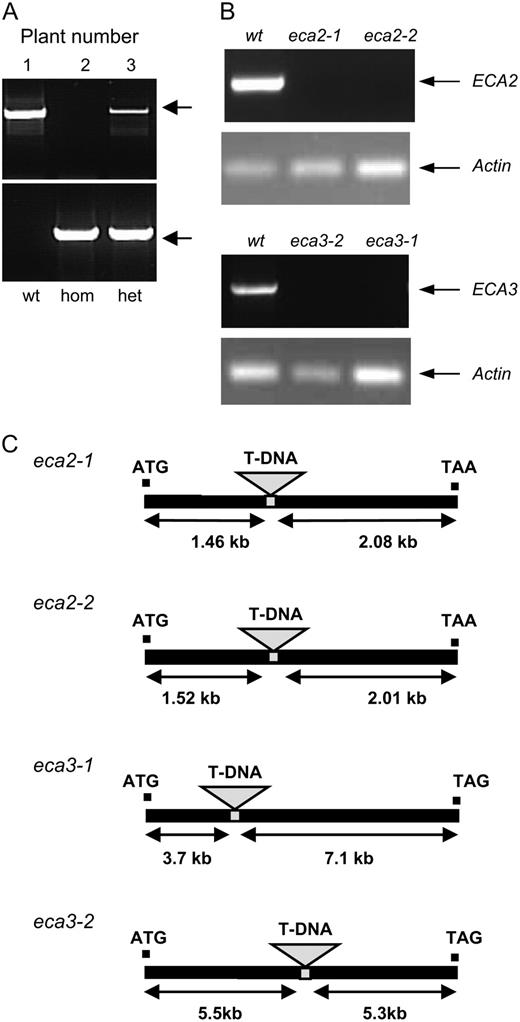
Isolation of mutant lines. A, Determining the genotype of plants from Salk line 045567. PCR was carried out on genomic DNA from individual plants (1–3) using gene-specific primers ECA3Ex10.F and ECA3.R to detect plants that contained a wild-type copy of the gene; these amplified a band of the predicted size, 2.07 kb (top). Salk LBa1 primer for the T-DNA and the gene-specific primer ECA3.R were used to detect the presence of the T-DNA in ECA3. They amplified a band of the approximate predicted size, 1.96 kb (bottom). The zygosity of plants 1 to 3 determined from this analysis is indicated: wt, Wild-type; hom, homozygous for the insert; het, heterozygous for the insert. B, RT-PCR using RNA isolated from wild type and eca mutants. Primers designed to amplify a product across the insertion site gave products for ECA2 and ECA3 of 0.67 and 1.67 kb, respectively, only in wild-type plants. Actin 2 primers were used to amplify a product of 0.2 kb as a positive control in all samples. C, Insertion sites for mutants isolated in this study.
eca mutant alleles identified in this study
Introns and exons are numbered so that the first exon begins with the start ATG and is followed by the first intron.
Allele | Salk Line | Position |
|---|---|---|
| eca2-1 | 0576961 | First of five exons. In large cytoplasmic loop between phosphorylated Asp and KGAAE motif. |
| eca2-2 | 0539146 | First of four introns. In large cytoplasmic loop between phosphorylated Asp and KGAAE motif. |
| eca3-1 | 0545567 | Twelfth of 33 introns. Middle of third transmembrane domain. |
| eca3-2 | 0570619 | Sixteenth of 33 introns. In large cytoplasmic loop between phosphorylated Asp and KGAPE motif. |
Effect of Low Ca on eca Mutants
To elucidate the biological function of ECA2 and ECA3 in Arabidopsis, we monitored insertion mutants under a wide range of conditions comparing their growth and development to wild-type plants. When grown on soil, no major differences from wild-type plants were observed (Supplemental Fig. S1).
![Effect of low Ca on growth of Arabidopsis eca2 and eca3 mutants compared to wild-type plants. Plants were grown for 17 d on plates in 0.5× Murashige and Skoog medium containing varying levels of Ca: 0.1 mm and 1.5 mm (A); 0 mm (B). White line = 1 cm. Fresh-weight values are shown for eca2-1 (top) and eca3-1 (bottom) compared to wild-type (wt) in A and for wild type and all mutants in B; data represent the means ± se from five separate plates, each having six seedlings per genotype per plate (wild type, black bar; mutant, gray bar). *, Significant difference between mutant and wild-type plant (P < 0.05); Student's t test (paired). Results are from representative experiments repeated at least twice for each mutant. [See online article for color version of this figure.]](https://oup.silverchair-cdn.com/oup/backfile/Content_public/Journal/plphys/146/1/10.1104_pp.107.110817/2/m_plphys_v146_1_116_f2.jpeg?Expires=1747865710&Signature=AnBrHHIIJkktR6i36t6plurp5HTj1Z~FVDaVh~tgKYXTxNzJ5iCA2w5Lgm6TDh4qsW-dkxlPr~Tkrii23saOVyPpWI4NrjoGP4b-pIVguv3FL3Gzc6NSz1GzKQsmVvWaeRSixGtNR6-UWJZFdo~szPElmEhB~PVs-U45J6Rv0HGkqECJx9H1YYY3iIYT5TXonOv6Zqs8JOc184xIKYS8SJrEGVUY2sRbCHyk3FFV-Eyc0zFtmMK-KG9dR~3W0XSDRTYwk6-TBGCBlExAvee4oG09t2K1-eIzdX1UWJU9Xm3u9qymP5WSwqlm9FM~9vP5bcssdrqvYDZRgZstEbCR5g__&Key-Pair-Id=APKAIE5G5CRDK6RD3PGA)
Effect of low Ca on growth of Arabidopsis eca2 and eca3 mutants compared to wild-type plants. Plants were grown for 17 d on plates in 0.5× Murashige and Skoog medium containing varying levels of Ca: 0.1 mm and 1.5 mm (A); 0 mm (B). White line = 1 cm. Fresh-weight values are shown for eca2-1 (top) and eca3-1 (bottom) compared to wild-type (wt) in A and for wild type and all mutants in B; data represent the means ± se from five separate plates, each having six seedlings per genotype per plate (wild type, black bar; mutant, gray bar). *, Significant difference between mutant and wild-type plant (P < 0.05); Student's t test (paired). Results are from representative experiments repeated at least twice for each mutant. [See online article for color version of this figure.]
eca3 Mutants Are Susceptible to Growth in Mn-Deficient Conditions
![eca3 mutants show reduced growth and chlorosis on Mn-deficient medium. Plants were grown on plates in 0.5× Murashige and Skoog* medium containing normal levels of Mn (50 μ m) or without Mn present (0 μ m) for 17 d. A, Seedling phenotype of eca2-1, eca3-1, and eca3-2 mutants compared to wild type (wt). Black line = 1 cm. B, Fresh-weight and chlorophyll content for eca3-1 and eca3-2 mutants (gray bars) compared to wild type (black bars). C, Fresh-weight and chlorophyll content for eca2-1 mutant (gray bars) compared to wild-type (black bars). Results in B and C represent the means ± se from at least five separate plates, each having six seedlings per genotype per plate. *, Significant difference between mutant and wild-type plants (P < 0.05); Student's t test (paired). Results are from a representative experiment repeated at least three times. [See online article for color version of this figure.]](https://oup.silverchair-cdn.com/oup/backfile/Content_public/Journal/plphys/146/1/10.1104_pp.107.110817/2/m_plphys_v146_1_116_f3.jpeg?Expires=1747865710&Signature=h6daCv88IS6F0HnxnxCq5EMa7ag5g-9ASnYRMA7HoOlCtu~S0EIx4TM153VPUSlTfpMQvs5EqgrZ0Fzh3LiySlyVKWGOPxexYsvrHzLmwc8J1x9iqIdI1IyO0y3YVZ3jcZznwtXXse7pz9EhPIzzlvQeo0v3mTklb4x1mnH3cM4TgcKfBY1dLRu~Xv8OcFlRETs1DZxBImKghKAtEUYmoyPWuTst6SpGLUN4wiIX30La7fVhfKtAEZmgYgxHvrMfRJ-4DhYLVevNJMuD~Muyml69Twr3~7XBvngfqXDDNDhUL8PTeMl1184hEUm8MfcTnutnetefFwufMk1c~e3gaA__&Key-Pair-Id=APKAIE5G5CRDK6RD3PGA)
eca3 mutants show reduced growth and chlorosis on Mn-deficient medium. Plants were grown on plates in 0.5× Murashige and Skoog* medium containing normal levels of Mn (50 μ m) or without Mn present (0 μ m) for 17 d. A, Seedling phenotype of eca2-1, eca3-1, and eca3-2 mutants compared to wild type (wt). Black line = 1 cm. B, Fresh-weight and chlorophyll content for eca3-1 and eca3-2 mutants (gray bars) compared to wild type (black bars). C, Fresh-weight and chlorophyll content for eca2-1 mutant (gray bars) compared to wild-type (black bars). Results in B and C represent the means ± se from at least five separate plates, each having six seedlings per genotype per plate. *, Significant difference between mutant and wild-type plants (P < 0.05); Student's t test (paired). Results are from a representative experiment repeated at least three times. [See online article for color version of this figure.]
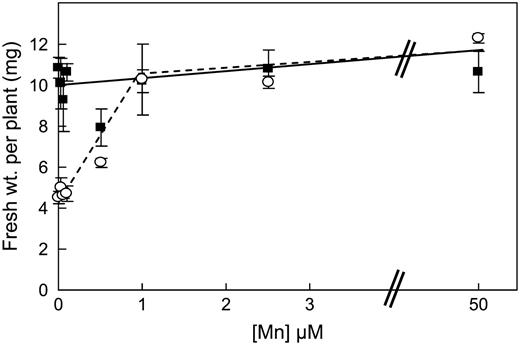
Mn concentration range for growth of eca3-2 mutants. Plants were grown on plates in 0.5× Murashige and Skoog* medium with increasing concentrations of Mn. Wild-type plants, Solid line and square symbols; eca3-2 mutants, dotted line and circles. Results represent the means ± se from three separate plates, each having six seedlings per genotype per plate.
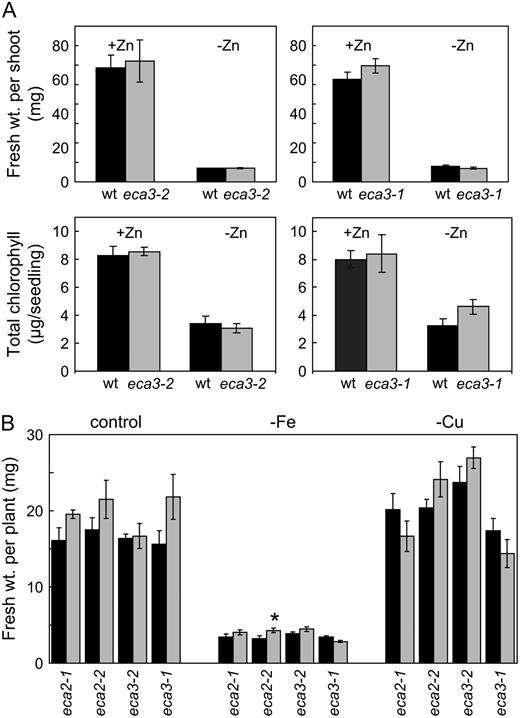
eca mutants show a similar response to wild-type plants when grown in the absence of Zn, Fe, or Cu. A, Seedling phenotype of eca3-1 and eca3-2 mutants compared to wild type (wt) when grown for 27 d on plates in 0.5× Murashige and Skoog* medium with Zn present at the normal concentration (15 μ m; +Zn) or absent (−Zn). Fresh weight of shoot (top) and chlorophyll content (bottom) for eca3-1 and eca3-2 mutants (gray bars) compared to wild type (black bars). B, Wild-type (black bars) and eca mutants (gray bars) were grown for 19 d on either 0.5× Murashige and Skoog medium (control) or in the absence of either Fe (−Fe) or Cu (−Cu). Data in A and B generally represent means ± se from five separate plates, each having six seedlings per genotype per plate. *, Significant difference between mutant and wild-type plant (P < 0.05); Student's t test (paired).
Elemental Analysis of eca3 Mutants
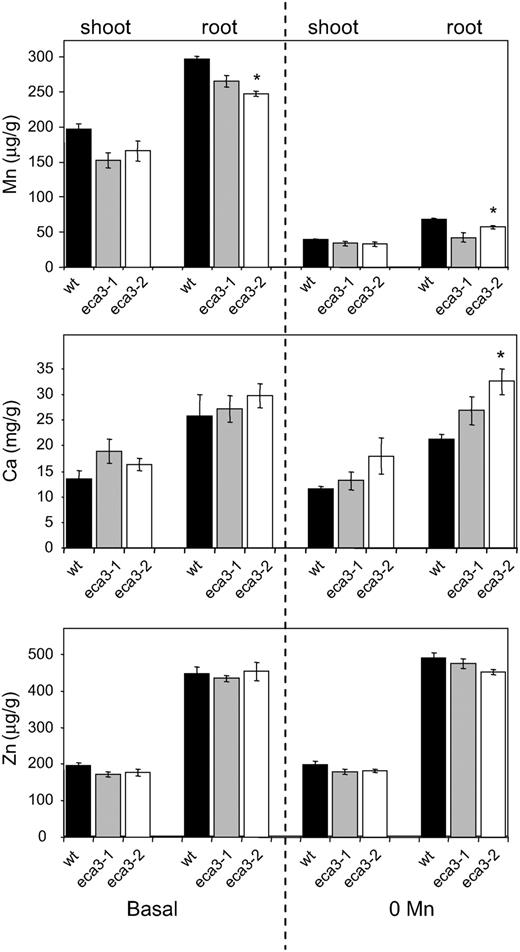
Elemental analysis of eca3 mutant Mn, Ca, and Zn concentration in root and shoot tissue of wild type (black bars), eca3-1 (gray bars), and eca3-2 mutants (white bars) grown on plates on basal (0.5× Murashige and Skoog*) or 0 Mn (0.5× Murashige and Skoog* with Mn omitted) for 17 d. Results are means ± se from four independent pools of plants from different experiments and each pool is from at least five replicate agarose plates. *, Significant difference between mutant and wild-type plant (P < 0.05); Student's t test (paired).
Expression Analysis of Type 2A Ca-ATPases
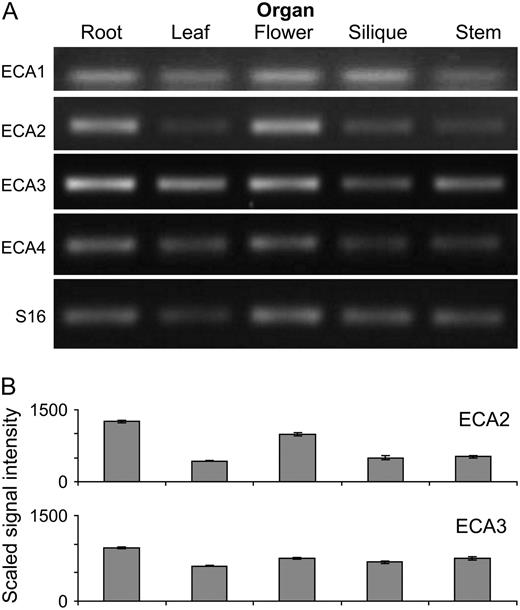
ECA expression analysis. A, Organ distribution of ECAs in hydroponically grown plants determined using RT-PCR. B, ECA2 and ECA3 expression in different organs determined from microarray analysis. Graphs show data (mean and se) extracted from Genevestigator (ATH1: 22k array) for the same organs (https://www.genevestigator.ethz.ch).
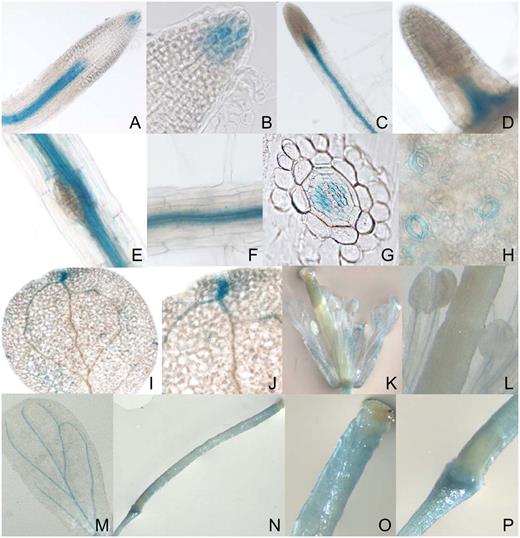
ECA3 promoter:GUS studies. The GUS reporter gene was expressed in wild-type Arabidopsis plants under the control of the promoter region for ECA3. Different tissues were subsequently tested for GUS activity. A to P, Primary root (A and B); lateral roots (C–E); root vascular tissue (F); transverse section of the root (G); guard cells (H); leaves (I and J); flowers (K); stamens (L); petals (M); and siliques (N–P).
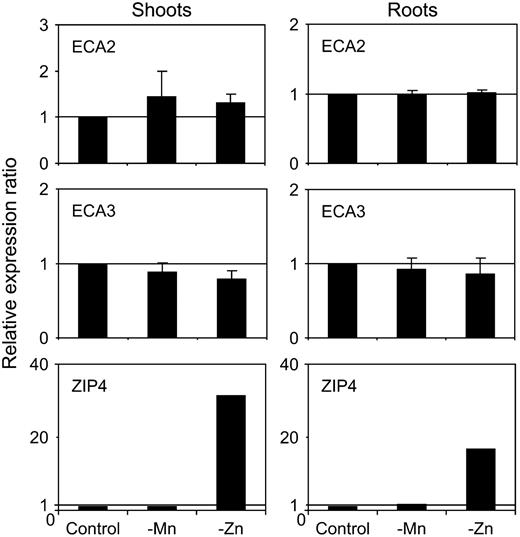
Metal regulation of ECA2 and ECA3 expression. Relative quantification of ECA2 and ECA3 expression by real-time PCR in seedlings grown for 15 d on plates with 0.5× Murashige and Skoog* medium (control) or on the same medium without Mn (−Mn) or Zn (−Zn). Results show expression normalized to the reference gene and relative to expression levels in shoots on control medium. Results are mean and se of results from three independent experiments.
ECA3 Is Localized to the Golgi
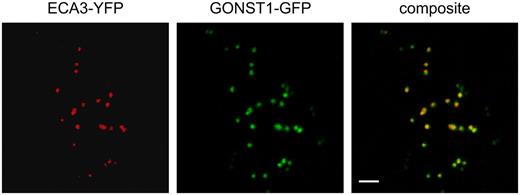
Colocalization of ECA3 and GONST1 fluorescent protein fusions in the Golgi apparatus. Confocal laser-scanning microscopy of a tobacco epidermal leaf cell expressing ECA3-YFP and GONST1-GFP. Left, ECA3-YFP marks small motile organelles. Middle, GONST1-GFP marks the Golgi apparatus. Right, Colocalization of the markers. Scale bar = 5 μm.
ECA3 Restores Growth Defects of the Yeast K616 Mutant on Ca-Depleted Medium and of K616 and pmr1 Mutants on High-Mn Medium
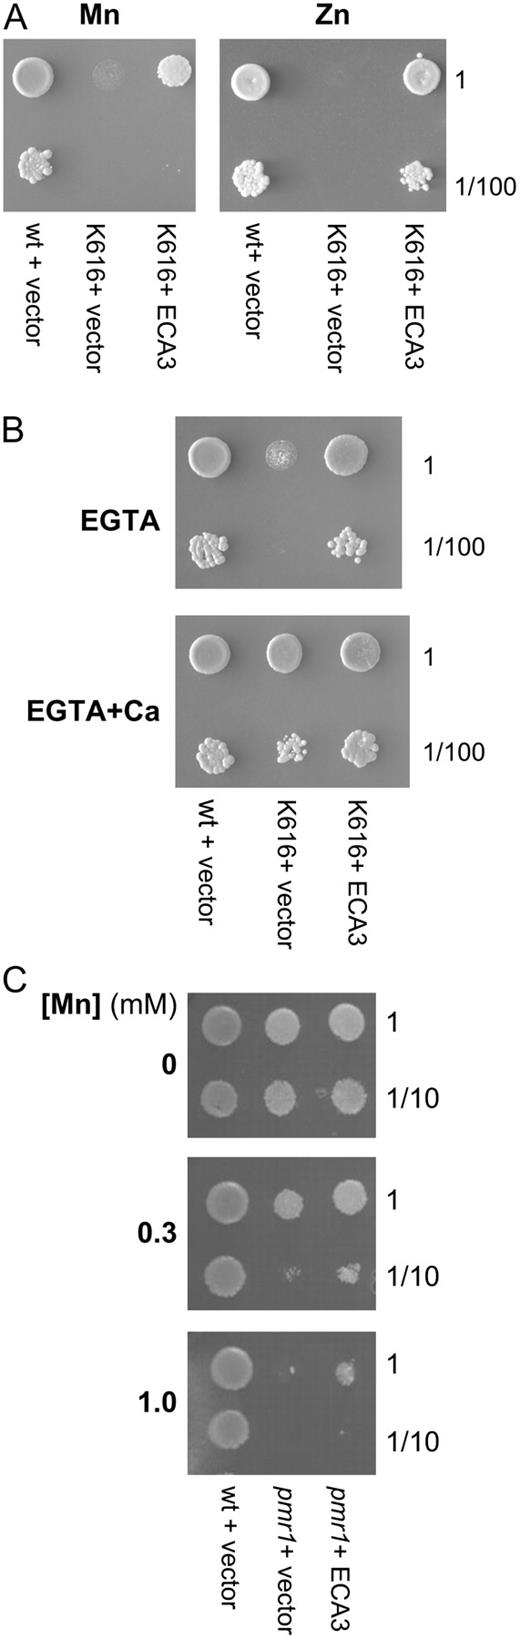
AtECA3 expression alleviates Mn-, Zn-, and Ca-dependent growth defects in yeast K616 (Δpmr1, Δpmc1, Δcnb1; A and B) and pmr1 (Δpmr1) mutants (C) transformed with p426-ECA3 (K616 + ECA3; pmr1 + ECA3) or p426 vector (K616 + vector; pmr1 + vector) were grown overnight in SC − uracil with 2% (w/v) Glc. K601 cells are shown as a positive control (wt). A and B, Cultures were adjusted to OD600 = 0.25 and used undiluted at this concentration (1) or at a 100-fold dilution (1/100). Five-microliter aliquots were spotted onto SC − uracil plates containing 2% (w/v) Gal as the carbon source (p426 uses a Gal-inducible promoter), with the following additions: A, either MnCl2 (0.3 mm) or ZnSO4 (3 mm); and B, Ca (20 mm) and EGTA (10 mm) or EGTA (10 mm). C, Cultures were adjusted to OD600 = 0.4 and used at this concentration (1) or 10-fold dilution (1/10). Seven-microliter aliquots were spotted onto SC − uracil plates containing 2% (w/v) Gal with 0, 0.3, or 1 MnCl2. Plates were incubated for 3 to 4 d at 30°C.
DISCUSSION
Arabidopsis contains four P2A-type ATPases (ECA1–ECA4), which are related to the well-characterized SERCA Ca-ATPases in mammals, and 10 P2B-type ATPases related to the mammalian plasma membrane calmodulin-stimulated Ca2+-ATPases. These are all members of the P-type superfamily of ATPases. Understanding the functional properties, expression patterns, and localization of each of these pumps is important if we are to understand how they contribute to ion homeostasis and signaling in plants. The aim of this study was to gain insight into the physiological roles of ECA2 and ECA3 by studying Arabidopsis T-DNA insertion mutants in which the genes encoding these ATPases have been disrupted. In addition, we have used heterologous expression in yeast to study functional properties of ECA3.
The studies conducted here with eca3 mutants have revealed a crucial role for ECA3 in Mn nutrition. eca3 mutants showed poor growth on Mn-deficient medium compare to wild-type plants (Fig. 3; Supplemental Fig. S2). The response to Mn deficiency is first seen after about 8 to 9 d on this medium; prior to this, growth is similar to wild type. Omitting Zn, Fe, or Cu from the medium had little specific effect on the mutant compared to wild type (Fig. 5). In the absence of Mn, eca3 mutants showed a reduction in both root and shoot fresh weight and in chlorophyll content; this phenotype could be rescued by adding 1 μ m Mn to the medium (Fig. 4). The fact that eca3 mutants show little difference from wild-type plants when Mn was present in the medium at normal levels indicates that other genes can compensate for the loss of ECA3 under these conditions. Notably, on soil there were no marked differences in the development of eca3 mutants, which grew similarly to wild type; in this case, there was probably sufficient Mn for normal growth and development.
There appear to be distinct differences in the roles ECAs play in Mn and Ca tolerance. Wu et al. (2002) found that eca1 mutants were sensitive to high Mn and suggested that ECA1 may confer tolerance to this metal by removing it from the cytosol. Physical symptoms of Ca deficiency have also been reported in eca1-1 mutants when external Ca was reduced to 0.2 to 0.4 mm, suggesting that ECA1 may be the main pump capable of loading Ca into the ER lumen under these conditions (Wu et al., 2002). Both eca2 and eca3 mutants grew normally in this range, but, when Ca was omitted from the medium altogether, eca3 mutants seemed slightly more affected than eca2 mutants or wild type, suggesting a role for ECA3 in Ca homeostasis (Fig. 2). However, it should be stressed that, under these conditions, all plants were severely affected and the differences in the mutants and wild type were not as marked as seen for the situation when Mn was omitted from the medium.
Results from semiquantitative RT-PCR and microarray analysis showed that ECA3 is expressed in all major organs of Arabidopsis (Fig. 7). Promoter:GUS studies confirmed this and showed that ECA3 is highly expressed in a range of tissues and cells, including root tips, hydathodes, guard cells, and vascular tissue (Fig. 8). The markedly different metal-dependent phenotypes observed in eca1 mutants (Wu et al., 2002) and eca3 mutants (this study) indicate that these ATPases have different physiological roles in Arabidopsis. This could be related to differences in their membrane location. ECA1 is associated primarily with the ER functioning in the transport of Ca and Mn into this compartment (Liang et al., 1997). Recent proteomic analysis (Dunkley et al., 2006) confirms ER localization for ECA1 and Golgi localization for ECA3 (P. Dupree, unpublished data). Using transient expression of YFP-ECA3 fusion proteins in tobacco, we show here that ECA3 colocalizes with GONST1 (Fig. 10), a protein previously shown to be located in the Golgi (Handford et al., 2004).
From the data we have presented in this article, we propose that ECA3 could serve a similar function to Golgi-associated SPCAs found in other organisms. In mammalian cells, there are three distinct classes of P2-type Ca-ATPases, SERCA type, PMCA type, and SPCAs (also referred to as PMR1 type), and these three groups can be clearly distinguished in phylogenetic analysis (Pittman et al., 1999; Schmidt et al., 2002; Supplemental Fig. S4). SPCAs transport Ca, but also Mn, with high affinity, and they function both in Mn detoxification via exocytosis and also in providing Mn for Golgi-localized enzymes (Yadav et al., 2007). In yeast, the SPCA, PMR1, functions as a Ca and Mn transporter at the Golgi, transporting these ions into the secretory pathway. Both ions can exert distinct functions: Ca supplied by PMR1 is required to sustain vacuolar protein sorting, whereas Mn is required to activate various Mn-requiring enzymes involved in the addition of complex carbohydrates onto N- and O-linked glycosylated proteins (Lapinskas et al., 1995; Durr et al., 1998). The fact that, on low Ca medium, ECA3 complements the yeast triple null mutant strain K616 (Δpmr1 Δpmc1 Δcnb1), lacking its endogenous Golgi (PMR1) and vacuolar (PMC1) Ca pumps, is consistent with ECA3 functioning as a Ca pump in yeast (Fig. 11). K616 also exhibits growth sensitivity to high levels of extracellular Mn, which results from toxicity of excessive cellular levels due to the lack of functional endogenous pumps (Lapinskas et al., 1995, Culotta et al., 2005). Expression of ECA3 reduces the Mn-sensitive phenotype of the triple yeast mutant K616 and also the single pmr1 mutant, indicating that ECA3 could serve a similar function to PMR1 (Fig. 11). ECA3 is particularly effective in reducing the Zn-sensitive phenotype in yeast, suggesting that it may have the capability of transporting Zn. However, ECA3 does not seem to play a major role in Arabidopsis under Zn deficiency because wild-type plants and eca3 mutants were similarly affected under such conditions.
There are SPCAs in fungi, animal, and bacteria, but they have not been identified in higher plants. Phylogenetically, AtECA3 clusters with animal-type SERCA pumps, whereas AtECA1 and AtECA2 cluster more closely with plant-type SERCA pumps (Pittman et al., 1999; Supplemental Fig. S4). Our data indicate that, in plants, ECA3-type pumps could have a comparable physiological role to SPCA types and function in transporting Ca and Mn into the Golgi-associated secretory pathway. The partial rescue of metal-dependent growth phenotypes displayed in yeast mutants would support a transport function for ECA3, but more direct transport assays would be required to show that ECA3 functions as a Ca and Mn transporter. Future experiments will be aimed at testing the hypothesis that ECA3 transports Mn into the Golgi to supply various Mn-requiring enzymes for biochemical processes required for normal growth of Arabidopsis.
Mn deficiency is a serious nutritional disorder for plants in many areas of the world, and in arable crops this can lead to reduced yield. Not only is there variability between plant species in their ability to grow on low Mn, but there are also considerable differences among genotypes of the same species (Pedas et al., 2005). Varieties displaying tolerance to Mn deficiency have been termed Mn efficient (Pedas et al., 2005; Jiang, 2006), but the mechanisms underlying this have not been clearly defined. In barley, differential capacity for high-affinity Mn influx is thought to contribute to Mn efficiency; in wheat, it may be due to improved internal utilization rather than higher Mn accumulation (Jiang, 2006). ECA3 homologs could play a role in the Mn efficiency of crop species and there is the potential in the future to test whether expression of AtECA3 could improve Mn efficiency.
In summary, this study has provided evidence that AtECA3 plays a crucial role in Mn nutrition in Arabidopsis. Golgi localization of ECA3 could explain why disruption of ECA3 does not lead to a major effect on the overall Mn content of the plant. The severe phenotype observed under Mn-deficient conditions may be due to a reduction in the Mn content of the Golgi. Our observations indicate that other secretory pathway/endomembrane-localized Mn transporters, such as AtMTP11, cannot compensate for the lack of ECA3 under Mn deficiency. AtECA1, AtCAX2, and AtMTP11 have previously been reported to confer tolerance to high-Mn concentrations, but AtECA3 is the first to be identified that is required for growth under low-Mn conditions.
MATERIALS AND METHODS
Plant Material and Growth Conditions
Seeds of wild-type and transgenic Arabidopsis (Arabidopsis thaliana ‘Columbia-8’) were sterilized in 10% (v/v) bleach for 20 min, rinsed five times with sterile water, and inoculated onto plates containing 0.8% (w/v) agarose (Melford), 1% (w/v) Suc, and either one-half-strength (0.5×) Murashige and Skoog medium (Murashige and Skoog, 1962) or the same medium but with Ca levels reduced from 1.5 mm to 0.1 mm (0.5× Murashige and Skoog*). For experiments investigating the effect of Mn deficiency on phenotype, Mn was omitted from the 0.5× Murashige and Skoog* medium. Seeds were stratified at 4°C for 48 h prior to transfer to a controlled-environment cabinet (23°C, 16 h light; 18°C, 8 h dark) and plates were incubated vertically or horizontally as indicated. To examine the development of the plants to maturity, seeds were sown in soil (one part Levingtons F5 no. 2; one part John Innes no. 2; one part Vermiperl-graded horticultural vermiculite, medium grade) sterilized by autoclaving at 121°C for 15 min at 1 bar pressure, and plants were grown in a controlled-environment cabinet (22°C, 16 h light; 20°C, 8 h dark cycle) or under glasshouse conditions. To obtain organ material from mature plants for gene expression analysis, plants were grown hydroponically as described previously (Mills et al., 2003).
Chlorophyll Determination and Fresh-Weight Measurements of Seedlings
Fresh-weight and chlorophyll measurements were determined using seedlings grown on five separate plates, each plate having six wild-type seedlings and six mutant seedlings. The data presented are generally the means from the five plates ±se expressed on a per-seedling basis. Student's t test (paired) was used to determine significant differences between mutant and wild-type plants and an asterisk (*) indicates a significant difference (P < 0.05). Chlorophyll was determined following extraction in N,N-dimethylformamide (Moran, 1982).
Elemental Analysis
Shoots and roots were harvested separately from plants grown on agarose plates (see above). Plant samples were dried for 2 d at 70°C and weighed. Samples were digested at 120°C in 0.5 mL of 65% nitric acid for 4 h. After the solution was cooled, it was diluted to 10 mL with deionized water and metal content was determined by atomic absorption.
RNA Isolation, RT-PCR, and Real-Time PCR
Total RNA was extracted from different plant organs (roots, leaves, stems, flowers, and siliques) of hydroponically grown plants and from root and shoot tissue from plants grown on agarose plates (see above) using a phenol-SDS extraction and LiCl precipitation method based on Verwoerd et al. (1989). RNA was checked for purity, integrity, and quantity using RNA gel electrophoresis and spectrophotometry (Sambrook et al., 1989). First-strand cDNA synthesis using 2 μg of total RNA was carried out using SuperScript RNase H− reverse transcriptase (Invitrogen) according to the manufacturer's instructions with an oligo(dT)12-18 primer. The expression pattern of AtECA1 to AtECA4 was determined by semiquantitative RT-PCR using primers designed to specifically amplify parts of each sequence: AtECA1 and AtECA4 forward primer, 5′-GCTACCGCTACTCACCTCGC-3′; AtECA1 reverse primer, 5′-CCAACGCCGAGGTAAGTAAC-3′; AtECA4 reverse primer, 5′-GCAAGGATGAGTAAAGCAACAA-3′; AtECA2 forward primer, 5′-TAGGGACGAGGAAAATGG-3′, and reverse primer, 5′-GCTCTAAACAACTTCCCTTC-3′; and AtECA3 forward primer, 5′-GCTATGACAGTACTTGTTGTTG-3′, and reverse primer, 5′-GCCTGTATTTCTAGAGAGGA-3′. Control PCR was performed using primers to S16 ribosomal gene (40S component): forward primer, 5′-ACGCCATCCGTCAGAGTATC-3′; and reverse primer, 5′-CGCCACAAGCAGAGTCCTAT-3′. Products were amplified using Biomix Taq (Bioline) and cycles were chosen that were in the exponential phase of PCR amplification. Primers were used at a final concentration of 0.2 μ m. PCR conditions were 94°C for 2 min, the required number of cycles of 94°C for 30 s, then 65°C (ECA1), 52°C (ECA2), or 60°C (ECA3, ECA4) or 56°C (S16) for 1 min, then 72°C for 1 min. Amplified DNA was separated on 1.2% (w/v) agarose gels and visualized using ethidium bromide. A similar procedure was used for real-time PCR, but using SuperScript III reverse transcriptase and oligo(dT)20 primers (Invitrogen). The same primer pairs were used for S16 (reference gene) and ECA3, and the primer pair 5′-TAGGACCATCGCGTTTGAGAAC-3′ (forward) with 5′-TCTCCATGGTGGCATCGTTAAG-3′ (reverse) was used for ECA2. Real-time PCR reactions were performed in a 96-well plate using a Chromo 4 thermal cycler (MJ Research) with the Opticon Monitor III program. SYBR Green (Finnzymes) was used to monitor cDNA amplification. For data evaluation, target gene expression was normalized to reference gene expression by an efficiency-calibrated method using the equation
Cloning of AtECA3 and Plasmid Constructs
p426-ECA3 Yeast Expression Construct
AtECA3 from Arabidopsis ‘Columbia-0’ was cloned in two overlapping parts as initial attempts to amplify full-length cDNA failed. The 5′ part was amplified from clone RZL01a05 (AV554735/AV545775) obtained from Kazusa DNA Research Institute (Asamizu et al., 2000) using the primers ECA3.F (5′-GCGGATCCAAACCCTTGGCTTTTCCAAC-3′) and ECA3-5′.R (5′-CATCCCATTGCTGTCAAAGACGGTACCTT-3′). The ECA3.F primer introduced a BamHI site, allowing the product to be cut with BamHI, and at an EcoRI site within the ECA3 sequence for ligation into the same sites of p426 (Mumberg et al., 1994) giving p426-5′-ECA3. The 3′ part of ECA3 was amplified from reverse-transcribed RNA from leaf tissue using the primers ECA3-3′.F (5′-TGATGTCGGTGTCTAAGATATGTGT-3′) and ECA3.HR (5′-CGAAGCTTCGAAAAAGCCATCTCTTGCT-3′) and cloned into pGEMTe. The primer ECA3-3′.F overlaps the end of the 5′ part and the ECA3.HR primer introduced a HindIII site, allowing the ECA3 3′ fragment to be excised with EcoRI and HindIII and ligated into the same sites of p426-5′-ECA3 to produce the full-length ECA3 cDNA in p426 (p426-ECA3). Sequencing of the final product confirmed that the full-length ECA3 was identical to the sequence predicted from genome sequencing. The GenBank accession number for ECA3 cloned in this study is EU082212.
YFP-ECA3 Construct
Gateway technology was used to produce the YFP-ECA3 construct. ECA3 cDNA was PCR amplified from the p426-ECA3 construct and integrated into the pENTR-TOPO vector by TOPO cloning (Invitrogen). ECA3 was then subcloned into the pEarleyGate 104 destination vector (Earley et al., 2006), which attaches YFP in-frame to the N terminus of ECA3.
ECA3 Promoter:GUS Construct
For tissue-specific expression studies, 1.5 kb of the 5′-untranslated region for ECA3 was amplified by high-fidelity PCR with primers 2548 (5′-CACCGTGTACAGTTGTATAGTTTACCAAC-3′) and 2549 (5′-GTTGGAAAAGCCAAGGGTTTCTG-3′). The PCR product was cloned into pENTR/D-TOPO (Invitrogen) using Gateway technology and transferred to plasmid pMDC162 (Curtis and Grossniklaus, 2003) to generate a construct containing the open reading frame for a GUS reporter gene under the control of the ECA3 promoter region.
Yeast Strains, Transformation, and Growth
The K616 yeast (Saccharomyces cerevisiae) strain (MATα pmr1∷HIS3 pmc1∷TRP1 cnb1∷LEU2, ura3; Cunningham and Fink, 1994) was transformed with p426-ECA3 or p426 vector alone using a Li-acetate method based on Gietz et al. (1992). Yeast transformants were selected on medium lacking uracil. Yeast strain K601/W3031A (MATα leu2, his3, ade2, and ura3; Cunningham and Fink, 1994) transformed with the empty p426 vector was used as a positive control.
To compare the growth of K616 cells containing p426-ECA3 or p426 alone, cells were first grown in liquid culture overnight at 30°C in synthetic complete (SC) without uracil (pH 5.0) and containing 20 g L−1 Glc as the carbon source. Cultures were adjusted to the same OD600 and aliquots were inoculated onto 2% (w/v) agar plates containing the SC − uracil medium (pH 4.9) with Gal or Glc and various additions as specified in “Results.” Plates were incubated at 30°C for 3 to 5 d.
Transient Expression of ECA3 in Tobacco
Four-week-old tobacco (Nicotiana tabacum ‘Petit Havana’) plants grown at 22°C on a 16-h-light/8-h-dark cycle were used for Agrobacterium tumefaciens (strain GV3101)-mediated transient expression (Batoko et al., 2000). pVKH18En6-GONST1-GFP (Handford et al., 2004) or pEG104-ECA3-YFP-transformed A. tumefaciens was cultured at 28°C, until the stationary phase (approximately 24 h), washed, and resuspended in infiltration medium (MES 50 mm, pH 5.6, Glc 0.5% [w/v], Na3PO4 2 mm, acetosyringone 300 μ m [from 750 mm stock in dimethyl sulfoxide]). The bacterial suspension was inoculated using a 1-mL syringe without a needle by gentle pressure through the stomata on the lower epidermal surface (Brandizzi et al., 2002). Transformed plants were then incubated under normal growth conditions for 3 d at 22°C.
Confocal Microscopy
Transformed leaves were analyzed 72 h after infection of the lower epidermis. Confocal imaging was performed using an inverted Zeiss LSM510 META laser-scanning microscope with a 63× oil immersion objective. For imaging expression of GFP and YFP, excitation lines of an argon ion laser of 458 nm for GFP and 514 nm for YFP with a 475/525-nm band-pass filter for GFP and a 530/600-nm band-pass filter for YFP were used alternately with line switching using the multitrack facilities of the microscope. Appropriate controls were performed to exclude any cross talk and bleed through of fluorescence.
ECA3 Promoter:GUS Expression Analysis
A. tumefaciens strain C5851 (Koncz and Schell, 1986) was transformed by electroporation and transformants were selected on YEP plates (1% yeast extract, 2% peptone, 1.5% agar) containing 25 μg mL−1 gentamycin and 50 μg mL−1 kanamycin. Wild-type Arabidopsis ecotype ‘Columbia-0’ plants were transformed by floral dipping (Clough and Bent, 1998). Seeds were selected on 0.5× Murashige and Skoog plates without Suc and supplemented with 25 μg mL−1 hygromycin B under short-day (8-h-light) conditions. After 2 weeks, transformants were tested for GUS activity as described by Haritatos et al. (2000). For flower and silique staining, plants were selected on plates as before and then transferred to soil under long-day (16-h-light) conditions for 2 weeks. Transverse sections of GUS-stained roots were obtained as by Haritatos et al. (2000) and visualized in a Nikon Eclipse 80i light microscope. At least four independent transformant lines were tested in each case.
Isolation of Insertional Mutants for AtECA2 and AtECA3
Seed for putative T-DNA insertion lines for AtECA2 and AtECA3 from the Salk collection (http://signal.salk.edu) were obtained from the Nottingham Arabidopsis Stock Centre. These were seed lines N576961 (eca2-1), N539146 (eca2-2), N545567 (eca3-1), and N570619 (eca3-2). To isolate eca mutants, homozygous for the insert, a similar procedure to that previously described for hma4 mutants was followed (Mills et al., 2005). Briefly, genomic DNA was isolated from soil-grown plants using the DNAMITE plant kit (Microzone). To genotype the plants with respect to the T-DNA insert, PCR was carried out on genomic DNA using the primer for the T-DNA left border (Salk LBa1, 5′-TGGTTCACGTAGTGGGCCATCG-3′) and gene-specific primers ECA2.F (5′ TAGGGACGAGGAAAATGG-3′) for eca2-1 and eca2-2, ECA3.R (5′-CATCCCATTGCTGTCAAAGACGGTACCTT-3′) for eca3-1, and ECA3.F (5′-TCCAATCTGCAGAGCATGGTCCTATGA-3′) for eca3-2. PCR conditions were 94°C for 2 min followed by 40 cycles of 94°C for 30 s, then 54°C (ECA2.F), 56°C (ECA3.F), or 58°C (ECA3.R) for 1 min, then 72°C for 1 min (except 2 min for ECA3.R), and then a final elongation step of 72°C for 5 min.
For N576961 (eca2-1), N545567 (eca3-1), and N570619 (eca3-2), sequencing confirmed the original Salk-predicted T-DNA locations, whereas for N539146 (eca2-2) the insert location was confirmed at 139 bp 3′ of the predicted location. Mutant alleles for ECA2 (eca2-1 and eca2-2) and ECA3 (eca3-1 and eca3-2) were obtained and lines homozygous for the inserts were selected for phenotypic analysis. The lack of a transcript was confirmed at the RNA level by RT-PCR using primers that span the insertion site: for ECA2, ECA2.F (see above) and ECA2RTR (5′-CTTAAGGATTACTTCTCTGCTA-3′); and ECA3, ECA3ex10F (5′-GCATACACGATTCTATGTTGCAGACAGATGAT-3′) and ECA3SGR (5′-GTTACCAAATTGACCCACAGAAGT-3′). Amplification of Actin2 was used as a positive control using primers Actin2.F, 5′-GGTAACATTGTGCTCAGTGGTGG-3′, and Actin2.R, 5′-CTCGGCCTTGGAGATCCACATC-3′. After denaturation at 94°C for 2 min, PCR was cycled as follows: 24 cycles of 94°C, 30 s; 56°C, 1 min; 72°C, 1 min for Actin2; 40 cycles of 94°C, 30 s; 50°C, 1 min; 72°C, 1 min for ECA2; and 40 cycles of 94°C, 30 s; 55°C, 1 min; 72°C, 2 min for ECA3. A final elongation step of 72°C for 5 min was used in all.
Sequence data from this article can be found in the GenBank/EMBL data libraries under accession number EU082212.
Supplemental Data
The following materials are available in the online version of this article.
Supplemental Figure S1. Growth of eca mutants is similar to wild-type plants on soil.
Supplemental Figure S2. Phenotype of eca3 mutants grown under Mn-deficient conditions.
Supplemental Figure S3. Elemental analysis of eca3 mutant.
Supplemental Figure S4. Maximum-likelihood phylogenetic tree for P2-type ATPases created using Tree-puzzle 5.2.
ACKNOWLEDGMENTS
We thank Nottingham Arabidopsis Stock Centre for supplying mutant seed lines.
LITERATURE CITED
Durr G, Strayle J, Plemper R, Elbs S, Klee SK, Catty P, Wolf DH, Rudolph HK (
Koncz C, Schell J (
Murashige T, Skoog F (
Pfaffl MW (
Sambrook J, Fritsch EF, Maniatis T (
van de Mortel JE, Villanueva LA, Schat H, Kwekkeboom J, Coughlan S, Moerland PD, van Themaat EVL, Koornneef M, Aarts MGM (
Author notes
This work was supported by the Biotechnology and Biological Sciences Research Council (51/P17217) and European Union Framework VI program for Research and Technological Development (contract no. FOOD–CT–2006–016253). This publication reflects only the authors' views; the Community is not liable for any use that may be made of the information contained therein.
Corresponding author; e-mail [email protected].
The author responsible for distribution of materials integral to the findings presented in this article in accordance with the policy described in the Instructions for Authors (www.plantphysiol.org) is: Lorraine E. Williams ([email protected]).
Some figures in this article are displayed in color online but in black and white in the print edition.
The online version of this article contains Web-only data.
Open Access articles can be viewed online without a subscription.
