


Abstract
Phosphoenolpyruvate carboxylase (PEPC; EC4.1.1.31) plays a key role during C4 photosynthesis. The enzyme is activated by metabolites such as glucose-6-phosphate and inhibited by malate. This metabolite sensitivity is modulated by the reversible phosphorylation of a conserved serine residue near the N terminus in response to light. The phosphorylation of PEPC is modulated by a protein kinase specific to PEPC (PEPC-PK). To explore the role PEPC-PK plays in the regulation of C4 photosynthetic CO2 fixation, we have transformed Flaveria bidentis (a C4 dicot) with antisense or RNA interference constructs targeted at the mRNA of this PEPC-PK. We generated several independent transgenic lines where PEPC is not phosphorylated in the light, demonstrating that this PEPC-PK is essential for the phosphorylation of PEPC in vivo. Malate sensitivity of PEPC extracted from these transgenic lines in the light was similar to the malate sensitivity of PEPC extracted from darkened wild-type leaves but greater than the malate sensitivity observed in PEPC extracted from wild-type leaves in the light, confirming the link between PEPC phosphorylation and the degree of malate inhibition. There were, however, no differences in the CO2 and light response of CO2 assimilation rates between wild-type plants and transgenic plants with low PEPC phosphorylation, showing that phosphorylation of PEPC in the light is not essential for efficient C4 photosynthesis for plants grown under standard glasshouse conditions. This raises the intriguing question of what role this complexly regulated reversible phosphorylation of PEPC plays in C4 photosynthesis.
Phosphoenolpyruvate (PEP) carboxylase (PEPC) catalyzes the irreversible β-carboxylation of PEP in the presence of HCO3− and Mg2+ to yield oxaloacetate and inorganic phosphate (Chollet et al., 1996; Izui et al., 2004). PEPC is a ubiquitous cytosolic enzyme in higher plants and has an anaplerotic function replenishing the tricarboxylic acid cycle with intermediates. It is also involved in pH regulation, stomatal opening, and fruit ripening (for review, see Chollet et al., 1996). In leaves of C4 species, it is an essential component of the biochemical concentration mechanism that provides elevated CO2 partial pressure (pCO2) at the site of Rubisco carboxylation. Initially, carbonic anhydrase converts atmospheric CO2 to HCO3−, which is then fixed by PEPC to produce C4 acids, which diffuse to and are decarboxylated in the bundle sheath to supply CO2 for Rubisco. As a consequence, Rubisco operates near its Vmax, photorespiration is suppressed, and C4 photosynthesis is essentially CO2 saturated at ambient pCO2 (Hatch, 1987). There are several isoforms of PEPC in higher plants encoded by small multigene families and specific C4 isoforms have been identified (Chollet et al., 1996; Izui et al., 2004). Several of these isoforms are present in leaves of C4 plants, but the activity of the C4 isozyme predominates (Huber et al., 1994; Dever et al., 1995). In vitro, PEPC activity is modulated by a wide range of effectors, such as phosphorylated intermediates (triose- and hexose-P), amino acids, and organic acids (Doncaster and Leegood, 1987; Vidal and Chollet, 1997). For example, following earlier discoveries of the role of malate in the regulation of PEPC during Crassulacean acid metabolism (Winter, 1982), the C4 enzyme was found to be more sensitive to malate inhibition when extracted from darkened leaves than when extracted from illuminated leaves (Huber et al., 1986; Doncaster and Leegood, 1987). This change in sensitivity of the enzyme was later shown to be associated with an increase in the phosphorylation state of the enzyme in the light (Nimmo et al., 1987a, 1987b; Jiao and Chollet, 1991).
Phosphorylation of C4-PEPC at its conserved Ser residue near the N terminus is thought to be controlled primarily by the light-dependent activity of a protein kinase specific to PEPC (PEPC-PK) because the activity of the protein phosphatase 2A involved in PEPC dephosphorylation appears to be constant under various conditions (Vidal and Chollet, 1997; Dong et al., 2001; Nimmo, 2003; Izui et al., 2004). Recently, cDNA clones for PEPC-PK have been cloned and characterized in vitro for a number of species (Izui et al., 2004; Shenton et al., 2006); in particular, Tsuchida et al. (2001) have cloned and characterized the expression of PEPC-PK from Flaveria trinervia. Agetsuma et al. (2005) revealed rapid degradation of PEPC-PK protein via the ubiquitin-proteasome pathway using a maize (Zea mays) protoplast transient assay system.
The efficiency of the C4 pathway and the pCO2 attained in the bundle sheath is related to both the bundle sheath resistance to CO2 diffusion and the relative biochemical capacities of the C3 and C4 cycle. Because the C4 cycle consumes energy in the form of ATP during the regeneration of PEP, leakage of CO2 out of the bundle sheath is an energy cost to the leaf and coordination between the C3 and C4 cycle is important. Biochemical interdependence of the two cycles exists at several levels (Hatch and Osmond, 1976; Furbank et al., 2000). Among these, regulation of PEPC activity by phosphorylation has been hypothesized to provide a possible link between PEPC activity and coordination of C4 and C3 cycle activity (Bakrim et al., 1993; Vidal and Chollet, 1997). To help understand the role of PEPC-PK in regulation of C4 photosynthesis in vivo, we have transformed Flaveria bidentis (a C4 dicot) with antisense or RNA interference (RNAi) constructs targeted at the mRNA of PEPC-PK. We have generated several independent transgenic lines where PEPC is not phosphorylated but find that that lack of PEPC phosphorylation does not affect photosynthetic rates.
RESULTS
Characterization of Primary Transformants and T1 Progeny
We isolated a full-length PEPC-PK cDNA from the F. bidentis leaf cDNA library as described in “Materials and Methods” (accession no. AB272061). In the coding region, 843 bp, five nucleotide residues were different between F. bidentis and F. trinervia PEPC-PK genes and three of them introduced substitutions of amino acid sequences. Thus, the primary sequence of the F. bidentis PEPC-PK was almost identical to that of F. trinervia PEPC-PK and similar to other PEPC-PK sequences as described previously (Tsuchida et al., 2001). For F. bidentis transformation, antisense and RNAi plasmids were constructed using the full cDNA clone of F. bidentis PEPC-PK.
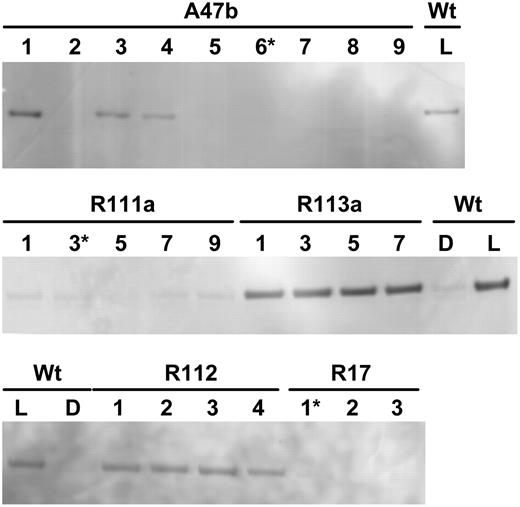
Immunodetection of phosphorylated PEPC in leaf extracts of F. bidentis. Shown is wild type (Wt) and progeny of several primary transformants (A47b, R111a, R113a, R17, R112) separated by SDS-PAGE. For wild type, leaf discs were collected during the dark period (D) or 3 h into the light period (L) of the growth cabinet. Leaf samples for the progeny were all collected 3 h into the light period. (Progeny marked with an asterisk were grown to seed.) Samples were loaded on gels on an equal-leaf-area basis. Phosphorylated PEPC was detected with the specific antibody and with anti-IgG alkaline phosphatase conjugate (Bio-Rad) as secondary antibody. Immunoblots were developed using the AttoPhos fluorescence substrate system (Promega). There were no other bands on the membrane.
Characterization of T2 Progeny
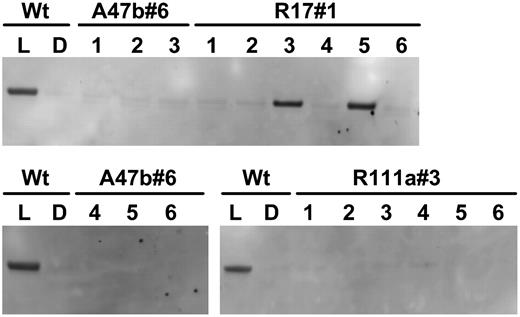
Immunodetection of phosphorylated PEPC in leaf extracts of F. bidentis wild type (Wt) and progeny of T1 transformants A47b#6, R111a#3, and R17#1 shown in Figure 1. Proteins were separated by SDS-PAGE. Plants were grown in a naturally lit glasshouse during June and July, 2006, and leaf discs were collected in the glasshouse for wild type either during the dark period (D) or at midday (L). Leaf samples for the progeny of T1 transformants were collected at midday in the light. (Samples were loaded on gels on an equal-leaf-area basis.) Phosphorylated PEPC was detected with the specific antibody and with anti-IgG alkaline phosphatase conjugate (Bio-Rad) as secondary antibody. Immunoblots were developed using the AttoPhos fluorescence substrate system (Promega). There were no other bands on the membrane.
Detection of PEPC-PK and PEPC mRNA by Reverse Transcription-PCR

Detection of PpcA and PK mRNA by RT-PCR. RNA was extracted from wild-type (Wt) leaves collected at midnight (D) and midday (L) and from leaves of progeny of A47b#6 and R111a#3 collected at midday. Plants were growing in a naturally lit glasshouse during January and February, 2007. RNA was retrotranscribed and samples of the first-strand synthesis were used in PCR reactions with gene-specific primers as described in “Materials and Methods.” Similar results were obtained in two independent experiments.
Phosphorylation of PEPC in Vitro
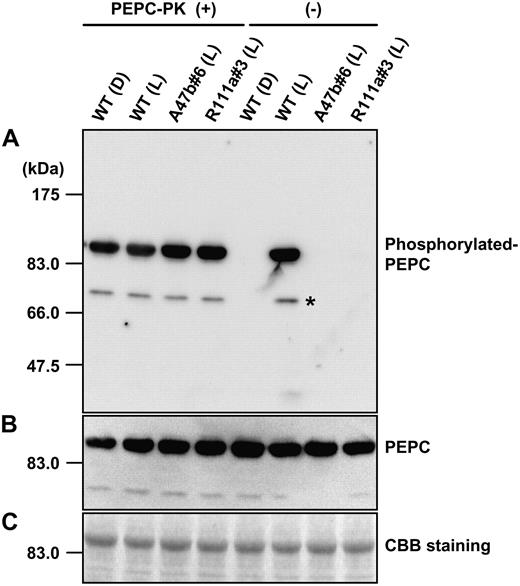
In vitro rephosphorylation of PEPC. The left-hand side shows the phosphorylation state of PEPC extracted form leaves of wild type (Wt) collected at midnight in the dark (D) or collected at midday in the glasshouse in the light (L) and from progeny of A47b#6 and R111a#3 collected at midday in the light after in vitro phosphorylation of PEPC in the presence of recombinant PEPC-PK from F. trinervia. A, Phosphorylated PEPC was detected with the specific antibody and with anti-IgG HRP conjugate (Pierce) as secondary antibody. Immunoblots were developed using the chemiluminescent HRP substrate system (Millipore) and visualized with the luminoimage analyzer LAS-1000 (Fuji Film). The right-hand side shows the phosphorylation state of PEPC in the same leaf extracts without the addition of recombinant PEPC-PK (for details, see “Materials and Methods”). B, PEPC levels were also immunologically detected by reprobing the same membrane using anti-maize C4 PEPC antibody (for details, see “Materials and Methods”). C, A duplicate gel was run and stained with Coomassie Blue. On the left side on each image, positions of protein size makers are indicated. An asterisk indicates additional signals, solely observed in the rephosphorylation experiment due to longer incubation times.
Relationship between PEPC Phosphorylation and Malate Inhibition of PEPC
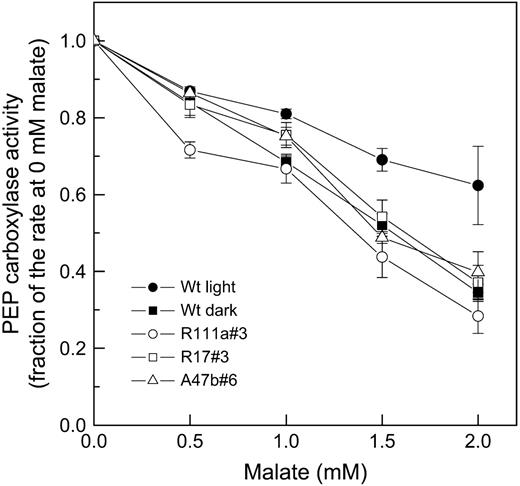
In vitro PEPC activity as a function of malate concentration assayed at pH 7.4 in HEPES-KOH, with 1 mm NaHCO3−, 3 mm PEP at 25°C (for details, see “Materials and Methods”). The means and ses are for PEPC activity measured in leaf extracts from three to four different progeny of transformants R111a#3, R17#3, and A47b#6 and five different leaf extracts for wild-type (Wt) leaves. PEPC was extracted from fresh leaf material which had been either kept in the dark until sampling (for wild-type dark samples) or was collected at midday in the glasshouse under growth light conditions in July, 2006. Mean values of PEPC activity at 0 mm malate are given in Table I.
Net CO2 assimilation rate (A), stomatal conductance to water vapor (gs), the ratio of intercellular to ambient CO2 (pi/pa), in vitro PEPC activity, and carbon isotope composition of leaf dry matter (δ13C)
Three different progeny were measured for each transgenic line and n = 4 for wild type. Gas-exchange measurements were made at external CO2 of 350 μbar, 2,000 μmol quanta m−2 s−1, and a leaf temperature of 28°C. PEPC activities were made as described in Figure 4 and are the rates obtained in the absence of malate. n.d., Not determined.
Genotype | μmol m−2 s−1 | gs (H2O) mol m−2 s−1 | pi/pa | PEPC Activity μmol m−2 s−1 | δ13C |
|---|---|---|---|---|---|
| Wild type (light) | 38.7 ± 0.9 | 0.6 ± 0.08 | 0.6 ± 0.02 | 124 ± 5.6 | −15.7 ± 0.14 |
| Wild type (dark) | n.d. | n.d. | n.d. | 96 ± 54.2 | n.d. |
| R111a#3 | 39.5 ± 1.63 | 0.85 ± 0.25 | 0.66 ± 0.05 | 124 ± 6.9 | −15.8 ± 0.17 |
| R17#1 | 40.00 ± 0.87 | 0.84 ± 0.12 | 0.67 ± 0.03 | 112 ± 3.1 | −15.1 ± 0.07 |
| A47b#6 | 39.3 ± 0.3 | 0.7 ± 0.15 | 0.62 ± 0.07 | 131 ± 3.5 | −15.1 ± 0.19 |
Relationship between PEPC Phosphorylation and CO2 Assimilation Rates of Leaves
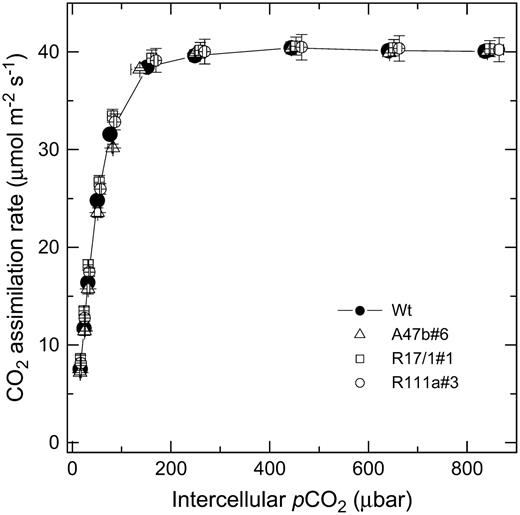
Mean CO2 assimilation rate as a function of intercellular pCO2 for wild type (black symbols) and progeny of T1 transformants A47b#6, R17/1#1, and R111a#3. The means are from measurements made on three different individual plants for each genotype at 2,000 μmol quanta m−2 s−1 and a leaf temperature of 28°C with a LI 6400 gas-exchange system in the glasshouse between 10 am and 2 pm during June and July, 2006. Midday irradiance in the glasshouse was approximately 800 μmol quanta m−2 s−1.
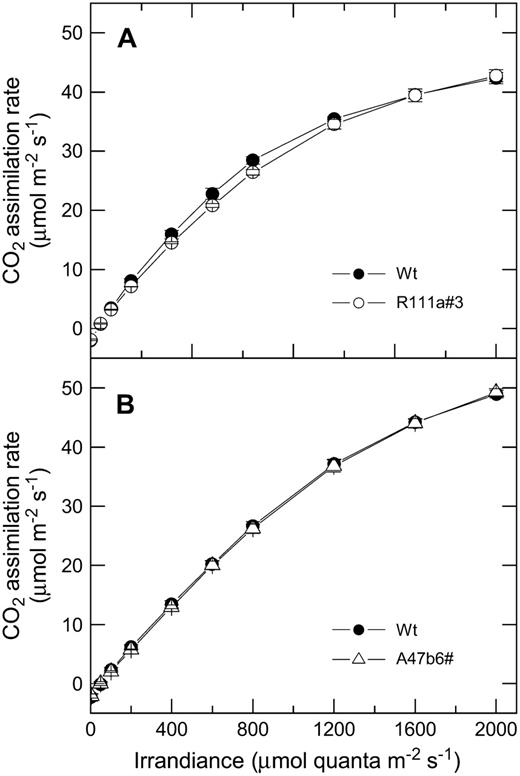
A, Mean CO2 assimilation rate as a function of irradiance for F. bidentis wild-type plants (black symbols) and progeny of T1 transformants R111a#3 (white symbols). The means are from measurements made on three different individual plants for each genotype with a LI 6400 gas-exchange system in the glasshouse between 10 am and 2 pm. Measurements were made at pCO2 of 380 μbar and a leaf temperature of 28°C and started at 2,000 μmol quanta m−2 s−1. The leaves were acclimated at this irradiance for 20 min and then irradiance was reduced at 5-min intervals. Plants were grown during June and July, 2006, and midday irradiance in the glasshouse was approximately 800 μmol quanta m−2 s−1. B, Mean CO2 assimilation rate as a function of irradiance for F. bidentis wild-type plants (black symbols) and progeny of T1 transformants A47b#6 (white symbols). Measurements were made as described for A. Plants were grown during January and February, 2007, and midday irradiance in the glasshouse was approximately 1,500 μmol quanta m−2 s−1.
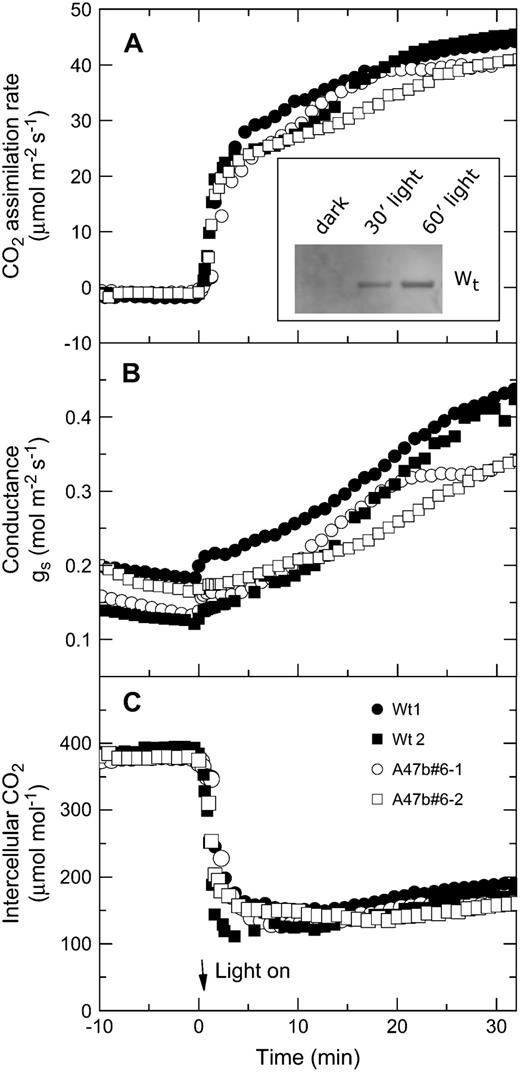
Light induction of CO2 assimilation rate, stomatal conductance, and intercellular pCO2 in two wild-type plants (black symbols) and two progeny of T1 transformant A47b#6 (white symbols). Leaves were kept in the dark overnight by wrapping the leaves in foil. Leaves were acclimated in the dark in the leaf chamber at pCO2 of 380 μbar and a leaf temperature of 28°C for 10 min before irradiance was increased to 2,000 μmol quanta m−2 s−1. Inset, Example of increase in PEPC phosphorylation in wild type after foil was removed from a leaf at midday and leaf was exposed to 1,500 μmol quanta m−2 s−1.
Carbon isotope discrimination during C4 photosynthesis is, among other things, related to the extent to which Rubisco can fractionate against CO2. This, in turn, is determined by the amount of leakiness (ϕ), defined as the fraction of CO2 fixed by PEPC that subsequently leaks out of the bundle sheath cells. To examine whether the balance between the C4 cycle activity and the C3 cycle in the bundle sheath had been affected by the lack of PEPC phosphorylation, we compared the 13C composition of leaf dry matter of the T2 progeny with low phosphorylation levels with that of wild type, but we observed no differences (Table I).
Relationship between PEPC Phosphorylation and Leaf Metabolite Levels
To examine whether the lack of PEPC phosphorylation in the transformants had been compensated for by an altered balance of photosynthetic metabolites, we combined gas exchange of leaves with rapid freeze clamping of leaves. We measured a number of photosynthetic metabolites, but found no significant difference in metabolite levels between wild-type leaves and leaves of progeny of A47b#6 and R111a#3 (Table II
Leaf metabolite content and net CO2 assimilation rates
Four different progeny were measured for each transgenic line and wild type. Gas-exchange measurements were made at external CO2 of 350 μbar, 2,000 μmol quanta m−2 s−1, and a leaf temperature of 28°C before rapidly freeze clamping the leaf sections. Statistical analysis was conducted using ANOVA and there were no significant differences between genotypes.
CO2 Assimilation and Metabolites | Wild Type | A47b#6 | R111a#3 |
|---|---|---|---|
| CO2 assimilation rate (μmol m−2 s−1) | 55.0 ± 2.5 | 52.5 ± 2.3 | 50.8 ± 3.1 |
| Malate (μmol m−2) | 2,611 ± 257 | 2,605 ± 434 | 1,820 ± 150 |
| Asp (μmol m−2) | 237 ± 39 | 279 ± 45 | 195 ± 19 |
| Pyruvate (μmol m−2) | 308 ± 39 | 268 ± 15 | 241 ± 36 |
| PEP (μmol m−2) | 88 ± 4 | 97 ± 6 | 82 ± 7 |
| Triose-P (μmol m−2) | 261 ± 57 | 251 ± 32 | 273 ± 30 |
| Phosphoglyceradehyde (μmol m−2) | 365 ± 15 | 361 ± 23 | 365 ± 48 |
| Ribulose bisphosphate (μmol m−2) | 89 ± 16 | 68 ± 16 | 52 ± 39 |
DISCUSSION
Antisense and RNAi Constructs Targeting mRNA of PEPC-PK Have Generated Transgenic Plants with Low Phosphorylation of PEPC
The regulatory phosphorylation of PEPC has been studied intensively in vitro (Chollet et al., 1996; Vidal and Chollet, 1997; Nimmo, 2003; Izui et al., 2004), but to date it has been difficult to examine the impact of PEPC phosphorylation on photosynthetic CO2 exchange in vivo. Our transgenic approach has demonstrated unequivocally that the phosphorylation state of PEPC at its conserved Ser residue near the N terminus is modulated in vivo by a PEPC-specific kinase, PEPC-PK, similar to that isolated for F. trinervia, a closely related C4Flaveria species (Tsuchida et al., 2001). We only isolated a single cDNA for PEPC-PK, which contrasts with the results of Shenton et al. (2006) for maize and sorghum (Sorghum bicolor), which have a family of PEPC-PKs that are differently expressed between the mesophyll and bundle sheath. The recent development of a versatile antibody method for measuring the phosphorylation state of PEPC underpinned our current analysis (Ueno et al., 2000) in the absence of a specific antibody with which to quantitatively detect PEPC-PK itself. As previously reported with maize (Ueno et al., 2000; Fukayama et al., 2003), F. bidentis wild type shows only low levels of PEPC phosphorylation in the dark compared to the light. Many of our transformants showed phosphorylation levels less or similar to wild-type PEPC extracted from darkened leaves (Figs. 1 and 2) and we isolated T1 progeny from several different primary transformants with consistently low PEPC phosphorylation in the light (Fig. 1). The character was heritable and the progeny of two of the three selected lines all had low PEPC phosphorylation states, whereas the progeny of the third line showed some segregation presumably due to heterozygosity (Fig. 2). RT-PCR analysis linked the lack of PEPC phosphorylation in these transformants with low mRNA levels of PEPC-PK (Fig. 3). One might not expect to see close coupling between mRNA levels and the PEPC phosphorylation state because the PEPC phosphorylation level is determined by the balance of the PEPC-PK activity and the protein phosphatase activity (Dong et al., 2001). Therefore, reduction of the PEPC-PK mRNA level strongly supports our thesis that low PEPC phosphorylation in these transgenic plants is due to reduced levels of PEPC-PK. In vitro experiments showed that PEPC isolated from leaves of these transformants could be readily rephosphorylated in vitro, indicating that lack of PEPC phosphorylation could not be due to N-terminal truncation.
PEPC Extracted from Transgenic Plants Shows Increased Malate Sensitivity in Vitro
It is well documented that PEPC activity is modulated in vitro by a wide range of effectors, such as phosphorylated intermediates (triose- and hexose-P), amino acids, and organic acids, such as malate, especially under suboptimal pHs that approximate cytosolic pH (Doncaster and Leegood, 1987; Duff et al., 1995; Vidal and Chollet, 1997). Variation of the malate sensitivity of PEPC has been correlated with variations in PEPC phosphorylation when PEPC was modulated in vitro or through diurnal variations in irradiance (Jiao and Chollet, 1991; Huber et al., 1994; Vidal and Chollet, 1997; Fukayama et al., 2003). Here, we have shown by targeted molecular manipulation in vivo that reducing PEPC-PK levels leads to reduced PEPC phosphorylation in the light and that this, in turn, increases the malate sensitivity of PEPC.
Reduced PEPC Phosphorylation Does Not Affect CO2 Assimilation Rates
It has so far been difficult to test how important variation in malate sensitivity is to PEPC functioning in vivo. The mesophyll cytosolic pH is thought to be around 7.4, which forces PEPC to operate at suboptimal pH in vivo. Concentrations of PEP, triose-P, malate, and Asp have all been shown to increase with increasing pCO2, whereas Glc-6-P concentrations are relatively constant. The amounts of many of the metabolites in C4 leaves remain virtually constant in relation to irradiance, except at very low light (Leegood and von Caemmerer, 1988, 1989, 1994). In our transgenic plants, where phosphorylation of PEPC was undetectable, CO2 assimilation rates were indistinguishable from wild-type plants. Although the CO2 assimilation rate is correlated with PEPC activity at low intercellular CO2 (Dever, 1997; von Caemmerer and Furbank, 1999), we did not observe any difference in the initial slope of the CO2 response curve. This observation suggests that flux through PEPC even at low pCO2 was not limited by low phosphorylation status. We also observed no difference between the light response curves for wild-type and transgenic plants. We therefore conclude that high phosphorylation levels of PEPC are not essential for high photosynthetic rates in F. bidentis under the range of our experimental conditions examined. Our results contrast with conclusions drawn from inhibitor studies made in sorghum and maize (Bakrim et al., 1993). In this study, feeding the protein synthesis inhibitor cycloheximide (which had been previously shown to prevent phosphorylation of PEPC) resulted in a decrease in CO2 assimilation rate in both sorghum and maize, but not in wheat (Triticum aestivum). It is possible that the role of PEPC-PK is different in these two species or, alternatively, because cycloheximide is not a specific inhibitor of PEPC-PK, it could also have affected other essential proteins of the photosynthetic pathway. To solve this discrepancy, production of transgenic maize, with reduced levels of phosphorylated PEPC, is essential. We also found that the phosphorylation state did not affect the transient behavior of the CO2 assimilation rate when leaves were taken from the dark and exposed to light (Fig. 8). Indeed, phosphorylation of PEPC in wild-type leaves was much slower than photosynthetic induction, making it unlikely to play a role in regulation C4 photosynthesis during light transients. The slow rate of phosphorylation and dephosphorylation has been shown previously (Bakrim et al., 1992).
Malate and Asp concentrations are highest at high light and at ambient and high pCO2. It is likely that PEPC activity does not limit the rate of CO2 assimilation under these conditions, but that the regulation of PEPC may nevertheless be important for the coordination of the C3 and C4 cycles of the pathway. We therefore combined CO2 assimilation rate measurements at high light with measurements of photosynthetic metabolite levels to see whether any changes in metabolite levels had occurred. However, there were no significant differences in metabolite levels between wild type and transformants (Table II). Unfortunately, it is not possible from these measurements to estimate photosynthetically active malate. It has been shown with 14C labeling studies that the photosynthetic malate pool is only a small fraction of leaf malate content, a large amount being presumably stored in leaf veins (Hatch, 1979). The high malate pools we measured here support this observation. F. bidentis is an NADP-malic enzyme dicot, but uses both malate and Asp as translocated C4 acids (Meister et al., 1996). Thus, Asp levels could potentially influence PEPC activity at a given level of phosphorylation in these plants because Asp inhibits PEPC in a similar fashion to malate. There were no differences observed in the whole-leaf Asp pool sizes between wild type and transformants in these experiments, suggesting that transformants with low PEPC phosphorylation did not compensate with lower levels of Asp; however, we cannot rule out that Asp pools may have changed within the mesophyll cytosol.
We also examined the carbon isotope composition of leaf dry matter as a sensitive tool to detect changes in coordination of C3 and C4 cycles of the pathway in transgenic plants. Carbon isotope discrimination during C4 photosynthesis is primarily dependent on the discrimination occurring during CO2 diffusion into the leaf and by the extent to which Rubisco can fractionate against CO2. This is, in turn, determined by the amount of leakiness (ϕ), defined as the fraction of CO2 fixed by PEPC that subsequently leaks out of the bundle sheath. Leakiness (ϕ) depends on the relative capacities of the C3 and C4 cycle as well as bundle sheath resistance to CO2 diffusion. Previous studies have shown that this coordination is disrupted in transgenic F. bidentis with reduced amounts of Rubisco and leakiness is increased, which is evident in increased dry matter carbon isotope composition (von Caemmerer et al., 1997). Leaf dry matter carbon isotope discrimination is an integrated measure of coordination over the life of a leaf and this could have picked up differences occurring during growth not apparent under our gas-exchange conditions. However, there were not detectable differences between transgenics and wild type in this study (Table I), leading us to conclude that there were no major alterations in the coordination between the C3 and C4 cycles. At present, we have only compared wild-type and transgenic plants under high nutrition and well-watered conditions; however, increased phosphorylation of PEPC has been observed under both nitrogen and salt stress conditions and further experiments are needed to elucidate the role of PEPC phosphorylation under stress conditions (Ueno et al., 2000; Garcia-Maurino et al., 2003).
Conclusion
Several of our transgenic F. bidentis lines with antisense or RNAi constructs targeted to PEPC-PK show low phosphorylation of PEPC in the light. This affects the malate sensitivity of the extracted PEPC, but does not appreciably affect net rates of CO2 assimilation under any condition examined. This raises the intriguing question of what physiological role this complexly regulated reversible phosphorylation of PEPC plays in C4 species.
MATERIALS AND METHODS
Plasmid Construction and Plant Transformation and Regeneration
For full-length cDNA isolation, a Flaveria bidentis leaf cDNA library was constructed into λ-gt10 phage as described previously (Tsuchida et al., 2001). From approximately 3.0 × 10⁵ phages, 12 PEPC-PK cDNA clones were screened with a radiolabeled Flaveria trinervia PEPC-PK cDNA fragment as a probe. Among them, a clone, containing the longest cDNA (approximately 1.3 kb in length), was selected. The inserted cDNA was subcloned into the EcoRI site of pBluescript KS(−) and fully sequenced (DNA Data Bank of Japan [DDBJ] accession no. AB272061).
For F. bidentis transformation, antisense and RNAi plasmids were constructed using the full cDNA clone of F. bidentis PEPC-PK. For construction of the antisense plasmid, the binary vector system of pART7, pART27, was used (Gleave, 1992). At first, the NotI fragment of the pART7 plasmid was introduced into the NotI site of pART27, designated pART27-T. The full-length PEPC-PK cDNA inserted into the EcoRI site of pBluescript was digested with XbaI and XhoI; the resulting cDNA fragment was subcloned between the XbaI and XhoI sites of pART27-T. For construction of the RNAi clone, the Kannibal plasmid system was used (Wesley et al., 2001). At first, the full-length PEPC-PK cDNA inserted into the EcoRI site of pBluescript was digested with XbaI and HindIII or with EcoRI. Both fragments were inserted into the corresponding sites of pART7. After checking the direction of the inserted cDNA at the EcoRI site by PCR, the resulting plasmid was digested with XbaI and XhoI, and the digested fragment was subcloned between the XbaI and XhoI sites of pART27-T.
F. bidentis was transformed and regenerated using the Agrobacterium method, as described by Chitty et al. (1994), except that shoots, selected on kanamycin, were immediately placed in a high CO2 environment (approximately 25 mbar pCO2).
Plant Growth
Primary transformants were grown to seed in a growth cabinet under approximately 25 mbar pCO2 and an irradiance of 400 μmol quanta m−2 s−1. Air temperature was 25°C during a 14-h day and 18°C at night. Plants were watered daily and twice weekly with a complete nutrient solution. Primary transformants were allowed to grow to seed. Subsequently, T1 generation of the primary transformants R17, R111a, R112, R113, A43a, and A47b were grown in a growth cabinet at ambient pCO2 and an irradiance of 500 μmol quanta m−2 s−1. Air temperature was 30°C during a 14-h day and 20°C at night and the relative humidity was 70%. Several plants of the T1 generations that showed low levels of PEPC phosphorylation were grown to seed. The T2 generation (progeny of T1 plants R17/1#1, R111a#3, and A47b#6) were grown in a glasshouse under natural light conditions during June and July, 2006, and during January and February, 2007, in Canberra. Glasshouse temperature was maintained at 28°C during the day and 18°C at night. Midday irradiance on clear days was approximately 800 μmol quanta m−2 s−1 in June and July, 2006, and 1,500 μmol quanta m−2 s−1 in January and February, 2007. Plants were grown in 5-L pots in a garden mix with 2.4 to 4 g of Osmocote/L soil (15/4.8/10.8/1.2 N/P/K/Mg + trace elements: B, Cu, Fe, Mn, Mo, Zn; Scotts) and watered daily.
Purification of RNA from Leaf Discs
Leaves were taken from F. bidentis wild-type and T2 generation plants grown in the glasshouse in February, 2007, at midnight and at midday. Leaf discs were ground into a fine powder with a mortar and pestle in liquid nitrogen. Total RNA was extracted by adding 1.0 mL of Tri-Reagent reagent (Sigma) to 60 mg each of the fine powder. After a 5-min incubation at room temperature, the mixture was centrifuged at 12,000g for 10 min at 4°C and the pellet was discarded. The phase separation was achieved by adding 200 μL of chloroform and the mixture was shaken for 15 s. Samples were placed at room temperature for 5 min and then centrifuged at 12,000g for 15 min at 4°C. The upper phase was collected into tubes containing 0.5 mL of isopropanol, inverted several times, and placed at room temperature for 10 min. Precipitated RNA was pelleted by centrifugation at 12,000g for 10 min at 4°C and washed twice with 75% ethanol (v/v). Samples were stored in 75% ethanol at −20°C.
Detection of PEPC and PEPC-PK mRNA by RT-PCR
One microgram of RNA was retrotranscribed with oligo(dT) primers using the SuperScript III first-strand synthesis system for RT-PCR (Invitrogen). One microliter of the total reaction mixture (20 μL) was then used as a template in the PCR reaction with gene-specific primers, PpcA (5′-atccgtacatcacaacc-3′, 5′-gttctgcattccagcag-3′), PEPC-PK (5′-cgagaccgaagccgcga-3′, 5′-cgagcttcaaaccccctcg-3′). PCR was performed for 18 cycles and 23 cycles, respectively.
Immunodetection of Phosphorylated PEPC
Phosphorylated PEPC was detected in whole-leaf extracts using immunoblotting techniques. Leaf discs (approximately 1 cm2) were collected 2 to 3 h into the light period for growth cabinet-grown plants or collected at midday for glasshouse-grown plants briefly snap frozen in liquid nitrogen for transfer to the laboratory. For the dark samples, leaves were wrapped in silver foil and darkened overnight. After transfer to the laboratory, leaf discs were extracted immediately in 0.7 mL of ice-cold extraction buffer containing 50 mm HEPES-KOH, pH 7.8, 5 mm MgCl2, 2 mm EDTA, 5 mm dithiothreitol, 1% (w/v) polyvinylpolypyrrolidone, 0.1% (v/v) Triton X-100, and 4% (v/v) of protease inhibitor cocktail (Sigma), using a 2-mL glass homogenizer. Samples were centrifuged in a microcentrifuge at maximum speed for 1 min. The green pellet was discarded and the supernatant was brought to a final concentration of 2% (w/v) SDS and heated to 65°C in a water bath for 10 min. Samples were prepared for gel loading by adding 0.25 volumes of Bio-Rad XT sample buffer (Bio-Rad). Samples were loaded on an equal-leaf-area basis. Proteins were separated by electrophoresis on NuPAGE Bis-Tris precast gels (4%–12% acrylamide concentration; Novex), using the manufacturer-specified buffer system, and blotted onto nitrocellulose membranes. Blots were probed with an antiphosphorylated PEPC raised against a synthetic peptide, which corresponded to the sequence around the phosphorylation site Ser-15 of maize (Zea mays). Anti-IgG alkaline phosphatase conjugate (Bio-Rad) was used as the secondary antibody. Immunoblots were developed using the AttoPhos fluorescence substrate system (Promega). Duplicate gels were run and either stained with Coomassie Blue or blotted and probed with a polyclonal antibody to recombinant maize PEPC.
Assay of in Vitro Rephosphorylation of PEPC
Leaves were collected at midday as described above. One leaf was then extracted in 2 mL of protein extraction buffer (50 mm Tris-HCl, pH 8.0, 0.04% Tween 20, 1 mm dithiothreitol, 15% ethylene glycol, 1 mm phenylmethylsulfonyl fluoride, 50 μm proteasome inhibitor MG132 [Peptide Institute]) and proteinase inhibitor cocktail, complete mini (Boehringer). The extract was centrifuged at 35,000g for 5 min at 4°C and 90 μL of supernatant was immediately added to 10 μL of a 10× protein kinase buffer (10 mm EGTA, 1 mm ATP, 20 mm MgCl2 with or without 0.05 μg of purified recombinant PEPC-PK from F. trinervia [Tsuchida et al., 2001]). The mix was incubated for 15 min at 30°C. SDS loading buffer (3×) was then added and the samples boiled for 5 min at 95°C, and then 5-μL aliquots were separated on the 7.5% SDS-PAGE gel. Phosphorylated PEPC was detected with the specific antibody and with anti-IgG horseradish peroxidase (HRP) conjugate (Pierce) as secondary antibody. Immunoblots were developed using the chemiluminescent HRP substrate system (Millipore) and visualized with the luminoimage analyzer LAS-1000 (Fuji Film). After detection of the phosphorylated levels, blotted membranes were reprobed with anti-maize PEPC antibody after stripping. Membranes were incubated with 50 mL of stripping buffer (62.5 mm Tris-HCl, pH 6.8, 2% SDS, 112 mm 2-mercaptethanol) for 45 min at 50°C. Then the stripping buffer was washed away under running tap water for 2 h. After blocking and reprobing steps, PEPC were detected with the anti-maize C4 PEPC antibody as described previously (Ueno et al., 2000) and signals were visualized as described above.
Assay of PEPC Activity
Leaf discs (approximately 1 cm2) were collected at midday for glasshouse-grown plants briefly snap frozen in liquid nitrogen for transfer to the laboratory. For the dark samples, leaves were wrapped in silver foil and darkened overnight. Leaf discs were extracted the same day in 0.7 mL of ice-cold extraction buffer containing 50 mm HEPES-NaOH, pH 7.8, 15 mm MgCl2, 1 mm EDTA, 10 mm dithiothreitol, 1% (w/v) polyvinylpolypyrrolidone, 0.01% (v/v) Triton X-100, and 4% (v/v) protease inhibitor cocktail (Sigma), using a 2-mL glass homogenizer. Samples were centrifuged in a microcentrifuge at maximum speed for 1 min and assayed immediately.
The activity of PEPC was measured in 30 μL of leaf extracts at 25°C under suboptimal conditions in a 1-mL assay mixture containing 100 mm HEPES-NaOH, pH 7.4, 10 mm MgCl2, 1 mm NaHCO3, 3 mm PEP, 0.2 mm NADH, 12 units mL−1, with malate concentrations ranging from 0 to 2 mm. The reaction was started by the addition of PEP and the oxidation of NADH was monitored by A340.
Gas-Exchange Measurements
Gas-exchange measurements on selected T2 plants were made in the glasshouse on young fully expanded leaves between 10 am and 2 pm. CO2 response curves were made using the LI-COR CO2 injection system at 2,000 μmol quanta m−2 s−1 and a leaf temperature of 28°C. First measurements were made at a pCO2 of 350 μbar, then pCO2 was lowered to 50 μbar and increased in steps up to a final value of 1,000 μbar. For the light response curves, measurements were made at pCO2 of 380 μbar and a leaf temperature of 28°C and started at 2,000 μmol quanta m−2 s−1. The leaves were acclimated at this irradiance for 20 min and then irradiance was reduced stepwise at 5-min intervals.
Rapid Freeze Clamping of Leaves
Leaf gas exchange was measured with the LI-COR 6400 in a purpose-built leaf chamber attached to a rapid-kill apparatus (Badger et al., 1984). Illumination was provided by 150-W slide projector light, which was passed via a mirror to the leaf chamber. Leaves were acclimated in the chamber at pCO2 of 380 μbar, a leaf temperature of 28°C, and irradiance of 2,000 μmol quanta m−2 s−1 for 40 min before the leaf was rapidly freeze clamped between two liquid nitrogen-cooled copper rods. During this procedure, the mirror, which was held in place by a spring-loaded mounting, was pushed out of the way by the upper copper rod. This procedure yielded a frozen leaf disc with a uniform area (5.3 cm2), which was stored at −80°C prior to extraction.
Metabolite Measurements
Frozen leaf discs were ground to a fine powder and extracted with 1 mL of frozen 1 m HCLO4 and metabolites assayed as described previously (Leegood and Furbank, 1984; Leegood and von Caemmerer, 1988) in a diode array spectrophotometer (8452A; Hewlett-Packard). Malate, Asp, pyruvate, and PEP were measured immediately after extraction. The remaining neutralized extract was snap frozen in liquid nitrogen and stored at −80°C for later analysis of triose-P, phosphoglyceraldehyde acid, and ribulose-1,5-bisphosphate. These were measured consecutively in the same assay as described previously (He et al., 1997) using Rubisco purified from tobacco (Nicotiana tabacum; Schrader et al., 2006).
Dry Matter δ13C
Leaves similar to the one used during gas exchange were collected, oven dried at 70°C, and ground with a mortar and pestle. A subsample of ground tissue was weighted and the isotopic composition determined by combustion in a Carlo Erba elemental analyzer and the CO2 was analyzed by mass spectrometry. The δ was calculated as [(Rsample − Rstandard)/Rstandard] × 1,000, where Rsample and Rstandard are the 13/12C of the sample and the standard V-Pee Dee Belemnite, respectively.
Sequence data from this article can be found in the GenBank/EMBL data libraries under accession number AB272061.
LITERATURE CITED
Bakrim N, Echevarria C, Cretin C, Arrio-Dupont M, Pierre JN, Vidal J, Chollet R, Gadal P (
Chitty JA, Furbank RT, Marshall JS, Chen ZH, Taylor WC (
Dever LV (
Dever LV, Blackwell RD, Fullwood NJ, Lacuesta M, Leegood RC, Onek LA, Pearson M, Lea PJ (
Duff SMG, Andreo CS, Pacquit V, Lepiniec L, Sarath G, Condon SA, Vidal J, Gadal P, Chollet R (
Furbank RT, Hatch MD, Jenkins CLD (
Garcia-Maurino S, Monreal JA, Alvarez R, Vidal J, Echevarria C (
Hatch MD (
Hatch MD, Osmond CB (
He Z, von Caemmerer S, Hudson GS, Price GD, Badger MR, Andrews TJ (
Huber SC, Huber JL, McMichael RW (
Leegood RC, von Caemmerer S (
Meister M, Agostino A, Hatch MD (
Nimmo GA, Mcnaughton GAL, Fewson CA, Wilkins MB, Nimmo HG (
Ueno Y, Imanari E, Emura J, Yoshizawa-Kumagaye K, Nakajima K, Inami K, Shiba T, Sakakibara H, Sugiyama T, Izui K (
Vidal J, Chollet R (
von Caemmerer S, Furbank RT (
Author notes
This work was supported in part by the Ministry of Education, Science, Sports and Culture of Japan (Grants-in-Aid for Scientific Research to K.I. and T.F.); by the Ministry of Agriculture, Forestry and Fisheries of Japan (grant for the Recombinant Plant Project to K.I. and T.F.); and by the New Energy and Industrial Technology Development Organization and Research Institute of Innovative Technology for the Earth (grant to T.F.).
Corresponding author; e-mail [email protected]; fax 61–2–61255075.
The author responsible for distribution of materials integral to the findings presented in this article in accordance with the policy described in the Instructions for Authors (www.plantphysiol.org) is: Susanne von Caemmerer ([email protected]).
Open Access articles can be viewed online without a subscription.
