


Abstract
RNA-binding proteins (RBPs) play critical roles in posttranscriptional gene regulation. Current methods of systematically profiling RBPs in plants have been predominantly limited to proteins interacting with polyadenylated (poly(A)) RNAs. We developed a method called plant phase extraction (PPE), which yielded a highly comprehensive RNA-binding proteome (RBPome), uncovering 2,517 RBPs from Arabidopsis (Arabidopsis thaliana) leaf and root samples with a highly diverse array of RNA-binding domains. We identified traditional RBPs that participate in various aspects of RNA metabolism and a plethora of nonclassical proteins moonlighting as RBPs. We uncovered constitutive and tissue-specific RBPs essential for normal development and, more importantly, revealed RBPs crucial for salinity stress responses from a RBP–RNA dynamics perspective. Remarkably, 40% of the RBPs are non-poly(A) RBPs that were not previously annotated as RBPs, signifying the advantage of PPE in unbiasedly retrieving RBPs. We propose that intrinsically disordered regions contribute to their nonclassical binding and provide evidence that enzymatic domains from metabolic enzymes have additional roles in RNA binding. Taken together, our findings demonstrate that PPE is an impactful approach for identifying RBPs from complex plant tissues and pave the way for investigating RBP functions under different physiological and stress conditions at the posttranscriptional level.
Background: RNA-binding proteins (RBPs) are important for controlling the fate of cells and for regulating important processes during development. Scientists study RBPs in a systematic way to understand how they control genes. However, studying RBPs in plants is difficult because plants have complex tissues. Additionally, most plant RBPs have only been discovered by studying a small fraction of RNA molecules called polyadenylated (poly(A)) RNA, which may not give a complete picture of all the RBPs. As a result, the true number of RBPs in plants may be much higher than previously thought.
Question: How can we develop a method to capture all the RBPs in plants, including those that bind to different types of RNA, i.e. poly(A) and non-poly(A), to get a comprehensive and unbiased understanding of RBPs in plants?
Findings: We developed a robust plant phase extraction (PPE) method and identified both constitutive and tissue-specific RBPs from Arabidopsis leaf and root tissues under normal growth conditions and salinity stress. We identified several previously unannotated RBPs, some of which are involved plant responses to salt stress. More importantly, 40% of the RBPs discovered by PPE are non-poly(A) RBPs. Interestingly, many of the RBPs discovered by PPE are metabolic/catabolic enzymes that do not have the classic RNA-binding domains that scientists typically associate with RBPs. We also uncovered 38 domains from these enzymes as putative RNA-binding domains and provided evidence that some catalytic domains of these enzymes can directly bind RNA.
Next steps: It would be intriguing to study how these salt-responsive RBPs respond to salinity stress at the posttranscriptional level and how RNA competes or cooperates with the substrate for these metabolic/catabolic enzymes in the regulation of RNA processing and intermediary metabolism.
Introduction
RNA-binding proteins (RBPs) form dynamic ribonucleoprotein complexes with RNA and play vital roles in posttranscriptional gene regulation. Virtually every aspect of RNA metabolism, including maturation (capping, splicing, and polyadenylation), editing, modification, subcellular localization, translation, and degradation, is exquisitely modulated by a myriad of RBPs that bind RNA transcripts in a general or spatiotemporal manner (Glisovic et al. 2008; Singh et al. 2015). In humans, defective RBPs cause cancer, metabolic disorders, and neurodegenerative diseases (Verkerk et al. 1991; Lefebvre et al. 1995; Bechara et al. 2013; Patel et al. 2015; Wang et al. 2019; Gebauer et al. 2021; Louis et al. 2021). In plants, RBPs are crucial regulators implicated in ovule development, the floral transition, circadian rhythms, stress, and immune responses (Heintzen et al. 1997; Macknight et al. 1997; Schomburg et al. 2001; Kim et al. 2005; Zhang et al. 2005; Deleris et al. 2006; Zhang et al. 2011; Bush et al. 2015; Zhang et al. 2015; Albaqami et al. 2019; Marondedze et al. 2019b). Therefore, investigating the interplay between RBPs and RNA has undoubtedly shaped and deepened our understanding of how RBPs govern developmental processes and environmental responses.
Typical RBP–RNA interactions are mediated by RNA-binding domains (RBDs), which recognize either specific sequence elements or secondary/tertiary structures of their RNA partners. The most prevalent RBDs are conserved in eukaryotic cells, including the RNA recognition motif (RRM), the K-homology (KH) domain, the DEAD-box helicase domain, the double-stranded RNA-binding motif (DSRM), the zinc finger domain, and other less abundant domains (Silverman et al. 2013; Gerstberger et al. 2014). It is worth noting that plant RBPs are more diversified than their mammalian counterparts. For instance, ∼50% of RRM-type plant RBPs have no ortholog in metazoans (Lorkovic and Barta 2002). Also, the presence of far more plant pentatricopeptide repeat (PPR)-type RBPs, which regulate posttranscriptional events in plastids and mitochondria (Cheng et al. 2016), suggests that these RBPs are more likely involved in plant-specific biological processes.
The identification of classical RBDs has enabled the computational prediction of RBPs based on sequence homology across species. Increasing evidence suggests that proteins without known RBDs also possess the ability to bind RNAs, including metabolic enzymes such as thymidylate synthase, aconitase, and glyceraldehyde 3-phosphate dehydrogenase (GAPDH), which have been found to have additional, nonmetabolic functions known as “moonlighting” functions (Chu et al. 1991; Hentze and Argos 1991; Chang et al. 2013). The recurrent identification of unconventional RBPs strongly indicates that the number of RBPs has been underestimated and that the way RBPs interact with RNAs is more sophisticated than predicted. Indeed, the human RBP repertoire has immensely expanded, with approximately half of the RBPs lacking canonical RBDs revealed by RNA interactome capture (RIC) in human cell lines (Baltz et al. 2012; Castello et al. 2012). RIC is a method based on UV-cross-linking and oligo d(T) affinity purification to systematically profile the RNA-binding proteome (RBPome) bound to polyadenylated (poly(A)) RNAs (Baltz et al. 2012; Castello et al. 2012). This powerful approach has since been applied to various cell types and organisms, leading to the discovery of 1,914 RBPs in human, 1,393 in mouse, 1,273 in yeast, 777 in Drosophila, and 594 in nematode (Kwon et al. 2013; Beckmann et al. 2015; Matia-Gonzalez et al. 2015; Liao et al. 2016; Liepelt et al. 2016; Sysoev et al. 2016; Despic et al. 2017; Hentze et al. 2018). RIC was later adapted and improved in Arabidopsis (Arabidopsis thaliana) using etiolated seedlings, mesophyll protoplasts, root cell cultures, leaves, and seeds (Marondedze et al. 2016; Reichel et al. 2016; Zhang et al. 2016; Marondedze et al. 2019a; Bach-Pages et al. 2020; Sajeev et al. 2022). When combined, a staggering number of RNA-related proteins were identified (2,782), with 843 proteins registered as RBPs and 1,939 proteins as candidate RBPs in Arabidopsis (Marondedze 2020; Sajeev et al. 2022). However, the overlap between these data sets is considerably low, as a study found that only 25 RBPs were shared in 4 of these Arabidopsis RBPomes (Bach-Pages et al. 2020).
RIC has been extensively explored in eukaryotes throughout the past decade; however, very few of these proteins were experimentally validated as bona fide RBPs. Moreover, this approach is heavily biased toward RBPs that bind poly(A) RNAs. Given that mRNA only represents <5% of the population of total RNA in eukaryotic cells, the full spectrum of RBPs might still be far from complete due to the incomplete recovery of RBPs that specifically interact with the vast majority of non-poly(A) RNAs. To circumvent the inherent limitation of RIC, 2 methods, namely, RICK (capture of the newly transcribed RNA interactome using click chemistry) and CARIC (click chemistry-assisted RIC), based on metabolic labeling of cells with nucleotide analogs followed by click chemistry and streptavidin affinity enrichment, were used to characterize RBPs attached to both coding and noncoding RNAs (Bao et al. 2018; Huang et al. 2018). Although these approaches addressed the drawback of RIC by recovering RBPs that potentially bind to non-ploy(A) RNAs, they rely on efficient in vivo labeling of RNA and can introduce bias caused by transcription-dependent nucleotide incorporation. Additionally, the application of these methods to complex tissues is hindered by the limited uptake of nucleotide analogs.
New strategies using phase separation/extraction, including protein-cross-linked (CL) RNA extraction (XRNAX), orthogonal organic phase separation (OOPS), and phenol-toluol extraction (PTex), have been developed to unbiasedly identify RBPs in human cell lines, mouse brain, and bacteria (Queiroz et al. 2019; Trendel et al. 2019; Urdaneta et al. 2019). CL RBP–RNA adducts can be separated from free RNA and proteins solely based on their physicochemical properties, using acid guanidinium thiocyanate-phenol (commercially available as Trizol reagent)-chloroform phase extraction. The CL RBP–RNA adducts migrate into the insoluble interphase, free RNA moves to the aqueous phase, and proteins remain in the organic phase, thereby overcoming the challenges of the abovementioned approaches. RBPs, irrespective of their RNA type, were captured using these approaches, including many of those discovered by RIC and hundreds of additional ones that bind non-poly(A) RNAs (Queiroz et al. 2019; Trendel et al. 2019; Urdaneta et al. 2019). Phase extraction, such as OOPS, was also attempted in Arabidopsis (Liu et al. 2020). Unfortunately, the results fell short of expectations and were overshadowed by previous RIC studies using similar plant materials (Marondedze et al. 2016; Bach-Pages et al. 2020). Among the 468 proteins identified by OOPS, only 244 were considered “RBP,” and the rest remained debatable. For example, this method surprisingly classified the non-RBP protein histone H4 as a candidate RBP (Liu et al. 2020). Furthermore, only a small fraction of the OPPS-RBPome was shared by other studies, raising the question of whether plant RBPs can be effectively separated by phase extraction.
Transcriptome- and proteome-wide studies have uncovered a handful of RBPs in response to biotic and abiotic stress in plants (Muthusamy et al. 2021). However, both strategies have their own limitations: changes at the transcription level do not necessarily lead to changes at the protein level; quantitative proteomic analysis against the total protein extract only reveals the difference in the overall abundance of an RBP, but it may not impart actual changes in the RNA-binding status of this protein. Therefore, traditional mass spectrometry approaches, which measure overall protein abundance, may incorrectly classify RBPs that exhibit dynamic changes in RNA binding and likely respond to stress by altering RNA metabolism as nonstress-responsive RBPs. On the other hand, RIC and phase extraction-based methods primarily enrich RBP–RNA adducts prior to mass spectrometry analysis, thereby offering a complementary way to discover RBPs directly engaged in posttranscriptional regulation of stress responses and developmental phase transitions (Perez-Perri et al. 2018; Trendel et al. 2019; Marondedze et al. 2019a; Backlund et al. 2020; Liu et al. 2020; Sajeev et al. 2022).
Inspired by the successful application of phase extraction in human cell lines and bacteria, here we developed plant phase extraction (PPE) customized for plant tissue samples. Using PPE, we identified 2,517 RBPs from Arabidopsis leaf and root tissues under normal and saline conditions. Proteome-wide tissue-specific and salt-responsive RBPs were discovered, including classic RBPs involved in various aspects of RNA metabolism and metabolic enzymes with moonlighting RBP functions. Remarkably, we discovered 1,009 RBPs engaged in non-ploy(A) RNA binding. We showed that intrinsically disordered regions (IDRs) widely occur in the PPE–RBPome and may be partially responsible for noncanonical RNA binding. Moreover, we identified RBDs from nonclassical RBPs and validated a selected set as RBDs.
Results
Development of PPE in Arabidopsis
Given the intricate nature of plant tissues, which are composed of cell walls, plastids, and various secondary metabolites, we hypothesized that these factors may have contributed to the inadequate results obtained using OOPS in Arabidopsis. We repeated the OOPS procedures with 3 cycles of biphasic separation using Trizol to directly lyse leaf cells from fine-powdered samples ground in liquid nitrogen (Liu et al. 2020). In stark contrast to the thin and sticky white interphase layer primarily composed of RBP–RNA adducts observed in human cells, the extraction of Arabidopsis leaves resulted in a thicker and more solid interphase layer (Supplemental Fig. S1A). The interphase layer was composed of a complex mixture of RBP–RNA adducts, cell debris, starch, secondary metabolites, and substances tightly associated with cell debris, making it impractical to effectively separate the RBP–RNA adducts from the contaminants without compromising their purity and quantity. We also noticed that the non-RBP histone H4 was considered to be a “candidate RBP” using OOPS, strongly indicating that 3 rounds of phase extraction may not be sufficient to separate the interphase from “non-RBP contaminants.” To determine the optimal number of cycles needed, we performed 1 to 5 rounds of phase extraction and monitored the protein levels of histone H3 and H4 after each round of phase extraction to assess the purity of the interphase (Supplemental Fig. S1B; see details in Materials and methods). Even though their levels were significantly reduced, H3 and H4 were still present in the interphase after the 3rd round (even after the 4th round) of phase extraction. However, they were no longer detectable after the 5th round of extraction, while ARGONAUTE 1 (AGO1), a known RBP, remained in the same interphase, suggesting that 5 rounds of phase extraction are required to remove non-RBP proteins from RBPs (Supplemental Fig. S1C).
As a result, we adapted the XRNAX method commonly used for human cells to suit Arabidopsis tissues, incorporating several critical modifications, and designated this strategy as PPE. Firstly, to counteract the negative effects of UV-absorbing pigments from leaves, 3 cycles of UV-cross-linking were conducted at 200 mJ/cm2 (254-nm wavelength), irradiating the adaxial side twice and the abaxial side once (Zhang et al. 2015; Bach-Pages et al. 2020). Secondly, a lysis buffer with a high concentration of salt and detergent maximized the release of proteins, and polyvinylpyrrolidone 40 was added to remove secondary metabolites that interfered with mass spectrometry analysis. Then, centrifugation was performed before adding Trizol and chloroform to the supernatant to remove the cell debris and other insoluble substances prior to the capture of RBP–RNA adducts. Thirdly, since the interphase was not as sticky as that originating from human cells, it was difficult to wash away the residual aqueous and organic phases without disrupting the integrity of the interphase. To avoid the unnecessary loss of RBPs caused by washing, we replaced the washing step used in XRNAX with 2 rounds of phase extraction. Lastly, after DNase digestion and before isopropanol precipitation of the RBP–RNA adducts, 2 extra rounds of phase extraction were used to remove DNase and potential carry-overs from previous steps as much as possible (Fig. 1A).
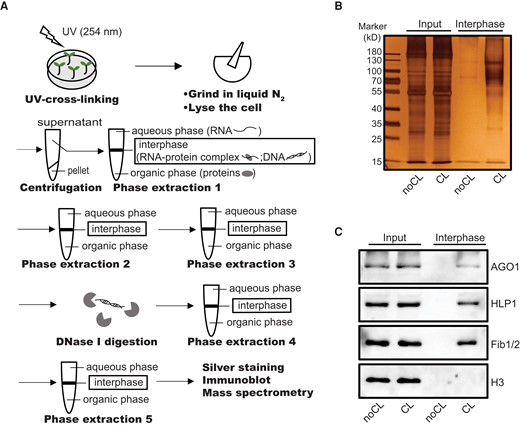
PPE in Arabidopsis. A) Schematic representation of PPE. B) Silver staining of the SDS–PAGE gel with interphase proteins acquired by PPE alongside diluted input (20-fold dilution) from noCL and CL samples. C) Immunoblot showing enriched RBPs (AGO1, HLP1, and Fib1/2) but not histone H3 in the CL samples.
To evaluate the efficiency of PPE, we prepared interphases from non-cross-linked (noCL) and CL samples (12-d-old Arabidopsis leaves). A thin insoluble interphase layer similar to the 1 shown in human cells was recovered from each sample, and the difference in the interphase layer between noCL and CL samples could be easily observed (Supplemental Fig. S1A). We separated proteins from these interphase layers by SDS–PAGE and visualized them by silver staining (Fig. 1B). Since certain groups of proteins, such as glycosylated proteins, share the physicochemical properties of RNA–protein adducts, they are present in the interphase layers from both CL and noCL samples (Queiroz et al. 2019). However, compared to noCL sample, more proteins were enriched in the CL sample with the same amount of starting material (Fig. 1B). Immunoblotting using antibodies against several known RBPs, including AGO1, HLP1, and Fib1/2 (Song et al. 2003; Rakitina et al. 2011; Zhang et al. 2015), further confirmed the presence of RBPs in the CL sample but not in the noCL control (Fig. 1C). As an abundant non-RBP, histone H3 was not detected in the CL sample (Fig. 1C). These results demonstrate that PPE is an efficient way to purify RBPs from plant leaf tissue.
Comprehensive identification of the Arabidopsis leaf and root RBPomes by PPE
Having established PPE to enrich RBPs, we sought to identify the RBPome from 12-d-old Arabidopsis seedlings. To show that PPE is a versatile method regardless of tissue types and to explore and compare tissue-specific RBPs, we separated root from leaf tissue and performed PPE and mass spectrometry analyses in parallel using both tissues with 3 biological replicates (see Materials and methods). The reproducibility among the replicates was demonstrated by scatter plots comparing the protein enrichment in CL samples over noCL samples (log2 fold change [FC] [CL/noCL]; Fig. 2, A and B). The FC value of CL/noCL has been widely used to define reliable RBP in eukaryotic cells: a protein can be considered to be a RBP at a lower threshold using FC > 1 if it is significantly enriched with an adjusted P-value (false discovery rate [FDR]) < 5% (Queiroz et al. 2019) or FC > 0 and P < 1% (Reichel et al. 2016). In some cases, a higher FC cutoff (FC > 1.5 and P < 5%) was used (Marondedze et al. 2016; Bach-Pages et al. 2020). In this study, we adopted more stringent criteria of FC ≥ 2 and P < 5% to define RBPs as reported (Perez-Perri et al. 2018; Marondedze et al. 2019a; Backlund et al. 2020). In addition, proteins with an FC ≥ 1.5 and P < 20% were considered to be candidate RBPs as described (Backlund et al. 2020). Using such criteria, the best signal-to-noise ratio was achieved by recovering classical and other RBPs while excluding known contaminants as much as possible.
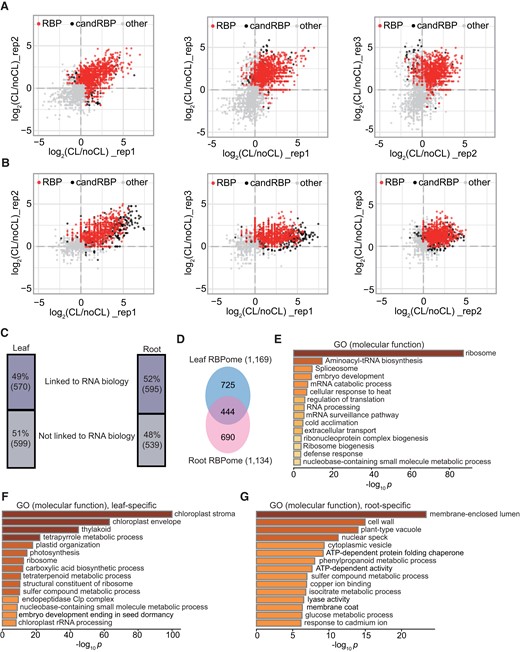
Identification of the RBP proteome using PPE. A, B) Scatter plots showing the reproducibility between biological replicates by comparing the log2 FC (CL + 1/noCL + 1) in leaf A) and root tissue B). Significantly enriched RBPs, candidate RBPs (candRBP), and non-RBPs are indicated. C) Proportions of the RBPs that are linked to RNA biology (57% in leaf and 52% in root) based on GO annotation. Numbers of each category are also shown. D) Comparison of the leaf and root RBPomes. E) Top 15 enriched GO terms of RBPs shared in leaf and root. F) Overrepresented GO terms of leaf-specific RBPs. F) Overrepresented GO terms of root-specific RBPs.
Of the 4,712 characterized leaf proteins and 4,033 root proteins, we defined 1,169 RNA-associated proteins in the leaf (1,118 proteins as RBPs and 51 as candidate RBPs) and 1,134 significantly enriched proteins in the root (918 RBPs and 216 candidate RBPs) (Supplemental Data Set 1). Since many of the candidate RBPs in 1 tissue were either defined as RBPs in the other tissue or known RBPs reported by other studies (see Supplemental Data Set 1 and the following data sets), we grouped both RBPs and candidate RBPs for the following analyses for simplicity. Based on the current gene ontology (GO) annotations, 49% and 52% of these proteins are linked to RNA biology in the leaf and root, respectively; the rest have no previously assigned RNA-related functions (Fig. 2C). GO enrichment analysis unveiled an overrepresentation of RNA-binding, ribosomal-related, and translation-related terms but also showed unexpectedly enriched terms in catabolic and metabolic processes in the “molecular function” category: both leaf and root proteins share overrepresented terms such as “isomerase activity,” “copper ion binding,” and “cobalt ion binding” (Supplemental Fig. S2A). However, they differ in many other catabolic and metabolic activity terms, reflecting functional disparities between the 2 tissues (Supplemental Fig. S2A). Accordingly, differences in enriched GO terms in the “biological process” and “cellular component” categories between leaf and root tissue were also observed (Supplemental Figs. S2B and S3). These RBPs were localized to various cellular compartments, with overrepresented GO terms in the chloroplast (leaf tissue), cytoplasm (ribosome, peroxisome, etc.), and nucleolus; these results are in line with their fundamental roles in RNA processing, transport, and translation (Supplemental Fig. S3, A and B). Most of the components constituting cytoplasmic stress granules (RBP47B, PABP4, UBP1B, UBP1C, TSN1, TSN2, NTF2, and RH6/8/12) and 4 members of processing bodies (P-bodies: XRN4, PAT1, VCS, and DCP5) were captured, unlocking the potential of PPE to investigate the dynamic roles of RBP under stress conditions.
Comparison between the leaf and root RBPomes showed that 444 RBPs are common in both tissues, representing 37% of the RBP population in the leaf and 39% in the root (Fig. 2D). These RBPs participate in fundamental biological processes such as ribosome biogenesis, RNA metabolism, translation, and response to biotic and abiotic stress and, therefore, may serve as constitutive RBPs (Fig. 2E). However, the majority of the leaf and root RBPomes are composed of tissue-specific RBPs, which GO enrichment analyses of these RBPs further confirmed. For the 725 leaf-specific RBPs, we discovered overrepresented GO terms in chloroplast-centered functions/activities, including but not limited to chloroplast organization (stroma, envelope, and thylakoid), photosynthesis, metabolic processes (synthesis of nucleotides, tetrapyrroles, tetraterpenoid, etc.), and protein degradation occurring in the chloroplast (by the Clp complex), as well as chloroplastic rRNA processing and ribosome assembly (Fig. 2F). By contrast, the 690 root-specific RBPs are mainly involved in essential processes in the root, such as the establishment of root barriers (“membrane-enclosed lumen,” “cell wall,” “membrane coat,” and “phenylpropanoid metabolic process”) and the uptake and transport of solutes (“plant-type vacuole,” “cytoplasmic vesicle,” and “glucose metabolic process”), as shown by GO enrichment analysis (Fig. 2G).
PPE identifies salt-responsive RBP–RNA dynamics in the leaf and root
For a given RBP, the total protein level is a combination of the levels of its RNA-bound form, the RNA-free form, and any other forms in between the 2, as RBP–RNA interactions are constantly subjected to dynamic changes during various physiological processes, developmental transitions, and in response to environmental cues. Previous proteomic studies have revealed proteins in Arabidopsis cell suspension cultures, leaves, and roots that are responsive to salt stress (Ndimba et al. 2005; Jiang et al. 2007; Pang et al. 2010; Rodriguez et al. 2021). However, these approaches can only quantify the overall abundance of proteins but are incapable of reflecting the actual changes in the 2 forms of RBPs (RNA-bound vs. RNA-free) in any of the abovementioned dynamic settings. Therefore, the number of salt-responsive RBPs most likely has long been underestimated. To specifically identify and quantify RBP–RNA interactions reacting to salinity stress, we used PPE to characterize RBPomes in leaf and root samples treated with 150 mm NaCl for 24 h, since PPE preferentially captures the whole RBP–RNA entity. Scatter plots confirmed the reproducibility of the 3 replicates for both tissues (Supplemental Fig. S4, A and B).
In total, peptides from 5,370 leaf proteins and 4,033 root proteins were detected by mass spectrometry, with 1,705 and 656 defined RBPs/candidate RBPs in leaf and root tissue, respectively (Supplemental Data Set 2). We first focused on the leaf RBPome, which has a total number of 1,927 RBPs, encompassing 1,169 RBPs from salt (−) samples (without salt treatment) and 1,705 RBPs from salt (+) samples (treated with salt) (Fig. 3A). The majority of RBPs (947) are common in both RBPomes. There are 758 RBPs unique to the leaf salt (+) RBPome and 222 unique to the leaf salt (−) RBPome, potentially representing salt-responsive RBPs in the leaf (Fig. 3A). To quantify the relative protein abundance and pinpoint significantly enriched salt-responsive RBPs that display altered RNA-binding profiles, we followed the spectral counting-based method (Zybailov et al. 2005), taking batch effect (variations between each biological replicates) into consideration. By comparing the FC of spectra counts between salt (+) and salt (−) samples and using FC > 1.5 as the cutoff, we found 81 RBPs qualified as high-confidence salt-responsive RBPs (P < 5%), either showing reduced association with RNA (66 in total: 44 from the 222 RBPs unique to the leaf salt [−] RBPome and 22 from the 947 RBPs shared by both RBPomes) or increased binding to RNA (15 in total with 12 from the 758 RBPs unique to the leaf salt [+] RBPome and 3 from the 947 RBPs presented in both RBPomes) (Fig. 3A and Supplemental Data Set 3).
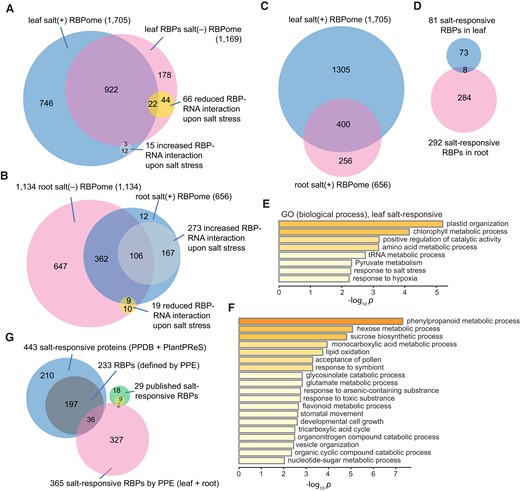
Salt-responsive RBP–RNA interactions. A, B) Comparison between salt (−) and salt (+) RBPomes in leaf A) and root tissue B). Significantly increased and decreased RBP–RNA interactions (FC > 1.5, P < 5%) are indicated. C) Overlap of salt (+) RBPomes between the leaf and root. D) Comparison of salt-responsive RBP–RNA interactions between the leaf and root salt (+) RBPomes. E) Enriched GO terms of leaf salt-responsive RBPs. F) Overrepresented GO terms of salt-responsive RBPs in roots. G) Comparison of salt-responsive RBPs between the PPE-RBPome, databases, and published RBPs.
The root RBPome embodies 1,313 RBPs, with 1,134 RBPs from the salt (−) sample and 656 RBPs from the salt (+) sample (Fig. 3B). It appears that the root salt (+) RBPome contains considerably fewer RBPs than that in the root salt (−) counterpart. However, this discrepancy is unlikely caused by the quality of the samples or mass spectrometry analysis, as the total numbers of peptides identified by mass spectrometry in these 2 proteomes are comparable, and peptides from the 657 RBPs unique to root salt (−) RBPome were also identified in the salt (+) RBPome. The root salt (+) RBPome has 273 significantly upregulated RBP–RNA interactions and 19 downregulated ones, displaying an opposite scenario in response to salt compared to the leaf salt (+) RBPome, which showed more reduced than increased RBP–RNA interactions (Fig. 3B). Although there were 400 RBPs shared between the leaf salt (+) and root salt (+) RBPomes (Fig. 3C), only 8 are statistically significant between the 2, while the vast majority manifested a tissue-specific pattern in response to salt (Fig. 3D). In the leaf, photosynthesis-related terms are the most highly enriched, followed by amino acid and tRNA metabolism and stress-response–related terms (Fig. 3E). In the root, terms involved in amino acid, nucleotide, sugar and energy metabolism, and stress-response processes are overrepresented (Fig. 3F). Interestingly, among these 8 common salt-responsive RBPs, all showed the same trend in response to salt in both tissues, except for ACTIN DEPOLYMERIZING FACTOR2 (ADF2), which was downregulated in the leaf but upregulated in the root upon salt stress (Supplemental Table S1). Such an opposite response, combined with aforementioned observations, corroborates the notion that leaves and roots utilize different mechanisms to cope with high-salt conditions.
To further substantiate the advantage of PPE in unraveling RBP–RNA dynamics when plants are challenged with salinity, we first searched and compared the published proteomic data with our PPE salt-responsive RBPome (365 RBPs combined from both the leaf and root). Two databases, namely, the Plant Proteome Database (PPDB) and the Database for Plant Proteome Response to Stress (PlantPReS), were referenced (Sun et al. 2009; Mousavi et al. 2016). Altogether, 443 proteins exhibit changes in overall protein abundance upon salt treatment, with over half of them (223/443) qualified as RBPs when searched against the PPE RBPomes (Supplemental Data Set 3 and Fig. 3G). However, only 36 RBPs (a small fraction of these 223 RBPs) showed changes in both abundance and RNA binding (Fig. 3G). Apart from these proteome-wide endeavors, we also retrieved 29 RBPs implicated in salinity stress from individual studies using genetic and physiological approaches as recently summarized (Muthusamy et al. 2021; Yan et al. 2022). As these studies were conducted in plants at various developmental stages using different tissues, we focused on the 11 published RBPs that were also identified by PPE and found that only 2 displayed altered associations with RNA and overall abundance (Fig. 3G). The 9 remaining published RBPs did not show changes in RBP–RNA dynamics upon salt stress in 12-d-old seedlings, suggesting that they may respond to salinity through different avenues. By contrast, among the 365 high-confidence salt-responsive RBPs characterized by PPE, the overwhelming majority surfaced as unconventional players (327), only exhibiting dynamic changes in RNA binding but not in total protein abundance (Fig. 3G). This comparison explicitly demonstrated the power of PPE for characterizing RBPs that regulate the salt response at the RNA metabolism level.
PPE identified unexpected RBPs and the non-poly(A) RBPome
Taking both salt (−) and salt (+) RBPomes into account, PPE enabled us to identify 2,517 RBPs in 12-d-old seedlings, including 1,927 from the leaf and 1,313 from the root, a number far greater than those in other Arabidopsis RBPomes (Fig. 4A). More importantly, each of these individual RIC-RBPomes that overlap poorly with the OOPS-RBPome (7% to 18% in common) show various extents of overlap with our PPE data, from decent to excellent (47% to 73%) (Supplemental Fig. S5A). Such associations arguably demonstrate the ability of PPE to recover known RBPs, especially considering the differences in the type of tissues, growth conditions, UV-CL methods, and statistical criteria used to define RBPs. Next, we compiled all the published RBPs/candidate RBPs, irrespective of the disparities mentioned above, to further compare with and explore the PPE RBPome. In total, we retrieved 2,995 RBPs, comprising 2,782 RBPs combined from all 6 independent RIC studies published to date (designated as “poly(A) RBPome” hereafter) and 468 RBPs from the OOPS RBPome (Liu et al. 2020; Marondedze 2020; Sajeev et al. 2022) (Fig. 4A). The poly(A) RBPome contains RBPs from a wide range of developmental stages (from germinating seeds to 4-d-old etiolated seedlings and 4- to 6-wk-old plants) and cell and tissue types (from root cell culture to leaf and leaf mesophyll protoplast), potentially including most (if not all) of the RBPs that RIC could have identified at these stages. Of the 2,517 RBPs identified by PPE, 1,349 were shared by either the poly(A) RBPome or the OOPS RBPome. Meanwhile, our study confirmed 788 proteins formerly marked as “candidate RBPs” as RBPs (Supplemental Data Set 4).
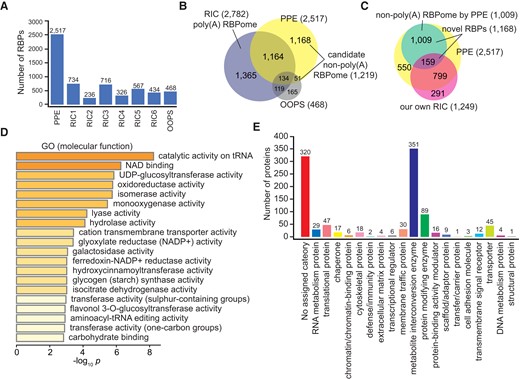
RBPs and the non-poly(A) RBPome identified by PPE. A) Comparison of the number of RBPs in the PPE-RBPome, 6 published RIC-RBPomes, and the published OOPS-RBPome. RIC1 (4-d-old etiolated seedlings); RIC2 (4-wk-old leaves); RIC3 (5-/6-wk-old leaves); RIC4 (4-/5-wk-old mesophyll protoplasts); RIC5 (root suspension cells); RIC6 (seeds); and OOPS (4-wk-old whole plants). B) Comparison of the PPE-RBPome, poly(A) RBPome (6 RIC-RBPomes combined), and OOPS-RBPome showing that the 1,219 RBPs identified by PPE could be candidate non-poly(A) RBPs (1,168 exclusively in the PPE-RBPome and 51 co-existing in the OOPS-RBPome). C) Comparison between PPE-RBPome and our own RIC-RBPome suggested a non-poly(A) RBPome with 1,009 RBPs. D) Overrepresented GO terms of the non-poly(A) RBPome. E) PANTHER categorization of non-poly(A) RBPs.
Additionally, we found 1,219 RBPs that have “escaped” from previous extensive hunting for poly(A) RNA-interacting proteins, which could form the basis of a “non-poly(A) RBPome.” This included 1,168 RBPs captured by PPE and not OOPS, and 51 co-occurring in the OOPS RBPome (Fig. 4B and Supplemental Data Set 4). It is unlikely that all these 1,219 RBPs are tissue- or developmental stage-specific to 12-d-old seedlings, since the 51 RBPs co-existing in the OOPS RBPome were from 4-wk-old whole plants. To clarify the issue, we performed RIC with the same 12-d-old seedlings used for the PPE experiments and uncovered 1,249 poly(A) RBPs. Please note that we used a very relaxed cutoff to define RBPs from our own RIC-RBPome so that we could maximize the recovery of putative tissue- or developmental stage-specific poly(A) RBPs and exclude them from the non-poly(A) RBPome base (Supplemental Data Set 4 and Materials and methods). Even with such a relaxed threshold, 80% and 77% RBPs in our own RIC-RBPome were present in the published poly(A) RBPome and PPE-RBPome, respectively, suggesting that our RIC experiment has captured highly reliable poly(A) RBPs for the analysis (Figs. S5B and 4C). We found that 159 RBPs from our own RIC-derived RBPome also existed in the 1,168 non-poly(A) RBP pool, suggesting they may be tissue- or developmental stage-specific poly(A) RBPs. Hence, they were subtracted from the pool, and the remaining 1,009 RBPs may represent the bona fide non-poly(A) RBPs (Fig. 4C and Supplemental Data Set 4). We noticed that some of these non-poly(A) RBPs also harbor the classic RBDs (RRM, zinc finger, and DEAD domain) present in poly(A) RBPs (Supplemental Data Set 4). Given the fact that poly(A) RBPs are often seen to bind noncoding RNAs, it is likely that these non-poly(A) RBPs also bind poly(A) RNAs in a tissue- or developmental stage-specific manner or under certain abiotic/biotic stress conditions.
GO enrichment analysis of the non-poly(A) RBPome revealed overrepresented terms in catalytic and metabolic activities involved in essential biological processes, along with 2 enriched tRNA-related terms (Figs. 4D and S5C). Further functional classification of the 1,009 non-poly(A) RBPs revealed 19 major protein groups with assigned PANTHER categories. Members of the “RNA metabolism protein” and “translational protein” groups, accounting for ∼8% of the non-poly(A) RBPome, are all related to RNA biology according to annotation, including RNA splicing/processing factors, RNA methyltransferases/helicases, endoribonucleases, ribosomal proteins, translation initiation/elongation factors, and aminoacyl-tRNA synthetases (Fig. 4E and Supplemental Data Set 4). Besides those aminoacyl-tRNA synthetases and ribosomal proteins that associate with tRNAs and rRNAs, RBPs binding to other noncoding RNAs were also observed, such as SMD3B binding to snRNAs, EMBRYO SAC DEVELOPMENT ARREST 14 (EDA14), and AT3G12860 interacting with snoRNAs and AT5G61970 and AT1G48900 binding to 7S RNA.
The PPE-RBPome displays a broad array of RBDs
To evaluate potential RBDs in the PPE-RBPome, we first integrated published RBDs with experimental evidence (Castello et al. 2012, 2016) and retrieved a total of 1,152 Pfam accessions covering both classical and nonclassical RBDs as the reference RBD database (Supplemental Data Set 5). In all, 492 RBDs (43%) from the database could be assigned to 1,149 PPE-RBPs, comprising roughly 46% of the PPE-RBPome (Fig. 5A). We therefore uncovered a more highly diverse collection of RBDs compared to published results from RIC and OOPS studies that used the same RBD database (Fig. 5B). In the top 20 RBDs with the greatest number of occurrences, PPRs appeared 245 times in 37 RBPs, followed by ribosomal-related RBDs (224 times in 194 RBPs), RRMs (179 times in 102 RBPs), WD40 (103 times in 28 RBPs), and tRNA-synthetase domains (51 times in 40 RBPs) (Fig. 5C). Other classical RBDs, such as zinc finger, DEAD, KH, and cold shock domain (CSD), were all identified (see a full list of the 492 RBDs in Supplemental Data Set 5). We further categorized and ranked all the RBDs based on the number of RBPs harboring them (the top 10 most abundant RBDs are shown in Fig. 5D, and the complete list is shown in Supplemental Fig. S6). Our results exemplified the common feature that an RBP can harbor 1 or multiple RBDs (either the same type or a combination of different types of RBDs, with or without the presence of other non-RBDs) to increase binding affinity and specificity (Lunde et al. 2007). For example, of the 194 RBPs possessing ribosomal-related RBDs, 149 contain only 1 RBD, 4 have repetitive RBDs (same RBD), 36 contain multiple types of RBDs, and 5 exhibit a combination of RBD(s) and other non-RBD domain(s) (Fig. 5D).
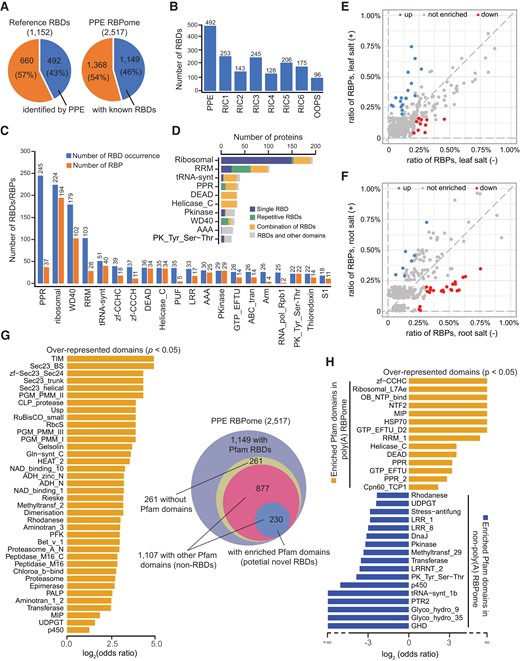
PPE identified a wide range of RBDs. A) Numbers and percentages of known RBDs that could be assigned to RBPs are shown. In the reference database with 1,152 RBDs, 492 (43%) could be assigned to 1,149 RBPs, 46% of the PPE_RBPome. B) PPE identified more RBDs than RIC and OOPS. RIC1 (4-d-old etiolated seedlings); RIC2 (4-wk-old leaves); RIC3 (5-/6-wk-old leaves); RIC4 (4/5-wk-old mesophyll protoplasts); RIC5 (root suspension cells); RIC6; (seeds); and OOPS (4-wk-old whole plants). C) Top 20 RBDs by occurrence and number of RBPs containing these RBDs. D) The 10 most abundant RBDs (based on the number of RBPs with these domains). E, F) Enriched RBDs in the leaf E) and root F). RBDs with or without significantly changed ratios are indicated. RBD ratio = (number of RBP containing certain RBD)/(total number of RBP). RBDs that meet the criteria: FC ≥ 2 (RBD ratio between the salt (−) and salt (+) samples) and RBD ratio ≥ 0.2% are considered to be enriched. G) Thirty-eight overrepresented domains (bar chart) and domain distribution in PPE-RBPome. H) Odds ratio of Pfam domain occurrences in poly(A) and non-poly(A) RBPomes. The most frequent domains in each RBPome are compared (log2 (odds ratio) > 1, P < 0.05).
Our data revealed substantial RBPs involved in the salt response from leaf and root tissues. Next, we sought to explore RBDs significantly enriched under salinity stress. RBDs from 4 groups, including the leaf salt (−) RBPome, leaf salt (+) RBPome, root salt (−) RBPome, and root salt (+) RBPome, were classified and sorted by the ratio of RBPs harboring these RBDs in each group (Supplemental Data Set 5). Of the top 15 RBDs with the highest ratio, RRM_1 is the most abundant RBD in all 4 groups, which displayed a higher percentage in the root (8% to 10%) compared to the leaf (4% to 5%). However, the ratio of RRM_1-containing RBPs in samples before and after salt treatment only showed a slight difference in the leaf and root, respectively (Supplemental Fig. S7). To call high-confidence salt-responsive RBDs, we compared the ratio of RBPs encompassing these RBDs between salt (−) and salt (+) RBPomes (only RBDs owned by at least 2 RBPs were chosen for statistical analyses). RBD would be considered enriched if the FC of ratio ≥ 2 with P < 5%. Consequently, 9 and 17 RBDs were overrepresented in the leaf salt (−) RBPome and leaf salt (+) RBPome, respectively (Fig. 5E). In the root, 23 and 7 RBDs were considered enriched in the root salt (−) RBPome and root salt (+) RBPome, respectively (Fig. 5F). Translation-related RBDs (ribosomal, tRNA-synt, MIF4G, eRF1, etc.) were mostly enriched in salt (−) RBPomes, while the tubulin domain was enriched in salt (+) RBPomes from both tissues. Interestingly, domains such as Adaptin_N, methyltransf_11, and Pyr_redox_2 displayed overrepresentation in the leaf salt (+) RBPome but not in the root counterpart. Instead, they were enriched in the root salt (−) RBPome, reflecting discrepancies in regulating the salt response between these 2 tissues (Figs. 5, E and F and Supplemental Data Set 5).
In addition to the 1,149 RBPs with defined Pfam RBDs, we were curious about whether the remaining 1,368 RBPs contained any overrepresented domains that could contribute to RNA binding. By searching the Pfam database, we found 1,587 annotated domains (non-RBDs) present in 1,107 RBPs (Venn diagram, Fig. 5G, and Supplemental Data Set 6). We found that 38 domains from 230 RBPs were significantly enriched (log2 [odds ratio] > 1, P < 0.05), which could potentially be RBDs, an exciting discovery. Remarkedly, many of these RBDs (CLP_protease, rhodanese, epimerase, etc.) happened to be the catalytic domains (Fig. 5G, bar chart). We also compared the domain occurrence between the poly(A) RBPome and the non-poly(A) RBPome, which depicted a completely distinct picture of the most frequent protein domains in each group (Fig. 5H). In poly(A) RBPome, all 14 overrepresented motifs (except for MIP) are Pfam-defined RBDs, 6 of which are exclusive to poly(A) RBPome, including zf-CCHC, Ribosomal_L7Ae, OB_NTP_bind, NTF2, HSP70, and GTP_EFTU_D2. Of the 19 most enriched domains found in the non-poly(A) RBPome, only 6 are Pfam RBDs (LRR_1, LRR_8, DnaJ, Pkinase, PK_Tyr_Ser-Thr, and tRNA-synt_1b, which is exclusive to the non-poly(A) RBPome). Our domain enrichment analysis also identified 3 additional domains (transferase, rhodanese, and P450) as potential RBDs (Fig. 5H). Whether the 10 remaining overrepresented domains in this group can bind RNA remains to be addressed.
IDRs in the PPE-RBPome contribute to RNA binding
IDRs are unstructured polypeptide segments that play critical roles in RBPs (Calabretta and Richard 2015). Nearly half of the RNA-binding sites in humans occur in IDRs (Castello et al. 2016). We speculated that IDRs residing in the PPE-RBPome might contribute, in part, to RNA binding. We first retrieved 16,477 predicted IDRs in the Arabidopsis proteome from MobiDB, a database of protein disorder and mobility annotations (Piovesan et al. 2021), and then located 1,378 IDRs to 1,003 RBPs captured by PPE. These include 669 RBPs in the poly(A) RBPome and 334 in the non-poly(A) RBPome, accounting for 1/3 of the total RBPs identified by PPE and not OOPs (Fig. 6A and Supplemental Data Set 7). Given that IDRs are commonly involved in protein–protein, protein–DNA, and protein–RNA interactions, we employed flDPnn, 1 of the most accurate tools for coupling the prediction of IDRs and their putative functions (Hu et al. 2021), to determine if these IDRs are engaged in RNA binding. As expected, most of the IDRs have the potential to interact with RNA (Supplemental Data Set 7). For example, an uncharacterized protein encoded by AT4G16060 harbors an N-terminal (from amino acid 26 to 48) as well as a C-terminal (amino acid 271 to 289) disordered region, both of which were predicted by flDPnn to confer RNA-binding ability (Fig. 6B). Notably, we showed that a stress-response protein encoded by AT3G59800 was predicted to be in a completely unstructured form using AlphaFold (Fig. 6C). The whole protein is disordered and displays a high propensity for RNA binding, particularly at its N-terminus and C-terminus (Fig. 6D). Taken together, our analyses suggest that IDRs may mediate interactions between RNA and non-poly(A) RBPs.
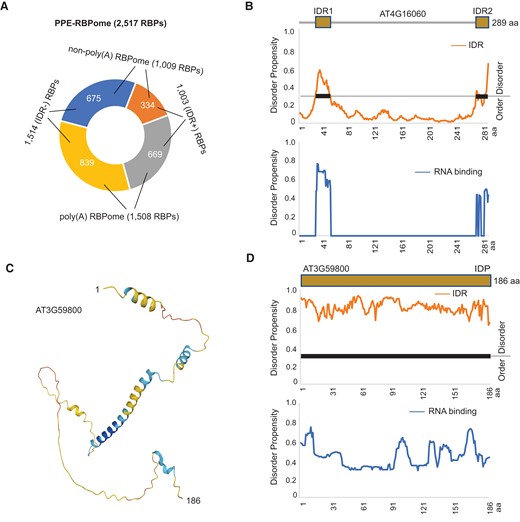
IDRs are engaged in RNA binding. A) IDRs are distributed in 669 poly(A) RBPs and 334 non-poly(A) RBPs. B) IDRs in RBP (encoded by AT4G16060) may contribute to RNA binding. Protein domain architecture with 2 IDRs, the propensity of disorder, and RNA binding for each individual amino acid are shown. Disordered regions are highlighted with thick lines. C) Predicted structure of RBP, an intrinsically disordered protein (IDP) encoded by AT3G59800. D) Domain architecture, the propensity of disorder, and RNA binding for AT3G59800 are shown.
Validation of RBPs and RBDs
A recent study aiming to validate RBPs discovered by RIC found that half of the RBPs they tested showed no interaction with RNA and called for caution in the interpretation and validation of the RIC data (Vaishali et al. 2021). However, we noticed that the RNA used in the binding assay (poly(U)-8-mer and poly(U)-25-mer oligos) might not be ideal, especially in cases where the actual RNA partners for these putative RBPs are unknown. Therefore, we developed an RNA pull-down assay using a pool of endogenous RNAs to validate the RNA-binding ability of captured RBPs/RBDs. To this end, we employed a method in which poly(A) RNAs (from 12-d-old Arabidopsis leaf tissue) were immobilized on oligo d(T) magnetic beads and used as bait to capture recombinant RBPs/RBDs that had been expressed and purified from Escherichia coli. The RBP/RBD-RNA interaction was substantiated by immunoblot analysis (Fig. 7A). As a proof of concept, we first used HLP1, an RRM-type RBP with >5,000 in vivo RNA partners (Zhang et al. 2015), to test its in vitro binding to poly(A) RNA. As expected, recombinant MBP-His-HLP1 was detected only when incubated with beads preloaded with poly(A) RNA (Fig. 7B). We then applied this method to 2 poly(A) RBPs currently without experimental support: ATSDH and ESM1. ATSDH is a sorbitol dehydrogenase, and its yeast homolog (SOR1) was classified as an RBP by RIC (Matia-Gonzalez et al. 2015). ESM1, which belongs to the GDSL-like lipase/acyl hydrolase superfamily, was 1 of the 6 members identified by PPE. We showed that beads with poly(A) RNA could capture both ATSDH and ESM1, thus validating ATSDH and ESM1 as RBPs (Fig. 7C).
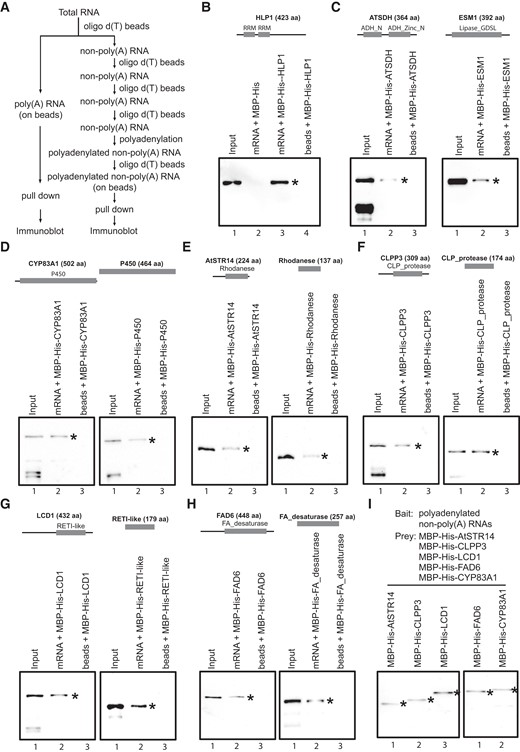
Validation of RBPs in an mRNA pull-down assay. A) Flowchart of the RNA pull-down assay. B) Establishment of the RNA pull-down assay using the known RBP HLP1 as the positive control. Recombinant MBP-His-HLP1 was detected by the anti-His antibody (Lane 3). MBP-His and beads without RNAs were used as negative controls (Lanes 2 and 4). C) Full-length ATSDH and ESM1 bind RNAs in vitro. MBP-His-ATSDH/ESM1 was recognized by the anti-His antibody. D to H) Interaction of 5 non-ploy(A) RBPs (Lane 2, left panel) and their enzymatic domains (Lane 2, right panel) with RNAs. I) Interaction between non-poly(A) RBPs and polyadenylated non-poly(A) RNAs. All recombinant proteins detected by the immunoblot are indicated by *.
We then used the poly(A) RNA pull-down method to confirm additional RBPs, focusing on catabolic/metabolic enzymes without known RBDs but harboring overrepresented domains that could potentially serve as RBDs. CYP83A1 and its P450 domain shared in the cytochrome P450 family, AtSTR14 and its shared rhodanese-like domain in the rhodanese-like domain-containing protein family, and CLPP3 with its CLP_protease domain common in the peptidase S14 protein family were chosen, representing the low-, middle-, and high-ranking members in this group, respectively (shown in Fig. 5G). Additionally, 2 other non-poly(A) RBPs and their associated domains were also chosen for validation: LCD1 with its RETICULATA-like domain shared in the RETICULATA protein family and FAD6 with its FA_desaturase domain shared in the fatty acid (FA) desaturase family. Even though these 2 proteins do not have enriched domains, they do have family members or homologs that have been identified (yet not validated) as RBPs by RIC. All the proteins and domains tested were trapped by poly(A) RNAs on the beads (Fig. 7, D to H, Lane 2), but not the “beads only” control (Fig. 7, D to H, Lane 3). These results demonstrate that these enzymes are bona fide RBPs and suggest that the active domains of these enzymes have dual roles in both RNA binding and basic metabolic processes.
The above results also explicitly indicate that these non-poly(A) RBPs/RBDs were capable of interacting with poly(A) RNAs. However, some (if not all) of the interactions could still be mediated by non-poly(A) RNAs that either interact with poly(A) RNAs (siRNAs, miRNAs, snoRNAs, snRNAs, etc.) or stubbornly attached to oligo d(T) beads (rRNAs, tRNAs, etc.). To explore direct interactions between non-poly(A) RBPs and non-poly(A) RNAs, we removed poly(A) RNAs from total RNA after 4 consecutive rounds of poly(A) RNA selection. The remaining non-poly(A) RNAs were then polyadenylated and attached to oligo d(T) magnetic beads to pull down non-poly(A) RBPs (Fig. 7A). As expected, all 5 RBPs, including AtSTR14, CLPP3, LCD1, FAD6, and CYP83A1, were captured by the polyadenylated non-poly(A) RNAs but not the beads, further confirming them as non-poly(A) RBPs (Figs. 7I and S8A).
Interestingly, we noticed from our raw mass spectrometry data that TGG1 (a myrosinase encoded by AT5G26000) has the most spectral counts in noCL leaf salt (−) samples across 3 replicates (Supplemental Data Set 1) and was therefore not considered to be an RBP in our analysis. However, it was regarded as a candidate RBP in one of the previous RIC studies (Zhang et al. 2016). We showed that TGG1 could bind to oligo d(T) magnetic beads in vitro regardless of the presence of poly(A) RNA (Supplemental Fig. S8, Lanes 2 and 3) and that such binding could be weakened by stringent washing (Supplemental Fig. S8B, Lane 4), suggesting that TGG1 is more likely to be a nonspecific contaminant. In summary, using the pull-down method, we are able to validate the authenticity of real RBPs and eliminate false-positive interactions.
Discussion
We developed the PPE method for isolating RBPs from complex tissues and revealed its effectiveness in identifying the RBPome in Arabidopsis. The high number of RBPs identified in this study showcases the technical advantages of PPE on multiple levels. For instance, total cell lysate is mixed with Trizol and chloroform throughout phase extraction, which completely destroys protein–protein interactions to ensure that RBP–RNA adducts are free of non-RBP contaminants while protecting the RNA from degradation at the same time. Unlike RIC, which relies on affinity purification using oligo d(T) beads and extensive washing, PPE does not use beads and thus will not introduce nonspecific binding or bias toward poly(A) RBPs. Compared to a previous experiment using a similar phase extraction-based method in Arabidopsis (OOPS), PPE captured far more reliable RBPs (2,517 vs. 468) and displayed much higher overlap with each individual RIC RBPome (47% to 73% between RIC and PPE vs. 7% to 18% between RIC and OOPS). PPE also outperformed the RIC studies in terms of overall number and diversity in RBP and RBDs.
In plant cells, the plastid genome may contribute as much as ∼80% of the total mRNAs that are not polyadenylated (Forsythe et al. 2022). This raises the possibility that chloroplast RBPs (cp-RBPs) in leaf tissue may be overly abundant and interfere with the isolation of RBPs from other cell compartments and organelles. However, in the RIC method where polyadenylated mRNAs are used to capture poly(A) RBPs, only a small fraction of cp-mRNAs are polyadenylated for degradation and can be trapped by oligo d(T) beads. Thus, the recovery of RBPs from other locations is unlikely to be affected by cp-RBPs. We compared the distribution of cp-RBPs, cytosol RBPs (cyto-RBPs) and RBPs in other compartments and organelles in PPE-RBPome with that in RIC-RBPome and OOPS RBPome. We found that PPE-RBPome had the second lowest percentage of cp-RBPs (31.6%), whereas it exhibited the second highest percentage of cyto-RBPs (29.6%) among the 5 leaf-related RBPomes (PPE1, RIC2/3/4, and OOPS), suggesting that cp-RBP-associated cp-RNAs do not affect the identification of cyto-RBPs when using PPE to discover RBPs in leaf tissue (Supplemental Fig. S9).
Similar to RIC and OOPS, PPE also suffered from the poor recovery of double-stranded RBPs (dsRBPs), as the efficiency of UV in CL dsRBPs to dsRNAs is extremely low (Liu et al. 1996). Other than that, some RBPs discovered by other methods (mostly by RIC) were absent in the PPE-RBPome, suggesting that the RIC method has its own advantage in enriching poly(A) RBPs. Furthermore, even though we identified 492 RBDs, which increased the overall number of RBDs to 553 in Arabidopsis, there are probably still more RBDs remaining to be discovered in plants, given that at least 1,152 RBDs have been characterized in eukaryotic cells. Although the smaller number of RBDs in plants could be partially explained by the tissue or developmental stage specificity of the material we used, it suggests that there is room for improving the PPE method.
By comparing the leaf and root RBPomes, we uncovered both constitutive and tissue-specific RBPs essential for developmental processes under normal growth conditions. We also explored RBPs in response to salt stress from both tissues. As PPE preferentially isolates the whole RBP–RNA entity, dynamic changes in RBP–RNA interactions, rather than RBP abundance, were revealed. Thus, PPE offers a way to investigate the adaptation of RBPs to saline environments by analyzing the dynamics of RBP–RNA interactions. More specifically, we identified 365 salt-responsive RBPs showing altered associations with RNAs, only 38 of which were uncovered by the conventional proteomics studies examined, which lacked an enrichment step of RBP–RNA adducts. These observations demonstrate that PPE is an impactful tool for capturing RBP–RNA interactions engaged in salinity regulation. Meanwhile, 85% of the published RBPs with changes in protein abundance were not captured by PPE, suggesting that the amounts of RNAs they bound to were comparable irrespective of salt stress and that these RBPs might regulate the salt response using a different mechanism. However, we cannot exclude the possibility that RBPs in this category still regulate the salinity response at the RNA level. This is because these RBPs may bind to different groups of RNAs in response to salt stress. Alternatively, perhaps the RNAs associated with these RBPs undergo posttranscriptional processing, such as alternative splicing, polyadenylation, or modification, in response to salt stress. Such changes in the RNA content or status of RNA processing in lieu of changes in RNA abundance most likely would not be distinguished by PPE. It will be fascinating to track these changes by exploring and comparing the RNA partners of these RBPs before and after salt treatment to shed light on the molecular mechanisms underlying the regulation of the salinity response by RBPs.
It is widely acknowledged that roots and leaves react differently when challenged by a saline environment. The root is at the frontline to rapidly sense and respond to increased salt concentrations, and the leaf adapts to salt accordingly (van Zelm et al. 2020). Our results are no exception to the notion: among the 81 and 292 salt-responsive RBPs in leaf and root tissue, respectively, only 8 are shared by both tissues. The vast majority are tissue-specific salt-responsive RBPs. Upon salt stress, the growth rate quickly decreased, and as a result, we observed reduced numbers of RBPs involved in the protein translation process in both tissues. Meanwhile, the numbers of RBPs regulating the osmotic response, lipid homeostasis/FA oxidation, and protein transport soared, exhibiting positive adaption to salt in both the root and leaf (Supplemental Table S1).
Dynamic changes in the plant cytoskeleton, such as actin filaments and microtubules, play essential roles in plant adaption to high-salt conditions. Unlike the well-studied depolymerization and reorganization processes in microtubules, the mechanism of actin dynamics in controlling salt tolerance remains largely elusive (Colin et al. 2023). A recent study showed that ADF1, a member of the actin-depolymeriztion factor (ADF) family, responds to salt stress by regulating actin organization (Wang et al. 2021). As a member in the same subclass of the ADF family as ADF1, ADF2 caught our attention by virtue of its opposite regulation in roots and leaves (Wang et al. 2021; Colin et al. 2023). ADF2-directed actin dynamics was previously implicated in the regulation of root-knot nematode infection in Arabidopsis (Clement et al. 2009). We identified ADF2 as an RBP and revealed increased ADF2–RNA interactions in the root but decreased ADF2–RNA interactions in the leaf (Supplemental Table S1). It would be intriguing to investigate the cross talk between actin dynamics and the ADF2–RNA interaction and how the ADF2–RNA interaction governs 2 contrasting salt-response scenarios in leaves and roots.
The most important feature of PPE is the ability to discover RBPs regardless of RNA type. In the PPE-RBPome, 48% of the RBPs (1,219) were not identified in previous RIC studies comprehensively covering poly(A) RNA RBPs from a wide range of cell/tissue types and developmental stages (Fig. 4B). Among these 1,219 RBPs, 1,169 are absent from both the RIC-RBPomes and the OOPS-RBPome (Fig. 4C). However, our own RIC experiment uncovered 159 RBPs in this group as poly(A) RBPs specific to 12-d-old seedlings. Hence, we designated the remaining 1,009 RBPs as non-poly(A) RBPs after exhaustive searches for poly(A) RBPs (Fig. 4C). We searched for high-confidence RBPs based on the following criteria: (i) RNA-related PANTHER protein categorization; (ii) the presence of Pfam RBDs; (iii) the existence of RBP homologs in other organisms; (iv) the presence of overrepresented Pfam (non-RBD) domains; and (v) the presence of IDRs implicated in RNA binding. Of these non-poly(A) RBPs, 653 (65% of the non-poly(A) RBPome) met at least one of the above criteria, thus potentially representing high-confidence RBPs (Supplemental Data Set 8). GO enrichment analysis showed that these RBPs predominantly participate in numerous metabolic/catabolic processes, corroborating the notion that various metabolic enzymes moonlight as RBPs (Castello et al. 2015). In some cases, moonlighting enzymes regulate the expression levels of their target transcripts. The cross talk between gene expression and cellular metabolism mediated by moonlighting enzymes forms the basis for the RNA–enzyme–metabolite (REM) hypothesis (Hentze and Preiss 2010). A well-known example is GAPDH, with dual roles in metabolism and RNA-binding activity. GAPDH interacts with tRNA, rRNA, and mRNA to regulate tRNA translocation, mRNA stability, and translation (White and Garcin 2016). The structure of GAPDH has been well defined, and a large part of the protein is believed to be responsible for RNA binding.
In this non-poly(A) RBPome, various metabolic/catabolic enzymes have no recognizable RBDs, such as members of the cytochrome P450 family, peptidase S14 family, rhodanese-like domain-containing protein family, and the FA desaturase family. However, members within each family share conserved and overrepresented Pfam domains, making them highly likely candidates as RBDs (Fig. 5G and Supplemental Data Set 6). For some of those without enriched domains, we found that they have family member(s) identified as RBPs by other methods. For example, domain alignment of FA desaturases across species displayed FA_desaturase as the only module conserved in all 7 FA desaturases, suggesting that the FA_desaturase domain may interact directly with RNA (Supplemental Fig. S10).
We developed an RNA pull-down assay and successfully validated some of the moonlighting enzymes as valid RBPs that bind to both poly(A) and non-poly(A) RNAs in vitro (Fig. 7). More importantly, we demonstrated a second role of the enzymatic domains as RBDs. This intriguing finding points to possible competition or cooperation between RNA and the enzyme substrate, as RNA binding to the enzymatic domain could either block its access to the substrate or facilitate substrate recruitment. Further studies investigating the means of RNA binding, the RNA partners, and the biological functions of moonlighting enzymes will shed light on the actual mechanism of these enzymes in the intermediary metabolic process, RNA metabolism, and gene regulation.
In summary, PPE is an effective and robust method for identifying a comprehensive set of RBPs from plant tissues. It provides the opportunity to investigate the dynamic interactions between RBPs and RNAs in plants under different growth and stress conditions and during developmental transitions.
Materials and methods
Plant growth
Wild-type A. thaliana in the Col-0 background was used in this study. Seeds were surface sterilized with 50% bleach (Clorox) for 5 min and rinsed 4 times in sterilized water. After being stratified at 4 °C for 3 days, the seeds were sown on Murashige and Skoog (MS, pH 5.8) plates containing 1% (v/w) sucrose and 0.8% (w/v) agar and grown at 23 °C under long-day conditions for 12 d with a light intensity of 120 μmol/m2 (bulb: Philips Master TL5 HO 54W/840 SLV/40). For salt treatment, seedlings grown on MS plates were carefully transferred to MS plates containing 150 mm NaCl on Day 11 and grown for another 24 h. The plates were placed vertically in the growth chamber to facilitate the transfer of seedlings and the separate collection of roots and leaves.
UV-cross-linking of Arabidopsis tissues
Seeds were sown densely on 120 × 120 mm square Petri dishes in 2 rows. We prepared 8 plates for each condition (noCL/noSalt, CL/noSalt, noCL/Salt, and CL/Salt) as 1 biological replicate. Leaves and roots were separated directly on each plate with a clean blade, pooled from all 8 plates, and transferred to new 150-mm Petri dishes containing prechilled liquid MS medium (pH 5.8) with or without 150 mm NaCl. The Petri dishes were placed on ice for the entire process. Leaves were CL 3 times (with a 1-min interval) at 400 mJ/cm2 with 254-nm wavelength in a Hoefer UVC500 Cross-linker (Zhang et al. 2015), with 2 rounds of irradiation on the adaxial side and once on the abaxial side as described previously (Bach-Pages et al. 2020). Roots were cross-linked 3 times without flipping using the same UV dosage. noCL control samples (noCL) were soaked in ice-cold liquid MS for approximately the same time as the CL samples. After cross-linking, both noCL and CL tissues were rinsed 3 times in ice-cold 20 mm Tris–Cl buffer (pH 7.5) and quickly dried with a paper towel. The samples were either immediately frozen in liquid nitrogen and stored at −80 °C or processed directly. For salt-treated tissues, the same UV-cross-linking process was used, except that they were soaked in liquid MS medium (pH 5.8) containing 150 mm NaCl during UV-cross-linking and rinsed with TBS buffer (20 mm Tris, 150 mm NaCl, and pH 7.5) after cross-linking. Altogether, samples for 3 biological replicates were prepared with a 4-d interval between each replicate. It is worth noting that in our study, as the samples were soaked in MS buffer during cross-linking, we used higher UV intensity (400 mJ/cm2) to counteract the negative effect on UV penetration from liquid. If samples are placed directly on ice during cross-linking, lower UV intensity could be applied (Marondedze et al. 2016; Reichel et al. 2016; Bach-Pages et al. 2020). It is important to keep in mind that there is a delicate balance between the choice of UV-cross-linking conditions and the resulting outcome. Using weaker conditions may be gentler on the sample, but it might not be sufficient to cross-link more RBPs with RNAs. On the other hand, stronger conditions can increase cross-linking efficiency, but it may also have negative effects, such as RNA/protein degradation, and even produce false-positive results. Therefore, researchers need to carefully consider the appropriate conditions for their experiment, taking into account both the desired outcome and potential drawbacks. The optimal UV-cross-linking conditions for a specific experiment need to be carefully evaluated based on the unique nature of the materials being studied. While the UV-cross-linking conditions suggested in our study and other relevant research could serve as a helpful starting point, we highly recommend that researchers interested in using UV-cross-linking with PPE in other tissues carefully monitor the recovery of RBPs or RNAs under each condition during troubleshooting to determine the best UV-cross-linking conditions. Using this approach, researchers can ensure that they achieve the most effective cross-linking without damaging their samples.
PPE of Arabidopsis leaf and root tissues
Determining the optimal number of rounds of phase extraction
One milliliter of lysis buffer (20 mm Tris–Cl, pH 7.5, 0.5 m LiCl, 0.5% LiDS, 0.4% IGEPAL CA630, 2.5% polyvinylpyrrolidone 40, 5 mm DTT, 10 mm ribonucleoside vanadyl complex, and 1.5× Roche EDTA-free protease inhibitor) was added to 0.5 g of ground leaf tissues to lyse the cells. After centrifugation, 1 ml of supernatant was transferred to a new tube and subjected to the 1st round of phase extraction (5 ml of Trizol and 1 ml of chloroform were used). The resulting interphase was either saved or transferred to a new tube, followed by a 2nd, or 3rd, or 4th, or 5th round of phase extraction (1 ml of Trizol and 0.2 ml of chloroform were used in 2nd to 5th round of extraction). The purity of the interphases acquired after the different number of rounds of phase extraction (1 to 5 rounds) was determined by immunoblotting to detect the presence of non-RBP histone H3 and H4.
PPE procedures
The XRNAX method used in human cell lines (Trendel et al. 2019) was adapted for Arabidopsis tissue with major modifications. The leaf and root tissues were ground into a fine powder in liquid nitrogen. Approximately 2 g of powdered leaf tissue and 1 g of powdered root tissue were lysed in 4 and 2 ml of lysis buffer, respectively (20 mm Tris–Cl, pH 7.5, 0.5 m LiCl, 0.5% LiDS, 0.4% IGEPAL CA630, 2.5% polyvinylpyrrolidone 40, 5 mm DTT, 10 mm ribonucleoside vanadyl complex, and 1.5× Roche EDTA-free protease inhibitor) and homogenized by rotating at 4 °C for 30 min. Tissue debris was spun down at 10,000 × g for 15 min at 4 °C. The supernatant was transferred to a new tube, centrifuged again at 10,000 × g for 15 min at 4 °C, and the cleared supernatant was transferred to a 50-ml tube. Approximately 200 μl of lysate was saved as input. The rest (∼4 ml from leaf and 2 ml from root samples) was mixed with Trizol (20 ml for leaf and 10 ml for root samples), vigorously vortexed, and incubated at room temperature (RT) for 5 min. After adding chloroform (4 ml for leaf and 2 ml for root sample), the mixture was vigorously vortexed and incubated at RT for another 5 min, followed by centrifugation at 10,000 × g for 15 min at 4 °C. After the first round of phase separation, the aqueous phase was removed, and the interphase was transferred to a 1.5-ml tube and centrifuged at 12,000 × g for 5 min at 4 °C. The residual aqueous and organic phases were removed using a syringe with a narrow needle (30G). The interphase was subjected to 2 extra rounds of phase separation, with 1 ml of Trizol and 200 μl of chloroform used for each round.
The resulting interphase was washed twice with 1 ml of ethanol and quickly rinsed twice with 1 ml of 50 mm Tris–Cl (pH 7.5). The pellet was spun down at 12,000 × g for 5 min at RT after each wash/rinse. After removing the Tris–Cl buffer from the last rinse, the pellet was resuspended in 300 μl of low SDS buffer (50 mm Tris–Cl, pH7.5, 1 mm EDTA, and 0.1% SDS) by pipetting, and the suspension was spun down at 12,000 × g for 5 min at RT. The supernatant was saved as eluate 1. The pellet was dissolved in 300 μl of low SDS buffer and twice in 300 μl of high SDS buffer (50 mm Tris–Cl, pH7.5, 1 mm EDTA, and 0.5% SDS). All 4 eluates were pooled, and 2 μl of glycogen, NaCl (to a final concentration of 0.3 m), and 9 volumes of ethanol were added. The samples were mixed well and incubated at −80 °C for 2 h. The mixture was spun down at maximum speed for 30 min at 4 °C, and the pellet was rinsed twice with 1 ml of 75% ethanol. The pellet was resuspended in 200 μl of RNase-free water and incubated on ice for 1 h with occasional gentle pipetting. After adding 50 μl of DNase I mixture (25 μl of 10× DNase I buffer, 18 μl of NEB DNase I, 2 μl of 1 m DTT, and 5 μl of RiboLock RNase inhibitor), the solution was incubated at 37 °C for 30 min. DNase and other residual protein contaminants (non-RBPs) were further removed by 2 additional cycles of phase separation as described above using 1.25 ml of Trizol and 250 μl of chloroform for each cycle. The final interphase (free of aqueous and organic phases after wash) can be sequentially dissolved in low SDS buffer and high SDS buffer, precipitated, and resuspended again in 100 μl of RNase-free water for downstream applications or directly resuspended in protein sample buffer for silver staining, immunoblot, and mass spectrometry analyses.
SDS–PAGE, silver staining, and immunoblot analysis
Protein samples were mixed well with 4× NuPAGE LDS sample buffer and 10× NuPAGE reducing reagent (both to a final concentration of 1×) and denatured at 99 °C for 10 min before being loaded onto a 10% precast NuPAGE Novex Bis-Tris gel (Thermo Fisher Scientific, Waltham, MA, USA). After electrophoresis at 150 V for 1.5 h, the gel was either rinsed with ultrapure water, fixed, and silver-stained according to the manufacturer's instructions (Pierce Silver Stain for Mass Spectrometry, Thermo Fisher Scientific, Waltham, MA, USA) or soaked with a nitrocellulose membrane in transfer buffer (25 mm Tris, 190 mm glycine, and 20 methanol) before protein transfer. Primary anti-AGO1 (used as 1:2,000 dilution) and anti-histone H3 antibodies (used as 1:3,000 dilution) were purchased from Agrisera, and anti-HLP1 (Zhang et al. 2015) and anti-Fib1/2 were kindly provided by Dr. Xiaofeng Cao at the Institute of Genetics and Developmental Biology, Chinese Academy of Sciences. Both anti-HLP1 and anti-Fib1/2 were used as 1:1,000 dilution.
Mass spectrometry to obtain the PPE-RBPome
In-gel digestion and LC–MS/MS
The final interphases were separated in a 4% to 12% precast NuPAGE Novex Bis-Tris gel. Once the samples ran into the gel (electrophoresis at 150 V for 15 min), electrophoresis was stopped, and the gel was stained with Coomassie brilliant blue, destained, and rinsed in double-distilled water. Each gel band was cut with a clean blade and subjected to reduction with 10 mm DTT for 30 min at 60 °C, followed by alkylation with 20 mm iodoacetamide for 45 min at RT in the dark. Digestion with trypsin was performed at 37 °C overnight (sequencing grade, Cat#90058, Thermo Fisher Scientific, Waltham, MA, USA). Peptides were extracted twice with 5% formic acid, 60% acetonitrile, and dried under a vacuum. Liquid chromatography–tandem mass spectrometry (LC–MS/MS) analysis of samples was performed as described (Lamb et al. 2022), except that several parameters were changed as follows: scan range from 375 to 1,500 m/z, parent masses were isolated in the quadrupole with an isolation window of 1.2 m/z, and the lower limit for the MS/MS scan was set at 110 atomic mass unit (amu).
Database searches
The peak list of the LC–MS/MS was generated by Thermo Proteome Discoverer (v. 2.4) in MASCOT Generic Format (MGF) and searched against Araprot 11 and a common lab contaminants (CRAP) database using in house version of X! Tandem (GPM Fury) (Craig and Beavis 2004). The search parameters were as follows: fragment mass error, 20 ppm; parent mass error, ±7 ppm; fixed modification, no fixed modification; variable modifications, methionine monooxidation for the primary search; asparagine deamination, tryptophan oxidation and dioxidation, methionine dioxidation, and glutamine to pyroglutamine were considered during the refinement stage. Protease specificity: trypsin (C-terminal of arginine [R]/lysine [K] unless followed by proline [P]) with 1 missed cleavage during the preliminary search and 5 missed cleavages during refinement. Minimum acceptable peptide and protein expectation scores were set at 10−2 and 10−4, respectively. The overall peptide false-positive rate was 0.07% (Gupta et al. 2011).
Data analysis
Definition of RBPs
Proteins with at least 2 peptides in CL samples and FC (CL/noCL) ≥ 2 in at least 2 out of 3 replicates were considered in statistical analysis. Statistical analysis was performed as described with some modifications (Backlund et al. 2020). Data for qualified proteins were first cleaned using the limma package to remove batch effects (Ritchie et al. 2015). The CL and noCL data were then normalized separately with a variance stabilization normalization (vsn) approach using the vsn package (Huber et al. 2002). Next, differential expression analysis was carried out by the limma package. Proteins with a FC (CL/noCL) ≥ 2 at an adjusted P-value (FDR) < 5% were defined as RBPs, and those with a FC (CL/noCL) ≥ 1.5 at an FDR < 20% were considered to be candidate RBPs.
Definition of salt-responsive RBPs
Proteins with at least 2 peptides in CL samples and with the FC (CL/noCL) ≥ 2 in at least 2 out of 3 replicates were considered for statistical analysis of salt-responsive RBPs. A spectral counting-based method was used (Zybailov et al. 2005) to compare the FC of spectra counts between salt (+) and salt (−) samples. Proteins with FC (salt CL/no salt CL)| ≥ 1.5 at FDR < 5% were defined as salt-responsive proteins. Salt-responsive proteins that met the criteria as RBPs were defined as salt-responsive RBPs.
RIC and definition of poly(A) RBPs
RIC using 12-d-old seedlings with or without salt treatment was performed as described (Reichel et al. 2016). A protein was defined as an RBP if it has at least 2 peptides identified in the CL sample and with a FC (CL/noCL) ≥ 2 in any of the 2 biological replicates. RBPs identified by RIC were defined as poly(A) RBPs.
GO enrichment analysis, protein subcellular localization, and PANTHER protein categorization
The enrichment of molecular functions, biological processes, and cellular components was analyzed using Metascape (Zhou et al. 2019). Terms with P < 0.01 were considered to be enriched. Protein subcellular localization was predicted using SUBA (http://suba.live). PANTHER protein categorization was performed at http://www.pantherdb.org/.
Pfam domain annotation and enrichment analysis
One representative isoform of each gene was retrieved from the Arabidopsis genome (Araport 11) on the TAIR website (https://www.arabidopsis.org/). A protein sequence search in the Pfam-A domain database was conducted with the domain-search algorithm HMMER3, using an E-value < 1.0 as the cutoff. Overrepresentation of a Pfam domain was tested with Fisher's exact test, and P-values were corrected using the Benjamini and Hochberg method.
IDR and functional prediction
The predicted Arabidopsis IDR data set was downloaded from MobiDB (Piovesan et al. 2021). Gene IDs of the PPE-RBPome were converted into Uniprot IDs and searched against the IDR data set to retrieve IDRs residing in the PPE-RBPome. RNA–IDR interactions were predicted using flDPnn (Hu et al. 2021).
Validation of RBPs
DNA constructs, protein expression, and purification
Full-length coding sequences of candidate RBPs and DNA fragments covering the RBDs were PCR amplified from cDNAs reverse-transcribed from Col-0 mRNA using Phusion DNA Polymerase (NEB) and cloned into the pMCSG9 vector using the ligation-independent cloning (LIC) strategy as described (Eschenfeldt et al. 2009). Plasmids containing the His-MBP-RBP/RBD fusion constructs were transformed into E. coli strain BL21 (RIL) for expression. Proteins were purified using Ni-NTA His-Bind Resin following the manufacturer's instructions (MilliporeSigma, Burlington, MA, USA). See Supplemental Table S2 for a list of primers.
mRNA pull-down assay
For each pull-down assay, 25 µg of total RNA was extracted from 12-d-old Arabidopsis leaves using the Trizol method and incubated with 30 µl of preequilibrated oligo d(T)25 magnetic beads (NEB) for 15 min at RT with continuous rotation. The beads were briefly washed once in lysis/binding buffer (100 mm Tris–Cl, pH7.5, 0.5 m LiCl, 0.5% LiDS, 1 mm EDTA, and 5 mm DTT), followed by wash buffer I (20 mm Tris–Cl, pH7.5, 0.5 m LiCl, 0.1% LiDS, 1 mm EDTA, and 5 mm DTT) and wash buffer II (20 mm Tris–Cl, pH7.5, 0.5 m LiCl, 1 mm EDTA, and 5 mm DTT), and 3 times in pull-down binding buffer (20 mm Tris–Cl, pH7.5, 150 mm NaCl, 5 mm MgCl2, 0.1% IGEPAL CA-630, and 5 mm DTT). After the final wash, 200 µg of BSA diluted in 400 µl of pull-down binding buffer was added to the beads, followed by incubation at 4 °C for 1 h with continuous rotation. A 3-µg aliquot of purified recombinant protein was combined with 4 µl of RiboLock RNase Inhibitor (Thermo Fisher Scientific, Waltham, MA, USA). The mixture was incubated at RT for 1 h, followed by washing 4 times in pull-down wash buffer (20 mm Tris–Cl, pH7.5, 150 mm NaCl, and 0.2% IGEPAL CA-630), with a brief vortex during each washing step. The final beads were combined with 30 µl of 1× SDS protein loading buffer and incubated at 99 °C for 10 min with vigorous shaking. Ten microliters of the final elution was used for SDS–PAGE gel separation and immunoblot analysis. Candidate RBPs were detected with anti-His monoclonal antibody (MilliporeSigma, Burlington, MA, USA).
To validate the interactions between non-poly(A) RBP and non-poly(A) RNA, non-poly(A) RNAs in the flow-through fraction (after 4 rounds of oligo d(T) selection) were precipitated by ethanol and NaCl and resuspended in RNase-free water as a 2 µg/µl stock. Fifty grams of non-poly(A) RNAs were polyadenylated using E. coli poly(A) polymerase (NEB). Polyadenylated non-poly(A) RNAs were further cleaned to remove free ATP using a Bio-Spin 6 column (Bio-Rad), aliquoted, and loaded onto oligo d(T)25 magnetic beads as bait for the pull-down assay.
Accession numbers
Sequence data from this article can be found in the GenBank/EMBL libraries under the following accession numbers: AT5G51970 (ATSDH); AT3G14210 (ESM1); AT4G13770 (CYP83A1); AT4G27700 (AtSTR14); and AT1G66670 (CLPP3).
Acknowledgments
The authors thank Dr. Xiaofeng Cao (Institute of Genetics and Developmental Biology, Chinese Academy of Sciences) for providing anti-HLP1 and anti-Fib1/2 antibodies and Dr. Haiyan Zheng for mass-spectrometry analyses (Center for Advanced Biotechnology and Medicine, Rutgers University).
Author contributions
Y.Z. and D.S. designed the project. D.S. and X.C. supervised the experiments. Y.Z. performed the experiments and data analysis. Y.X carried out the statistical analysis of the mass-spectrometry data and retrieved and created the Arabidopsis RBD reference database. T.H.S., J.F.S.F., and X.C. provided conceptual advice and assistance with experiments. Y.Z. and D.S. wrote the manuscript with joint contributions from all the authors. All authors have read and approved the manuscript.
Supplemental data
The following materials are available in the online version of this article.
Supplemental Figure S1. Determination of the optimal rounds of PPE.
Supplemental Figure S2. Overrepresented GO terms in leaf and root RBPome.
Supplemental Figure S3. Subcellular localization of RBPs identified by PPE.
Supplemental Figure S4. Reproducibility between replicates in the root.
Supplemental Figure S5. Comaprison of PPE-RBPome/OOPS-RBPome with RIC-RBPomes.
Supplemental Figure S6. RBP classes.
Supplemental Figure S7. Top 15 RBDs.
Supplemental Figure S8. Validation of RBPs.
Supplemental Figure S9. Comparison of the subcellular distribution of RBPs captured by RIC, OOPS, and PPE.
Supplemental Figure S10. Protein domains of the fatty acid desaturase family members.
Supplemental Table S1. Shared salt-responsive RBPs in leaf and root tissue.
Supplemental Table S2. Oligos used to generate the DNA constructs.
Supplemental Data Set S1. The leaf and root salt (−) RBPomes identified by PPE.
Supplemental Data Set S2. The leaf and root salt (+) RBPomes identified by PPE.
Supplemental Data Set S3. Salt-responsive RBP–RNA interactions in the leaf and root tissue.
Supplemental Data Set S4. The complete RBPome and the non-poly(A) RBPome identified by PPE.
Supplemental Data Set S5. The Arabidopsis RBD database and RBDs identified by PPE.
Supplemental Data Set S6. Thirty-eight overrepresented motifs as potential RBDs.
Supplemental Data Set S7. IDRs in the PPE-RBPome.
Supplemental Data Set S8. Classification of the non-poly(A) RBPome by PPE.
Funding
This research was funded by the United States Department of Agriculture-Agricultural Research Service, National Program 301: Plant Genetic Resources, Genomics, and Genetic Improvement (project number 2036-13210-012-000D), National Program 211: Water Availability & Watershed Management (project number 2036-61000-019-000D), and the National Institute of Food and Agriculture (project number CA-R-BPS-5084-H).
Data availability
All data supporting this study are included in the article and its Supplemental material. Raw Mass-spectrometry data are deposited in the UCSD MassIVE database under the Identifier MSV000091682 (https://massive.ucsd.edu/ProteoSAFe/static/massive.jsp).
Disclaimer
The use of trade, firm, or corporation names in this publication is for the information and convenience of the reader. Such use does not constitute an official endorsement or approval by the United States Department of Agriculture or the Agricultural Research Service of any product or service to the exclusion of others that may be suitable.
References
Vaishali,
Author notes
These authors contributed equally.
The authors responsible for distribution of materials integral to the findings presented in this article in accordance with the policy described in the Instructions for Authors (https://dbpia.nl.go.kr/plcell/pages/General-Instructions) are: Yong Zhang ([email protected]) and Devinder Sandhu ([email protected]).
Conflict of interest: The authors declare no conflict of interest. The funders had no role in the design of the study, in the collection, analyses, or interpretation of data, in the writing of the manuscript, or in the decision to publish the results.
