


Abstract
Modulation of photoassimilate export from the chloroplast is essential for controlling the distribution of fixed carbon in the cell and maintaining optimum photosynthetic rates. In this study, we identified chloroplast TRIOSE PHOSPHATE/PHOSPHATE TRANSLOCATOR 2 (CreTPT2) and CreTPT3 in the green alga Chlamydomonas (Chlamydomonas reinhardtii), which exhibit similar substrate specificities but whose encoding genes are differentially expressed over the diurnal cycle. We focused mostly on CreTPT3 because of its high level of expression and the severe phenotype exhibited by tpt3 relative to tpt2 mutants. Null mutants for CreTPT3 had a pleiotropic phenotype that affected growth, photosynthetic activities, metabolite profiles, carbon partitioning, and organelle-specific accumulation of H2O2. These analyses demonstrated that CreTPT3 is a dominant conduit on the chloroplast envelope for the transport of photoassimilates. In addition, CreTPT3 can serve as a safety valve that moves excess reductant out of the chloroplast and appears to be essential for preventing cells from experiencing oxidative stress and accumulating reactive oxygen species, even under low/moderate light intensities. Finally, our studies indicate subfunctionalization of the TRIOSE PHOSPHATE/PHOSPHATE TRANSLOCATOR (CreTPT) transporters and suggest that there are differences in managing the export of photoassimilates from the chloroplasts of Chlamydomonas and vascular plants.
Background: In photosynthetic eukaryotes, chloroplasts supply energy and fixed/organic carbon to other cellular compartments through numerous transporters in the chloroplast envelope. Modulating metabolite export from the chloroplast can markedly impact the growth and photosynthetic activity of cells. Additionally, the export of metabolites/sugars from chloroplasts can transduce signals to the nucleus and coordinate the expression of chloroplast and nuclear genes in response to environmental changes and the cell's metabolic demands. However, the activities and substrate specificities of several of the transporters, the ways in which they are regulated, and how their functions are integrated are not well defined in microalgae such as Chlamydomonas.
Question: What metabolite transporters on the chloroplast envelope are critical for the movement of sugars between the chloroplast and cytosol in the green alga Chlamydomonas, and how does this export regulate cell growth, metabolism, cellular redox conditions, and the formation of potentially toxic oxygen radicals?
Findings: We found that the triose phosphate (triose-P)/phosphate (Pi) translocator 3 (TPT3) is a major conduit for the export of fixed carbon, as simple 3-carbon sugars, from Chlamydomonas chloroplasts. Mutants unable to make this transporter are light sensitive and show marked changes in their metabolic profiles relative to unmutated cells; the major shift in cellular metabolism creates a toxic intracellular environment (probably through production of reactive oxygen species) with increasing light absorbance. Additionally, unlike for many vascular plants, Chlamydomonas is unable to compensate for the loss of TPT3 through the activities of other sugar transporters.
Next steps: This work would further benefit from the use of metabolite flux analyses and characterization of other mutants defective for chloroplast sugar transporters. It offers opportunities for assessing the catalytic features of these transporters and how they are regulated and interact with each other to insure robust metabolism under dynamic environmental conditions.
Introduction
Photosynthetic organisms can absorb excess, potentially damaging levels of light energy during mid-day (when photosynthetic electron transport becomes saturated), and can suffer from extreme damage, especially when experiencing rapid fluctuations in light intensities or when subjected to nutrient-limiting conditions and other environmental stresses that impair the productive utilization of excitation energy (Chaux et al. 2017; Saroussi et al. 2017). To cope with excess excitation energy, plants and algae have evolved mechanisms to dissipate this energy through nonphotochemical quenching (NPQ) (Niyogi and Truong 2013). The excess reductant and energy can also be eliminated by photochemical quenching. While the dominant form of photochemical quenching often involves the use of electrons/reductant to fix inorganic carbon (Ci), which is directed toward growth or stored in the form of starch and lipids (Ge et al. 2014; Krishnan et al. 2015; Huang et al. 2018), redox equivalents can also be trafficked to other outlets where they are not used for anabolic reactions. The main alternative photochemical electron outlets involve the reduction of O2 to H2O in H2O-to-H2O cycles that include a (i) Mehler-type reaction that is noncatalytic and functions on the acceptor side of photosystem I (PSI) (Badger et al. 2000), (ii) flavodiiron protein reactions (FLVs, NADPH:flavin oxidoreductase) that catalytically reduce O2 on the acceptor side of PSI without generating reactive oxygen species (ROS) (Helman et al. 2003; Chaux et al. 2017), (iii) the plastid terminal oxidase (PTOX, plastoquinol:oxygen oxidoreductase) reaction that can use electrons from the plastoquinone (PQ) pool to reduce O2 (Houille-Vernes et al. 2011), and (iv) the movement of redox equivalents from the chloroplast to the mitochondrion where they can be used to reduce O2 through various electron transport activities.
Mechanisms also exist in which fixed carbon and reducing equivalents can be shuttled between the chloroplast and cytoplasm. Studies with Arabidopsis (Arabidopsis thaliana) have revealed that the malate shuttle, which involves multiple malate dehydrogenases (MDH) and malate/oxaloacetate (OAA) translocators (OMTs), functions in the export of reductant from the chloroplast and the management of redox conditions in the chloroplast (Zhao et al. 2018, 2020). In addition to the malate shuttle and triose phosphate (triose-P)/inorganic phosphate (Pi) translocators (TPTs) have been proposed to be involved in moving fixed carbon out of the chloroplast but can also act as a safety valve for eliminating excess reducing power from the chloroplast (Stocking and Larson 1969; Fliege et al. 1978; Flügge et al. 1989; Raghavendra and Padmasree 2003; Johnson and Alric 2013; Lee et al. 2017). The biosynthesis of triose-Ps during photosynthetic CO2 fixation by the Calvin–Benson–Bassham (CBB) cycle is supported by the reducing power/energy (NADPH, ATP) derived from photosynthetic electron transport.
TPTs reside on the inner chloroplast envelope membrane and can transport triose-Ps [glyceraldehyde 3-phosphate (GAP), dihydroxyacetone phosphate (DHAP)] and the 3 carbon acid, 3-phosphoglycerate (3-PGA), in a counter exchange for cytosolic Pi (Fliege et al. 1978; Flügge et al. 1989; Lee et al. 2017). These transporters belong to a family of plastid phosphate translocators (pPTs) that function as antiporter systems involved in exchanging Pi with phosphorylated C3, C5, or C6 compounds (Flügge et al. 2003). Most angiosperms have 2 TPT genes in their genome, except for various monocots and 2 dicot families, the Amaranthaceae and the Brassicaceae, which have a single TPT gene (Bockwoldt et al. 2019). In plants, cytosolic trioses exported from the chloroplast by TPTs are used for the biosynthesis of sucrose and other metabolites (Riesmeier et al. 1993) and to drive respiratory activity. In addition to TPTs, plants harbor the 3 other pPT subfamilies (Flügge et al. 1989; Fischer et al. 1997; Kammerer et al. 1998; Eicks et al. 2002; Lee et al. 2017). These families comprise glucose 6-phosphate (Glc6P) translocators (GPTs), which import Glc6P into plastids in heterotrophic tissue (Kammerer et al. 1998); xylulose phosphate translocators (XPTs), which play a key role in coordinating the cytosolic and plastid pentose phosphate pathways (Eicks et al. 2002); and phosphoenolpyruvate (PEP) translocators (PPTs), which import PEP into C3 plastids; PEP can be used for the biosynthesis of fatty acids, as substrate for the shikimate pathway (Streatfield et al. 1999; Prabhakar et al. 2010), and for the export of PEP from plastids in C4 plants (Häusler et al. 2000).
Over the last few decades, the physiological functions of TPTs have been examined in some detail. Various plants do not exhibit a strong phenotype if their chloroplast TPT is either eliminated or its abundance is decreased (Riesmeier et al. 1993; Häusler et al. 1998; Schneider et al. 2002; Walters et al. 2004). Lower TPT activity can be compensated for by diverting assimilated carbon into a transitory starch pool that is subjected to accelerated turnover in the light and/or darkness (Riesmeier et al. 1993; Häusler et al. 1998; Walters et al. 2004), leading to the accumulation of starch degradation products that can be exported from the chloroplast and used in other cellular compartments. Interestingly, a loss of TPT function in rice (Oryza sativa), a plant that uses sucrose stored in leaves as its major transitory form of fixed carbon, led to severe phenotypic consequences as the plants exhibited diminished photosynthetic rates and decreased levels of both starch and soluble sugars relative to wild-type (WT) plants (Lee et al. 2014).
Microalgae have high photosynthetic conversion efficiencies, can thrive in fresh to hypersaline waters, and can be metabolically versatile. They have attracted considerable interest worldwide because of their ability to synthesize large quantities of lipids (e.g. for biofuels and food products), starch, pigments, and other bioproducts and can serve in the remediation of wastewater (Khan et al. 2018; Bhatt et al. 2022). The transporters used for moving photoassimilates between the chloroplast and other cellular compartments and the mechanisms and regulation of these transporters in microalgae have not been extensively explored. Developing a more informed understanding of central metabolism in microalgae and the movement of metabolites among compartments can enable additional work on the establishment, regulation, and evolution of metabolic networks in algae and the ways in which algae can be tailored for production purposes and for sustained growth under specific environmental conditions.
In this study, we used Chlamydomonas (Chlamydomonas reinhardtii), a well-established model green algal system that has been extensively used to analyze various aspects of physiology, to dissect the function of chloroplast TPTs. Of the 4 putative Chlamydomonas pPTs, we discovered that at least 2 are “genuine” TPTs (CreTPT2 and CreTPT3) based on yeast (Saccharomyces cerevisiae) liposome transport assays. CreTPT2 was previously reported to be a PPT based on phylogenetic analysis (Bockwoldt et al. 2019). These 2 TPTs exhibited subfunctionalization, as reflected by the expression levels of their encoding genes and their temporally and environmentally distinct regulatory patterns. Due to the more severe phenotypes exhibited by tpt3 relative to tpt2 mutants, we focused our analyses on Chlamydomonas TPT3 (CreTPT3). Among the 4 predicted pPTs, CreTPT3 is highly expressed in the light and strongly induced by various environmental stresses. Through a series of physiological analyses, we demonstrate that CreTPT3 is a major conduit at the chloroplast envelope for the trafficking of fixed carbon, sustaining central carbon metabolism, dissipating excess energy, enabling high rates of photosynthetic electron transport, preventing intracellular hydrogen peroxide (H2O2) accumulation, and balancing redox conditions at the subcellular level.
Results
The triose-P/Pi translocator (DMT/TPT) family
We identified candidate genes encoding TPT in Chlamydomonas by performing a BLAST search using Arabidopsis TPT (encoded by At5g46110.1) as a query against proteins encoded by the Chlamydomonas genome. The TPT family is the largest within the drug/metabolite transporter (DMT) superfamily of eukaryotes and includes triose-P and sugar–phosphate transporters associated with chloroplasts; many of the family members are still not functionally characterized (Jack et al. 2001; Knappe et al. 2003; Weber et al. 2006). We identified 32 genes encoding potential TPTs in version v6.1 of the Chlamydomonas genome, with 4 members, CreTPT10 (CreTPT1 in the v5.6 genome), CreTPT2 (CreTPT2 in the v5.6 genome), CreTPT3, and CONSERVED GREEN-LINEAGE 51 (CGL51), named CreTPT25 in the v5.6 genome), predicted to have a chloroplast transit peptide (Supplemental Table S1). These 4 candidates were included in a phylogenetic analysis of plant and algal pPTs that showed that CreTPT3 is a putative TPT, CreTPT2 and CreTPT10 are putative PPTs and CGL51 is a putative GPT or XPT (Bockwoldt et al. 2019).
To examine the potential substrate specificities of the 4 putative pPTs, we aligned their amino acid sequences with those of pPTs from Arabidopsis (AtPTs) (Supplemental Fig. S1A). The ability of these transporters to use triose-P/DHAP or 3-PGA as substrate is dependent on 5 highly conserved amino acid residues (H184, K203, Y338, K359, and R360 in AtTPT1) (Lee et al. 2017; Moog et al. 2020). Of the putative pPTs in Chlamydomonas, only CreTPT3 and CGL51 contain all 5 of these residues (H170, K189, Y322, K345, and R346 in CreTPT3) (Supplemental Fig. S1A). In AtTPT1, residue F262 (F248 in Chlamydomonas in the analogous protein, CreTPT3) is thought to inhibit PEP access to the binding site; this residue is replaced by N in AtPPT1 (PPT) (Lee et al. 2017; Moog et al. 2020). CGL51 has an M at position 248, indicating that unlike CreTPT3, CGL51 might have preference for other substrates. Protein sequence similarity and identity analysis showed that CreTPT3 and CreTPT2 share the highest and the second highest similarity and identity with AtTPT1 (Supplemental Fig. S1B), with 57% and 49% similarity to AtTPT1, respectively. Furthermore, CreTPT2 and CreTPT3 have significantly higher transcript accumulation in the light relative to CreTPT10 and CGL51 (Supplemental Fig. S1, C and D). Given their high similarity and high expression levels, we chose CreTPT2 and CreTPT3 for study.
CreTPT2 and CreTPT3 transport properties
We defined the subcellular localization and substrate preferences of CreTPT2 and CreTPT3. As shown in Fig. 1A, both CreTPT2 and CreTPT3 fused to VENUS localized to the chloroplast envelope. To evaluate the substrate specificity of these transporters, each protein was produced in budding yeast and the resulting recombinant protein was biochemically analyzed using a liposome uptake assay. Accordingly, we cloned codon-optimized CreTPT2 and CreTPT3 genes in-frame and downstream of a sequence encoding a His-tag and induced the production of each recombinant protein in yeast (Fig. 1B). We isolated total cell membranes and reconstituted them into liposomes (Loddenkötter et al. 1993; Linka et al. 2008). Chloroplast phosphate transporters in vascular plants can catalyze a Pi/Pi homo-exchange in vitro. Both CreTPT2 and CreTPT3 reconstituted in liposomes were able to catalyze this signature Pi homo-exchange; importantly, we detected little Pi uptake in the absence of a counter-exchange substrate (Fig. 1, C and D, left). In contrast, we observed very low Pi uptake rates for liposomes reconstituted with membranes from yeast cells not producing CreTPT2 or CreTPT3 (Supplemental Fig. S2), indicating that the introduced transporters were responsible for the detected Pi import activity in yeast liposomes.
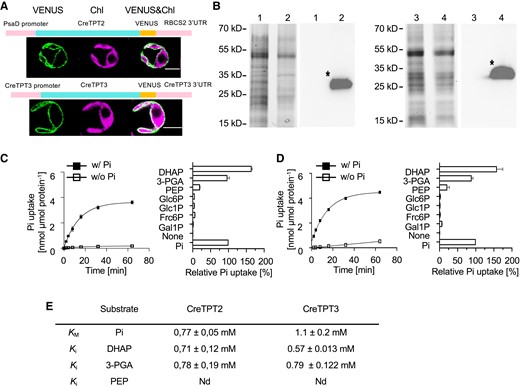
Subcellular localization of CreTPT2 and 3 and in vitro measurements of transport activities. A) Cellular localization of CreTPT2 (upper) and CreTPT3 (lower). A schematic diagram for the construct encoding the CreTPT2/3-VENUS fusion protein is shown above the cell images and described in Materials and methods. VENUS, VENUS fluorescence; Chl, chlorophyll autofluorescence. Scale bars, 5 μm. B) Production of CreTPT2 (1, 2) and CreTPT3 (3, 4) in yeast. Left in each panel, Coomassie Brilliant Blue-stained SDS-PAGE of proteins from total membranes isolated from yeast cells containing the empty vector (1, 3) or harboring the His-CreTPT2 (2) or His-CreTPT3 (4) construct. Right in each panel, corresponding immunoblot detection of recombinant His-CreTPT2 or His-CreTPT3 protein using anti-His antibodies. The calculated molecular masses of the N-terminal His-tagged proteins of CreTPT2 and CreTPT3 were 39 kD and 37 kD, respectively. C) Left, kinetics of Pi exchange by His-CreTPT2 in lipid vesicles. Uptake of 0.25 mM Pi into liposomes was measured in the presence (◼) or absence (□) of 30 mM Pi loaded into the vesicles. Right, analyses of substrate specificity of His-CreTPT2. D) Left, kinetics of Pi exchange by His-CreTPT3 in lipid vesicles. Uptake of 0.25 mM Pi into liposomes was measured in the presence (◼) or absence (□) of 30 mM Pi loaded into the vesicles. Right, analyses of substrate specificity of His-CreTPT3. For the left panels of C and D, the arithmetic mean (±Sd) of 3 independent experiments (each with 3 technical replicates) was plotted with respect to the time after initiating the assay. For the right panels of C and D, liposomes in which His-CreTPT2 and His-CreTPT3, respectively, were incorporated and were preloaded with various substrates (30 mM) and the initial Pi uptake rates (at 0.25 mM external concentration) were determined. Relative velocities were compared with the Pi/Pi homo-exchange, which was set to 100%. The data represent the arithmetic mean (±Sd) of 3 independent experiments (each consisting of 3 technical replicates). E) Kinetic constants of His-CreTPT2 and His-CreTPT3. The Michaelis–Menten constant (KM) for Pi uptake was determined using various external Pi concentrations (0.05 to 5 mM). The competitive inhibition constant (Ki) of the 0.25 mM Pi uptake was measured with increasing competitor concentrations (0.05 to 5 mM). Liposomes were preloaded with 30 mM Pi as the counter-exchange substrate. The data represent the arithmetic mean ± SE of 3 independent experiments. Nd, no competitive inhibitory constant could be measured under the given experimental conditions. DHAP, dihydroxyacetone phosphate; 3-PGA, 3-phosphoglycerate; PEP, phosphoenolpyruvate; Glc6P, glucose 6-P; Glc1P, glucose 1-P; Fru6P, fructose 6-P; Gal1P, galactose 1-P.
To assess the substrate specificity of the 2 CreTPT transporters, we determined their initial rates of Pi uptake into liposomes preloaded with saturating concentrations (30 mM) of various potential counter-exchange substrates. As the right panels of Fig. 1, C and D show, both CreTPT2 and CreTPT3 exhibited the highest activity when DHAP was used as the substrate for the yeast liposome assay. For both transporters, the relative initial velocity for DHAP/Pi exchange was slightly higher than that of 3-PGA/Pi (the relative 3-PGA/Pi exchange was 75% of DHAP/Pi exchange) while Pi uptake into liposomes preloaded with PEP was much lower (Fig. 1, C and D, right panels). Pi import was negligible when CreTPT2 or CreTPT3 liposomes were preloaded with Glc-6-P, Glc-1-P, Fru-6-P, and Gal-1-P (Fig. 1, C and D, right panels). These results show that CreTPT2 and CreTPT3 have almost the same substrate preferences, with both specifically supporting the transport of triose-P and 3-PGA across the membrane in exchange for Pi.
We characterized the KM and Ki for CreTPT2 and CreTPT3 to determine the affinity of these transporters to various substrates. CreTPT3 had an apparent Michaelis–Menten constant (KM) of 1.1 ± 0.2 mM for Pi (Fig. 1E), which is comparable with the value obtained for its TPT ortholog in vascular plants (Fliege et al. 1978). CreTPT2 had a slightly lower KM for Pi than CreTPT3 (0.77 ± 0.05 mM) (Fig. 1E). However, while the 3-PGA Ki values were comparable for the 2 transporters, DHAP was more effective in inhibiting CreTPT3-dependent Pi exchange than CreTPT2-dependent Pi exchange (Fig. 1E). These results suggest that CreTPT3 may have a greater specificity for the transport of DHAP than CreTPT2 and that it may be more effective in transporting C3-phosphorylated compounds than CreTPT2. In the case of PEP, we observed no inhibition of Pi/Pi homo-exchange, even at the nonphysiological high concentration of 5 mM. Overall, the results of these in vitro assays indicate that both CreTPT2 and CreTPT3 have a typical plant TPT substrate spectrum (Fliege et al. 1978) and can transport Pi, triose-P (DHAP), and 3-PGA in a counter-exchange mode. However, PEP might not be a physiologically relevant substrate for either CreTPT2 or CreTPT3, as is the case for apoplast TPT homologs in other organisms (Lim et al. 2010; Moog et al. 2020). Furthermore, the values generated in these analyses may not precisely reflect transport kinetics in vivo since the 2 transporters used for these in vitro assays were fused to a His-tag at their N-terminus and yeast liposomes would have a different lipid composition than the chloroplast inner envelop membrane, where these transporters are normally localized.
Isolation of tpt2 and tpt3 null mutants of Chlamydomonas and their effects on cell growth
To explore the role of CreTPT2 and CreTPT3 in trafficking carbon and potentially reductant across the chloroplast envelope in vivo, we generated knockouts of CreTPT2 or CreTPT3 by clustered regularly interspaced short palindromic repeat (CRISPR)/CRISPR-associated nuclease 9 (Cas9)-mediated gene editing. We used the CRISPR/Cas9 editing system to disrupt the CreTPT2 or CreTPT3 locus while at the same time to integrate a hygromycin resistance marker gene (AphVII) at the edited site (Figs. 2A and S3 and S4). We obtained 4 independent knockouts for CreTPT2 (t2ko1, t2ko2, t2ko3, and t2ko4), with the marker gene inserted into exon 8 (Supplemental Fig. S3). Similarly, we isolated 3 independent knockouts for CreTPT3: t3ko1, with the marker gene inserted into exon 1, and t3ko2 and t3ko3, with the marker gene inserted into exon 7; we detected no CreTPT3 protein in any of these edited strains (Fig. 2B).
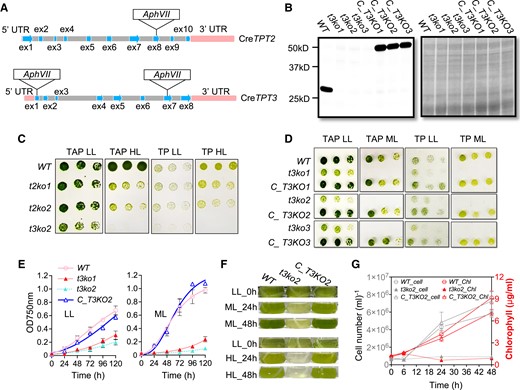
Growth characterization of tpt mutants and complemented strains. A) Molecular map of the CreTPT2 (upper) and CreTPT3 (lower) genes and the positions of the Cas9 targeted sites. The edited site of CreTPT2 is located in exon 8, and edited sites of CreTPT3 are located in exons 1 and 7; t3ko1 has the marker gene inserted in exon 1, and t3ko2 and t3ko3 have the marker gene inserted in exon 7. B) Immunoblot (left panel) of the stained protein profiles (right panel) for wild type (WT), t3ko1, t3ko2, t3ko3, and the complemented strains (C_T3KO1, C_T3KO2, and C_T3KO3). C) Growth of WT, t2ko1, t2ko2, and t3ko2 at various dilutions (see below) on agar plates incubated under LL and HL for 4 d. D) Growth of WT, t3ko1, t3ko2, t3ko3, and the complemented strains (C_T3KO1, C_T3KO2, and C_T3KO3), at various dilutions (see below) on agar plates incubated under LL or ML for 4 d. E) Growth of various strains (indicated) in liquid medium under LL (left panel) or ML (right panel). F) Transition of strains from LL to ML (upper) or to HL (lower) for the indicated times. G) Cell growth (number) and chlorophyll content of cultures at various times after shifting from LL to ML for up to 48 h. In C) and D), cells were spotted on agar plates containing TAP or TP medium and maintained under continuous LL, ML, or HL conditions. The dilution series used was 1.5, 0.75, and 0.375 μg mL−1 chlorophyll equivalent (left to right). For growth in liquid medium, cells were cultured in TP medium to an initial OD750 nm of 0.02 in air and under continuous LL before initiating the various growth analyses in LL, ML, or HL. Each curve represents the arithmetic mean (±Sd) of 3 independent experiments.
To elucidate the physiological roles of CreTPT2 and CreTPT3, we examined the growth of the parental WT strain and the knockout mutants under either low light (LL, 30 μmol photons m−2 s−1), moderate light (ML, 250–300 μmol photons m−2 s−1), or high light (HL, 450 μmol photons m−2 s−1). The design of the experiments in which the cells were transferred from 1 light condition to another is shown in Supplemental Fig. S5. The 4 tpt2 mutants (t2ko1, t2ko2, t2ko3, and t2ko4) were not affected by growth in LL, but their growth was significantly impaired relative to WT cells under HL on either photoautotrophic (TP) or heterotrophic (TAP) solid agar medium (Figs. 2Cand S3D). In contrast, the CreTPT3 mutants (t3ko1, t3ko2, and t3ko3) exhibited severe growth impairment even in LL and completely stopped growing under ML and HL, on either TP or TAP agar medium (Fig. 2, C and D). Due to the striking growth phenotypes caused by the loss of CreTPT3 function, we focused on investigating the physiological functions of TPT3 by analyzing tpt3 mutants in more detail in this study. The differences in transcript changes between CreTPT2 and CreTPT3 under various environmental conditions were examined and are described in the Discussion.
We determined growth curves for WT and tpt3 mutant cells grown in liquid medium (TP) in LL, ML, and HL (Figs. 2E and F); the results were in accordance with those observed for the solid medium growth assays. Additionally, tpt3 mutant cells in both LL and ML exhibited an increased cell diameter and formed clusters of cells that appear to be less able to separate following cell division (Supplemental Fig. S6, A and B). To confirm that the growth phenotypes are a consequence of the tpt3 knockout, we introduced a WT copy of CreTPT3 cloned in-frame and upstream of the VENUS fluorescent gene into the mutant strains (Fig. 2B, right). As shown in Fig. 2, D to G, ectopic expression of the WT CreTPT3 in the t3ko2 mutant (C_T3KO2) rescued the limited growth phenotype of the mutant under all light conditions tested in this study (LL/ML/HL).
We also analyzed the chlorophyll content of photoautotrophically grown cells after transferring them from LL to ML and observed that t3ko2 has lower chlorophyll content relative to WT cells after 24 h in ML (Figs. 2, F and G, and S7). We quantified cell numbers and total chlorophyll contents following the LL to ML transition. Chlorophyll levels per cell declined in all strains at 24 and 48 h following transfer to ML; however, it was lower by approximately half in t3ko2 (0.34 µg/1 × 106 cells) relative to either WT cells or the C_T3KO2 complemented strain (both ∼0.72 µg/1 × 106 cells) after 24 h of ML (Supplemental Fig. S7), with some additional increase in cell density for WT and C_T3KO2 after 48 h of ML (which might result in some shading). Finally, mutant cells became strongly bleached when transferred to HL for 24 h (Fig. 2F).
Taken together, these results indicate that the activity of the CreTPT3 transporter is essential for optimal growth over a range of light intensities (LL/ML/HL).
The tpt3 mutant exhibits hyperaccumulation of “storage” carbon
To explore the effect of the loss of CreTPT3 activity on carbon partitioning, we quantified the carbon storage (starch and lipids) following a transition of WT and the t3ko2 mutant from LL to ML. Lugol staining showed extensive starch accumulation in t3ko2 cells after a 48-h exposure to ML, whereas WT cells were barely stained (Fig. 3B). Furthermore, as shown in Fig. 3A, there was a ∼55-fold difference in the level of starch that accumulated in t3ko2 relative to WT cells (13.29 compared with 0.24 µg starch/µg chlorophyll) after 24 h of illumination in ML. The mutant also accumulated >25-fold more lipid than WT and C_T3KO2 cells (on a chlorophyll basis), as monitored by Nile Red fluorescence, over the same time period (42 for WT and 1,038 for t3ko2 for Nile Red fluorescence/chlorophyll) (Fig. 3, C and D). Since the chlorophyll content in the mutant on a per cell basis was ∼50% relative to that of WT cells after 24 h in ML, the accumulated starch and lipid on a per cell basis represent a ∼25-fold increase for starch and ∼12-fold increase for lipid in the mutant relative to the WT strain. Additionally, mutant cells were much larger and tended to exhibit more aggregation than WT cells (Supplemental Fig. S6, A and B). These results suggest that the inability to transport triose-P between the chloroplast and the cytosol through CreTPT3 resulted in a repartitioning of photosynthetic assimilates (carbon, reductant, and ATP) toward the biosynthesis of both starch and neutral lipid.
![Changes in storage carbon and metabolite levels in WT and t3ko2 after transitioning cells from growth in LL to ML. A) Starch content in the indicated strains following 0, 6, or 24 h of ML exposure. B) Lugol staining of starch in WT and t3ko2 after 48 h of ML. C) TAG (triacylglycerol) content in the indicated strains following 0, 6, or 24 h of ML exposure. D) Nile Red staining of TAG in WT and t3ko2 following 48 h of ML exposure. E) Time course of metabolite accumulation at 0 h (LL), 45 min, or 6 h following ML exposure. Data were normalized to cell numbers. Each data point shows the mean and standard error; the data represent 3 biological replicates for each metabolite. ppb, parts per billion. F) Select metabolic pathways in Chlamydomonas adapted from Johnson and Alric (2013). G) Bar graph representation of fold change for metabolites shown in E), calculated by dividing the mean of pool size in t3ko2 by that of WT at the respective light levels. A fold change of 1 (no change) is indicated with a dashed line. An asterisk indicates statistically significant difference in pool sizes in t3ko2 compared with WT [from E)] (*P < 0.05, **P < 0.01, and ***P < 0.001) (Supplemental Data Set S1). G6P, glucose-6-P; FBP, fructose bisphosphate; DHAP, dihydroxyacetone phosphate; 3-PGA, 3- phosphoglycerate; PEP, phosphoenolpyruvate; PYR, pyruvate; CIT, citrate; SUCC, succinate; FUM, fumarate; MAL, malate; E4P, erythrose 4-P; R5P, ribose 5-P; RU5P/X5P, ribulose 5-P/xylulose-5-P; OMT, 2-oxoglutarate/malate transporter.](https://oup.silverchair-cdn.com/oup/backfile/Content_public/Journal/plcell/35/7/10.1093_plcell_koad095/1/m_koad095f3.jpeg?Expires=1750181416&Signature=U1jNTaimiulKzlXgOvhJcnoQO2~e2EU2eKvRd1cr3TX1ePvRFJDdKh48vR9R3BhADZgHnFK8TRX86vnonFXt3wAOKr8BhIwHj7-aDXE-1FphUQWNEXsUQKzPYBjx2KlETEwYFJY2lIAzFlQcsAAE9sCDDQo7oPN9tTYzSoKa0tG5vexO3JBmtOTFzJkdXhwg9EjS0E9SNsSfKk6UiL5mzB4~ddQYWxlW-Q0DXJrKDdQPRLW5jxhCVcCz6YcdCrBaR8OoTkxH0rPqWfP75tJrNrcBH1x9y9Hgoq8BI3tvyT0PZ5Jl74OypX5S0KKsd6rEwKSntgw-QXpUtFrw7ZZ40A__&Key-Pair-Id=APKAIE5G5CRDK6RD3PGA)
Changes in storage carbon and metabolite levels in WT and t3ko2 after transitioning cells from growth in LL to ML. A) Starch content in the indicated strains following 0, 6, or 24 h of ML exposure. B) Lugol staining of starch in WT and t3ko2 after 48 h of ML. C) TAG (triacylglycerol) content in the indicated strains following 0, 6, or 24 h of ML exposure. D) Nile Red staining of TAG in WT and t3ko2 following 48 h of ML exposure. E) Time course of metabolite accumulation at 0 h (LL), 45 min, or 6 h following ML exposure. Data were normalized to cell numbers. Each data point shows the mean and standard error; the data represent 3 biological replicates for each metabolite. ppb, parts per billion. F) Select metabolic pathways in Chlamydomonas adapted from Johnson and Alric (2013). G) Bar graph representation of fold change for metabolites shown in E), calculated by dividing the mean of pool size in t3ko2 by that of WT at the respective light levels. A fold change of 1 (no change) is indicated with a dashed line. An asterisk indicates statistically significant difference in pool sizes in t3ko2 compared with WT [from E)] (*P < 0.05, **P < 0.01, and ***P < 0.001) (Supplemental Data Set S1). G6P, glucose-6-P; FBP, fructose bisphosphate; DHAP, dihydroxyacetone phosphate; 3-PGA, 3- phosphoglycerate; PEP, phosphoenolpyruvate; PYR, pyruvate; CIT, citrate; SUCC, succinate; FUM, fumarate; MAL, malate; E4P, erythrose 4-P; R5P, ribose 5-P; RU5P/X5P, ribulose 5-P/xylulose-5-P; OMT, 2-oxoglutarate/malate transporter.
CreTPT3 deletion leads to the accumulation of CBB cycle/glycolytic/gluconeogenic intermediates
To understand the metabolic consequences of the loss of CreTPT3 function on growth under LL and ML, we undertook comparative metabolite analyses of WT and the t3ko2 mutant using cells grown in LL and after a shift to ML for 45 min or 6 h. As mentioned above, the level of starch increased dramatically in the mutant relative to WT cells (Figs. 3, A and B, and S8A). We then quantified pool sizes of various central carbon metabolites, particularly those of the CBB cycle and glycolysis/gluconeogenesis pathways and intermediates of the tricarboxylic acid (TCA)/glyoxylate cycle (Fig. 3F). Data were normalized by cell number (Fig. 3E) or chlorophyll content (Supplemental Fig. S8B). The fold change in the quantity of each metabolite in the mutant relative to WT under LL or at 45 min or 6 h after the switch to ML is given in Figs. 3G and S8C.
At the time of shifting cells from LL (Fig. 3E, time 0 h) to ML, the t3ko2 mutant had already accumulated a significantly larger pool (2- to 6-fold) of glycolytic/gluconeogenic intermediates [DHAP, 3-PGA, FBP (all 3 shared with the CBB cycle), G6P, and PEP] compared with WT cells, suggesting that the loss of CreTPT3 function resulted in a back-up of these metabolites within the cell. Our hypothesis is that these metabolites are accumulating in the chloroplast stroma due to the diminished ability of the mutant chloroplast to export fixed carbon, which is supported by the observed accumulation of starch and TAG in the mutant strain (Figs. 3, A to D, and S8A). While the pool sizes of fumarate and malate (metabolites of the TCA/glyoxylate cycle) were similar in both strains under LL, following the transition of the cells to ML, WT cells exhibited a significant increase in the pool sizes of those metabolites while the mutant maintained a lower level, indicating that the loss of CreTPT3 function either directly (by supplying precursors) or indirectly (metabolic rewiring) affects their levels.
Thus, a primary function for CreTPT3 appears to be the export of photosynthetically synthesized reduced carbon, which would drive metabolism in the cytoplasm and other cellular compartments, such as the mitochondrion, while enabling the import of Pi into the chloroplast, which sustains ATP biosynthesis.
The tpt3 mutant shows lower photosynthetic activity when grown in ML
To understand the influence of the loss of CreTPT3 activity on PET, we quantified photosynthetic activities following a transition from LL to ML (Supplemental Fig. S5). To this end, we measured photosynthetic O2 evolution rates (OERs) for WT, t3ko2, and C_T3KO2 over a range of light intensities. LL-acclimated cultures of WT, t3ko2, and C_T3KO2 showed comparable OERs at intensities below 200 μmol photons m−2 s−1, while at saturating light intensities of ≥600 μmol photons m−2 s−1, the OER of t3ko2 was diminished slightly relative to WT and the complemented strain (Fig. 4A). Upon acclimation of cells to ML for 24 h, the t3ko2 mutant consistently displayed lower OERs than WT or C_T3KO2 cells under all actinic light intensities used (Fig. 4A). Additionally, while the Fv/Fm in the mutant grown in LL was comparable with that of WT and C_T3KO2 (Fig. 4B), after exposure of the mutant cells to ML for 6 h, Fv/Fm declined to ∼50% of the WT and C_T3KO2 levels; the decline in the mutant continued over a period of 24 h in ML, with a 3-fold decrease in Fv/Fm for t3ko2 compared with that of WT cells (Fig. 4B). These results indicate that damage to photosystem II (PSII) reaction centers occurs following exposure of the mutant to ML.
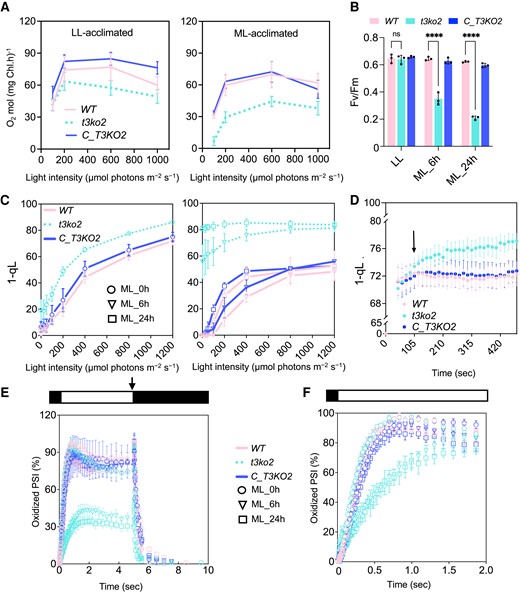
Photosynthetic activities following a transition from LL to ML or to HL. A) Light intensity curve of O2 evolution of LL- (left) or ML- (right) acclimated cells for the indicated strains. B)Fv/Fm of WT, t3ko2, and the complemented strain (C_T3KO2) following 0 (LL), 6, or 24 h in ML. C) 1-qL values of LL- (left panel) or ML- (right panel) acclimated cells exposed to increasing actinic light intensities. D) Kinetics of 1-qL of LL-acclimated cells after illumination at HL (400 to 450 μmol photons m−2 s−1) for the indicated times. E) P700 oxidation and reduction kinetics in LL-grown cells and after 6 or 24 h in ML. F) Kinetics of P700 oxidation upon dark-to-light transition. P700 measurements were performed in the presence of DCMU and hydroxylamine, as indicated in Materials and methods. Absorbance differences were monitored at 705 nm during continuous illumination with 150 μmol photons·m−2 s−1 for 5 s (white box above), followed by a saturating light pulse at 1,500 μmol photons·m−2 s−1 (arrow) and a 5-s dark incubation (black box). For panel E, the kinetics was normalized by setting maximum oxidation (after light pulse) of WT to 100% and for panel F, by setting maximum oxidation (after light pulse) of individual strain to 100%. The data from all panels represent the arithmetic mean (±Sd) of 3 independent experiments. For panel B, the asterisks represent significant differences determined by ANOVA tests. ****P < 0.0001.
To examine the redox state of the photosynthetic apparatus, we evaluated the pool of electron acceptors downstream of PSII. We quantified the photochemical efficiency (qL) of all strains at various light intensities after growth in LL or after a shift to ML for 6 or 24 h (Fig. 4C). The photosynthetic parameter qL indicates the redox state of QA, the primary electron acceptor of the PSII reaction center. Assuming that QA and QB are in equilibrium, qL reflects the redox status of the PQ pool; a lower qL value indicates a more reduced electron transport chain (Kramer et al. 2004). 1-qL positively correlates with the PQ pool redox state. In LL-acclimated cells, 1-qL was significantly higher in t3ko2 even at low levels of actinic illumination compared with that of WT cells and the complemented strain. For cells that had been acclimated to ML (6 and 24 h), 1-qL was 70% of the near maximum value for t3ko2, even under relatively low actinic light conditions (e.g. 100 μmol photons m−2 s−1), indicating a highly reduced PQ pool. In contrast, for WT and the complemented strain at the same light intensity, 1-qL attained only ∼20% of the maximum value (Fig. 4C). These results suggest that the PQ pool is much more reduced in LL-acclimated t3ko2 relative to WT and C_T3KO2 (Fig. 4C) and that there is a much more pronounced reduction of this pool at all actinic light intensities in ML-grown t3ko2 mutants. These results suggest a limitation in electron flow downstream of the PQ pool in both LL- and ML-grown t3ko2.
Moreover, we analyzed how fast PET became restricted following the transfer of LL-grown t3ko2, C_T3KO2, and WT cells to HL (400–450 µmol photons m−2 s−1) by monitoring changes in the redox state of the PQ pool. We observed that the PQ pool in t3ko2 begins to be more reduced than that of WT cells and C_T3KO2 after 105 s of elevated illumination (Fig. 4D), with an even more pronounced effect upon longer durations in HL. These results suggest that PET can be rapidly limited by diminished triose-P export from the chloroplast; the elimination of CreTPT3 has a strong influence on PET activity.
To determine if PSI was also affected in the mutant cells, we analyzed PSI/P700 oxidation/reduction kinetics following exposure of LL-grown cells to ML in the presence of 20 µM DCMU (N-(3,4-dichlorophenyl)-N-dimethylurea) and 1 mM hydroxylamine to block a contribution of electrons from PSII. Levels of photo-oxidizable P700 following exposure to actinic light for 5 s were similar in all LL-acclimated strains (Fig. 4E). However, the level of photo-oxidized P700 in ML-acclimated cells declined in the mutant to ∼40% to 50% of that in WT and C_T3KO2 cells (Fig. 4E), indicating that PSI is more reduced in the t3ko2 mutant after ML exposure. As shown in Fig. 4F, the oxidation rate of P700 following a dark-to-light transition was much slower in ML-acclimated t3ko2 compared with WT. These results suggest that the mutant has a diminished level of available electron acceptors on the acceptor side of PSI (relative to WT and C_T3KO2) after growth in ML.
CreTPT3 inactivation dramatically affects the accumulation and distribution of compartmentalized H2O2
To investigate the relationship of CreTPT3 activity to oxidative stress, we assayed ROS production in the mutant using the fluorescent probe CM-H2DCFDA, which upon exposure to increasing ROS levels is converted to the green fluorescent molecule dichlorofluorescein (DCF). We visualized DCF fluorescence by confocal microscopy. As shown in Fig. 5, A and B, ROS levels in the t3ko2 mutant markedly increased (∼3-fold) after 48 h in ML, while we detected little difference in ROS levels in WT cells.
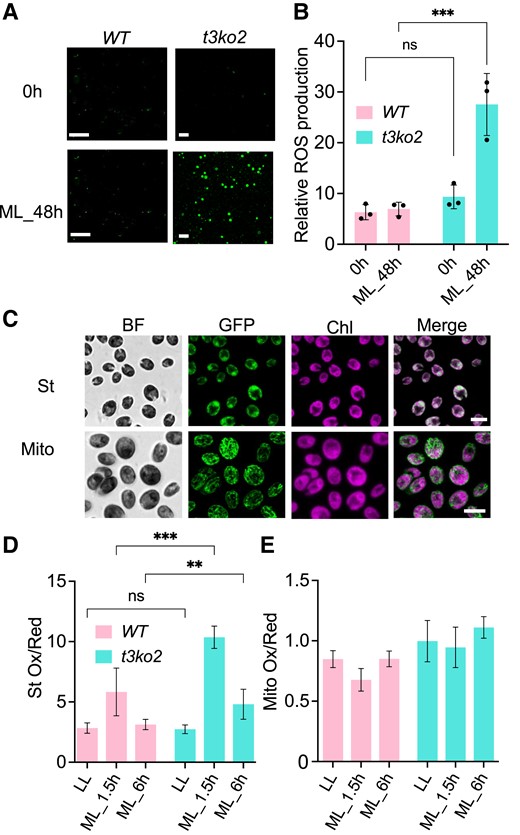
Measurement of intracellular ROS in t3ko2 and WT upon transition from LL to ML. A) ROS levels were evaluated by CM-H2DCFDA fluorescence of WT and the t3ko2 mutant in LL and following exposure to ML for 48 h. Scale bars, 20 μm. B) Quantitation of data in A). Shown are mean values from 3 independent experiments ± Sd. C) roGFP2 protein targeted to the chloroplast stroma (upper panel) or mitochondrion (lower panel). Scale bars: 10 μm; BF, bright field; GFP, roGFP2 fluorescence; Chl, chlorophyll autofluorescence. D to E) Monitoring redox levels in the stroma D) or mitochondrion E) after exposure of WT and the t3ko2 mutant for 1.5 or 6.0 h of ML. Shown are mean values from 3 independent experiments ± Sd; 3 to 4 random images were analyzed for each experiment. For panels B) and D), the asterisks represent significant differences determined by ANOVA tests. **P < 0.005 and ***P < 0.001.
For an alternative, dynamic method for evaluating redox changes in the chloroplast, we used the redox-sensitive green fluorescent protein roGFP2, which we targeted to the chloroplast stroma (Fig. 5C, upper panel) or mitochondrion (Fig. 5C, lower panel). roGFP2 monitors ratiometric redox changes of glutathione, which reflects cellular ROS levels (Vevea et al. 2013; Dorion et al. 2021). LL-acclimated WT cells and the t3ko2 mutant exhibited similar levels of chloroplast roGFP2 oxidation (Fig. 5D). Upon transfer of these cells to ML, the mutant showed an increase in chloroplast oxidative conditions, with a 5.0-fold increase after 1.5 h and a 2-fold increase after 6 h, which was 1.8- and 1.6-fold higher than the values measured in WT cells, respectively (Fig. 5D). Additionally, as triose-P is exported to the cytosol by CreTPT3, triose-P may potentially be further metabolized and donate redox equivalents to the mitochondrial electron transport chain and alter mitochondrial ROS production. Therefore, we also measured mitochondrial redox levels at different light intensities in WT and the t3ko2 mutant using the roGFP2 sensor targeted to the mitochondrion. Upon a LL-to-ML shift for 1.5 or 6.0 h, neither WT nor t3ko2 displayed a significant change in fluorescence for mitochondrion-targeted roGFP (Fig. 5E). These results suggest that the mitochondrial redox level is maintained after shifting either LL-acclimated WT or t3ko2 cells to ML. Overall, the inability to export triose-P through CreTPT3 markedly increased the level of oxidative stress in the chloroplast but not in the mitochondrion.
We also determined if the ROS accumulated in t3ko2 is H2O2 and whether this molecule shows differential accumulation in the different subcellular compartments. For this analysis, we employed a hypersensitive sensor of H2O2, roGFP2-Tsa2ΔCR, which was previously used for studies in Chlamydomonas (Niemeyer et al. 2021). In this analysis, we monitored real-time accumulation of H2O2 in the stroma, cytosol, mitochondrion, and nucleus (Fig. 6A) following a 20-min exposure of cells to either HL or very low light (Fig. 6, B to E). The stromal H2O2 level in t3ko2 increased within 2.5 min of light exposure and reached a 1.4-fold increase after 20 min of illumination with HL compared with the initial level in LL (Fig. 6B). Stromal H2O2 levels in WT cells showed little change after being shifted to HL; however, their levels declined when the cells were shifted to 10 μmol photons m−2 s−1, or very low light. Notably, after 20 min in HL, the stroma of the t3ko2 mutant accumulated ∼1.6-fold more H2O2 than that of the WT cells; t3ko2 mutant cells in very low light accumulated a similar amount of stromal H2O2 as WT cells after exposure to HL (Fig. 6B). The cytosolic probe also responded rapidly, with a 1.2-fold increase for WT and a 1.4-fold increase for the t3ko2 mutant (Fig. 6C); note that the initial levels of H2O2 prior to the transfer of the cells to HL or very low light were much lower in the WT cells than those in the mutant. The t3ko2 cytosolic H2O2 level was elevated relative to the level in WT cells by 2.1-fold after 20 min of illumination in HL (Fig. 6C). We did not observe a significant change in H2O2 levels in the mitochondrion for either the WT or the t3ko2 mutant after the cells were shifted to the higher light intensity (Fig. 6D). Finally, the t3ko2 mutant already accumulated much higher levels of H2O2 in the nucleus in LL compared with that in WT cells, although neither mutant nor WT cells showed significant changes in nuclear H2O2 levels after HL exposure (Fig. 6E).

Real-time monitoring of H2O2-compartmentalized distribution in t3ko2 and WT upon transition from LL to HL. A) The hypersensitive H2O2 sensor (roGFP2-Tsa2ΔCR) protein was targeted to the chloroplast stroma (St), cytosol (Cyto), mitochondrion (Mito), or nucleus (Nu). Shown are GFP fluorescence, chlorophyll autofluorescence (Chl), and the 2 signals merged; scale bars, 5 μm. B to D) WT and t3ko2 transformant cells, accumulating roGFP2-Tsa2ΔCR in the stroma B), cytosol C), mitochondrial matrix D), or nucleus E), were acclimated to LL in TP medium and then were transferred either to HL (450 μmol photons m−2 s−1, solid line) or to very LL (10 μmol photons m−2 s−1, dotted line) for 20 min. The oxidation state of the sensor was trapped by the addition of NEM, and roGFP2 fluorescence was measured in a plate reader as previously described (Niemeyer et al. 2021). Shown are mean values from 3 independent experiments ± Sd.
Discussion
CreTPT2 and CreTPT3 genes exhibit different expression patterns
In this study, we discovered that Chlamydomonas contains at least 2 TPTs that are located at the chloroplast envelope. An earlier report had suggested that CreTPT2 was a plastid PPT (for the transport of PEP) (Bockwoldt et al. 2019), but based on our results, it appears to be functionally more similar to a TPT. In vitro assays showed that CreTPT2 had almost the same substrate specificity as CreTPT3, although it may be less effective in DHAP/Pi exchange (Fig. 1, C to E). To determine the expression patterns of CreTPT2 and CreTPT3, we analyzed the abundance of CreTPT2 and CreTPT3 transcripts using RT-qPCR and by mining published transcriptome deep sequencing (RNA-seq) data sets over the diurnal cycle and during nitrogen, sulfur, or iron limitation (González-Ballester et al. 2010; Urzica et al. 2013; Ngan et al. 2015; Zones et al. 2015) (Supplemental Figs. S1, C and D, and S9). CreTPT3 was highly expressed in the light and darkness, with significantly higher transcript accumulation relative to CreTPT2 and the other genes (CreTPT10 and CGL51) potentially encoding chloroplast-localized pPTs (Supplemental Fig. S1, C and D). CreTPT2 and CreTPT3 also responded differentially to abiotic stresses. CreTPT3 was strongly induced by individual nitrogen, sulfur, and iron limitation and upon exposure to HL, whereas the level of CreTPT2 transcripts remained almost unchanged under the same conditions (Supplemental Fig. S9, A to D), suggesting that CreTPT3 plays a more prominent role in exporting triose-P from the chloroplast than CreTPT2, with potentially increasing export from the plastid under HL and nutrient limitation conditions. This hypothesis is supported by the observation that tpt3 mutants displayed much more severe growth retardation relative to tpt2 mutants upon exposure to ML or HL (Fig. 2C). There is no evidence showing that the TPTs from plants are induced by stress/excess absorbed excitation, and the expression of the Arabidopsis TPT gene appears to even decrease following HL exposure (Weise et al. 2019).
CreTPT2 and CreTPT3 exhibited distinct expression patterns over the diurnal cycle; the expression of CreTPT2 increased rapidly after the dark-to-light transition, with peak accumulation after 1 h in the light, when the transcript level of CreTPT3 was at its lowest (Supplemental Fig. S1D). Continued exposure to light led to a decrease in the level of CreTPT2 transcripts to near zero, while CreTPT3 transcripts increased steadily in the light, reaching a peak in mid-day (Supplemental Fig. S1D). The CreTPT2 expression pattern suggests that it might play a role in exporting triose-P at the beginning of the light period, when light intensity and photosynthesis are low and low levels of triose-P would be synthesized in the stroma. As the light intensity increases over the course of the day, higher levels of triose-P are synthesized; its traffic out of the chloroplast for use in other subcellular compartments would likely predominantly involve the activity of CreTPT3. The greater specificity of CreTPT3 than CreTPT2 for transporting DHAP (Fig. 1E) may make it more effective than CreTPT2 in transporting C3-phosphorylated compounds. This possibility is congruent with the finding that there is elevated synthesis/accumulation of CreTPT3 mRNA during the day when light intensity reaches its peak (Zones et al. 2015) and there would be rapid biosynthesis of C3-phosphorylated compounds. Overall, the subfunctionalization of the 2 Chlamydomonas TPTs based on the expression levels, patterns of RNA accumulation over the course of the day and upon nutrient deprivation of their encoding genes, and their substrate specificities may help tune the export of triose-P from the chloroplast with respect to the diurnal cycle and dynamic environmental cues.
CreTPT3 also potentially serves as a redox valve, transferring reductant to the cytoplasm
It was previously proposed that chloroplast TPTs can catalyze 2 potential reactions in the light (Fig. 7) based on the crystal structure of a red algal (Galdieria sulphuraria) TPT (Lee et al. 2017) and in vitro assays using isolated spinach (Spinacia oleracea) chloroplasts (Stocking and Larson 1969); both triose-P/Pi and triose-P/3-PGA exchange across the chloroplast inner envelope membrane. The former reaction can route both carbon skeletons and reductants into the cytoplasm while importing Pi back into the chloroplast for ATP regeneration. The latter reaction would import 3-PGA into the chloroplast in exchange for triose-P (DHAP, GAP), which would serve to transfer reductant from the chloroplast to the cytosol while transferring 3-PGA back into the chloroplast where it can be reduced by the CBB cycle and stimulate the regeneration of ribulose 1,5-bisphosphate. Indeed, in vitro, CreTPT3 can actively transport both triose-P and 3-PGA in exchange for Pi (Fig. 1), indicating that this transporter can potentially serve as both a carbon and “reductant shuttle” which would help sustain photosynthetic electron flow.
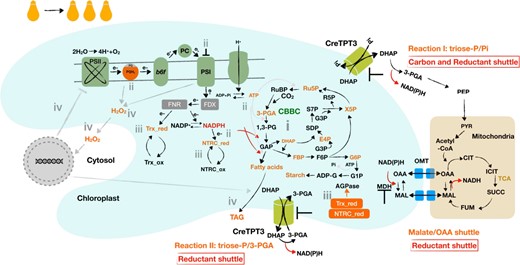
Effect of eliminating Chlamydomonas TPT3 on the chloroplast metabolic landscape. i, reduced triose-P export leads to the accumulation of the sugar-P in the CBB cycle and glycolysis pathway (e.g. triose-P, hexose-P, and marked in orange), and an elevated ratio of 3-PGA/Pi (which can allosterically activate AGPase activity) begins to stimulate the biosynthesis and accumulation of storage carbon; ii, CBB cycle activity diminishes as a consequence of the hyperaccumulation of the precursors with the fixation of CO2, leading to elevation of reductant (NADPH) and energy (ATP) within the chloroplast; the elevated NADPH:NADP+ and ATP:ADP ratios elicit strong feedback on PET, causing hyperreduction of electron carriers (e.g. overreduced PQ pool and highly reduced PSI) that slows electron flow across the cytochrome b6f complex; iii, the highly reduced PET system and elevated NADPH can actively reduce FDX/TRX and the NTRC systems, respectively; reduced TRX and/or NTRC can activate AGPase (above the activity elicited by an increase in the 3-PGA/Pi ratio), leading to additional starch accumulation; iv, hyperreduction of PET can also lead to stromal ROS accumulation that can act as a signal that controls the expression of chloroplast and nuclear genes; ROS also cause damage to both PSII and I and lead to neutral lipid accumulation as a consequence of activation of diacylglycerol acyltransferases (DGATs) and phospholipid diacylglycerol acyltransferase (PDAT). Many of these metabolic/acclimatory steps both overlap and are interconnected. Under conditions of extended exposure to ML, the damage in Chlamydomonas tpt3 mutants can accumulate and lead to cell death; cell death occurs rapidly in HL.
Studies of photosynthetic activities and growth of WT and tpt3 mutants (e.g. t3ko2) in LL, ML, and HL support the idea that the mutant is highly compromised in its ability to export fixed carbon and potentially also reductant from the chloroplast. In t3ko2 exposed to LL (after growth in LL), growth was slow (Fig. 2E) and the PQ pool (Fig. 4C) was more reduced than in WT cells, while there was little loss of PSII or PSI activities (Fig. 4, A, B, E, F). These results suggest that there is a reduced rate of PQH2 oxidation. During ML exposure, the mutant stopped growing and experienced severe bleaching when placed in HL (Fig. 2F). The highly reduced PQ pool and PSI reaction center in ML-acclimated t3ko2 cells (Fig. 4, C and E, respectively) reflect hyperreduction of PET and the generation of “overflow” electrons. The phenotypes of t3ko2 cells, including an elevated 1-qL (Fig. 4, C and D), slower oxidation rate of PSI in ML-acclimated cells (Fig. 4F), accumulation of storage carbon (Fig. 3, A to D), an increase in intracellular accumulation of triose-P and 3-PGA (Fig. 3E), light-dependent damage to the photosynthetic apparatus (Fig. 4B), and elevated production/accumulation of ROS (Fig. 5, A and B), especially in the chloroplast (Fig. 6B), indicate a block on the acceptor side of PSI, which reflects the function of CreTPT3 and its central role in fixed carbon export from the chloroplast and for fueling central metabolism. Furthermore, the inability to efficiently transport fixed carbon from the chloroplast in ML and HL would result in diminished CBB cycle activity, diminished photosynthetic electron transport, and hyperreduction of the stroma, which would also result in diminished ATP biosynthesis and NADPH production.
The malate-OAA shuttle represents another route that, under high redox stress, might partially compensate for the loss of CreTPT3 by transporting reductant from the chloroplast (schematic in Fig. 7). Intriguingly, malate levels in t3ko2 were 4-fold lower than in WT cells (Fig. 3, E and G). Moreover, the expression of the genes (CreMDH1 and CreMDH5) encoding the plastid-localized MDH was 3-fold to 5-fold lower in the mutant than in WT cells following a transition from LL to ML (Supplemental Fig. S10, D and E), indicating that the malate-OAA shuttle is likely unable to compensate for a loss of CreTPT3. Inactivation of CreTPT3 appears to have a negative effect on the malate-OAA shuttle, potentially because of the compromised physiological state of the t3ko2 mutant. Furthermore, a previous study of metabolic flux analysis during heterotrophic growth of Chlamydomonas showed that the CreTPT shuttle(s) is almost 10-fold more active than the malate-OAA shuttle (Boyle et al. 2017).
TPT deficiency in Chlamydomonas cannot be compensated for by a day/night regime
TPT deficiency in plants can be almost fully compensated for by the starch-mediated night pathways that elicit the breakdown of starch and the export of the breakdown products via the maltose transporter (MEX1) and glucose translocator (GlcT) (Niittylä et al. 2004; Cho et al. 2011). Furthermore, in plants, starch turnover may also be occurring in the light, at the same time as starch is being synthesized (Häusler et al. 1998; Walters et al. 2004). Compared with algae, plant cells appear to display a high plasticity in their capacity to transport fixed carbon between the chloroplast and cytosol. This high degree of plasticity in plants is reflected by the following findings: (i) most dicots contain a larger number of pPTs (from 5 to 16) (Bockwoldt et al. 2019). For example, Arabidopsis contains 6 pPTs, consisting of 1 TPT, 2 GPTs, 2 PPTs, and 1 XPT (Bockwoldt et al. 2019), whereas Chlamydomonas harbors 4 pPTs, with 2 TPTs, 1 putative PPT (TPT10 in this study), and 1 putative GPT/XPT (CGL51 in this study); (ii) plant TPTs play an important role in the export of carbon from the chloroplast during the day. However, XPT has been shown to transport triose-Ps and partially compensate for the loss of TPTs under both ML and HL conditions (Eicks et al. 2002; Hilgers et al. 2018b). Hence, it appears that the paths for fixed carbon export in plants are cooperative, with contributions of transporters that use various sugars, sugar phosphates, and triose phosphates.
Additionally, the elevated starch content in the t3ko2 mutant during growth in both LL and ML compared with WT cells suggests that the loss of CreTPT3 function creates a bottleneck in the export of fixed carbon, which in part becomes stored as starch and lipids (Figs. 3, A to D, and S8A). The conversion of triose-P to starch releases Pi within the chloroplast that can at least partially compensate for the shortage of Pi caused by inactivation of CreTPT3 (Börnke and Sonnewald 2011). Thus, photosynthetic carbon assimilation can be maintained until the cellular system is completely compromised. In this study, we found that Chlamydomonas tpt3 mutants exhibited severe growth retardation and the accumulation of starch and lipid in either continuous light (CL) or when experiencing a day/night regime (Figs. 2, D to G, and 8A). Furthermore, the light-induced electron transport rate (ETR) through PSII in the t3ko2 mutant maintained on a diurnal cycle was similar to that of WT cells exposed to actinic light intensities of up to 200 μmol photons m−2 s−1 but was ∼30% lower than that of WT cells at a light intensity of 400 μmol photons m−2 s−1 (Fig. 8B). We also observed that diurnally maintained t3ko2 cells grew slightly better than when the cells were maintained in CL (Fig. 8A), indicating that the loss of CreTPT3 activity might be partially compensated for by starch turnover during the night (or allow for some repair of cellular damage that might accumulate during the day), but to a lesser extent than in plants. We observed night-time starch degradation in tpt3 cells, although immediately following the night period a higher level (∼5-fold) of undegraded starch remained relative to that of WT cultures (Fig. 8C). These data suggest that starch mobilization may partially compensate for a CreTPT3 deficiency in Chlamydomonas.
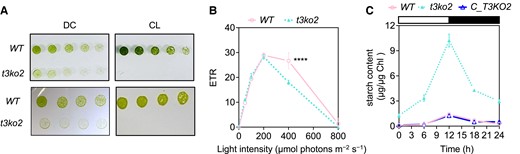
Effects of deletion of CreTPT3 over the diurnal cycle. A) Growth of WT and t3ko2 strains on TP medium agar plates for 4 d under either diurnal cycle (DC) (left panel; 12-h light/12-h dark) or continuous light (CL) (right panel) at an intensity of 60 μmol photon m−2 s−1 (upper panel) or HL (lower panel: 450 μmol photon m−2 s−1). The dilution series are 3, 1.5, 0.75, and 0.375 μg mL−1 chlorophyll equivalent. B) Photosynthetic electron transport rate (ETR) of cells grown under a diurnal rhythm with the light period at an intensity of 60 μmol photon m−2 s−1. C) Accumulation of starch during growth under a diurnal rhythm at a light intensity of 60 μmol photon m−2 s−1.
The mechanism by which starch breakdown products are exported from the chloroplast during the night in Chlamydomonas remains largely unknown, although it may involve various transporters including MALTOSE EXCESS 1 (MEX1) (like in plants). Chlamydomonas MEX1 can transport starch breakdown products in the form of glucose and/or glucose phosphate, but there is no evidence suggesting that it can export maltose, since a mex1 mutant did not accumulate maltose or exhibit growth impairment (Findinier et al. 2017). We speculate that the loss of TPT3 function might be partially compensated for by starch turnover in the dark, with degradation products exported via MEX1 or other pPTs whose encoding genes are highly expressed in the dark and downregulated in the light, such as CreTPT10 and CGL51 (Supplemental Fig. S1D). However, even if hexose-P is exported from the chloroplast, it may not be readily converted to triose-P (see below), which would fuel the TCA cycle and respiration and serve to support anabolism.
t3ko2 experiences oxidative stress
In plants, the export of sugars and other molecules (e.g. redox equivalents and ROS) can serve as signals that coordinate chloroplast and nuclear gene expression during acclimation to HL (Häusler et al. 2014; Zirngibl et al. 2023). We probed the effect of impaired triose-P export in t3ko2 on ROS production and accumulation in various subcellular compartments following exposure of cells to ML or HL. In plant cells, H2O2 is produced as a side product of cellular metabolism including PET, mitochondrial respiration, and substrate level oxidation (Foyer and Noctor 2016; Smirnoff and Arnaud 2019). While ROS stability is generally low, they can accumulate in cells experiencing oxidative stress, with H2O2 being the most prevalent species that can function as a redox messenger (Li and Kim 2022). Moreover, the trafficking of H2O2 into or out of different cellular compartments can trigger activation of other retrograde and anterograde signals that may coordinate activities among the compartments, including the nucleus (Shapiguzov et al. 2012; Exposito-Rodriguez et al. 2017; Mittler et al. 2022). Upon exposure to HL, the t3ko2 mutant accumulated more stromal H2O2 than WT cells. Cytosolic H2O2 levels in the mutant exhibited a similar increase, which may reflect the ability of this metabolite to rapidly diffuse from the chloroplast and into the cytoplasm (Fig. 6, B and C). Furthermore, it is unlikely that the mitochondrion contributes to an increase in H2O2 in t3ko2 since we observed no (or little) increase in the accumulation of intramitochondrial H2O2 in the mutant in either LL or ML (Fig. 6D). We also observed an increase in H2O2 accumulation in the nucleus of t3ko2 relative to WT cells, although light intensity (HL or LL) did not alter these levels in either WT or the mutant (Fig. 6E); a previous report showed that nuclear H2O2 level was not significantly affected in WT Chlamydomonas cells following exposure to HL (Niemeyer et al. 2021), which may reflect both the level of H2O2 accumulation and barriers that limit its diffusion. The higher levels of H2O2 in the nucleus of t3ko2 cells may trigger retrograde signals that modulate nuclear gene expression, which in turn could ameliorate some of the negative effects of ROS and elicit repair of any damage experienced by the photosynthetic apparatus. A similar response may be elicited in WT cells at higher intensities of actinic light.
Superoxide is predominantly produced by PSI, which can enzymatically be converted into H2O2 (Foyer 2018). Highly reduced PSI in the tpt3 mutant can lead to an increase in the production of H2O2. It was also shown that H2O2 can be synthesized in thylakoid membranes as a consequence of the oxidation of plastoquinol (PQH2), suggesting a positive correlation between the redox state of the PQ pool and the generation of H2O2 (Khorobrykh et al. 2015). A similar finding was noted for both Nicotiana benthamiana and Chlamydomonas based on the use of hypersensitive H2O2 sensors (Exposito-Rodriguez et al. 2017; Niemeyer et al. 2021). These 2 organisms were shown to accumulate more stromal H2O2 in HL, which was dependent on photosynthesis. We observed this positive correlation between PQ pool reduction and the accumulation of H2O2 in the t3ko2 mutant; the PQ pool was more reduced in t3ko2 relative to WT cells after exposing the cells to 105 s of HL (Fig. 4D). In parallel, there was a marked increase in stromal H2O2 following 2.5 min of HL (Fig. 6B). Therefore, hyperreduction of the PQ pool in the mutant likely results in elevated stromal H2O2 accumulation, suggesting that CreTPT3 activity and the export of triose-P from the chloroplast are critical for maintaining low-level synthesis/accumulation of H2O2 and sustaining a high rate of PET in HL; the export of fixed carbon relieves the redox pressure and lessens ROS formation. Additionally, CreTPT3 is the most nutrient-deprivation responsive/upregulated of the pPT family genes; its expression responds strongly to nitrogen, sulfur, and iron limitations (Supplemental Fig. S9, B to D). These findings are in accord with the hypothesis that the ability to traffic fixed carbon from the chloroplast is important for both distributing carbon to other cellular compartments and relieving oxidative stress in the organelle.
CreTPT3 is critical for maintaining intracellular partitioning of fixed carbon
Why is the phenotype of the Chlamydomonas tpt3 mutant so severe? Land plants contain the entire glycolytic pathway in both the chloroplast and cytosol, while the pathway is partitioned between the 2 compartments in Chlamydomonas; 90% of the upper activities of the pathways (from F6P→3PG) are associated with the plastid, while over 95% of the activities of the lower part of the pathway (3PG→Pyruvate) occur in the cytosol (Klein 1986; Rochaix et al. 1998). The oxidative pentose phosphate pathway also appears to be in the chloroplast (Klein 1986). The partitioning of glycolysis between the chloroplast and cytosol is supported by the comparative quantification of metabolites, with glucose-1-P, fructose-6-P, and fructose-1,6-P2 being exclusively in the chloroplast and 2-phosphoglycerate only in the cytosol (Klöck and Kreuzberg 1991). It was recently suggested that the flux of metabolites through hexose-P is negligible in the Chlamydomonas cytosol (Treves et al. 2022), possibly because of the absence of glycolytic reactions that would facilitate its metabolism. Therefore, even if hexose-P is exported from the chloroplast, it would likely not be rapidly metabolized or maintain rapid cell growth. Overall, the results strongly suggest that triose-P exported from the Chlamydomonas chloroplast is likely the major source of fixed carbon transported into the cytoplasm of the cell, facilitating algal growth in the light.
Thus, we hypothesize that the export of triose-P would drive the cytosolic segment of glycolysis and downstream metabolic pathways. This hypothesis is supported by the metabolite analysis: specifically, there is a marked increase of most metabolites associated with the upper-glycolytic/gluconeogenic pathways and a significant decrease of some metabolites of the TCA cycle upon exposure of the mutant cells to either LL or ML (Figs. 3, E to G, and S8, B and C). In contrast, the elimination of the chloroplast-targeted TPT1 protein of Arabidopsis showed no significant phenotype, although growth was retarded in the tpt xpt double mutants (Hilgers et al. 2018a). Furthermore, based on Pearson's coefficient correlation analyses presented in Supplemental Fig. S11 and Table S4, CreTPT3 is coexpressed with many genes involved in respiratory electron transport and with the genes encoding major ATP transporters located at the mitochondrion and chloroplast envelope membranes. In addition, transcript levels of some genes involved in starch degradation, glycolysis, the TCA cycle, and the malate-OAA shuttle shared a high Pearson's correlation coefficient (PCC) with CreTPT3. Together, these data indicate that the export of triose-P from the chloroplast is closely linked to central energy metabolism in Chlamydomonas, starting with the production of triose-P in the chloroplast by the CBB cycle or starch degradation (chloroplast-localized reactions of glycolysis), followed by transport to the cytosol that houses the remaining reactions of glycolysis. The products of glycolysis can be trafficked to the mitochondrion where they can be used to drive the TCA cycle, respiratory metabolism, and the generation of ATPs (Supplemental Fig. S11). Hence, triose-P is the major photoassimilate routed from the chloroplast, supplying substrates for downstream metabolic reactions.
Based on our analyses, we propose that various tiers of regulation are responsible for the physiological responses of the Chlamydomonas t3ko2 mutant, which is illustrated in Fig. 7. When t3ko2 cells are transferred from LL to ML, the triose-P pool and metabolites derived from that pool accumulate because of the lower capacity of the strain to move triose-P out of the chloroplast where it could be further metabolized. Some compensation may occur through the activity of other transporters, although the expression of CreTPT2 is especially low during the day (in the light) and the transport of hexose phosphate may not compensate for the loss of CreTPT3 function because the cytoplasm does not have (or has little of) the activities of glycolysis that would convert hexose-P to DHAP. The compromised ability to export fixed carbon from the chloroplast also suppresses CBB cycle activity and causes hyperreduction of PET and the accumulation of ROS (which would inhibit photosynthetic activity). The highly diminished export of triose-P to the cytoplasm would compromise respiration and downstream biosynthetic reactions. Furthermore, hyperreduction of PET and accumulation of carbon metabolites in the stroma would activate AGPase through allosteric regulation and by the ferredoxin/thioredoxin (FDX/TRX) and NADPH-dependent thioredoxin reductase C (NTRC) redox systems, which would result in starch hyperaccumulation (Ballicora et al. 2000; Lepistö et al. 2013) (Fig. 7). Increased ROS accumulation in the mutant chloroplast and an elevated PET redox state would also elicit the generation of retrograde signals that mediate changes in nuclear gene expression (Shapiguzov et al. 2012; Suzuki et al. 2012; Wakao and Niyogi 2021), stimulating the biosynthesis of specific activities that may function to ameliorate the effect of the hyperreduced state attained in the chloroplast.
Materials and methods
Strains and culture conditions
The WT Chlamydomonas (C. reinhardtii) strain M10 (CC-4403, isogenic line derived from CC-124) was used as the parental strain for the generation of knockout mutants. Algal cultures were routinely cultivated in growth chambers (LED-41L2, Percival Scientific Inc.) at 25 °C with continuous shaking on an orbital shaker (VWR OS-500 Shaker) at 120 rpm, in Tris-acetate phosphate (TAP) medium (Harris 2009). Cultures were illuminated with continuous cool white LEDs (LED-41L2, Percival Scientific Inc.) at low light (LL, 30 μmol photons m−2 s−1). Experiments were mostly performed with cells grown in photoautotrophic Tris phosphate (TP) medium; in some cases, cultures were grown in TAP medium, at 25 °C, and bubbled with air and shaking at 120 rpm in a growth chamber (LED-41L2, Percival Scientific Inc.). For growth assays, cultures were inoculated to a starting cell density of 0.02 at OD750 nm (∼1 × 10⁵ cells mL−1) in TP bubbled with air under either LL or moderate light (ML, 250 to 300 μmol photons m−2 s−1) intensities. For spectrophotometric and chlorophyll fluorescence analyses, the experimental design is described in Supplemental Fig. S5. Growth assays on solid medium were performed with cultures spotted onto medium at different dilutions (as indicated in the text) and exposed to different light intensities; spot tests for photoautotrophic growth were on TP agar plates or on TAP agar plates for mixotrophic growth. Agar plates were incubated for 7 d under either LL or ML (cool white LED) at 25 °C.
Production of CreTPT2 and CreTPT3 in yeast
The DNA sequence encoding mature CreTPT2 or CreTPT3 was codon optimized for the expression in budding yeast (S. cerevisiae) (GeneART, Thermo Fisher Scientific). This coding sequence was inserted in-frame downstream of a sequence encoding a His-tag into the yeast vector pYES-NTa (Thermo Fisher Scientific) using Gibson cloning (NEB). Briefly, pYES-NTa was linearized with BamHI and the CreTPT2 and TPT3 cDNA amplified with the primer pairs listed in Supplemental Table S2. Each cDNA was ligated into the linearized pYES-NTa vector, which was then transformed into the yeast strain INVSc1 (MATa, his3D1, leu2, trp1-289, ura3-52/MATa, his3D1, leu2, trp1-289, and ura3-52, Thermo Fisher Scientific) using the lithium-acetate/polyethylene glycol (PEG) method (Gietz and Schiestl 2007). Transformed yeast cells were selected on synthetic complete medium containing 2% (w/v) glucose with the uracil auxotrophic marker. Galactose-inducible production of His-CreTPT2 or CreTPT3 in yeast was performed as described in Linka et al. (2008). The presence of the His-tagged fusion protein was verified by standard SDS-PAGE and immunoblot analysis using an anti-His-antibody conjugated with horseradish peroxidase (Miltenyi Biotech).
Reconstitution into liposomes and transport assays
For uptake studies, yeast membranes from cells with and without (only empty vector) recombinant His-tagged CreTPT2 or CreTPT3 were enriched and reconstituted into 3% (w/v) L-alpha-phosphatidylcholine using a freeze–thaw–sonication procedure (Linka et al. 2008). The reconstituted liposomes were preloaded with 30 mM Pi or phosphorylated metabolites to be tested as potential transport substrates. As a negative control for antiporter activity, liposomes were also generated without metabolite preloading. The external counter-exchange substrate was removed via gel filtration on Sephadex G-25 M columns (GE Healthcare). Transport assays were initiated by adding 0.25 mM [alpha-32P]-phosphoric acid (6,000 Ci mmol−1) to the medium bathing the liposomes and performed as previously described by Linka et al. (2008).
Transport activity assays
The KM for Pi was determined by measuring the initial velocity at each of 6 external Pi concentrations between 0.05 and 5 mM. To obtain competitive inhibition constants (KI), the uptake of 0.25 mM Pi into liposomes containing 30 mM Pi was measured over a 4-min period in the presence of increasing external competitor concentrations (0.05 to 5 mM). Three biological replicates were performed for all described experiments. GraphPad Prism software version 9.3.0 was used for nonlinear regression analyses of the kinetic data.
Vector construction, transformation, and subcellular localization
The pRam118_VENUS plasmid, which harbors the VENUS gene and the AphVII cassette (conferring resistance to hygromycin) (Kaye et al. 2019), was used to individually express CreTPT2 (Cre06.g263850_4532) and CreTPT3 (Cre01.g045550_4532). The plasmid pRam118_VENUS was linearized with HpaI (NEB). Primers gTPT2_pRam118_f, gTPT2_pRam118_r, and gTPT3_pRam118_f, gTPT3_pRam118_r (Supplemental Table S1) were used to amplify CreTPT2 and CreTPT3 genomic DNA fragments containing an overlap with the linearized pRam118_VENUS vector. For generating the plasmids pRam118-CreTPT2&VENUS and pRam118-CreTPT3&VENUS, genomic DNA of CreTPT2 or CreTPT3 was assembled with pRam118_VENUS plasmid using Gibson assembly (Gibson et al. 2009). The plasmid pRam118-CreTPT2&VENUS (2 to 4 μg), linearized with AseI (NEB), was transferred into the Chlamydomonas M10 strain by electroporation.
A 1,000-bp sequence upstream of CreTPT3 and containing the promoter region of the gene was amplified using the primers TPT3pro1000_f and TPT3pro1000_r (Supplemental Table S2). The 3′ UTR of CreTPT3 was amplified using TPT3_3UTR_f and TPT3_3UTR_r (Supplemental Table S2). The PSAD promoter and the RBCS2 3′ UTR of pRam118-CreTPT3&VENUS were replaced by the amplified fragments of the 1,000-bp upstream region and the 3′ UTR of CreTPT3, respectively. This final vector, designated pRam118_CreTPT3, contains the original CreTPT3 promoter (driving the expression of CreTPT3), the genomic DNA sequence of CreTPT3, VENUS, and the CreTPT3 3′ UTR plus the AphVII cassette. To localize CreTPT3 and complement the tpt3 mutant, the mutant was transformed by electroporation with a total amount of 2 to 4 μg (∼500 ng µL−1) of pRam118_CreTPT3 that was linearized with AseI.
For each transformation, 2 to 4 μg of the engineered plasmid was linearized and added to 250 µL of a cell suspension at ∼3 × 10⁸ cells mL−1. GeneArt MAX Efficiency Transformation Reagent for algae (Invitrogen) was used for introducing the plasmid into algal cells by electroporation according to the instructions provided by the manufacturer. Transformants were selected on solid TAP medium containing 10 μg mL−1 hygromycin (Enzo Life).
Drug-resistant transformants were visualized for VENUS fluorescence as previously described (Kaye et al. 2019). In brief, transgenic strains resistant to hygromycin were screened for VENUS fluorescence using a microplate reader (Infinite M1000; TECAN). Excitation and emission settings were as follows: VENUS, excitation at 515 nm, bandwidth 12 nm, and emission at 550 nm, bandwidth 12 nm; chlorophyll excitation was at 440 nm, bandwidth 9 nm, and emission was at 680 nm, bandwidth 20 nm. A TCS SP8 confocal laser-scanning microscope (Leica) was used to visualize the VENUS fluorescence signal (Kaye et al. 2019).
CRISPR/Cas9-mediated mutagenesis
The Chlamydomonas WT strain M10 (CC-4403, isogenic line derived from CC-124) was used for mutant generation. WT cells were cultured under continuous normal light (NL, 50 μmol photons m−2 s−1) for 2 d to a density of 3 to 5 × 10⁶ cells mL−1. The cells were then concentrated to 2 × 10⁸ cells mL−1 in 0.5 × TAP medium supplemented with 80 mM sucrose. Two single-guide RNAs (sgRNAs) were designed by CHOPCHOP (https://chopchop.cbu.uib.no/) and synthesized by Integrated DNA Technologies (IDT). The sequences of the generated sgRNAs are as follows: TPT2-sg (5′-AUAAGGGCAAGGACAUGUCAGGG-3) for editing exon 8, TPT3-sg1 (5′-CGCUGGGCGTCACUUCCCGGCGG-3′) for editing exon 1, and TPT3-sg2 (5′-AAGGCCGCUAUCGCCAACGUGGG-3′) for editing of exon 7. The protocol for disruption of CreTPT2 and CreTPT3 was adapted from Findinier et al. (2019). Prior to electroporation, Cas9 (IDT) and sgRNAs were incubated together at 37 °C for 30 min. Approximately 500 ng PCR product of the AphVII cassette, which confers resistance to hygromycin, was added to the RNP (ribonucleoprotein) mixture. A 250-μL aliquot was electroporated using a Super Electroporator NEPA21 type II (NEPA GENE). After 16 h of recovery in TAP medium supplemented with 40 mM sucrose, under very low light (10 to 15 μmol photons m−2 s−1), cells were plated onto solid TAP medium containing 10 μg mL−1 hygromycin. Sense or antisense-oriented knockins of AphVII were determined by amplification using primer pairs with 1 primer annealing to the genomic sequence and the other to the inserted sequence (Supplemental Table S2). The amplified fragments were sequenced to verify the insertion sites (ELIM BIOPHARM, Hayward, USA).
Complementation of tpt3 mutants
Mutant strains were transformed with the linearized pRam118_CreTPT3 plasmid. Transformed cells were selected in ML and screened for VENUS fluorescence. Colonies exhibiting VENUS fluorescence and an AphVII cassette knocked in at the Cas9 target site were examined for the accumulation of the CreTPT3 protein by immunodetection using anti-CreTPT3 antibodies generated by GenScript USA Inc. (Piscataway, USA). Immunopositive colonies were subjected to growth assays using spot tests under ML on either solid TAP or TP medium.
P700 activity measurements
Absorbance spectroscopy [JTS-100 spectrophotometer (SpectroLogiX, TN)] was performed to measure P700 activity with dark-adapted liquid cultures [equivalent to 15 μg mL−1 chlorophyll, in 20 mM HEPES-KOH, pH 7.2, and 10% (w/v) Ficoll] as previously described (Clowez et al. 2021). Actinic light was provided by an orange LED (165 μmol photons m−2 s−1) for PSI oxidation, followed by a saturating pulse and dark incubation. Twenty micromolar DCMU and 1 mM hydroxylamine were added to the cell suspension to inhibit linear electron flow (LEF) prior to the measurement. P700 activity was measured by monitoring the absorbance at 705 nm [a 6-nm FWHM (full width at half maximum) interference filter was used to create a narrow excitation beam]; the absorbance at 740 nm was used to correct for unspecific contribution to the 705-nm signal.
Chlorophyll fluorescence analysis
Chlorophyll fluorescence of cells in a liquid culture was used to evaluate photosynthetic electron transport monitored with a DUAL PAM-100 fluorometer. Cells were acclimated in the dark for 20 min prior to illumination at increasing light intensities (0, 10, 50, 100, 200, 400, 800, 1,000, and 1,200 μmol photons m−2 s−1) for 2 min at each intensity or at a constant intensity of 450 μmol photons m−2 s−1 for 10 min to evaluate 1-qL. A volume of 8 µL of 0.5 M NaHCO3 (2 mM) was added to the 2-mL reaction mix as an electron acceptor for the CBBC.
ROS measurements and roGFP2 imaging analysis
All strains were grown photoautotrophically in LL for 16 to 24 h. After dilution in fresh medium, the cultures were transferred to ML and stained with CM-H2DCFDA (Thermo Fisher Scientific) as described in Kong et al. (2018) for detecting ROS. Briefly, after various treatments (e.g. 48 h in ML), 1 × 10⁷Chlamydomonas cells were pelleted (1,459 × g, 3 min, at room temperature) and washed once with 1× phosphate-buffered saline (PBS). The cells were then resuspended in 1× PBS containing 8 μM CM-H2DCFDA and incubated at room temperature in the dark for 30 min. Following this incubation, the cells were washed 3 times with 1× PBS buffer. The fluorescent signals were either visualized using a TCS SP8 confocal laser-scanning microscope (Leica) or quantified with a microplate reader (Infinite M1000; TECAN). Excitation and emission settings for the microscope were as follows: 488 nm/510 to 530 nm HyD SMD hybrid detector for ROS and 488 nm/650 to 700 nm HyD SMD hybrid detector for chlorophyll autofluorescence. Excitation and emission settings for the plate reader were as follows: ROS excitation 488/5 nm and emission 530/12 nm and chlorophyll excitation 514/5 nm and emission 690/5 nm.
Constructs encoding chloroplast or mitochondrion targeting sequences (Crozet et al. 2018) fused to codon-optimized roGFP2 (Vevea et al. 2013) were transformed into WT and mutant strains. Transgenic colonies were screened for green roGFP2 fluorescence using a microplate reader (Infinite M1000; TECAN); excitation was at 488 nm, bandwidth 9 nm, and emission at 525 nm, bandwidth 10 nm. Cells with strong green fluorescence were cultured as depicted in Supplemental Fig. S5. Signals from the transformed strains were visualized using a TCS SP8 confocal laser-scanning microscope (Leica). roGFP2 signals were collected and analyzed as previously described (Vevea et al. 2013). Using the sequential setup of the SP8, roGFP2 signals were collected at the emission wavelength of 510 to 550 nm immediately following excitation at 405 and 488 nm (Vevea et al. 2013). The degree of roGFP2 oxidation was analyzed as the ratio of the emission signals after excitation at 405 and 488 nm (Vevea et al. 2013).
Plasmids encoding the H2O2 roGFP2-Tsa2ΔCR sensors (Niemeyer et al. 2021) were obtained from the Chlamydomonas Resource Center (https://www.chlamycollection.org/) (Supplemental Table S3). Cells in which roGFP2-Tsa2ΔCR was targeted to the stroma, cytosol, mitochondrion matrix, or nucleus were initially grown in LL in TAP medium to the exponential growth phase. Cells were then grown in TP medium in LL for 2 h and shifted either to HL or very low light (10 µmol photons m−2 s−1). Prior to collecting algal samples, N-ethylmaleimide (NEM) (in 100 mM MES–Tris buffer, pH 7.0) was added to a centrifuge tube to trap the oxidation state of the sensor. The final concentration of NEM was 10 mM after adding to the algal culture. After centrifugation (1,459 × g, 3 min, room temperature), cells were resuspended in 100 mM MES–Tris buffer (pH 7.0) to reach a chlorophyll concentration of 30 µg mL−1; roGFP2 fluorescence was measured in a plate reader (Infinite M1000; TECAN). For calibration and data calculation, fully oxidized sensors in control samples were prepared by adding H2O2 to a final concentration of 5 mM, and fully reduced sensors were prepared by adding DTT to a final concentration of 100 mM. Signals were detected using excitation wavelengths of 410 and 488 nm and an emission wavelength of 514 nm. The degree of sensor oxidation (OxD) was calculated using the previous equation as described in Niemeyer et al. (2021).
Photosynthesis–irradiance curve
Photosynthesis–irradiance curves were measured using a custom Pt-Ag/AgCl polarographic electrode system (ALGI) with a water jacketed (for temperature control), 1-mL glass reaction chamber. YSI 5331A electrodes (Yellow Springs Instruments) were polarized to −0.8 V. The cultures used for the assays were concentrated to 2.5 to 5 µg mL−1 chlorophyll equivalent, supplemented with 15 µL of 0.5-M sodium bicarbonate in water, and then purged with 1% CO2/99% He (v/v). Using a gas-tight syringe, the sample was transferred into the reaction chamber that was also purged with 1% CO2/99% He (v/v). The rate of change in O2 levels was measured sequentially at the light intensities 100, 200, 600, and 1,000 µmol photons m−2 s−1 (photosynthetic active radiation, PAR); each intensity was maintained for 3 to 5 min followed by a 3-min intervening dark period, and then, the light level was raised to the next higher intensity (stepped change) until the full range of intensities was tested. At 1,000 µmol photons m−2 s−1, the light was held for 10 min followed by an 8-min dark period. Before the measurement of each experimental series, the electrodes were calibrated with air (∼21% O2) and 1% CO2/99% He mixture (0% O2). The initial slope of the response was used to determine the O2 evolution rate.
Starch and TAG quantification
Cells were grown under the LL to mid-exponential phase, diluted to 0.5 μg mL−1 Chl equivalent with fresh TAP medium, and transferred to and then grown in ML for 24 h or more, as indicated. Starch was measured according to Klein and Betz (1978), with slight modifications. In brief, cells were collected by centrifugation and pigments were extracted in methanol. Dried cell pellets were resuspended in water and heated at 100 °C to break the cells and release the starch. After cooling, amyloglucosidase and α-amylase (2.25 U mL−1) were used to hydrolyze starch and the products of hydrolysis were quantified using a Glucose Colorimetric Detection Kit (Thermo Fisher Scientific). Triacylglycerol (TAG) levels were estimated by a fluorometric assay using the dye Nile Red (Thermo Fisher Scientific) (Yu et al. 2009). A Nile Red solution (500 μg mL−1 in acetone) was added to 1 mL of cell suspensions to a final concentration of 0.5 μg mL−1. Samples were then incubated at room temperature for 30 min, and the Nile Red fluorescence emission was quantified at 575 nm following excitation at 530 nm using a microplate reader (Infinite M1000; TECAN).
Metabolic analysis
Cells grown in LL were shifted to ML for 45 min or 6 h, as indicated. A volume of 45 mL of culture was rapidly quenched in cold saline solution [0.9% (0.15 M) NaCl] (−2 to −3 °C), extracted using cold methanol, and then analyzed by LC–MS/MS. Quenching and analysis of metabolites were performed, with modifications, according to Sake et al. (2020). The quenching solution, filtered saline (9 g L−1 NaCl), was prechilled to 4 °C in a refrigerator. Thirty mL of the quenching solution was transferred to a 50-mL conical tube kept in an ice bath mixed with salt to maintain the temperature between −3 and −1 °C. Then, 15 mL of the culture was rapidly plunged into the 30 mL of quenching solution and the samples were centrifuged at 1459 × g for 10 min at 4 °C. Cell pellets were washed with fresh prechilled saline solution and centrifuged again at 4,000 rpm for 10 min in a 2-mL centrifuge tube. For each replicate, 45 mL of the culture was sampled and the 3 cell pellets per culture were pooled. Washed pellets were frozen at −80 °C until extraction. Metabolite extraction and further analysis were modified from Young et al. (2011). To each cell pellet, 500-μL methanol was added along with the internal standards ribitol and PIPES to a final concentration of 2 µM each. Samples were then vortexed for 30 s, frozen in liquid nitrogen as described in Winder et al. (2008), and allowed to thaw at 0 °C.
This vortex freeze–thaw cycle was repeated twice more before the samples were centrifuged at 10,000 × g at 1 °C for 5 min. The supernatant was collected, and the remaining pellets were extracted twice more with 500 μL of a 50:50 (v/v) mixture of methanol and water, with 3 vortex–freeze–thaw cycles done for each extraction. Supernatants from each extraction procedure were pooled and dried on a Thermo Fisher SpeedVac Concentrator. Dried extracts were then resuspended in 500-μL water and cleaned to remove any residual large cell debris by filtration, first through a 0.22-μm pore size Spin-X centrifugal tube filter, followed by 10 K molecular mass cutoff filters, followed finally by 3 K molecular mass cutoff filters. After each filtration step, filters were rinsed with 50-μL water, which was added to the total sample volume for subsequent steps. Filtered extracts were dried again and resuspended in 200-μL water for LC–MS/MS analysis.
Metabolite extracts were analyzed using LC–MS/MS, as adapted from Young et al. (2011). A Phenomenex 150 mm × 2 mm Synergi Hydro-RP column was used on an Agilent 1200 Series HPLC system coupled to an AB Sciex 5500 QTRAP system. LC was performed with a liquid injection volume of 20 μL and a gradient elution with 10 mM tributylamine and 15 mM acetic acid (aqueous phase) in acetonitrile (organic phase) (reagent B) at a constant flow rate of 0.3 mL min−1 and a constant temperature of 40 °C. The gradient profile of the organic phase was as follows (all % v/v): 0% B (0 min), 8% B (10 min), 16% B (15 min), 30% B (16.5 min), 30% B (19 min), 90% B (21.5 min), 90% B (28 min), 0% B (28.5 min), and 0% B (35 min). MS analysis was performed in negative mode using a multiple reaction monitoring (MRM) acquisition method. Data acquisition was performed with ABSciex Analyst 1.7 software. Absolute quantification of intracellular metabolites was performed using the quantitation mode on the Analyst software. All chemicals used for metabolite extraction and LC–MS/MS analysis were Optima grade reagents.
Protein extraction and immunoblot analysis
Affinity-purified polyclonal antibodies against CreTPT3 were custom-made by GenScript. The antigen sequence used for antibody generation was KSWSFGRPVTKQEF.
Chlamydomonas cells were grown in liquid cultures to 2 to 5 × 10⁶ cells mL−1 and collected by centrifugation (1,459 × g, 5 min, at room temperature). Cells were resuspended in resuspension buffer [5 mM HEPES-KOH, pH 7.5, 10 mM EDTA pH 7.5, 1× protease inhibitor “complete EDTA-free” (Roche)]. For cell disruption, bead-beating was performed using a mini beadbeater (BioSpec) in 2 cycles of 30 s min−1, with a 1-min period of cooling on ice between cycles. Disrupted cells were centrifuged at 4 °C, 30 min, 14,000 × g in a microfuge. The supernatant was removed, and the pellet was resuspended in sample buffer [resuspension buffer containing 100 mM Na2CO3, 100 mM DTT, 2% (w/v) SDS, and 12% (w/v) sucrose].
SDS-PAGE was performed using a 12% polyacrylamide gel (Bio-Rad), with electrophoresis for 90 min at 120 V. The proteins within the gel were transferred onto a PVDF membrane (Bio-Rad) using Trans-Blot Turbo (Bio-Rad). The dilution for the primary antibody is 1:500. Goat Anti-Rabbit IgG (Bio-Rad, 1706515) was used for the secondary antibody. The detection was performed using Clarity Max Western ECL Substrate (Bio-Rad).
RT-qPCR
RT-qPCR was performed as described previously (Kaye et al. 2019). Briefly, total RNA was isolated using an RNeasy Plant Mini Kit (Qiagen) and treated with DNase I (Qiagen). First-strand cDNA was generated by reverse transcription of 0.5 µg total RNA using an iScript cDNA Synthesis Kit (Bio-Rad). qPCR using a Roche LightCycler 480 was performed with a SensiMix No-ROX SYBR Green I Kit as described by the manufacturer (Bioline). Primers used in this research for analyzing the expression levels of CreTPT10/TPT2/TPT3/CGL51 are listed in Supplemental Table S1. mRNA levels were calculated using the DeltaC (T) method (Silver et al. 2006). The CBLP gene was used as an internal control.
Analysis of transcript levels in response to different conditions
To analyze the transcript level of CreTPT genes under different conditions, we obtained RNA-seq data published previously in which cells experienced a diurnal cycle and nitrogen, sulfur, or Fe2+ limitation (González-Ballester et al. 2010; Ngan et al. 2015; Zones et al. 2015; Urzica et al. 2013; Strenkert et al. 2019). The log2 fold change of each gene was calculated based on the ratio of transcript abundance at different time points over transcript level at time point 0 h. The fold change was visualized as a heatmap, and the color bar is the scale of log2 (fold change).
Correlation analysis based on CreTPT3 transcript abundance under different conditions
The Z-score of each gene was calculated as follows: the mean transcript level of each gene across all conditions was subtracted from the transcript level of each gene in each sample. This difference was divided by the Sd of the transcript level of each gene under all conditions to obtain Z-scores. The entire Z-score matrix for every gene under all conditions was used to calculate the Pearson's correlation matrix by using the Python Dataframe.corr() function. The genes highly correlated with CreTPT3 were selected if their correlation value was higher than 0.75. PCC values of CreTPT3 highly correlated genes were plotted based on their KEGG pathway.
In vivo polymeric carbohydrate staining
Lugol's iodine [aqueous solution of 1.8% (w/v) iodine and 3% (w/v) potassium iodide] was used to stain in vivo polymeric carbohydrates. Briefly, 0.5 mL of the cell culture was pelleted, resuspended in 10 µL of Lugol's iodine, and visualized under a bright-field microscope. Lugol's iodine selectively binds to alpha-1,4 glucans and stains it blue-black.
Accession numbers
Genes analyzed in this article have the following accession numbers in Phytozome v13 (https://phytozome-next.jgi.doe.gov/): CreTPT2 (Cre06.g263850_4532), CreTPT3 (Cre01.g045550_4532), CreTPT10 (Cre08.g379350_4532), CGL51 (Cre16.g663800_4532), CreMDH1 (Cre03.g194850_4532), and CreMDH5 (Cre09.g410700_4532).
Acknowledgments
W.H. thanks Dr. Masayuki Onishi for the advice on the generation of CRISPR mutants and Adrien Burlacot for the help with PQ pool measurements.
Author contributions
W.H., A.K., A.G., and M.P. conceptualized the study. W.H. generated the CRISPR mutants as well as the complemented strain, localized the TPT2 and TPT3 proteins, and analyzed the photosynthetic performances and starch changes over diel cycle. A.K. performed the experiments of photosynthetic O2 evolution, extraction of samples for LC–MS/MS, and data analysis of LC–MS/MS. A.P. and N.L. performed the reconstitution into liposomes and transport activity assays. M.M. and N.B. performed LC–MS/MS and analyses of metabolite data. W.H. and Y.W. analyzed the redox status in the cell. B.R. performed data mining for transcriptome and the Nile Red staining. J.F. and N.F. analyzed starch changes upon transition from LL to ML. W.H., P.R., and A.G. analyzed PSI and PSII activities. J.F. and B.R. constructed roGFP2-associated vectors. W.H. and A.G. wrote the manuscript. A.G., M.P., A.K., N.L., N.B., A.P., M.M., and all the other authors helped in writing and revising the manuscript.
Supplemental data
The following materials are available in the online version of this article.
Supplemental Figure S1. Features of putative plastid phosphate transporter (pPT) in A. thaliana and C. reinhardtii.
Supplemental Figure S2. Background activity of Pi uptake with the endogenous yeast transporters reconstituted in into liposomes.
Supplemental Figure S3. Mutations generated in the CreTPT2 gene by CRISPR/Cas9-mediated insertion.
Supplemental Figure S4. Types of mutations generated in the CreTPT3 gene by CRISPR/Cas9-mediated insertion with sgRNA1 in exon 1 and sgRNA2 in exon 7.
Supplemental Figure S5. Experimental setup.
Supplemental Figure S6. Comparison of cell morphology between WT and t3ko2.
Supplemental Figure S7. Quantification of chlorophyll contents in the indicated strains after exposure to ML for 24 and 48 h.
Supplemental Figure S8. Starch and metabolites in WT and t3ko2.
Supplemental Figure S9. Transcript changes of CreTPT2 and CreTPT3 under various conditions.
Supplemental Figure S10. Transcript changes of pPTs and plastid MDHs in the indicated strains after exposure to ML.
Supplemental Figure S11. List of genes with strong correlation relative to CreTPT3.
Supplemental Table S1. Members of the triose phosphate transporter family in C. reinhardtii and their predicted subcellular localization based on TargetP2.0.
Supplemental Table S2. Primers used in this study.
Supplemental Table S3. Plasmids of H2O2roGFP2-Tsa2ΔCR sensors (Niemeyer et al. 2021).
Supplemental Table S4. List of genes with strong PCC to CreTPT3.
Supplemental Data Set S1. Statistical test performed and used across figures to detect significant differences.
Funding
This project has been supported by DOE award DE-SC0019417 to A.G. W.H. was supported solely by a grant from the US Department of Energy, Office of Science, Basic Energy Systems (DE-SC0019417). A.K. and M.P. were supported solely by a grant from the US Department of Energy, Office of Science, Basic Energy Systems (DE-SC0019341 to M.P.). N.B. and M.M. were supported by the US Department of Energy, Office of Science, Office of Biological and Environmental Research (B.R.), (DE-SC0018301 to N.B.). N.L. and A.P. were supported by German Research Foundations (DFG Grant LI1781/2-2). B.R. was supported by the National Science Foundation (Award Number 1645164). R.K. and J.F. were supported by the Department of Plant Biology of the Carnegie Institution for Science. P.R. was supported by the Human Frontier Science Program (HFSP) RGP0046/2018 (to A.G.).
Data availability
All data are available in the main text or the supplementary materials.
References
Author notes
Weichao Huang and Anagha Krishnan contributed equally.
The author(s) responsible for distribution of materials integral to the findings presented in this article in accordance with the policy described in the Instructions for Authors (https://dbpia.nl.go.kr/plcell/) are: Weichao Huang ([email protected]) and Arthur Grossman ([email protected]).
Conflict of interest statement. The authors declare no conflict of interest regarding this study.
