


Abstract
Jasmonic acid (JA) is a critical hormonal regulator of plant growth and defense. To advance our understanding of the architecture and dynamic regulation of the JA gene regulatory network, we performed a high-resolution RNA-seq time series of methyl JA-treated Arabidopsis thaliana at 15 time points over a 16-h period. Computational analysis showed that methyl JA (MeJA) induces a burst of transcriptional activity, generating diverse expression patterns over time that partition into distinct sectors of the JA response targeting specific biological processes. The presence of transcription factor (TF) DNA binding motifs correlated with specific TF activity during temporal MeJA-induced transcriptional reprogramming. Insight into the underlying dynamic transcriptional regulation mechanisms was captured in a chronological model of the JA gene regulatory network. Several TFs, including MYB59 and bHLH27, were uncovered as early network components with a role in pathogen and insect resistance. Analysis of subnetworks surrounding the TFs ORA47, RAP2.6L, MYB59, and ANAC055, using transcriptome profiling of overexpressors and mutants, provided insights into their regulatory role in defined modules of the JA network. Collectively, our work illuminates the complexity of the JA gene regulatory network, pinpoints and validates previously unknown regulators, and provides a valuable resource for functional studies on JA signaling components in plant defense and development.
INTRODUCTION
In nature, plants are subject to attack by a broad range of harmful pests and pathogens. To survive, plants have evolved a sophisticated immune signaling network that enables them to mount an effective defense response upon recognition of invaders. The phytohormone jasmonic acid (JA) and its derivatives are key regulators in this network and are typically synthesized in response to insect herbivory and infection by necrotrophic pathogens (Wasternack, 2015). Enhanced JA production mediates large-scale reprogramming of the plant's transcriptome, which is influenced by the antagonistic or synergistic action of other hormones produced during parasitic interactions, such as salicylic acid (SA), ethylene (ET), or abscisic acid (ABA) (Pieterse et al., 2012; Campos et al., 2014; Wasternack, 2015). The JA signaling network coordinates the production of a broad range of defense-related proteins and secondary metabolites, the composition of which is adapted to the environmental context and nature of the JA-inducing condition (Pieterse et al., 2012; Campos et al., 2014; Wasternack, 2015).
In the past decade, major discoveries in the model plant Arabidopsis thaliana have greatly advanced our understanding of the JA signaling pathway. In the absence of an invader, when JA levels are low, activation of JA-responsive gene expression is constrained by repressor proteins of the JASMONATE ZIM domain (JAZ) family that bind to specific JA-regulated transcription factors (TFs). The conserved C-terminal JA-associated (Jas) domain of JAZs competitively inhibits interaction of the TF MYC3 with the MED25 subunit of the transcriptional Mediator complex (Zhang et al., 2015). Moreover, JAZs recruit the TOPLESS corepressor, either directly or through the NOVEL INTERACTOR OF JAZ (NINJA) adapter, which epigenetically inhibits expression of TF target genes. In response to pathogen or insect attack, bioactive JA-Ile is synthesized and promotes the formation of the coreceptor complex of JAZ (via its Jas domain) with CORONATINE INSENSITIVE1 (COI1), the F-box protein of the E3 ubiquitin-ligase Skip-Cullin-F-box complex SCFCOI1. Upon perception of JA-Ile, JAZ repressor proteins are targeted by SCFCOI1 for ubiquitination and subsequent proteasomal degradation (Chini et al., 2007; Thines et al., 2007; Sheard et al., 2010). This degradation leads to the release of the JAZ-mediated repression of TFs and to subsequent induction of JA-responsive gene expression.
Several groups of TFs are known to be important for regulation of the JA pathway. Upon degradation of JAZs, MYC2 acts in concert with the closely related bHLH TFs MYC3 and MYC4 in activating a large group of JA-responsive genes by directly targeting their promoters (Dombrecht et al., 2007; Cheng et al., 2011; Fernández-Calvo et al., 2011). While current evidence indicates that MYC2, MYC3, and MYC4 act as master regulators of the onset of JA-responsive gene expression, additional factors are required for further fine-regulation of the JA signaling circuitry. Several other bHLH TFs, such as JASMONATE-ASSOCIATED MYC2-LIKE1 (JAM1)/bHLH017, JAM2/bHLH013, JAM3/bHLH003, and bHLH014 act redundantly to repress JA-inducible genes by competitive binding to cis-regulatory elements, possibly to control the timing and magnitude of the induced JA response (Nakata et al., 2013; Sasaki-Sekimoto et al., 2013; Song et al., 2013). Another important family of regulators that shapes the JA response is the APETALA2/ETHYLENE RESPONSE FACTOR (AP2/ERF) family of TFs. AP2/ERF-type TFs, such as ERF1 and ORA59 (OCTADECANOID-RESPONSIVE ARABIDOPSIS AP2/ERF-DOMAIN PROTEIN59), integrate the JA and ET response pathways and act antagonistically on MYC2-, MYC3-, and MYC4-regulated JA-responsive genes (Lorenzo et al., 2003; Pré et al., 2008; Zhu et al., 2011; Pieterse et al., 2012). In general, AP2/ERF-regulated JA responses in the ERF branch of the JA pathway are associated with enhanced resistance to necrotrophic pathogens (Berrocal-Lobo et al., 2002; Lorenzo et al., 2003), whereas the MYC TF-regulated JA responses in the MYC branch of the JA pathway are associated with wound response and defense against insect herbivores (Lorenzo et al., 2004; Kazan and Manners, 2008; Verhage et al., 2011).
A detailed understanding of how responsiveness to JA is regulated is important in order to find leads that can improve crop resistance to pathogens and insects, while maintaining plant growth. Previously, several microarray-based transcriptome profiling studies revealed important information on the regulation of JA-responsive gene expression (Goda et al., 2008; Pauwels et al., 2008). However, because these studies analyzed this response at limited temporal resolution, much has remained unknown about the architecture and dynamics of the JA gene regulatory network. Here, we performed an in-depth, high-throughput RNA sequencing (RNA-seq) study in which we generated a high-resolution time series of the JA-mediated transcriptional response in leaf number 6 of Arabidopsis plants. Computational analysis of the JA-induced transcriptional landscape provided insight into the structure of the JA gene regulatory network at an unprecedented level of detail. We accurately identified distinct JA-induced expression profiles and used these to predict and validate the biological function of several previously unknown regulators of the JA immune regulatory network. We resolved the sequence of transcriptional events that take place following induction of the JA response, constructed a dynamic model of the JA gene regulatory network, and identified and validated subnetworks surrounding several JA-induced TFs, confirming the suitability of our systems approach to obtain detailed knowledge on regulation of the JA response pathway.
RESULTS
A Time Course of MeJA-Elicited Transcriptional Reprogramming
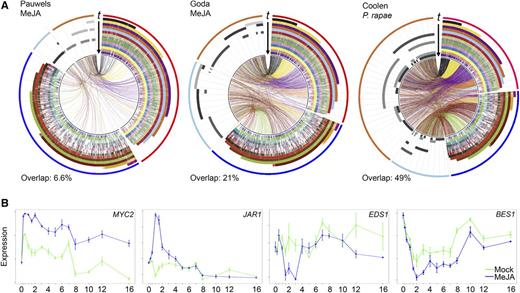
A key step toward a systems-level understanding of the architecture of the JA signaling network is to obtain comprehensive and accurate insight into the dynamic transcriptional reprogramming that takes place in plants following JA stimulation. To go beyond earlier studies that analyzed the JA transcriptional response with a limited number of time points, we generated a high-resolution time series of JA-mediated transcriptional reprogramming in Arabidopsis leaves. Previously, similar types of dense time series experiments with Arabidopsis have been successfully utilized to help decipher gene regulatory networks underpinning a variety of biological processes, such as senescence and responsiveness to infection by Botrytis cinerea and Pseudomonas syringae (Breeze et al., 2011; Windram et al., 2012; Lewis et al., 2015). Here, we used RNA-seq technology to profile whole-genome transcriptional expression in Arabidopsis leaves just before the treatments (t = 0 h), and over 14 consecutive time points within 16 h following application of methyl JA (MeJA; which is readily converted to JA) or a mock solution to the leaves of intact plants (Supplemental Data Set 1). At all time points and for each treatment, one leaf (true leaf number 6) was sampled in quadruplicate from four independent 5-week-old Col-0 plants, yielding 116 samples in total (Supplemental Data Set 1). Read counts were normalized for differences in sequencing depth between samples (Supplemental Data Set 2), and a generalized linear model was employed to identify genes whose transcript levels differed significantly over time between MeJA and mock treatments (Van Verk et al. (2013); see Methods for details). This analysis yielded a set of 3611 differentially expressed genes (DEGs; Supplemental Data Set 3). Many of these DEGs were not previously described as MeJA responsive (Figure 1A) in experiments where MeJA was applied to cell cultures or seedlings and three time points were analyzed (Goda et al., 2008; Pauwels et al., 2008). Among these were 596 genes that are not represented on the ATH1 microarray used in these earlier studies. Comparison of our DEG set with that of an experiment in which Arabidopsis leaves were fed on by the JA-inducing insect herbivore Pieris rapae revealed an overlap of 49% (Coolen et al., 2016) (Figure 1A), indicating that the transcriptional changes elicited by exogenously applied MeJA in this study are biologically relevant.
Temporal Expression Profiles Following Application of MeJA.
(A) Circos plots of time-series expression profiles from our MeJA experiment in comparison to previously published MeJA- or P. rapae-induced transcriptome data (Pauwels et al., 2008; Goda et al., 2008; Coolen et al., 2016), as indicated at the top left of each plot. Outermost bands indicate differentially expressed gene sets from this study (red, upregulated; dark blue, downregulated) and from the previously published data sets (orange, upregulated; light blue; downregulated). The stacked histograms indicate differential expression (colors indicate sampling time point from 0.25 h up to 16 h after treatment). Genes differentially expressed in both data sets are marked by connecting bands (colors indicate first time point of differential expression in our study). Each section within the circus plot represents a set of 100 DEGs.
(B) Examples of expression profiles of selected JA and SA pathway marker genes in our study. y axis, transcript abundance; x axis, time (h) after application of MeJA; error bars indicate se.
Our high-resolution temporal transcriptome data captured a diverse set of dynamic responses to MeJA stimulation (Supplemental Figure 1). The majority of expression changes in individual genes followed a clear single-pulse (impulse) pattern, which is often observed in responses to environmental stress in eukaryotic cells and coordinates the temporal regulation of specific gene expression programs (Yosef and Regev, 2011). Examples of genes whose expression was up- or downregulated for a short period of time followed by a transition to a steady state, which was often a return to basal expression, are JAR1 and EDS1 (Figure 1B). There were also genes that displayed a longer lasting change in expression level, e.g., MYC2 and BES1 (Figure 1B). By monitoring the transcriptional changes in leaf number 6, we maximally synchronized the onset of the JA response in intact plant tissue. Hence, the resulting information-rich time series of MeJA-responsive gene expression profiles are highly suited to computational approaches that can generate biological insights into the regulation of the underlying JA transcriptional network.
Process-Specific Gene Clusters
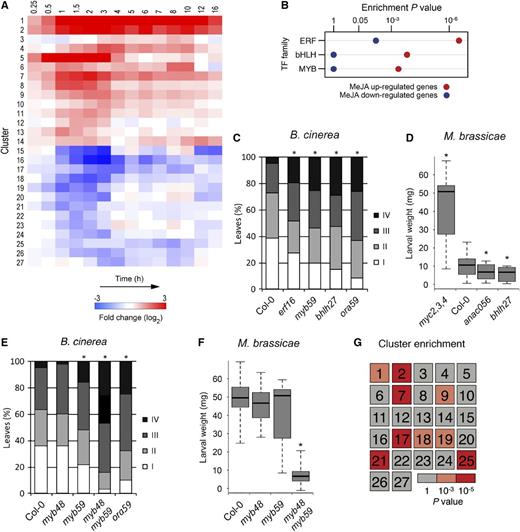
To begin to decode the JA gene regulatory network, the time series-clustering algorithm SplineCluster was used to partition the set of 3611 DEGs into clusters of coexpressed genes that share similar expression dynamics. This yielded 27 distinct clusters with distinct response patterns (Figure 2A; Supplemental Figure 1 and Supplemental Data Set 4), which broadly fell into two major groups: those that showed increased expression in response to application of MeJA (clusters 1–14) and those that exhibited reduced expression (clusters 15–27). The cluster analysis highlighted a global burst of MeJA-induced up- or downregulation of gene transcription, generally starting within 1 h and peaking within 2 h after treatment. Most clusters showed a clear pulse-like, transient change in transcript levels (e.g., clusters 8 and 18, up- and downregulation, respectively). A largely sustained induction throughout the time course was displayed in example clusters 1 and 2. More complex expression patterns were also revealed; cluster 14 presented two consecutive pulses of activation.
Clustering of Coexpressed Genes in the JA Gene Regulatory Network and Identification of Novel Components of JA-Dependent Resistance.
(A) The set of 3611 genes showing differential expression in Arabidopsis leaves following exogenous application of MeJA was partitioned into 27 distinct coexpressed gene clusters using SplineCluster. The heat map shows the mean gene expression profile for each cluster, with red and blue indicating upregulation and downregulation of expression (log2-fold change [MeJA/mock]), respectively.
(B) Significantly overrepresented TF families within clusters of genes upregulated (clusters 1-14; red) or downregulated (clusters 15–27; blue) in response to MeJA treatment (hypergeometric test; P ≤ 0.001).
(C) Quantification of disease symptoms of wild-type Col-0, highly susceptible ERF TF mutant ora59, and T-DNA insertion lines for selected genes ERF16, MYB59, and bHLH27 (members of coexpression clusters 2, 4, and 1, respectively) at 3 d after inoculation with B. cinerea. Disease severity of inoculated leaves was scored in four classes ranging from restricted lesion (class I), nonspreading lesion (class II), spreading lesion (class III), up to severely spreading lesion (class IV). The percentage of leaves in each class was calculated per plant (n > 20). Asterisk indicates statistically significant difference from Col-0 (χ2 test; P ≤ 0.05).
(D) Performance of M. brassicae larvae on Col-0, highly susceptible triple bHLH TF mutant myc2,3,4, and T-DNA insertion lines for selected genes ANAC056 (coexpression cluster 13) and bHLH27. The larval fresh weight was determined after 8 d of feeding. Asterisk indicates statistically significant difference from Col-0 (two-tailed Student's t test for pairwise comparisons; P ≤ 0.05; n = 30; error bars are se).
(E) Quantification of disease symptoms of Col-0, myb48, myb59, myb48 myb59, and ora59 mutant lines at 3 d after inoculation with B. cinerea. Disease severity of inoculated leaves was scored as described in (C) (n > 20). Asterisk indicates statistically significant difference from Col-0 (χ2 test; P ≤ 0.05).
(F) Performance of M. brassicae larvae on Col-0 and myb48, myb59, and myb48 myb59 mutant lines. The larval fresh weight was determined after 12 d of feeding. Asterisk indicates statistically significant difference from Col-0 (two-tailed Student's t test for pairwise comparisons; P ≤ 0.05; n = 30; error bars are se).
(G) Heat map indicating hypergeometric enrichment P value of genes differentially expressed in myb48 myb59 (compared with Col-0) in each MeJA-induced coexpression cluster.
The genes in each cluster were tested for overrepresented functional categories using Gene Ontology (GO) term enrichment analysis to investigate the biological significance of the distinct dynamic expression patterns (Supplemental Data Set 5). This analysis showed that clusters representing upregulated genes were, as expected, overrepresented for functional terms associated with JA defense responses. Broad annotations such as “response to wounding” and “Response to herbivory” were present in multiple upregulated clusters, while in contrast, the more specific functional categories were linked to distinct clusters. For example, cluster 6 was specifically enriched for the annotation term “anthocyanin-containing compound biosynthetic process,” cluster 8 for “tryptophan biosynthetic process,” and cluster 14 for “glucosinolate biosynthetic process.” Each of these clusters contained many of the genes previously implicated in these secondary metabolite biosynthesis pathways, but also uncharacterized genes that may have an important function in these specific processes (Supplemental Data Set 5). The significant enrichment of distinct gene clusters for a specific biological process indicates that the dynamic expression profiles generated in this study possess information that is sufficiently detailed to capture discrete sectors of the JA-controlled gene network that control specific processes. These sectors are likely subject to distinct regulation encoded within the promoters of the genes in the respective clusters.
To facilitate the use of the expression data for the research community, a searchable (by gene ID) figure has been made available that visualizes coexpression relationships in time for all DEGs in the individual clusters (Supplemental File 1).
Discovery of Defense Regulators
Since TFs are the main drivers of transcriptional networks, we mapped the TF families that are enriched in the 27 clusters of MeJA-responsive DEGs. Within the upregulated clusters, genes encoding members of the bHLH, ERF, and MYB TF families were most significantly overrepresented (Figure 2B), suggesting that these TF families dominate the onset of JA-induced gene expression.
The early upregulated gene clusters 1 and 2 (61 and 165 genes, respectively) were enriched for known JA-related genes such as the herbivory markers VSP1 and VSP2, as well as the regulators JAZ1, 2, 5, 7, 8, 9, 10, and 13, MYC2, ANAC019, ANAC055, RGL3, and JAM1 (Wasternack and Hause, 2013). In addition, TF genes with no previously reported roles in the JA response pathway were present in these clusters, which implies that they may also have regulatory functions in the JA response relevant to plant defense. To test this hypothesis, we selected seven uncharacterized TF genes from clusters 1 and 2 and supplemented this set with five uncharacterized TF genes from other clusters displaying a similarly rapid response to MeJA treatment. The respective Arabidopsis T-DNA knockout lines were functionally analyzed for their resistance against the necrotrophic fungus B. cinerea and the generalist insect herbivore Mamestra brassicae, which are both controlled by JA-inducible defenses (Pieterse et al., 2012). Mutants in the TF genes bHLH27, ERF16, and MYB59 displayed a significant increase in disease susceptibility to B. cinerea compared with wild-type Arabidopsis Col-0, approaching the disease severity level of the highly susceptible control mutant ora59 (Figure 2C; full results in Supplemental Figure 2 and additional mutant alleles in Supplemental Figure 3). Weight gain of M. brassicae larvae was significantly reduced on mutants of ANAC056 and bHLH27, while on none of the tested mutants larval weight was enhanced, as was the case on the susceptible control mutant myc2 myc3 myc4 (Figure 2D; full results and additional mutant alleles in Supplemental Figures 3 and 4). Thus, for 4 of the 12 tested MeJA-responsive, previously uncharacterized TF genes a predicted role in the JA response could be functionally validated for either B. cinerea or M. brassicae resistance, demonstrating the value of using information-rich time-series data to accurately identify coexpressed genes that may have novel functions in the JA pathway.
Contrasting Roles in Pathogen and Insect Defense for Redundant Gene Pair MYB48/MYB59
Many TFs originate from duplication events and have overlapping or even redundant functionality, so that their single mutants may not display the full effects on host immunity in the above-described analyses. Therefore, we additionally assayed a double mutant of a pair of genetically unlinked paralogous genes, MYB48 and MYB59 (Bolle et al., 2013), to uncover phenotypes not seen in either single mutant. This approach can provide further insight into the functionality of such TFs. The TF gene MYB59 was upregulated within 30 min after application of MeJA and although the single mutant myb59 displayed enhanced susceptibility to B. cinerea (Figures 2C and 2E), it was unaffected in resistance to M. brassicae (Figures 2D and 2F). MYB48 was transiently downregulated by MeJA, but the single mutant myb48 did not show altered resistance to either B. cinerea or M. brassicae (Figures 2E and 2F). By contrast, the myb48 myb59 double mutant was highly resistant to M. brassicae, reducing the larval growth 5-fold in comparison to Col-0 and the single mutants. Moreover, the double mutant displayed significantly more severe disease symptoms following infection by B. cinerea than either of the single mutants. This suggests that MYB48 and MYB59 function in concerted action as negative regulators of insect resistance and positive regulators of necrotrophic pathogen resistance.
To gain insight into the biological processes contributing to the differentially altered attacker performance on myb48 myb59, we performed RNA-seq analysis on the double mutant. A total of 399 genes were differentially expressed between nonstimulated myb48 myb59 and Col-0 leaves (168 were upregulated and 231 were downregulated in the double mutant; Supplemental Data Set 6). Functional category analysis showed that in the upregulated DEG set of the mutant compared with Col-0, processes like “response to wounding” and “response to jasmonic acid stimulus” were enriched (Supplemental Data Set 7). This finding is in accordance with these myb48 myb59-upregulated DEGs being overrepresented in coexpression clusters 1, 2, 7, and 9 of the MeJA-responsive DEGs (Figure 2G). Genes that showed enhancement of expression by both MeJA treatment and the myb48 myb59 mutation were, for example, the JA biosynthetic genes AOC2 and OPR3, and TF gene MYC2. Also, the downstream herbivore defense marker gene VSP2 showed >50-fold higher expression in the mutant. This upregulation suggests prioritization of the JA pathway toward the anti-insect MYC branch in myb48 myb59, explaining its enhanced resistance to M. brassicae. However, MYC branch-mediated antagonism of the ERF branch of the JA pathway, which would explain the reduction of defense against the necrotrophic pathogen B. cinerea, is not apparent from our transcriptome data. It may be that MYB48/MYB59-regulated genes that are enriched for “secondary metabolite biosynthetic processes” (represented by clusters 17–19, 21, and 25) and are downregulated in the mutant are important for resistance to B. cinerea. This example highlights that higher-order mutants can reveal important gene regulatory functions that would otherwise be masked by genetic redundancy.
Enrichment of TF DNA Binding Motifs
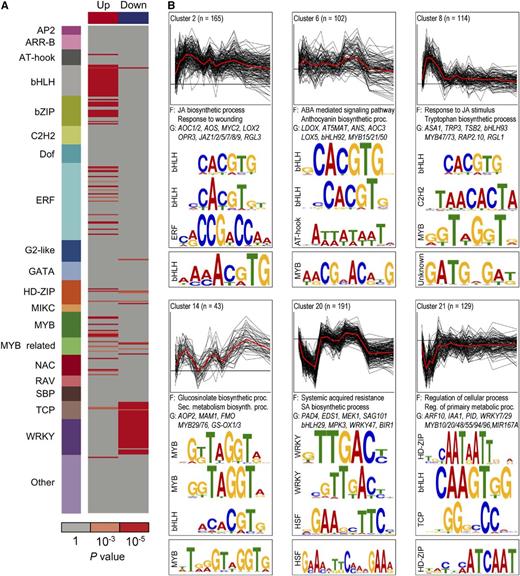
TFs regulate gene expression by binding to cis-regulatory elements of target genes in a sequence specific manner. Mapping of regulatory DNA motifs that are associated with dynamic MeJA-responsive gene expression profiles can aid in the understanding and reconstruction of JA gene regulatory networks. Therefore, we investigated which Arabidopsis TF binding site motifs were overrepresented within the promoters of coexpressed MeJA-responsive DEGs, using recently identified DNA binding specificities for 580 Arabidopsis TFs derived from studies with protein binding microarrays (PBMs) (Franco-Zorrilla et al., 2014; Weirauch et al., 2014). First, we screened for overrepresentation of these motifs in the unions of up- and downregulated gene clusters, respectively (Figure 3A). Motifs corresponding to DNA binding sites of bHLH, bZIP, ERF, and MYB TFs were clearly overrepresented in the group of upregulated genes, while WRKY and TCP TF-specific motifs were markedly overrepresented among the downregulated genes. Members of the WRKY TF family and their cognate cis-elements are key regulators of the SA response pathway (Pandey and Somssich, 2009), suggesting that WRKYs are important targets in the transcriptional repression of the SA pathway by MeJA treatment. Second, we analyzed motif enrichment within each of the 27 clusters of coexpressed genes (Figure 3B). To increase the chance of discovering nuanced sequence motifs among the genes in these clusters, we supplemented the known motif analysis (Supplemental Data Set 8) with de novo motif discovery (Supplemental Data Sets 9 and 10). This analysis revealed promoter elements that were selectively enriched in specific clusters, offering a more precise link between motifs and cluster-specific gene expression patterns. Strikingly, while motifs that correspond to bHLH binding sites were enriched in the majority of the upregulated gene clusters, ERF and MYB binding motifs were overrepresented only in a small selection of the upregulated clusters, which were associated with specific biological processes (Supplemental Data Set 8). For example, clusters 6 and 14, which were enriched for GO terms describing distinct secondary metabolite biosynthesis pathways, were enriched for different (de novo) predicted MYB DNA binding motifs (Figure 3B). These findings suggest that bHLH TFs and their DNA binding sites are essential components in activation of the majority of the MeJA-inducible genes, while ERF and MYB TFs have more specialized roles in modulating the expression of dedicated sets of target genes.
Enriched cis-Regulatory Motifs and Functional Categories in MeJA-Responsive Gene Coexpression Clusters.
(A) Overrepresentation of known TF DNA binding motifs within the unions of upregulated and downregulated genes. Rows indicate motifs and are colored by corresponding TF family. Red boxes indicate a motif that is significantly overrepresented (cumulative hypergeometric distribution).
(B) Representative coexpression clusters with overrepresented TF DNA binding motifs. Top: Profiles of log2-fold change in gene expression (MeJA/mock), with mean profile (red) and cluster size (n). Selected overrepresented functional categories (F) and representative genes (G) are denoted. Sequence logo depiction of selected known (middle) and de novo-derived (bottom) motifs that are significantly overrepresented. Full results used to derive this figure are available in Supplemental Data Sets 6, 8, and 9.
Chronology of MeJA-Mediated Transcriptional Reprogramming
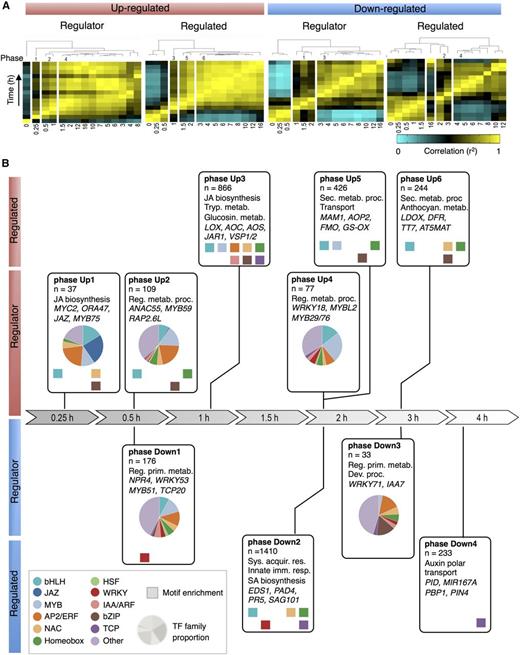
Next, we utilized the temporal information in our RNA-seq time series to resolve the chronology of gene expression events in the JA gene regulatory network. First, we divided the genes into sets of up- and downregulated DEGs and sorted them according to the time at which they first became differentially expressed (Supplemental Figure 5; see Methods for details). From this analysis, it became clear that a massive onset of gene activation precedes that of gene repression and that different waves of coordinated gene expression changes can be identified in the time series. The majority of all DEGs became first differentially expressed within 2 h after MeJA treatment, which indicates engagement of relatively short transcriptional cascades, allowing for a rapid response to an external signal (Alon, 2007). Up- and downregulated DEGs were then further separated into two additional sets based on their predicted function as transcriptional regulators (termed regulator genes) or as having a different function (termed regulated genes; Supplemental Data Set 3). We were specifically interested in identifying time points where coordinated switches in transcriptional activity take place, reasoning that pairs of adjacent time points that display a weaker correlation indicate important points of coordinated switches in transcriptional activity (see Methods and Supplemental Figure 6 for details). Therefore, within each of the four mutually exclusive gene sets, we examined the pairwise correlations of expression levels between all pairs of time points. Clustering of the resulting correlation matrices revealed six distinct phases in transcriptional activation and four phases in transcriptional repression (Figure 4A). The first two phases of upregulation (phases Up1 and Up2) started within 0.5 h after MeJA treatment in the set of regulator genes, while at 1.5 h, a third phase of upregulation of regulator genes ensued (phase Up4). For the regulated genes, the first phase of upregulation started at 1 h after MeJA treatment (phase Up3), which was clearly later than the first onset of the regulator genes. A similar sequence of events could be observed in the downregulated regulator and regulated genes, although the start was delayed compared with the activation of upregulated genes.
Chronology of Changes in the MeJA-Triggered Gene Regulatory Network.
(A) Phasing of MeJA-induced transcriptional changes. DEGs were divided into four sets according to their function as regulator or nonregulator (regulated), and their expression pattern being up- (red) or downregulated (blue) over time. For each set of genes, a correlation matrix of gene transcription counts between all pairs of time points was computed using Pearson's correlation metric. Shown are the dendrograms produced by hierarchical clustering of the transcriptome correlation matrices (yellow, high correlation; cyan, low correlation). Time is in hours.
(B) Analysis of the major transcriptional phases in the JA gene regulatory network. Transcriptional phases are indicated by boxes, aligned on the timeline. DEGs are assigned to the phases according to the time point where they become first differentially expressed; indicated are overrepresented functional categories and representative genes. Colored squares indicate known TF DNA binding motifs overrepresented in gene promoters (hypergeometric distribution; P ≤ 0.001). Pie charts indicate the proportion of TF gene families.
Our time series captured the temporal association between the changes in transcript abundance of transcriptional regulators and downstream targets encoding proteins responsible for the biochemical reactions that represent the defensive outputs of the JA response. To explore the biological significance and directionality in the regulation of the identified transcriptional phases in the JA gene regulatory network, all DEGs were assigned to the phase in which they first became differentially expressed (see Methods and Supplemental Figure 6 for details). The resulting gene lists of the 10 transcriptional phases were tested for overrepresentation of functional categories and promoter motifs (Figure 4B; Supplemental Data Sets 11 to 14). Phase Up1 represents the immediate transcriptional response, with genes encoding bHLHs, JAZs, MYBs, ERFs, and other transcriptional regulators associated with JA biosynthesis. These early regulator genes may play a role in the induction of other regulator-encoding genes present in phases Up2 and 4, and of regulated genes present in phases Up3, 5, and 6, which are linked to defense responses such as glucosinolate, tryptophan, and anthocyanin biosynthesis (Figure 4B; Supplemental Data Set 12). In support of this relationship, in the promoters of DEGs in phase Up3, DNA motifs that could be bound by TFs transcribed in previous phases Up1 and 2, like bHLH, ERF, and MYB binding motifs, were enriched. In phase Up3, genes involved in JA biosynthesis were also enriched, suggesting that this process is one of the first targets of JA-mediated transcriptional reprogramming. Overall, induction of the JA pathway showed a clear chronology of upregulated gene expression events, starting with the activation of genes encoding specific classes of TFs and of JA biosynthesis enzymes, followed by genes encoding enzymes involved in the production of important defensive secondary metabolites.
The first wave of transcriptional repression by MeJA was also marked by genes encoding transcriptional regulators, and began at 1 h after MeJA treatment, after which phases Down2, 3, and 4 followed at 2, 3, and 4 h after MeJA treatment, respectively (Figure 4B; Supplemental Data Set 11). These groups of downregulated genes highlight the antagonistic effects of JA on other hormone signaling pathways and defense responses in the first two phases. Phase Down1, for instance, was characterized by the repression of different defense-related genes, such as NPR4 and MYB51, which encode regulators that promote SA responses and indolic glucosinolate biosynthesis, respectively (Gigolashvili et al., 2007; Fu et al., 2012). Accordingly, MYC2, which was induced by MeJA in phase Up1, was previously shown to suppress the accumulation of indolic glucosinolates (Dombrecht et al., 2007). Phase Down2 was also enriched for genes associated with SA-controlled immunity, including the key immune regulators EDS1 and PAD4 (Feys et al., 2001). In line with these observations, there was an overrepresentation for WRKY binding motifs in the promoters of genes present in phases Down1 and 2, suggesting that their repressed expression was mediated by an effect of MeJA on WRKY action. Later phases of transcriptional repression (phases Down3 and 4) were marked by an overrepresentation of genes related to growth and development, including primary metabolism and auxin signaling, and an enrichment of DNA motifs recognized by TCP TFs, which conceivably reflects an effort by the plant to switch energy resources from growth to defense (Attaran et al., 2014). A general observation that can be made from this chronological analysis of the JA gene regulatory network is that despite the overall relatively short transcriptional cascades controlling gene activation or repression, distinctive transcriptional signatures, associated with specific biological processes, were initiated at different phases in time.
Inference of Regulatory Interactions Reveals Key Regulators of Local JA Subnetworks
Next, we made use of the TF DNA binding motif information of the genes in the temporally separated transcriptional phases to construct a gene regulatory network that predicted directional interactions between the JA responsive TF genes and all genes associated with the different transcriptional phases (Supplemental Data Set 15). The JA gene regulatory network generated via this analysis is shown in Figure 5, in which a differentially expressed TF gene (represented by a circular node in the network) is connected by an edge to a transcriptional phase (represented by a rectangle in the network) when the corresponding DNA binding motif was overrepresented in that phase. The generated network model showed TFs that were predicted to regulate expression of genes at either single or multiple transcriptional phases. The early phases likely contained key regulators of subsequent phases. Phase Up1 contained the TFs MYC2 and JAM1, which were among the most active TFs, as their cognate DNA binding motifs (both share the same consensus, CACGTG) were enriched in the promoters of genes assigned to a large fraction of the upregulated transcriptional phases. This prediction is in line with recent reports suggesting that the positive regulator MYC2 and the negative regulator JAM1 cooperate to balance JA responses by competitive binding to their shared target sequences (Nakata et al., 2013; Sasaki-Sekimoto et al., 2013). What determines the different timing by these regulators to effectively activate or repress transcription awaits further investigation. Phases Up1 and Up2 also contained the TF genes bHLH27, ERF16, ANAC056, and MYB59, of which corresponding mutants showed altered resistance levels to B. cinerea infection and/or M. brassicae infestation (Figures 2C and 2D). Cognate DNA binding motifs of these TF families were enriched in genes that were induced in multiple subsequent transcriptional phases (Figures 4B and 5).
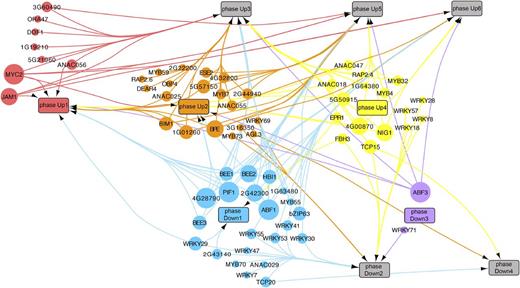
Predicted Directional Interactions in the JA Gene Regulatory Network.
Network plot of inferred connections between MeJA-induced TFs and genes in transcriptional phases. The promoter sequences of genes associated with a transcriptional phase were tested for overrepresentation of DNA motifs shown to be bound to TFs that are differentially transcribed following MeJA treatment. Each TF with a known motif is represented by a colored circle and is plotted at the time point that its corresponding gene is first differentially expressed. Each transcriptional phase is represented by a rectangle and plotted in time according to its onset. An edge between a TF and a phase indicates significant enrichment of the corresponding binding motif in that phase. The size of each TF node is proportional to the number of phases in which its binding site is overrepresented. To aid interpretation of the network, nodes are grouped and colored according to the transcriptional phase where they first become differentially expressed.
Phase Up1 also contained TF genes that were predicted to have a more limited regulatory scope, such as the ERF TF gene ORA47, for which the binding motif [consensus, CCG(A/T)CC] was overrepresented only in the promoters of genes assigned to phase Up3. These genes included the JA biosynthesis genes LOX2, AOS, AOC1, AOC2, AOC3, ACX, and OPR3, thus suggesting that this cis-element and its cognate TF ORA47 may play a role in regulating JA production, which reflects the positive feedback loop that is known to maintain and boost JA levels upon initiation of the JA response (Wasternack, 2015). Focusing on this predicted subnetwork (Figure 6A), we found that ORA47 and several of the JA biosynthesis genes were predicted to be targets of MYC2, suggesting that MYC2 together with ORA47 regulates JA biosynthesis in Arabidopsis. Figure 6B shows that the presence of the ORA47 binding motif was conserved between the promoters of AOS, AOC2, OPR3, and LOX3 orthologs of field mustard (Brassica rapa), grape (Vitis vinifera), and poplar (Populus trichocarpa), pointing to a role for ORA47 and its cognate binding element in the regulation of JA biosynthesis genes. Evidence for this role was provided by the direct binding of ORA47 to promoter elements of AOC1, AOC3, and LOX3, as demonstrated by yeast one-hybrid experiments (Supplemental Figure 7). Moreover, in stimulated β-estradiol-inducible ORA47 plants, expression of LOX2, LOX3, AOS, AOC1, AOC2, and OPR3 was increased and accumulation of JA and JA-Ile was also enhanced (Figures 6C and 6D), which is in line with and extends previous findings (Pauwels et al., 2008; Chen et al., 2016). We did not observe a significant increase in expression of JAR1, encoding the enzyme responsible for catalyzing conjugation of JA with isoleucine, suggesting that basal JAR1 levels are sufficient for the conversion of excess JA into biologically active JA-Ile. Taken together, these experimental results supported our model prediction that ORA47 is an important regulator of JA biosynthesis and highlight the potential of combining time series expression data with motif analysis to infer key regulators and their targets in gene regulatory networks.
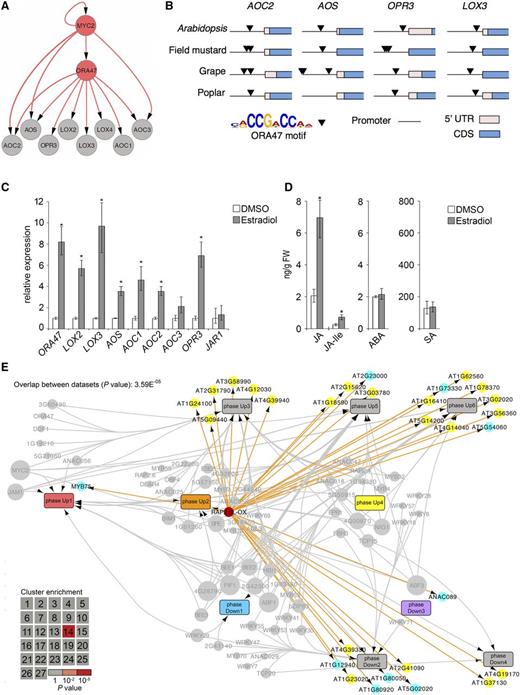
Prediction and Functional Analysis of JA-Controlled TF Subnetworks.
(A) Expanded subnetwork extracted from the global JA gene regulatory network, indicating inferred regulation of JA biosynthesis genes by ORA47. Nodes indicating TFs and JA biosynthesis genes are colored gray and orange, respectively. Directed edges indicate occurrence of TF binding sites in the promoter of the target gene.
(B) Evolutionary conservation of ORA47 DNA binding motif. Occurrences of the ORA47 motif [consensus, CCG(A/T)CC] were identified in promoters of an orthologous gene from each of the indicated JA biosynthesis genes (top row). Black arrows indicate a significant match within a gene promoter to the ORA47 motif. 5′UTR, 5-prime untranslated region; CDS, coding sequence.
(C) Induction of genes encoding JA biosynthesis enzymes in estradiol-inducible ORA47 plants. Expression levels of JA biosynthesis genes were measured in leaves 8 h after application of either estradiol or DMSO (mock) using qRT-PCR. Shown are the mean expression levels of five biological replicates with mock treatments set at 1. Asterisk indicates significant differences between mock- and estradiol-treated plants (Student's t test; P ≤ 0.05; error bars are se).
(D) Production of JA, JA-Ile, ABA, and SA in estradiol-inducible ORA47 lines. Compound levels were measured from the same leaf tissue harvested for the qRT-PCR analysis described in (C). Asterisk indicates significant difference between mock- and estradiol-treated plants (Student's t test; P ≤ 0.05; error bars are se).
(E) Projection of RAP2.6L target genes on the chronological JA network model. Genes that are differentially expressed in the RAP2.6L-OX line were overlaid onto the network described in Figure 5. DEGs are indicated by nodes and positioned according to phase membership. Direction of misregulation in RAP2.6L-OX is indicated by color: yellow, upregulated; cyan, downregulated. The gene encoding RAP2.6L is shown as a red-colored node. Inset: heat map indicating hypergeometric enrichment P value of RAP2.6L target genes in each MeJA-induced coexpression cluster.
For the vast majority of TFs in our chronological model, it was unclear which specific JA-responsive genes they regulate. To validate and extend our chronological network model further, we made use of transcriptome data sets of three Arabidopsis lines that are perturbed in TFs that were predicted by our model to regulate downstream subnetworks. We investigated the effect of the TFs RAP2.6L and ANAC055, which have previously been suggested to regulate JA-responsive genes among others (Bu et al., 2008; Krishnaswamy et al., 2011), by studying their target genes in RAP2.6L-overexpressing and anac055 mutant Arabidopsis lines. Moreover, we used the transcriptome data derived from the myb48 myb59 mutant analysis, described in Figure 2G. We performed transcriptional profiling of leaves from plants overexpressing RAP2.6L (RAP2.6L-OX) under nonstress conditions, leading to the identification of 93 DEGs (Supplemental Data Set 16). Of these, a significant portion (31 DEGs; P < 3.59e-05; hypergeometric test) was also differentially expressed in the MeJA time series. Projecting the common set of DEGs onto the transcriptional network model revealed that >90% of these genes were present in transcriptional phases that were temporally downstream of the phase containing RAP2.6L (phase Up2; Figure 6E). Analysis of the overlap between RAP2.6L-OX DEGs and the MeJA-induced coexpression clusters from this study revealed a specific enrichment for RAP2.6L targets in cluster 14, which as described above was itself overrepresented for genes associated with aliphatic glucosinolate production. Interestingly, a recent study showed that RAP2.6L can interact with several aliphatic glucosinolate biosynthetic gene promoters and, moreover, that rap2.6l mutants are perturbed in glucosinolate production (Li et al., 2014).
Using a similar approach, 56 genes differentially expressed in an anac055 mutant line compared with wild-type plants (described previously in Hickman et al., 2013) were overlaid on the JA gene regulatory network. The overlap between MeJA-responsive and ANAC055-regulated genes was statistically significant (24 DEGs, P < 4.74e-10; hypergeometric test) and >85% of these genes became for the first time differentially expressed after ANAC055 was induced by MeJA (phase Up2; Supplemental Figure 8). Downregulated gene coexpression cluster 20 was overrepresented for ANAC055 targets that were enhanced in the anac055 mutant and was enriched for GO terms related to SA biosynthesis. Notably, ANAC055 has previously been shown to target SA biosynthetic and metabolic genes to negatively regulate SA accumulation following induction by the bacterial toxin coronatine (Zheng et al., 2012).
We also projected the 399 genes that were differentially expressed in the myb48 myb59 double mutant line compared with Col-0 wild type (as described above; Supplemental Data Set 6) on the JA gene regulatory network model. The overlap between MeJA-responsive and MYB48/59-regulated genes was highly significant (164 DEGs, P < 2.2e-16; hypergeometric test), and the vast majority of these genes were first differentially expressed after induction of MYB48 and MYB59 by MeJA treatment (Supplemental Figure 9). This pattern suggests that these DEGs may be downstream targets of MYB48/MYB59 activity during induced JA signaling. The likelihood of such targeting was confirmed by the enrichment of the MYB binding motif in the promoter sequences of the downregulated DEG set, while the enrichment in the upregulated DEGs for the bHLH binding motif suggests a role for MYB48/MYB59 in attenuation of the MYC branch of the JA pathway.
Collectively, analysis of the transcriptomes of RAP2.6L-OX, anac055, and myb48 myb59 suggests that in the context of the JA gene regulatory network, the studied TFs play a role in specific biological processes by specific gene targeting. Thus, these three examples demonstrate the value of leveraging TF perturbation transcriptome data with our information-rich MeJA-induced data set to begin to explore specific transcriptional subnetworks, which better define the mechanistic function of individual TFs, and aids the holistic understanding of the JA gene regulatory network.
DISCUSSION
Our computational analyses of high-density time series of RNA-seq data obtained from Arabidopsis leaves of the same developmental stage (leaf number 6) allowed us to provide an unprecedentedly detailed insight into the architecture and dynamics of the JA gene regulatory network. Previously, studies on phytohormone-induced transcriptional responses have typically included only a limited number of time points or focused on the effect of perturbation of specific regulatory proteins on transcriptional activity in hormone-controlled gene regulatory networks (Tsuda et al., 2009; Nakata et al., 2013). Our time-series study shows that MeJA induces a burst of transcriptional activity that generates a variety of detailed temporal expression patterns that partition into specific gene clusters representing different biological processes (Figures 1, 2, and 4; Supplemental Figures 1 and 5). Differential expression analysis yielded a considerably more comprehensive MeJA-responsive gene set compared with previous transcriptomic studies (Figure 1), including a significant number of genes not represented on microarrays. In turn, this information yielded insights into the chronology and regulation of the biologically relevant JA response.
Network-Informed Discovery of Players in the JA Response
Using a dynamic network approach, we systematically determined how the diverse positive and negative regulatory components in the JA gene regulatory network function over time. MeJA-induced gene activation or repression was shown to be controlled by short transcriptional cascades, yet to yield distinctive transcriptional signatures that corresponded to specific sets of genes and biological processes (Figure 2). In general, it appeared that bHLH TFs are master regulators controlling the majority of the MeJA-inducible genes, while ERF and MYB TFs fine-tune the expression of dedicated sets of target genes in specific sectors of the gene regulatory network (Figures 2 to 4). Besides the known regulators of the JA pathway, several other TFs, whose functions were not previously linked to JA responses, were identified in the network. By using a guilt-by-association approach, 12 early MeJA-induced TFs with unknown roles in the JA response were selected for validation of their biological function in pathogen or insect resistance. Four of these (bHLH27, ERF16, MYB59, and ANAC056) were found to play a role in resistance against the pathogen B. cinerea and/or the insect M. brassicae (Figure 2), highlighting the high success rate of our approach in the discovery of biological functions of genes in the JA network. Collectively, our gene perturbation data provide an important starting point for the characterization of so far unexplored components of the JA gene regulatory network, while numerous other early- and late-expressed TF or enzyme-encoding genes still await further exploration for functionality.
Mutants in bHLH27 and the double mutant lacking MYB48 and MYB59 were more susceptible to B. cinerea, yet more resistant to M. brassicae (Figure 2). Although this necrotrophic pathogen and chewing insect both stimulate JA biosynthesis, many subsequently induced changes in JA-responsive gene expression are specifically directed to the different attackers and hence engage different TFs and downstream targets. This differential response is known to be coordinated by the mutually antagonistic ERF branch of the JA pathway, which is coregulated by ET, and the MYC branch of the JA pathway, which is coregulated by ABA (Pieterse et al., 2012). Several TFs have been documented to differentially affect MYC versus ERF branch-controlled gene expression and associated defenses. The best-known example of such a regulator is MYC2, a key positive regulator of MYC branch genes and associated defenses against chewing insects (e.g., Helicoverpa armigera and Spodoptera littoralis) (Dombrecht et al., 2007; Fernández-Calvo et al., 2011). By contrast, MYC2 negatively regulates defenses against necrotrophic pathogens (e.g., B. cinerea and Plectosphaerella cucumerina) (Lorenzo et al., 2004; Nickstadt et al., 2004). JA-inducible NAC TF family paralogs ANAC019 and ANAC055 show the same effect: they positively regulate MYC branch-associated genes and defenses to S. littoralis, while they antagonize ERF branch-associated resistance to B. cinerea (Bu et al., 2008; Schweizer et al., 2013). Conversely, a positive regulator of the ERF branch, ORA59, controls defenses to B. cinerea, while it antagonizes MYC branch defenses, and ORA59 overexpression lines become more attractive to P. rapae larvae (Pré et al., 2008; Verhage et al., 2011). Our data suggest that bHLH27 functions as a negative regulator of the MYC branch, which may enhance ERF branch activation, thereby influencing resistance to B. cinerea. Other bHLH TFs (so-called JAMs) have also been reported to antagonize MYC2-activated gene expression and defense to insects (Nakata et al., 2013; Sasaki-Sekimoto et al., 2013), but by contrast, ERF branch defense marker genes and resistance against B. cinerea were enhanced by the quadruple mutant lacking bHLH3 bHLH13 bHLH14 bHLH17 (Song et al., 2013). This finding indicates different underlying mechanisms of the different repressive bHLHs. MYB48 and MYB59 also antagonize the MYC branch as evidenced by the finding that the myb48 myb59 mutant showed not only enhanced resistance to M. brassicae, but also enhanced expression of MYC branch-associated genes (Figures 2E to 2G; Supplemental Data Sets 6 and 7). The transcriptome analysis of myb48 myb59 did not suggest that the reduced resistance to B. cinerea is due to MYB48/MYB59-mediated antagonism of ERF branch. It may be that downregulation of gene clusters enriched in specific secondary metabolism contributes toward compromised immunity in this mutant, but this awaits further functional analysis.
Uncovering Redundant Function by Double Mutant Analysis
Reverse genetic screens are an important approach in the study of gene functions in Arabidopsis, but when additional genes have either fully or partially redundant functions, which is often the case with TF genes, their utility can be limited (Bolle et al., 2011). Redundancy may partially explain why 8 out of the 12 T-DNA insertion lines of the predicted JA-responsive TF genes that were tested in this study did not display significant changes in JA-associated immunity. By specifically targeting the highly similar TF-encoding gene pair MYB48 and MYB59, we generated a double mutant that displayed a more severe perturbation of JA-associated gene expression and immunity compared with either single mutant (Figures 2E to 2G; Supplemental Figure 9). Use of higher-order mutants can be critical to understand TF gene regulatory functions.
Network Reconstruction Enables Prediction of Regulatory Interactions
Our time-series data discerned a chronology of 10 transcriptional phases, showing that the onset of upregulation preceded that of downregulation and that the first phase that was initiated within 15 min was represented by transcriptional regulators (Figure 4). JA biosynthesis was shown to be a first target for activation, followed by secondary metabolism, including activation of the tryptophan, glucosinolate, and anthocyanin biosynthesis pathways. This latter observation correlates with the later activation of many MYB TF genes, which are important regulators of secondary metabolism, and the enrichment of MYB DNA binding motifs in the upregulated genes in later phases. Downregulated genes showed enrichment in WRKY TF binding motifs, which is linked with the suppressed expression of SA-associated defense genes.
Integrating TF DNA binding motif enrichment data with our chronological JA network model predicted putative causal regulations between TFs and downstream JA-regulated subnetworks (Figures 5 and 6). Although subsets of the regulatory predictions were supported by the literature and by experimental validation in this study, the presented network model is not without limitations. Our approach does not consider potential nonlinear relationships between gene expression profiles and has limited ability to account for expression of genes that strongly depend on the joint activity of more than one TF. Thus, a future extension of the work presented here could be to utilize these data with more formal modeling approaches that better account for combinatorial regulation of targets and/or are capable of capturing nonlinear characteristics of the regulatory system, such as approaches based on mutual information or dynamic Bayesian networks (Margolin et al., 2006; Penfold and Wild, 2011). Even when focusing on transcriptional networks as we have done here, it is important to note that some TFs may not be regulated transcriptionally themselves and hence are absent from our analysis. Additional techniques such as ChIP-seq and yeast one-hybrid assay will help incorporate such regulators into the JA gene regulatory network model (Windram et al., 2014).
Data Set Integration Validates TF-Specific Regulatory Functions
Exploring the regulatory predictions between TF regulators and their target genes highlighted a local regulatory module centered around the early JA-responsive AP2/ERF TF ORA47. Based on the occurrence of the ORA47 DNA binding motif in their core promoters, we predicted that this TF targets a large fraction of genes encoding enzymes involved in JA biosynthesis in Arabidopsis (Figure 6A) and evolutionarily distant species (Figure 6B). Indeed, yeast one-hybrid experiments confirmed that ORA47 binds to promoter elements of JA biosynthesis genes (Supplemental Figure 7). Using transgenic lines that allow for the conditional expression of ORA47 upon β-estradiol treatment, we showed that induction of ORA47 expression significantly increases levels of JA and bioactive JA-Ile, indicating that ORA47 is an important activator of JA biosynthesis (Figure 6D). Recently, it was demonstrated that ORA47 could bind to the promoters of many of the JA biosynthesis genes reported here (Chen et al., 2016); however, the consequence for the expression of its target genes was only reported for a small subset. Using the β-estradiol conditional overexpression system allowed us to demonstrate that induction of ORA47 expression indeed leads to the activation of all seven important JA biosynthesis genes investigated (Figure 6C). Our in silico predictions combined with experimental validation underscore ORA47 as a central regulator of JA biosynthesis, which may form part of an evolutionarily conserved JA amplification loop (Figure 6B).
For many known and unknown JA-responsive TFs, their exact role in the JA gene regulatory network has remained unresolved. We show how integrating either existing or novel transcriptome data with our models of MeJA-mediated gene expression can generate hypotheses regarding the roles of specific transcriptional regulators in the context of the JA response. In particular, transcriptional profiling of plants overexpressing the MeJA-responsive TF RAP2.6L and subsequent overlay of the gene expression data onto our coexpression clusters led to the hypothesis that within the JA gene regulatory network RAP2.6L plays a role in the regulation of glucosinolate biosynthesis-associated genes (Figure 6E). A similar approach, using the established stress-associated TF ANAC055 and MYB48/MYB59 (highlighted in this study) confirmed and extended the predicted regulatory interactions with distinct downstream targets in the JA network model (Supplemental Figures 8 and 9). Specific coexpressed gene clusters in the JA network were shown to be affected in the TF-perturbed lines, highlighting the strength of our clustering analysis for inferring functional regulation mechanisms. A similar transcriptome overlay approach could be used in future studies to further define the roles of other JA-inducible TFs in the diverse JA subnetworks.
Summary
In sum, this study provides detailed insight into the dynamics and architecture of the JA gene regulatory network that is activated in Arabidopsis upon treatment with MeJA and rapidly develops a range of transient or longer-lasting expression changes in specific groups of coexpressed genes with distinct biological functions. Our information-rich data set offers a potentially high success rate for the discovery of genes with so far unknown functions in JA-regulated responses related to plant immunity, growth, and development. Future use of these time-series data could include integration with additional transcriptome data across diverse environmental conditions, together with other “omics” data sets, which will aid in building a comprehensive picture of the JA response.
METHODS
Plant Materials and Growth Conditions
All wild-type, mutant, and transgenic Arabidopsis thaliana plants used in this study are in the Columbia ecotype (Col-0) background, except for the RAP2.6L-OX line, which has the Wassilewskija (Ws) background. The following T-DNA insertion mutants and transgenic lines were obtained from the Nottingham Arabidopsis Stock Centre: ofp1 (At5g01840; SALK_111492C), myb59 (At5g59780; GK-627C09), anac056 (At3g15510; SALK_137131C), rap2.6l (At5g13330; SALK_051006C), rap2.6 (At1g43160; SAIL_1225G09), erf16(-1) (At5g21960; SALK_053563C), erf16-2 (At5g21960; SALK_096382C), at1g10586 (At1g10586; SALK_027725C), bhlh19 (At2g22760; GABI_461E05), bhlh27(-1) (At4g29930; SALK_049808C), bhlh27-2 (At4g29930; SALK_149244C), bhlh35 (At5g57150; SALK_100300C), bhlh92 (At5g43650; SALK_033657C), bhlh113 (At3g19500; GK_892H04), myb48 (At3g46130; SALK_103847), ora59 (Zander et al., 2014) (At1g06160; GK-061A12.16), and ORA47 β-estradiol-inducible TRANSPLANTA line (Coego et al., 2014) (N2101685). The myb48 and myb59 mutants were crossed to generate the myb48 myb59 double mutant. The myc2 myc3 myc4 (myc2,3,4) triple mutant (At1g32640/At5g46760/At4g17880) has been described previously (Fernández-Calvo et al., 2011). Seeds were stratified for 48 h in water at 4°C prior to sowing on river sand. After 2 weeks, the seedlings were transferred to 60-mL pots containing a soil:river sand mixture (12:5) that had been autoclaved twice for 1 h. Plants were cultivated in standardized conditions under a 10-h day (75 µmol/m2/s1) and 14-h night cycle at 21°C and 70% relative humidity. Plants were watered every other day and received modified half-strength Hoagland nutrient solution containing 10 mM Sequestreen (CIBA-GEIGY) once a week. To minimize within-chamber variation, all the trays, each containing a mixture of plant genotypes or treatments, were randomized throughout the growth chamber once a week. Mutants or treatments were indicated by colored labels of which the code was unknown by the experimenter. T-DNA insertion lines were confirmed homozygous for the T-DNA in the relevant genes with PCR using the gene-specific primers listed in Supplemental Table 1. The RAP2.6L-overexpressing line (RAP2.6L-OX) (Krishnaswamy et al., 2011) and the background accession (Ws) were cultivated as described previously (Windram et al., 2012).
RNA-Seq Experimental Setups
For the MeJA time series, 5-week-old Arabidopsis Col-0 plants were treated by dipping the rosette leaves into a mock or MeJA solution (Duchefa Biochemie). The mock solution contained 0.015% (v/v) Silwet L77 (Van Meeuwen Chemicals) and 0.1% ethanol. The MeJA solution contained 0.015% (v/v) Silwet L77 and 0.1 mM MeJA, which was added from a 1000-fold stock in 96% ethanol. For time-series expression analysis, leaf number 6 (counted from oldest true leaf to youngest leaf) was harvested from individual Arabidopsis plants and snap frozen in liquid nitrogen for each treatment and time point as indicated in Supplemental Data Set 1. Each individual leaf corresponds to one biological replicate and four biological replicates for each treatment and time point combination were sequenced (see below). For the comparison of the myb48 myb59 mutant with wild-type Col-0, two mature leaves (numbers 6 and 7) were harvested per plant from two 5-week-old plants per genotype, resulting in two biological replicates.
Induction of the ORA47 β-Estradiol-Inducible Line and Hormone Analysis
Five-week-old ORA47-inducible overexpression lines were treated by dipping the rosette leaves into a mock or β-estradiol solution (Sigma-Aldrich). The mock solution contained 0.015% (v/v) Silwet L77 and 0.1% DMSO. The β-estradiol solution contained 0.015% (v/v) Silwet L77 and 10 μM β-estradiol, which was added from a 1000-fold stock in DMSO.
Hormone analysis was performed as described previously (Vos et al., 2013). Briefly, for JA, JA-Ile, SA, and ABA quantification, 0.5 g of leaf tissue was ground to a fine powder using liquid nitrogen. Samples were homogenized in 0.5 mL of 70% methanol using a Precellys24 tissue homogenizer (Bertin Technologies) by shaking at 6000 rpm for 40 s. The resulting homogenates were centrifuged at 10,000g for 20 min at 4°C. Hormone levels were analyzed by liquid chromatography-mass spectrometry on a Varian 320 Triple Quad LC-MS/MS. JA and JA-Ile levels were calculated by correcting for the internal standard of JA and for leaf weight. ABA and SA levels were calculated by correcting for leaf weight and their respective internal standards.
Insect Performance and Disease Bioassays
Botrytis cinerea disease resistance was determined essentially as described previously (Van Wees et al., 2013). In brief, B. cinerea was grown on half-strength potato dextrose agar (Difco BD Diagnostics) plates for 2 weeks at 22°C. Harvested spores were incubated in half-strength potato dextrose broth (Difco) at a final density of 5 × 10⁵ spores/mL for 2 h prior to inoculation. Five-week-old plants were inoculated by placing a 5-μL droplet of spore suspension onto the leaf surface. Five leaves were inoculated per plant. Plants were maintained under 100% relative humidity with the same temperature and photoperiod conditions. Disease severity was scored 3 d after inoculation in four classes ranging from restricted lesion (<2 mm; class I), nonspreading lesion (2 mm) (class II), spreading lesion (2–4 mm; class III), up to severely spreading lesion (>4 mm; class IV). The distribution of disease categories between genotypes were compared using a χ2 test.
Mamestra brassicae eggs were obtained from the laboratory of Entomology at Wageningen University where they were reared as described previously (Pangesti et al., 2015). Per 5-week-old Arabidopsis plant, one freshly hatched first-instar (L1) larva was directly placed on a leaf using a fine paintbrush. Larval fresh weight was determined after 8 to 12 d of feeding. To confine the larvae, every plant was placed in a cup that was covered with an insect-proof mesh. Significant differences in larval weight between genotypes were determined using a two-tailed Student's t test.
High-Throughput RNA-Seq
Arabidopsis leaves were homogenized for 2 × 1.5 min using a mixer mill (Retsch) set to 30 Hz. Total RNA was extracted using the RNeasy Mini Kit (Qiagen) including a DNaseI treatment step in accordance with manufacturer's instructions. Quality of RNA was checked by determining the RNA integrity number using an Agilent 2100 Bioanalyzer and RNA 6000 Nano Chips (Agilent). For Illumina TruSeq RNA library preparation (see below), only RNA integrity number samples with a RIN value of ≥9 were used.
For the time-series experiment, RNA-seq library preparation and sequencing were performed by the UCLA Neuroscience Genomics Core. Sequencing libraries were prepared using the Illumina TruSeq mRNA sample prep kit and sequenced on the Illumina HiSeq 2000 platform with read lengths of 50 bases. In total, 12 randomized samples were loaded per lane of a HiSeq 2000 V3 flowcell, and each mix of 12 samples was sequenced in four different lanes over different flow cells to account for technical variation. A complete scheme of all biological replicates, technical replicates, bar-coding used per sample, lane and flow cell usage is provided in Supplemental Data Set 1. For each of the 15 time points, four biological replicates were sequenced in four technical replicates, resulting in ∼60 million reads per sample with a read length of 50-bp single end. Complete sequencing setup details can be found in Supplemental Data Set 1.
Basecalling was performed using the Casava v1.8.2. pipeline with default settings except for the additional argument ‘–use-bases-mask y50,y6n’ to provide an additional Fastq file containing the barcodes for each read in each sample. Sample demultiplexing was performed by uniquely assigning each barcode to sample references, allowing for a maximum of two mismatches (the maximum allowed by the barcode) and only considering barcode nucleotides with a quality score of 28 or greater.
For the analysis of the myb48 myb59 double mutant, RNA-seq library preparation and sequencing were performed by the Utrecht Sequencing Facility (The Netherlands). Sequencing libraries were prepared using the Illumina TruSeq mRNA stranded sample prep kit, and sequenced on the Illumina NextSeq5000 platform with read lengths of 75 bases.
The raw RNA-seq read data are deposited in the Short Read Archive (http://www.ncbi.nlm.nih.gov/sra/) and are accessible through accession numbers PRJNA224133 and PRJNA395645.
Processing of RNA-Seq Data
Read alignment, summarization, and normalization followed the pipeline as previously described (Van Verk et al., 2013). Reads were aligned to the Arabidopsis genome (TAIR version 10) using TopHat v2.0.4 (Trapnell et al., 2009) with the parameter settings: ‘transcriptome-mismatches 3’, ‘N 3’, ‘bowtie1’, ‘no-novel-juncs’, ‘genome-read-mismatches 3’, ‘p 6’, ‘read-mismatches 3’, ‘G’, ‘min-intron-length 40’, and ‘max-intron-length 2000’. Aligned reads were summarized over annotated gene models using HTSeq-count v0.5.3p9 (Anders et al., 2015) with settings: ‘-stranded no’ and ‘-i gene_id’. Sample counts were depth-adjusted using the median-count-ratio method available in the DESeq R package (Anders and Huber, 2010).
Differential Gene Expression Analysis
Genes that were significantly differentially expressed after MeJA treatment compared with mock were identified using a generalized linear model with a log link function and a negative binomial distribution. Within this model we considered both the time after treatment and the treatment itself as factors. To assess the treatment effect on the total read count for each gene, a saturated model (total counts ∼ treatment + time + treatment:time) was compared with a reduced model considering time alone (total counts ∼ time) using ANOVA with a χ2 test. For all genes, the P values obtained from the χ2 test were corrected for multiple testing using a Bonferroni correction. All genes that did not meet the following requirement were omitted from further analysis: a minimum 2-fold difference in expression on at least one of the 14 time points, supported by a minimum of 10 counts in the lowest expressed sample, and a P value ≤ 0.01 for that time point. Remaining genes with Bonferroni-corrected P value ≤ 0.05 were called as DEGs. All statistics associated with testing for differential gene expression were performed with R (http://www.r-project.org).
Of all the DEGs, the time point of first differential expression was predicted. To this end the significance of the treatment effect at each time point was obtained from the generalized linear model, represented by its z score. These values were used as a basis to interpolate the significance of the treatment effect in between the sampled time points. This was done using the interpSpline function in R using 249 segments. The first time point of differential expression was set where the z score was higher than 2.576 (equivalent of P value 0.01) for upregulation or lower than −2.576 for downregulation.
DEGs between Col-0 and myb48 myb59 (|log2-fold change| >1; false discovery rate ≤0.05) were identified using DESeq (Anders and Huber, 2010). For analysis of DEGs between Ws and RAP2.6L-OX see “Microarray Analysis of RAP2.6L Transgenic Plants.”
Clustering of Gene Expression Profiles
Clustering of DEGs was performed using SplineCluster (Heard et al., 2006) on the profiles of log2-fold changes at each time point (MeJA-treated versus mock), with a prior precision value of 10−4, the default normalization procedure, and cluster reallocation step (Heard, 2011). All other optional parameters remained as default.
TF Family and Promoter Motif Analyses
To determine which TF families were enriched among the genes differentially expressed in response to application of MeJA, we tested for overrepresentation of 58 TF families described in the TF database PlantTFDB version 3.0 (Jin et al., 2014). Overrepresentation of TF families within a set of genes was analyzed using the cumulative hypergeometric distribution, with the total number of protein coding genes (TAIR version 10) as the background. P values were corrected for multiple testing with the Bonferroni method.
For promoter motif analysis, the promoter sequences defined as the 500 bp upstream of the predicted transcription start site were retrieved from TAIR (version 10). De novo promoter motifs were identified by applying the motif-finding programs MEME (Bailey and Elkan, 1994) and XXmotif (Hartmann et al., 2013) to the promoters of all genes present in a given coexpression cluster. This approach exploited the strengths of different motif-finding strategies, which has been demonstrated to improve the quality of motif detection (Tompa et al., 2005). Both algorithms searched for motifs on the forward and reverse strands and used the zero-or-one occurrences per sequence (ZOOPS) motif distribution model. MEME was run using a 3rd-order Markov model learned from the promoter sequences of all genes in the Arabidopsis genome, using parameter settings ‘-minw 8 -maxw 12 -nmotifs 10’. XXmotif was run using a 3rd-order Markov model and the medium similarity threshold for merging motifs, with all other parameters kept as default. This analysis yielded a large number of motifs, many of which were highly similar. To reduce redundancy among motifs, a postprocessing step was performed using the TAMO software package (Gordon et al., 2005). Motifs were converted to TAMO format, clustered using the UPGMA algorithm, and merged to produce consensus motifs. The set of processed motifs was converted to MEME format for all subsequent analyses using the tamo2meme function available in the MEME Suite (Bailey et al., 2009). For the analysis of known motifs originating from PBM studies (Franco-Zorrilla et al., 2014; Weirauch et al., 2014), the published weight matrices were converted into MEME format.
The presence or absence of a given motif within a promoter was determined using FIMO (Grant et al., 2011). A promoter was considered to contain a motif if it had at least one match with a P value ≤ 10−4. For each de novo- and PBM-derived motif, the statistical enrichment of each motif within the promoters of coexpression gene clusters or transcriptional phases was tested using the cumulative hypergeometric distribution. This test computed the probability that a motif was present within a set of promoter sequences at a frequency greater than would be expected if the promoters were selected at random from the Arabidopsis genome.
Analysis of the ORA47 DNA binding motif conservation across different plant species was performed using the promoters of genes orthologous to Arabidopsis AOC2, AOS, OPR3, and LOX3. Orthologs were identified in Vitis vinifera, Populus trichocarpa, and Brassica rapa genomes (Ensembl database release 25) using the reciprocal best BLAST hit method (Tatusov et al., 1997). Presence or absence of the ORA47 motif in the promoters (500 bp upstream of predicted transcription start site) of these orthologous genes was determined using FIMO as described above.
GO Analysis
GO enrichment analysis on gene clusters was performed using GO term finder (Boyle et al., 2004) and an Arabidopsis gene association file downloaded from ftp.geneontology.org on May 2, 2013. Overrepresentation for the GO categories “biological process” and “molecular function” was identified by computing a P value using the hypergeometric distribution and false discovery rate for multiple testing (P ≤ 0.05).
Identification of Chronological Phases in MeJA-Induced Gene Expression
To identify phases of MeJA-induced changes in transcription, we first divided all DEGs depending on whether they were either up- or downregulated in response to MeJA and then further according to their function as either a transcriptional regulator (termed regulator genes) or having a different function (termed regulated genes). To identify DEGs that encode transcriptional regulators, we used the comprehensive list of Arabidopsis TFs and transcriptional regulators described by Pruneda-Paz et al. (2014) and subjected it to minor additional manual literature curation. This filtering yielded four mutually exclusive sets of MeJA-responsive genes (i.e., regulator genes up and down, regulated genes up and down). For each of the four gene sets, the depth-normalized expression values (see above) for all pairs of time points were compared pairwise using the Pearson correlation measure. Each resulting correlation matrix was then clustered using the Euclidean distance measure with average linkage. The resulting dendrograms were used to infer distinct phases of MeJA-induced transcription, where each phase had a start and end time. Each gene present in one of the four final gene sets was assigned to a transcriptional phase based on its time point of first differential expression (Supplemental Figure 5). All genes that were for the first time differentially expressed before, or equal to, the final time point in a given phase (clustered group of time points), and after the final time point of a preceding phase, were assigned to that transcriptional phase (see Supplemental Figure 6 for overview of the method).
Network Construction
The identification of potential regulatory network connections between TFs and transcriptional phases was performed with a set of TFs that met two criteria: (1) They were differentially expressed in response to application of MeJA (and thus belonged to a phase). (2) They had an annotated DNA binding motif (as described in “TF family and promoter motif analyses”). Each set of genes that constituted a transcriptional phase (10 phases in total) was tested for overrepresentation of each motif using the hypergeometric distribution as described above. A directional edge was drawn from a TF to a phase when its cognate binding motif was overrepresented in the promoters of genes belonging to that phase (hypergeometric distribution; P ≤ 0.005). The resulting network was visualized using Cytoscape (Shannon et al., 2003).
qRT-PCR Analysis
For qRT-PCR, RNA was extracted as previously described (Oñate-Sánchez and Vicente-Carbajosa, 2008) and subsequently treated with DNaseI (Fermentas) to remove genomic DNA. Genomic DNA-free total RNA was reverse transcribed by using RevertAid H minus reverse transcriptase (Fermentas). PCR reactions were performed in optical 384-well plates with a ViiA 7 real-time PCR system (Applied Biosystems), with SYBR Green (Applied Biosystems). A standard thermal profile was used: 50°C for 2 min, 95°C for 10 min, followed by 40 cycles of 95°C for 15 s and 60°C for 1 min. Amplicon dissociation curves were recorded after cycle 40 by heating from 60 to 95°C with a ramp speed of 0.05°C/s. All primers used for qRT-PCR are listed in Supplemental Table 1. The gene At1g13320 was used as reference for normalization of expression (Czechowski et al., 2004).
Microarray Analysis of RAP2.6L Transgenic Plants
Total RNA was extracted from three leaves per plant (28 d old), labeled and hybridized to CATMA v4 arrays (Allemeersch et al., 2005) as described previously (Breeze et al., 2011). Three biological replicates of Ws and RAP2.6L-OX samples were pooled separately and labeled three times with each dye to give six technical replicates. Analysis of expression differences between Ws and RAP2.6L-OX was performed with the R Bioconductor package limmaGUI (Wettenhall and Smyth, 2004) using Print-Tip lowess transformation and quantile normalization. The data set is available in the Gene Expression Omnibus under accession number GSE90601.
Yeast One-Hybrid Protein-DNA Interaction Assays
Cloning of bait promoter DNA and yeast transformation were performed as previously described (Hickman et al., 2013). All primers that were used to clone promoter fragments of AOC1, AOC3, and LOX3 are listed in Supplemental Table 1. ORA47 coding sequence was isolated from the TF library as described by Hickman et al. (2013) and the correct sequence confirmed by sequencing. Prey strains were constructed by cloning the ORA47 coding sequence into pDEST22 (Invitrogen) and transforming AH109 yeast (Clontech), while empty pDEST22 was used to transform AH109 as a negative control. Three microliters of bait strain cultures were spotted onto YPDA (yeast, peptone, dextrose, adenine) plates and dried before being overlaid with 3 μL of prey strain culture and left to grow overnight at 30°C. Colonies were subcultured in 1 mL of mating selective medium (SD-Leu-Trp; Clontech) and grown for two nights at 30°C with shaking. Cultures were diluted to 108 cells/mL in SD-Leu-Trp liquid medium before four 10-fold serial dilutions were made. Three microliters of each diploid strain was plated to mating selective (SD-Leu-Trp; Clontech) and interaction selective media (SD-Leu-Trp-His; Clontech) and incubated at 30°C for 72 h before being photographed using a G:Box EF2 (Syngene). For promoter D, 5 mM 3-aminotriazole (Sigma-Aldrich) was required to suppress autoactivation of HIS3 expression by this promoter region. For promoters A, B, and D, experiments were performed using two independent promoter transformants and four TF transformants, for a total of eight replicates. For promoter C, there were three replicates across two independent promoter transformants and two TF transformants.
Accession Numbers
Arabidopsis gene names and identifiers referred to in this article are as follows: OFP1 (At5g01840), MYB59 (At5g59780), MYB48 (At3g46130), ANAC056 (At3g15510), RAP2.6L (At5g13330), RAP2.6 (At1g43160), ERF16 (At5g21960), AT1G10586 (At1g10586), bHLH19 (At2g22760), bHLH27 (At4g29930), bHLH35 (At5g57150), bHLH92 (At5g43650), bHLH113 (At3g19500), COI1 (At2g39940), AOS (At5g42650), AOC1 (At3g25760), AOC3 (At3g25780), LOX2 (At3g45140), LOX3 (AT1G17420), OPR3 (At2g06050), JAR1 (At2g46370), JAZ1 (At1g19180), JAZ2 (At1g74950), JAZ3 (At3g17860), JAZ4 (At1g48500), JAZ5 (At1g17380), JAZ6 (At1g72450), JAZ7 (At2g34600), JAZ8 (At1g30135), JAZ9 (At1g70700), JAZ10 (At5g13220), JAZ11 (At3g43440), JAZ12 (At5g20900), MYC2 (At1g32640), bHLH003 (At4g16430), bHLH013 (At1g01260), bHLH014 (At4g00870), bHLH017/JAM1 (At2g46510), MYC3 (At5g46760), MYC4 (At4g17880), MYB29 (At5g07690), ANAC019 (At1g52890), ANAC055 (At3g15500), NINJA (At4g28910), RGL3 (At5g17490), ORA47 (At1g74930), ORA59 (At1g06160), VSP1 (At5g24780), VSP2 (At5g24770), NPR4 (At4g19660), MYB51 (At1g18570), EDS1 (At3g48090), and PAD4 (At3g52430). RNA-seq data, including gene accession numbers, are available in the NCBI Short Read Archive under accession numbers PRJNA224133 (MeJA time series) and PRJNA395645 (Col-0 and myb48 myb59). RAP2.6L-OX microarray data are available in the Gene Expression Omnibus under accession number GSE90601.
Supplemental Data
Supplemental Figure 1. SplineCluster analysis of MeJA-responsive gene expression profiles.
Supplemental Figure 2. B. cinerea disease severity assay with selected mutant lines.
Supplemental Figure 3. B. cinerea disease severity and growth of M. brassicae larvae on additional mutant alleles.
Supplemental Figure 4. Growth of M. brassicae larvae on selected mutant lines.
Supplemental Figure 5. Timing of differential expression for all differentially expressed genes.
Supplemental Figure 6. Identification of transcriptional phases induced in response to MeJA treatment.
Supplemental Figure 7. ORA47 can bind to the promoters of multiple Arabidopsis genes encoding JA biosynthesis enzymes in yeast.
Supplemental Figure 8. Projection of ANAC055 target genes on the JA network model.
Supplemental Figure 9. Projection of MYB48/MYB59 target genes on the JA network model.
Supplemental Table 1. List of primers used for genotyping of T-DNA mutants, qRT-PCR analysis, and promoter cloning for Y1H assays.
Supplemental Data Set 1. Time series experimental setup and mRNA sequencing details.
Supplemental Data Set 2. Median-count ratio normalized expression values of all genes and biological replicates for t = 0 h and the 14 time points after MeJA and mock treatments.
Supplemental Data Set 3. Mean expression values for all genes across the time series following MeJA treatment.
Supplemental Data Set 4. Arabidopsis Gene Identifier codes for members of each of the 27 gene coexpression clusters identified by SplineCluster.
Supplemental Data Set 5. GO terms overrepresented in each of the 27 coexpression gene clusters.
Supplemental Data Set 6. Lists of genes differentially expressed in myb48 myb59 compared with Col-0.
Supplemental Data Set 7. GO terms overrepresented in the upregulated and downregulated myb48 myb59 differentially expressed gene sets.
Supplemental Data Set 8. Enrichment of known TF DNA binding motifs in each of the 27 coexpression gene clusters.
Supplemental Data Set 9. De novo-derived motif enrichment in each of the 27 gene coexpression clusters.
Supplemental Data Set 10. De novo-derived sequence motifs in Weblogo and position weight matrix format.
Supplemental Data Set 11. Arabidopsis Gene Identifier codes for members of each of the 10 transcriptional phases that are initiated after MeJA treatment.
Supplemental Data Set 12. GO terms overrepresented in each of the 10 transcriptional phases that are initiated after MeJA treatment.
Supplemental Data Set 13. Known TF DNA binding motif enrichment in each of the 10 transcriptional phases that are initiated after MeJA treatment.
Supplemental Data Set 14. De novo-derived motif enrichment in each of the 10 transcriptional phases that are initiated after MeJA treatment.
Supplemental Data Set 15. List of differentially expressed TF genes and enrichment of their corresponding TF DNA binding motif in the promoters of genes within a transcriptional phase.
Supplemental Data Set 16. List of differentially expressed genes obtained from microarray analysis of RAP2.6L-OX.
Supplemental File 1. Gene ID-searchable significance of differential expression over time for all DEGs in the 27 clusters of coexpressed genes in response to MeJA treatment.
Acknowledgments
We thank Leon Westerd from the laboratory of Entomology at Wageningen University for providing M. brassicae eggs. The RAP2.6L-OX line and background accession (Ws) were obtained from Nataraj Kav (University of Alberta, Edmonton, Canada). This work was supported by the Netherlands Organization for Scientific Research through the Dutch Technology Foundation (VIDI 11281 to S.C.M.V.W. and VENI 13682 to R.H.), by the European Research Council (Grant 269072 to C.M.J.P.), by the CAPES Foundation, Ministry of Education of Brazil (DF 70040-020 to M.P.M.), by Biotechnology and Biological Sciences Research Council (BBSRC) Grants BB/F005806/1 (to K.D.) and BB/M017877/1 (to K.D. and A.T.), by the Engineering and Physical Sciences Research Council/BBSRC-funded Warwick Systems Biology Doctoral Training Centre (A.J.), and by a BBSRC Systems Approaches to Biological Research studentship (J.R.).
Glossary
- JA
jasmonic acid
- SA
salicylic acid
- ET
ethylene
- ABA
abscisic acid
- TF
transcription factor
- MeJA
methyl JA
- DEG
differentially expressed gene
- GO
Gene Ontology
- PBM
protein binding microarray
AUTHOR CONTRIBUTIONS
S.C.M.V.W. and C.M.J.P. conceived the approach and designed the study with R.H. and M.C.V.V. R.H. and M.C.V.V. designed all bioinformatics approaches. K.D. provided analytical and intellectual contributions. R.H. and M.C.V.V. performed data analysis. R.H., M.C.V.V., A.J.H.V.D., M.P.M., I.A.V.-V., L.C., M.S., G.J.W., and I.V.d.N. performed mutant genotyping and validation experiments. M.D.V. and R.C.S. performed hormone measurements. A.J. and A.T. performed yeast one-hybrid assays. J.R. performed microarray experiments. R.H., M.C.V.V., C.M.J.P., and S.C.M.V.W. wrote the manuscript. All authors discussed the results and commented on the manuscript.
References
Author notes
These authors contributed equally to this work.
Address correspondence to [email protected].
The author responsible for distribution of materials integral to the findings presented in this article in accordance with the policy described in the Instructions for Authors (www.plantcell.org) is: Saskia C.M. Van Wees ([email protected]).

Articles can be viewed without a subscription.
