


Abstract
The branched-chain amino acids (BCAAs) Ile, Val, and Leu are essential nutrients that humans and other animals obtain from plants. However, total and relative amounts of plant BCAAs rarely match animal nutritional needs, and improvement requires a better understanding of the mechanistic basis for BCAA homeostasis. We present an in vivo regulatory model of BCAA homeostasis derived from analysis of feedback-resistant Arabidopsis thaliana mutants for the three allosteric committed enzymes in the biosynthetic network: threonine deaminase (also named l-O-methylthreonine resistant 1 [OMR1]), acetohydroxyacid synthase small subunit 2 (AHASS2), and isopropylmalate synthase 1 (IPMS1). In this model, OMR1 exerts primary control on Ile accumulation and functions independently of AHAS and IPMS. AHAS and IPMS regulate Val and Leu homeostasis, where AHAS affects total Val+Leu and IPMS controls partitioning between these amino acids. In addition, analysis of feedback-resistant and loss-of-function single and double mutants revealed that each AHAS and IPMS isoenzyme contributes to homeostasis rather than being functionally redundant. The characterized feedback resistance mutations caused increased free BCAA levels in both seedlings and seeds. These results add to our understanding of the basis of in vivo BCAA homeostasis and inform approaches to improve the amount and balance of these essential nutrients in crops.
INTRODUCTION
The branched-chain amino acids (BCAAs) Ile, Val, and Leu are essential nutrients, which humans and other animals must obtain from their diets (Binder et al., 2007). Besides their roles as building blocks of protein, BCAAs function as signaling molecules in animals, and BCAA supplementation helps to prevent oxidative damage and supports cardiac and skeletal muscle mitochondrial biogenesis (Valerio et al., 2011). In plants, BCAAs and their derivatives contribute to growth, defense, and the production of food flavor components (Kang et al., 2006; Yoshikawa et al., 1995; Zeier, 2013; Kimball and Jefferson, 2006; Gonda et al., 2010; Galili et al., 2016). In addition, BCAA catabolism provides an alternative source of energy in plants under long-term dark treatment conditions (Peng et al., 2015; Kochevenko et al., 2012). Moreover, acetohydroxyacid synthase (AHAS), the committed enzyme of Val biosynthesis, is the target of four classes of commercial herbicides, and numerous plant herbicide resistance AHAS alleles have been reported (Jander et al., 2003). In addition to an essential role in protein synthesis, BCAA metabolism provides precursors for specialized metabolism; for example, variants derived from isopropylmalate synthase (IPMS), the committed enzyme in Leu biosynthesis, contribute to specialized metabolism in Arabidopsis thaliana (de Kraker and Gershenzon, 2011) as well as cultivated (Solanum lycopersicum) and wild tomatoes (Solanum pennellii) (Ning et al., 2015). Thus, this metabolic network (Figure 1) contributes directly and indirectly to plant defense, growth, and metabolic diversity along with animal nutrition.
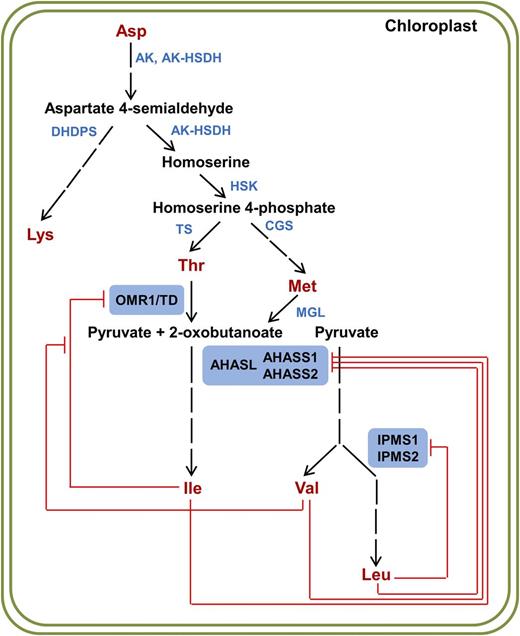
BCAA Biosynthetic Pathway with Documented in Vitro Allosteric Inhibition.
The three committed enzymes in BCAA biosynthesis are highlighted with blue boxes. Known in vitro feedback inhibition by end products is shown with red bars. AK, aspartate kinase; AK-HSDH, aspartate kinase/homoserine dehydrogenase; DHDPS, dihydrodipicolinate synthase; HSK, homoserine kinase; TS, threonine synthase; CGS, cystathionine γ-synthase; MGL, methionine γ-lyase; OMR1, l-O-methylthreonine resistant 1; TD, threonine deaminase; AHASL, acetohydroxyacid synthase large subunit; AHASS1 and AHASS2, acetohydroxyacid synthase small subunit 1 and 2; IPMS1 and IPMS2, isopropylmalate synthase 1 and 2.
Despite their importance, BCAAs and other essential amino acids are present in limiting amounts in major crops used for human consumption and animal feed (Ufaz and Galili, 2008). Overaccumulation of amino acids leads to various toxic effects on growth and development in Arabidopsis, indicating the importance of amino acid homeostasis (Phillips et al., 1981; Angelovici et al., 2009; Zhu and Galili, 2003). Biosynthesis and catabolism both play roles in BCAA regulation in plants (Galili et al., 2016). Arabidopsis mutants blocked in BCAA degradation accumulate BCAAs in seeds of plants grown under standard environmental conditions (Angelovici et al., 2013; Gu et al., 2010; Lu et al., 2011) and in leaves of dark-treated plants (Peng et al., 2015; Araújo et al., 2010), implicating BCAA catabolism in seed BCAA homeostasis and as an alternative energy source under energy-deprived conditions. These catabolic enzymes are coregulated at steady state mRNA level under diel and extended darkness conditions as well as during seed development, consistent with the mutant results (Peng et al., 2015; Uygun et al., 2016). While less is known about the importance of genetic regulation of BCAA biosynthetic enzymes, the activities of committed enzymes of the BCAA network are sensitive to in vitro regulation by amino acid products (Less and Galili, 2008; Pratelli and Pilot, 2014). Such allosteric mechanisms could play an important role in BCAA homeostasis; however, relatively little is known about their in vivo importance.
Plants synthesize BCAAs in the chloroplast through a metabolic network conserved from bacteria to flowering plants (Diebold et al., 2002; Ellerström et al., 1992; Binder, 2010; Curien et al., 2008) (Figure 1). Ile is synthesized from the Asp-derived amino acid biosynthetic pathway with Thr as an intermediate. Val is derived from pyruvate, and this pathway shares four common catalytic enzymes with Ile biosynthesis. Leu biosynthesis branches off before the final transamination step of Val biosynthesis. In Arabidopsis, the three committed enzymes in BCAA biosynthesis, threonine deaminase (referred to in this work as OMR1 for l-O-methylthreonine resistant 1), AHAS, and IPMS, are feedback regulated, as demonstrated in vitro for Arabidopsis (Mourad and King, 1995; de Kraker et al., 2007; Chen et al., 2010; Lee and Duggleby, 2001). OMR1 activity is inhibited by Ile, and Val antagonizes this inhibition (Halgand et al., 2002; Garcia and Mourad, 2004). In addition, Leu is mildly inhibitory to OMR1 in vitro (Mourad and King, 1995). The two IPMS isoenzymes IPMS1 and IPMS2 are both subject to Leu inhibition in vitro (de Kraker et al., 2007). In contrast to OMR1 and IPMS enzymes, with catalytic and regulatory domains on single proteins, the active plant AHAS enzyme is a α2β2-type heterotetramer formed by the large catalytic subunit AHASL and the small regulatory subunits AHASS1 and AHASS2 (McCourt and Duggleby, 2006). Binding of the small subunits stimulates AHASL activity and confers it with BCAA sensitivity. In vitro assays revealed that the AHASS1 isoform is sensitive to all three BCAAs (Lee and Duggleby, 2001), and the AHASS2 isoform is sensitive to Val (Chen et al., 2010); however the effects of Leu and Ile on AHASS2 are not known. These regulatory effects are conferred through evolutionarily conserved ACT (aspartate kinase, chorismate mutase, and TyrA) domains in the allosteric regions of OMR1, AHASS1, and AHASS2 or ACT-like domains in IPMS1 and IPMS2 (Chipman and Shaanan, 2001).
Despite extensive work on in vitro end-product regulation of OMR1, AHAS, and IPMS, relatively little is known about the in vivo importance of allosteric regulation in BCAA homeostasis. A feedback-resistant mutation in OMR1 caused up to 20-fold free Ile accumulation in Arabidopsis seedlings (Mourad and King, 1995), whereas a Val-tolerant AHASS2 mutant enzyme led to 2- to 3-fold increase in free Val and Leu (Chen et al., 2010), suggesting that the biosynthesis of Ile may be regulated independently from that of Val and Leu. These studies demonstrate the power of forward-genetic selection for mutants with relaxed allosteric control, while leaving important questions to be answered. For example, what is the in vivo role of IPMS in regulating Leu homeostasis and how does allosteric regulation of the three committed enzymes interact to regulate BCAA homeostasis? How does each of the AHASS and IPMS isoforms contribute to allosteric regulation and overall in vivo enzyme activity? What is the relative importance of allosteric regulation in BCAA homeostasis in vegetative and reproductive tissues?
To address these questions, we performed a genetic dissection of the committed enzymes of the BCAA metabolic network. Forward-genetic screens in Arabidopsis using toxic Ile and Leu analogs led to the identification of dominant inhibitor-resistant mutants of OMR1, IPMS1, and the AHAS small subunit AHASS2 gene. Recessive T-DNA insertion mutations were identified and characterized in each of the AHASS and IPMS genes. Analysis of free amino acids in seedlings of single and double mutants provided evidence that OMR1 primarily regulates Ile accumulation and functions independently of AHAS and IPMS. We demonstrated that the joint action of AHAS and IPMS maintains Val and Leu homeostasis, with the former affecting the overall flux into the two pathways and the latter controlling partitioning between them. Moreover, evidence was obtained that both AHAS isoenzymes contribute to Val+Leu accumulation, while IPMS1 appears to be more important for Val/Leu partitioning than IPMS2. In addition to documenting BCAA in vivo regulatory mechanisms, these results inform transgenic, genome editing, and breeding approaches to produce crops with balanced essential amino acids.
RESULTS
Identification of Amino Acid Analog-Resistant Mutants
Two forward-genetic selections were used to isolate mutants with altered regulation of BCAA biosynthesis. The first used the toxic l-leucine analog, 5,5,5-trifluoro-dl-leucine (TFL), while the other employed the toxic l-isoleucine analog, l-O-methylthreonine (OMT). EMS-mutagenized seeds from the Columbia-0 (Col-0) accession were sown under the lowest concentrations of compound that completely inhibited the growth of Col-0 (Figure 2). Thirty TFL-resistant and nine OMT-resistant putative mutants were identified, rescued to sterile nutrient agar plates lacking inhibitor, and then allowed to self-pollinate in soil-less mix. Three classes of mutants were anticipated: enzymes with altered allosteric regulation or catalytic function, variants that have modified genetic regulation of one or more enzyme in BCAA biosynthesis, or plants defective in inhibitor uptake.
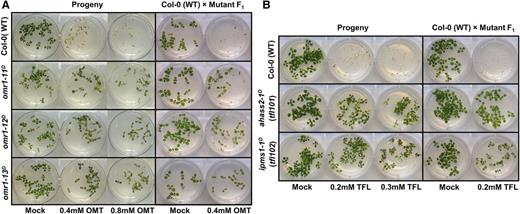
OMT- and TFL-Resistant Mutations Are Heritable and Behave as Dominant.
(A) omr1D mutant analysis.
(B) ahass2-1D and ipms1-1D mutant analysis.
Homozygous M3 or heterozygous F1 plants were tested for inhibition with the selective agent used in the isolation of the original inhibitor-resistant lines. Heterozygous F1 plants were generated by crossing the M3 mutant lines with Col-0 wild type. Photographs were taken 1 week after stratification.
We hypothesized that feedback-resistant mutants would carry dominant mutations in allosteric domains of enzymes at committed steps (Mourad and King, 1995; Rognes et al., 1983; Chen et al., 2010; Li and Last, 1996). Three enzymes of Asp-derived and BCAA biosynthesis are documented to be inhibited in vitro by Leu (Figure 1). These are IPMS (IPMS1 and IPMS2), the AHAS regulatory small subunit 1 (AHASS1), and the bifunctional aspartate kinase/homoserine dehydrogenase I (AK-HSDH I) (de Kraker et al., 2007; Curien et al., 2005; Lee and Duggleby, 2001). Sequencing the allosteric domains of these four genes as well as the AHASS2 gene revealed single nucleotide mutations in 29 of the 30 TFL-resistant putative mutants. A total of nine different missense mutations were identified: six in AHASS2 and three in IPMS1 (Supplemental Table 1). Ile inhibits Arabidopsis threonine deaminase and AHASS1 in vitro (Mourad and King, 1995; Lee and Duggleby, 2001). The allosteric regions in OMR1, AHASS1, and AHASS2 were sequenced and analyzed from the nine OMT-resistant mutants. We found four different missense changes in the ACT allosteric domains of OMR1 gene in five of these lines (Supplemental Table 1). Surprisingly, the ahass2-1D mutation (in the TFL-resistant mutants tfl101 and tfl106) was reisolated in the weakly OMT-resistant line omt4 (Supplemental Table 1). No mutation was identified in IPMS2 or AHASS1.
Genetic Analysis of Inhibitor-Resistant Mutants
Genetic analysis was performed on strong OMT- and TFL-resistant alleles to test whether the mutations identified in OMR1, AHASS2, and IPMS1 are heritable and genetically linked to the inhibitor resistance trait. The three strongest OMT-resistant mutants—omr1-11D, omr1-12D, and omr1-13D—were chosen along with two TFL-resistant alleles, ahass2-1D (found in tfl101 and tfl106) and ipms1-1D (carried by tfl102 and tfl111) (Table 1). These tfl mutant lines showed stronger TFL resistance than alleles with other mutations in each gene and were found in multiple mutants from independent seed pools, consistent with the hypothesis that these mutations cause the inhibitor resistance phenotype (Supplemental Table 1). Self-crossed progeny were germinated on nutrient plates with varying concentrations of OMT or TFL; the results indicated that all of the mutant phenotypes are heritable (Figure 2). The mutants were then crossed with Col-0 wild type: the F1 plants grew in the presence of 0.4 mM OMT or 0.2 mM TFL, consistent with the hypothesis that these mutations are dominant. The F1 plants showed intermediate inhibitor resistance compared with the homozygous mutant parents (Figure 2), a characteristic observed for other amino acid analog feedback-insensitive mutants (Mourad and King, 1995; Rognes et al., 1983; Li and Last, 1996).
OMT- and TFL-Resistant Mutants Selected for Detailed Characterization
| Mutant ID | Mutation | Amino Acid Substitution | No. of Mutants Carrying Mutation | No. of Seed Pools | Domain Affected |
|---|---|---|---|---|---|
| omr1-11D | C to T | Pro519Leu | 2 | 2 | ACT2 |
| omr1-12D | C to T | Ala551Val | 1 | 1 | ACT2 |
| omr1-13D | G to A | Arg544His | 1 | 1 | ACT2 |
| ahass2-1D | C to T | Ser349Phe | 3 | 2 | ACT2 |
| ipms1-1D | G to A | Gly606Glu | 2 | 2 | C-term |
To test the hypothesis that the mutations in OMR1, AHASS2, and IPMS1 are genetically linked to the observed inhibitor resistance, the mutants were crossed with Landsberg erecta (Ler) and F2 cosegregation analysis performed (Jander et al., 2002). The F2 plants that grew on nutrient agar plates containing 0.6 mM OMT or 0.3 mM TFL were genotyped using PCR assays that detect OMR1 (CAPS1-1), AHASS2 (CAPS2-1), IPMS1 (CAPS3-1), and marker AMU-4-272, which is unlinked to any of the candidate genes. As expected for linked dominant mutations, only homozygous Col-0 and heterozygotes were identified in the resistant F2 plants using the OMR1-, AHASS2-, or IPMS1-linked markers in the corresponding populations (Supplemental Table 2). In contrast, the unlinked AMU-4-272 marker showed a segregation ratio of roughly 1:2:1 for homozygous Col-0 and heterozygous and homozygous Ler genotypes in all five F2 populations (Supplemental Table 2). These results demonstrate cosegregation of mutations in candidate genes and the inhibitor resistance traits, consistent with the hypothesis that the sequenced mutations are causal.
OMR1D Enzyme Activities Are Resistant to Ile in Vitro
As shown in Figure 3, the amino acid substitutions found in OMT-resistant mutants omr1-11D, omr1-12D, and omr1-13D are located in the second ACT domain at sites that are conserved in land plants (OMR1-12D) or across all sequences analyzed (OMR1-11D and OMR1-13D) (Figures 3A and 3B). Homology modeling of the OMR1 C-terminal regulatory region, containing the two ACT domains, revealed that the three amino acid changes reside in regions predicted to link two antiparallel β-sheets (OMR1-12D and OMR1-13D) or α-helix and β-sheet domains (OMR1-11D) (Figure 3C).
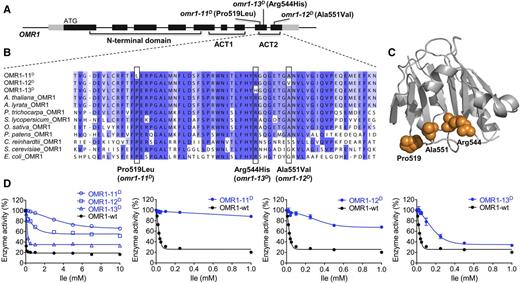
Characterization of OMR1D Mutant Enzymes.
(A) Schematic representation of the OMR1 gene structure; gray and black rectangles represent transcribed and untranslated regions and protein-coding regions, respectively.
(B) Sequence alignment of the ACT2 domain area that includes the OMR1D mutations. Positions of the Pro519Leu, Ala551Val, and Arg544His amino acid substitutions in OMR1-11D, OMR1-12D, and OMR1-13D are indicated with black boxes.
(C) Homology model of OMR1 C-terminal regulatory domain, predicting the positions of the mutant amino acid sites. The structural model was generated using the Phyre2 online server (Kelley et al., 2015) with E. coli threonine deaminase structure (1TDJ) as the template (Gallagher et al., 1998).
(D) Ile inhibition analysis of wild-type OMR1 and OMR1D variants. Enzyme activity is shown as the percentage of activity without Ile. Error bars represent sd of three technical replicates (using the same sample). The substrate Thr was added to a final concentration of 40 mM in these assays. Refer to Methods for more details.
In vitro enzyme assays revealed that the amino acid substitutions in OMR1-11D, OMR1-12D, and OMR1-13D reduced the Ile feedback sensitivity of the OMR1 protein. Escherichia coli-expressed purified recombinant wild-type and mutant OMR1 proteins were tested for Ile inhibition and catalytic efficiency. The three OMR1D protein activities showed increased Ile resistance up to 10 mM, the maximum tested (Figure 3D). At 1 mM Ile, ∼90, ∼70, and ∼30% residual activity was observed for OMR1-11D, OMR1-12D, and OMR1-13D, respectively, and all were more resistant than the wild-type enzyme, which showed ∼20% residual activity in the presence of 1 mM Ile (Figure 3D). Kinetic analysis revealed minor differences between the OMR1D enzymes and the wild type in the absence of Ile (Supplemental Table 3). Only OMR1-12D had modestly increased catalytic efficiency with a K cat /K m of 7.7 s−1 mM−1 compared with 5.2 s−1 mM−1 for the wild-type enzyme. Taken together with the genetics, these results provide strong evidence that the mutations identified in the omr1D mutants cause Ile feedback resistance through alteration of the second ACT protein domain.
Altered BCAA Sensitivity Is Associated with ahass2-1D TFL-Resistant Mutant
We asked whether the ACT2 Ser349Phe ahass2-1D amino acid change influenced the AHAS enzyme catalytic activity or allosteric control. As shown in Figure 4, amino acid Ser-349 is conserved from E. coli to flowering plants (Figures 4A and 4B), suggesting that it influences enzyme activity or regulation. Because the active AHAS enzyme comprises both large and small subunits, E. coli-expressed recombinant wild-type AHASL (the catalytic large subunit) and AHASS2 (regulatory small subunit 2) variants, expressed in frame with N-terminal GST tags to improve accumulation of soluble protein, were reconstituted into active enzyme complexes and tested in vitro (McCourt and Duggleby, 2006). The reconstituted wild-type AHASS2 enzyme activity was most strongly inhibited by Val (∼30% inhibition at 1 mM); in contrast, Ile and Leu had more modest impacts up to 10 mM concentration (4.9 and 1.2% inhibition at 1 mM, respectively; Figure 4C). AHASS2-1D had reduced sensitivity to BCAA inhibition (Figure 4C), with minimal changes in K m and catalytic efficiency (Table 2). This mutant showed reduced sensitivity to all BCAAs; 1 mM Val and Leu caused 2.3 and 3.3% reduction in enzyme activity, respectively, whereas 1 mM Ile was not inhibitory (Figure 4C). These results show that Ser349Phe in AHASS2-1D causes reduced sensitivity to the BCAAs without changing catalytic efficiency.
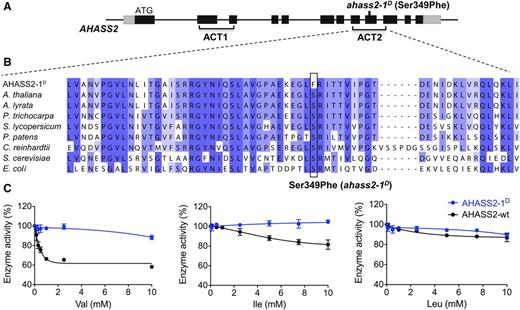
Characterization of the AHASS2-1D Mutant Enzyme.
(A) Schematic representation of the AHASS2 gene structure. See Figure 3A for details.
(B) Sequence alignment of the second ACT domain that includes the AHASS2-1D mutation.
(C) BCAA inhibition of wild-type AHASS2 and AHASS2-1D reconstituted enzymes. Enzyme activity is shown as the percentage of activity without BCAA inhibitors. Error bars represent sd of three technical replicates (using the same sample). The substrate sodium pyruvate was added to a final concentration of 200 mM in these assays. Refer to Methods for more details.
AHAS Enzyme Kinetic Analysis
| Enzyme | K m (mM) | V max (nmol s−1) × 103 | K cat (s−1) | K cat /K m (s−1 mM−1) |
|---|---|---|---|---|
| AHASS2-wt | 11.4 ± 1.0 | 16.7 ± 0.9 | 5.6 ± 0.3 | 0.49 ± 0.02 |
| AHASS2-1D | 13.1 ± 0.6 | 19.1 ± 0.1** | 6.4 ± 0.04** | 0.48 ± 0.02 |
| AHASS2-wt | 8.9 ± 0.6 | 20.6 ± 0.3 | 6.9 ± 0.1 | 0.77 ± 0.05 |
| AHASS2-1D | 7.9 ± 0.9 | 20.9 ± 1.0 | 7.0 ± 0.3 | 0.89 ± 0.07 |
AHASS2 variants were reconstituted with the large subunit AHASL and kinetic parameters measured. Data are expressed as mean ± sd of three technical replicates (using the same enzyme preparation). The asterisks indicate significant differences compared to the wild-type (wt) AHASS2 enzyme (**P < 0.01, Student's t test). The results are from two experiments with enzymes prepared on different dates.
| Enzyme | K m (mM) | V max (nmol s−1) × 103 | K cat (s−1) | K cat /K m (s−1 mM−1) |
|---|---|---|---|---|
| AHASS2-wt | 11.4 ± 1.0 | 16.7 ± 0.9 | 5.6 ± 0.3 | 0.49 ± 0.02 |
| AHASS2-1D | 13.1 ± 0.6 | 19.1 ± 0.1** | 6.4 ± 0.04** | 0.48 ± 0.02 |
| AHASS2-wt | 8.9 ± 0.6 | 20.6 ± 0.3 | 6.9 ± 0.1 | 0.77 ± 0.05 |
| AHASS2-1D | 7.9 ± 0.9 | 20.9 ± 1.0 | 7.0 ± 0.3 | 0.89 ± 0.07 |
AHASS2 variants were reconstituted with the large subunit AHASL and kinetic parameters measured. Data are expressed as mean ± sd of three technical replicates (using the same enzyme preparation). The asterisks indicate significant differences compared to the wild-type (wt) AHASS2 enzyme (**P < 0.01, Student's t test). The results are from two experiments with enzymes prepared on different dates.
IPMS1-1D Enzyme Is Leu Tolerant
The ipms1-1D mutation is predicted to cause a Gly-to-Glu substitution at position 606 in the IPMS C-terminal domain, a region previously demonstrated to be involved in Leu binding and allosteric regulation in plants (de Kraker and Gershenzon, 2011; Ning et al., 2015) (Figure 5). Gly-606 is in a region of the allosteric domain of IPMS proteins conserved from bacteria to flowering plants (Figures 5A and 5B). In addition, homology modeling places Gly-606 in the α-helix close to the Leu binding pocket on the IPMS1 dimer, suggesting that this amino acid substitution may affect Leu docking or binding (Figure 5C). The impact of the Gly606Glu substitution in IPMS1-1D was investigated in vitro using recombinant IPMS1 proteins. The wild-type and mutant IPMS1 enzymes had no difference in enzyme activity without Leu; in contrast, IPMS1-1D showed higher activity than the wild type at all tested Leu concentrations (Figure 5D). Combined with the genetic mapping results, these data demonstrate a strong link between the Gly606Glu substitution and in vivo TFL resistance.
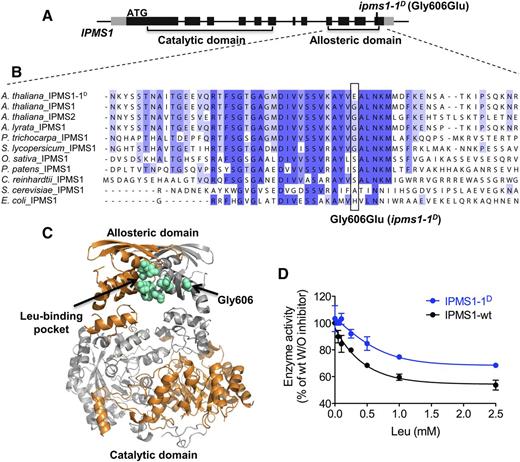
Characterization of the IPMS1-1D Mutant Enzyme.
(A) Schematic representation of the IPMS1 gene structure. Regions encoding the catalytic and C-terminal allosteric domains are indicated. See Figure 3A for details.
(B) Sequence alignment of the C-terminal domain area that includes the IPMS1-1D substitution.
(C) Homology model of the IPMS1 dimer generated using the Mycobacterium tuberculosis IPMS1 structure (1SR9) as the template (Koon et al., 2004) with the Phyre2 online modeling server (Kelley et al., 2015). Arrows indicate the binding pocket of the inhibitor ligand Leu and residue Gly-606.
(D) Leu inhibition of wild-type IPMS1 and IPMS1-1D enzyme activities. Enzyme activity is shown as the percentage of wild-type IPMS1 activity without Leu. Error bars represent sd of three technical replicates (using the same sample). The substrates 2-oxoisovalerate and acetyl-CoA were added to final concentrations of 10 mM and 500 µM, respectively. See de Kraker et al. (2007) for more details.
Feedback-Insensitive Mutants Reveal an Allosteric Regulatory Hierarchy
The in vivo roles OMR1, IPMS, and AHAS play in regulating BCAA homeostasis were investigated by analyzing soluble amino acids in the 2-week-old vegetative tissues of the feedback-resistant mutants. As shown in Figure 6, the primary change in three threonine deaminase-deregulated omr1D mutants was a 7- to >140-fold increase in Ile accumulation (Figures 6A and 6B, Table 3). These increases were accompanied by up to 50% reduction in the OMR1 substrate Thr (Table 3). In contrast to the large increases in Ile, the other two BCAAs, Val and Leu, were much less affected in the mutants. For example, the strongest mutant, omr1-11D, had only 1.5- and 3.8-fold increases of Val and Leu compared with the wild type despite a >140-fold increase in Ile, while the weakest mutant, omr1-13D, showed no Val and Leu changes (Figures 6A and 6B, Table 3). These results are consistent with a model in which the allosteric control of OMR1 primarily regulates Ile homeostasis in Arabidopsis seedlings.
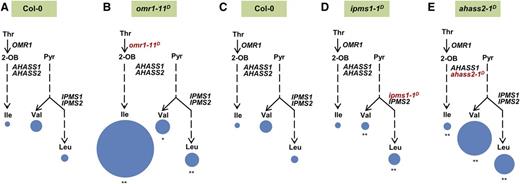
BCAA Profiles in omr1-11D, ipms1-1D, and ahass2-1D Mutant Seedlings.
Levels of free BCAAs in 2-week-old Col-0 wild-type ([A] and [C]), omr1-11D (B), ipms1-1D (tfl102) (D), and ahass2-1D (tfl101) (E) seedlings were analyzed to investigate the in vivo roles of these committed enzymes. The area of each circle represents the molar amount of free BCAAs per milligram fresh weight, normalized to free Ile in (C). The asterisks indicate significant differences compared with the wild type (*P < 0.05, **P < 0.01, Student's t test, n = 6–8). 2-OB, 2-oxobutanoate; Pyr, pyruvate. See Tables 3 and 4 for the underlying data.
omr1D Mutant Seedlings Accumulate Increased Free Ile
| Mutant | Ile (nmol/mg FW) | Ile (FC)a | Val (nmol/mg FW) | Val (FC)a | Leu (nmol/mg FW) | Leu (FC)a | Thr (nmol/mg FW) | Thr (FC)a | Val+Leu (nmol/mg FW) | Val/(Val+Leu) (Ratio × 100) | Leu/(Val+Leu) (Ratio × 100) |
|---|---|---|---|---|---|---|---|---|---|---|---|
| Col-0 | 0.021 ± 0.002 | 0.13 ± 0.02 | 0.047 ± 0.01 | 1.6 ± 0.2 | 0.18 ± 0.02 | 74 ± 1 | 26 ± 1 | ||||
| omr1-11D | 3.0 ± 0.2** | 143 | 0.20 ± 0.02* | 1.5 | 0.18 ± 0.01** | 3.8 | 0.80 ± 0.05** | 0.50 | 0.38 ± 0.02** | 52 ± 3** | 48 ± 3** |
| omr1-12D | 0.88 ± 0.05** | 42 | 0.12 ± 0.01 | 0.92 | 0.095 ± 0.003** | 2.0 | 0.97 ± 0.1* | 0.61 | 0.22 ± 0.01 | 55 ± 1** | 45 ± 1** |
| omr1-13D | 0.16 ± 0.02** | 7.6 | 0.14 ± 0.01 | 1.1 | 0.060 ± 0.01 | 1.3 | 1.3 ± 0.1 | 0.81 | 0.20 ± 0.01 | 71 ± 1 | 29 ± 1 |
Levels of free BCAAs were analyzed in the 2-week-old seedlings of omr1D mutants. Data are expressed as mean ± se of six to eight biological replicates (extracts from different individual plants). The asterisks indicate significant differences compared to the wild type (*P < 0.05, **P < 0.01, Student's t test). FW, fresh weight.
FC, fold change compared to the wild type.
| Mutant | Ile (nmol/mg FW) | Ile (FC)a | Val (nmol/mg FW) | Val (FC)a | Leu (nmol/mg FW) | Leu (FC)a | Thr (nmol/mg FW) | Thr (FC)a | Val+Leu (nmol/mg FW) | Val/(Val+Leu) (Ratio × 100) | Leu/(Val+Leu) (Ratio × 100) |
|---|---|---|---|---|---|---|---|---|---|---|---|
| Col-0 | 0.021 ± 0.002 | 0.13 ± 0.02 | 0.047 ± 0.01 | 1.6 ± 0.2 | 0.18 ± 0.02 | 74 ± 1 | 26 ± 1 | ||||
| omr1-11D | 3.0 ± 0.2** | 143 | 0.20 ± 0.02* | 1.5 | 0.18 ± 0.01** | 3.8 | 0.80 ± 0.05** | 0.50 | 0.38 ± 0.02** | 52 ± 3** | 48 ± 3** |
| omr1-12D | 0.88 ± 0.05** | 42 | 0.12 ± 0.01 | 0.92 | 0.095 ± 0.003** | 2.0 | 0.97 ± 0.1* | 0.61 | 0.22 ± 0.01 | 55 ± 1** | 45 ± 1** |
| omr1-13D | 0.16 ± 0.02** | 7.6 | 0.14 ± 0.01 | 1.1 | 0.060 ± 0.01 | 1.3 | 1.3 ± 0.1 | 0.81 | 0.20 ± 0.01 | 71 ± 1 | 29 ± 1 |
Levels of free BCAAs were analyzed in the 2-week-old seedlings of omr1D mutants. Data are expressed as mean ± se of six to eight biological replicates (extracts from different individual plants). The asterisks indicate significant differences compared to the wild type (*P < 0.05, **P < 0.01, Student's t test). FW, fresh weight.
FC, fold change compared to the wild type.
Consistent with a role for IPMS in feedback regulation of Leu biosynthesis, ipms1-1D mutant seedlings had 2.5-fold higher free seedling Leu compared with the wild type (Figures 6C and 6D, Table 4). This Leu increase was associated with a 60% decrease in Val in the mutants. As a result, the total amount of Val+Leu was the same as in the wild type, consistent with the hypothesis that IPMS feedback regulation did not indirectly influence flux through AHAS (Figures 6C and 6D, Table 4). No change was detected in free Ile in seedlings. The ipms1-1D mutant phenotypes support a role of this enzyme in controlling Val/Leu partitioning.
ipms1-1D and ahass2-1D Mutant Seedlings Have Altered Val and Leu Accumulation
| Category | Mutant | Ile (nmol/mg FW) | Ile (FC)a | Val (nmol/mg FW) | Val (FC)a | Leu (nmol/mg FW) | Leu (FC)a | Val+Leu (nmol/mg FW) | Val+Leu (FC)a | Val/(Val+Leu) (Ratio × 100) | Leu/(Val+Leu) (Ratio × 100) |
|---|---|---|---|---|---|---|---|---|---|---|---|
| Wild type | Col-0 | 0.019 ± 0.003 | 0.14 ± 0.02 | 0.051 ± 0.01 | 0.19 ± 0.02 | 74 ± 1 | 26 ± 1 | ||||
| ipms1-1D | tfl102 | 0.022 ± 0.001 | 1.2 | 0.058 ± 0.01** | 0.41 | 0.13 ± 0.01** | 2.5 | 0.19 ± 0.01 | NCb | 30 ± 2** | 70 ± 2** |
| tfl111 | 0.019 ± 0.001 | NCb | 0.056 ± 0.002** | 0.40 | 0.13 ± 0.01** | 2.5 | 0.19 ± 0.01 | NCb | 30 ± 1** | 70 ± 1** | |
| ahass2-1D | tfl101 | 0.045 ± 0.01** | 2.4 | 1.1 ± 0.1** | 7.9 | 0.39 ± 0.04** | 7.6 | 1.5 ± 0.1** | 7.9 | 73 ± 0.4 | 27 ± 0.4 |
| tfl106 | 0.066 ± 0.01** | 3.5 | 1.1 ± 0.04** | 7.9 | 0.35 ± 0.01** | 6.9 | 1.4 ± 0.1** | 7.4 | 75 ± 0.3 | 25 ± 0.3 |
Levels of free BCAAs in 2-week-old ipms1-1D and ahass2-1D mutants are represented as mean ± se of six to eight biological replicates (extracts from different individual plants). The asterisks indicate significant differences compared to Col-0 wild type (**P < 0.01, Student's t test). Wild-type Col-0 and ipms1-1D mutant samples are the same as in Supplemental Table 6.
FC, fold change compared to the wild type.
NC, no change compared to Col-0 wild type.
| Category | Mutant | Ile (nmol/mg FW) | Ile (FC)a | Val (nmol/mg FW) | Val (FC)a | Leu (nmol/mg FW) | Leu (FC)a | Val+Leu (nmol/mg FW) | Val+Leu (FC)a | Val/(Val+Leu) (Ratio × 100) | Leu/(Val+Leu) (Ratio × 100) |
|---|---|---|---|---|---|---|---|---|---|---|---|
| Wild type | Col-0 | 0.019 ± 0.003 | 0.14 ± 0.02 | 0.051 ± 0.01 | 0.19 ± 0.02 | 74 ± 1 | 26 ± 1 | ||||
| ipms1-1D | tfl102 | 0.022 ± 0.001 | 1.2 | 0.058 ± 0.01** | 0.41 | 0.13 ± 0.01** | 2.5 | 0.19 ± 0.01 | NCb | 30 ± 2** | 70 ± 2** |
| tfl111 | 0.019 ± 0.001 | NCb | 0.056 ± 0.002** | 0.40 | 0.13 ± 0.01** | 2.5 | 0.19 ± 0.01 | NCb | 30 ± 1** | 70 ± 1** | |
| ahass2-1D | tfl101 | 0.045 ± 0.01** | 2.4 | 1.1 ± 0.1** | 7.9 | 0.39 ± 0.04** | 7.6 | 1.5 ± 0.1** | 7.9 | 73 ± 0.4 | 27 ± 0.4 |
| tfl106 | 0.066 ± 0.01** | 3.5 | 1.1 ± 0.04** | 7.9 | 0.35 ± 0.01** | 6.9 | 1.4 ± 0.1** | 7.4 | 75 ± 0.3 | 25 ± 0.3 |
Levels of free BCAAs in 2-week-old ipms1-1D and ahass2-1D mutants are represented as mean ± se of six to eight biological replicates (extracts from different individual plants). The asterisks indicate significant differences compared to Col-0 wild type (**P < 0.01, Student's t test). Wild-type Col-0 and ipms1-1D mutant samples are the same as in Supplemental Table 6.
FC, fold change compared to the wild type.
NC, no change compared to Col-0 wild type.
Results with the feedback-insensitive ahass2-1D mutants argue that allosteric regulation of this enzyme primarily controls partitioning into the Val+Leu subnetwork. The ahass2-1D single mutants showed 7- to 8-fold increases in both Val and Leu, respectively, without influencing the 3:1 ratio of Val to Leu seen in the wild type (Figures 6C and 6E, Table 4). These results suggest that AHAS allosteric regulation influences the total amount of Val+Leu without affecting the partitioning between these two amino acids. AHAS regulation also has a minor influence on Ile concentrations, presumably reflecting a secondary role in regulating Ile homeostasis compared with that of threonine deaminase. Consistent with its role as the second committed enzyme in Ile biosynthesis, an up to 3.5-fold increase in Ile was observed in ahass2-1D mutants; these changes are subtle compared with the 7- to 140-fold increases in the omr1D mutants (Figures 6A to 6C and 6E, Tables 3 and 4).
Taken together, the BCAA phenotypes of the feedback-resistant single mutants suggest a simple allosteric regulatory hierarchy. In this model, AHAS regulates the diversion of flux into both Val and Leu, IPMS controls partitioning between Val and Leu, and threonine deaminase feedback regulation exerts primary control on Ile homeostasis.
BCAA Profiling of the Feedback-Resistant Double Mutant F1 Seedlings
To test this model, double heterozygous dominant feedback-resistant mutant F1 plants were generated and free amino acids analyzed in 2-week-old seedlings (Figure 7). The phenotypes of double mutants with omr1D yielded results consistent with threonine deaminase regulation acting independently of IPMS and AHAS. Heterozygous ahass2-1D/AHASS2;omr1D/OMR1 and ipms1-1D/IPMS1;omr1D/OMR1 double mutants had BCAA profiles similar to those for the single mutant F1 lines (Figures 7A to 7D; Supplemental Table 4). For example, the ahass2-1D/AHASS2;omr1-11D/OMR1 double mutant F1 had 63-fold increase in Ile, which is close to the 54-fold boost seen in the heterozygous omr1-11D/OMR1 F1 single mutant, and 3.8- and 4.1-fold increased Val and Leu, similar to that observed in the ahass2-1D/AHASS2 F1 single heterozygote (Figure 7A; Supplemental Table 4). Similarly, while exhibiting the Ile increase seen in omr1D/OMR1 F1 plants, the two ipms1-1D/IPMS1;omr1D/OMR1 heterozygous double mutants had decreased Val comparable to the ∼40% decrease seen in the ipms1-1D/IPMS1 single mutant (Figures 7C and 7D; Supplemental Table 4). The double heterozygotes had Leu increases similar to those seen in the heterozygous omr1D single mutants, whereas the ipms1-1D/IPMS1 single heterozygous F1 exhibited no change in Leu (Figures 7C and 7D; Supplemental Table 4). Together, these results support the hypothesis that OMR1 primarily regulates Ile biosynthesis and it functions independently from the Val and Leu pathways.
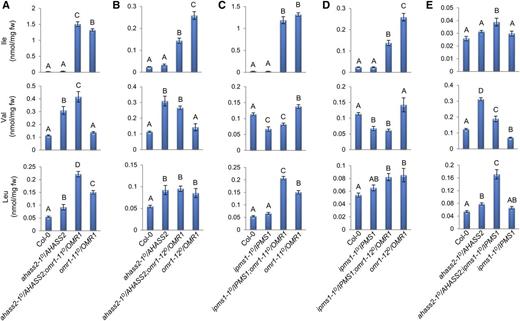
Single and Double Heterozygous Feedback-Resistant Mutant Seedling BCAA Concentrations.
The impact of combining dominant feedback-insensitive mutations on BCAA homeostasis was tested in heterozygous F1 lines. Free BCAA levels were assayed in seedlings of lines singly or doubly heterozygous for ahass2-1D and omr1D ([A] and [B]), ipms1-1D and omr1D ([C] and [D]), as well as ahass2-1D and ipms1-1D (E). BCAA levels are shown as mean ± se of six to eight biological replicates (extracts from different individual plants). Data were analyzed by a one-way ANOVA with a significance threshold of P < 0.05. The letters indicate the outcome (P < 0.05) of multiple comparisons based on Duncan's multiple range test (Duncan, 1955). See Supplemental Tables 4 and 5 for corresponding data.
In contrast, results with the ahass2-1D/AHASS2;ipms1-1D/IPMS1 double heterozygous mutant reinforce the idea that both AHAS and IPMS function in regulation of Val and Leu homeostasis in 2-week-old seedlings. First, the heterozygous double mutant displayed increased total Val+Leu that is similar to that seen in the ahass2-1D/AHASS2 single heterozygote, with ∼2.0-fold higher Val+Leu than the wild type in both the single and double heterozygous mutant (Figure 7E; Supplemental Table 5). Second, Val/Leu partitioning was altered in the doubly heterozygous mutant, with roughly equal amounts of Val and Leu observed compared with the ∼3:1 wild-type Val/Leu ratio (Supplemental Table 5). This ratio was reminiscent of the heterozygous ipms1-1D/IPMS1 single mutant. These results are consistent with the hypothesis that AHAS and IPMS allostery regulate Val and Leu homeostasis in a coordinated manner in vivo, with AHAS controlling entry into the Val+Leu subnetwork and IPMS affecting partitioning between Val and Leu.
IPMS1 Loss-of-Function Mutant BCAA Phenotype Supports a Role in Val/Leu Partitioning
Arabidopsis has two IPMS genes that encode isoforms with qualitatively similar but quantitatively distinct transcript profiles throughout vegetative development (Supplemental Figure 1). To investigate how each isoenzyme contributes to in vivo BCAA homeostasis, we studied ipms1 and ipms2 loss-of-function mutants. Public microarray analysis revealed that IPMS1 transcript accumulates up to 5-fold more than that of IPMS2 in vegetative tissues during development (Supplemental Figure 1). Indeed, T-DNA disruption of the more highly expressed IPMS1 gene provided evidence for a role of this isoenzyme in Val/Leu partitioning (Figure 8; Supplemental Figures 2A and 2B), causing up to a 3.6-fold boost in free seedling Val compared with the wild type, whereas Leu and Ile were unaffected (Figures 8A and 8B; Supplemental Table 6). As a result, the proportion of Leu to total Val+Leu decreased by up to 17% compared with the wild type, opposite to the 44% increase seen in the reduced allosteric regulation ipms1-1D mutants (Figures 8A to 8C; Supplemental Table 6). In contrast, the loss-of-function mutants in the less highly expressed IPMS2 gene showed marginal increases in the proportion of Leu to total Val+Leu compared with the wild type (4 and 7% in ipms2-1 and ipms2-2, respectively) (Supplemental Table 6 and Supplemental Figures 1 and 2). Collectively, the higher IPMS1 transcript levels and stronger loss-of-function ipms1 mutant phenotype results are consistent with the hypothesis that the IPMS1 isoform plays a more prominent role in regulating vegetative tissue Val/Leu partitioning.
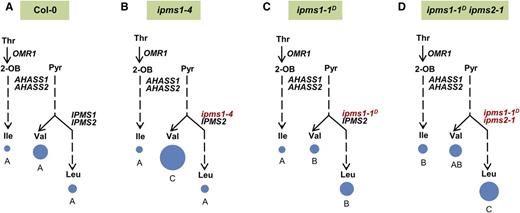
Impacts of Altering IPMS Activity on Seedling Val/Leu Partitioning.
Free BCAA levels in 2-week-old seedlings of wild-type Col-0 (A) and homozygous mutants of ipms1-4 (B), ipms1-1D (tfl102) (C) and ipms1-1D ipms2-1 (tfl102 ipms2-1) (D). Circle areas are proportional to the molar amount of free Ile in (A). Data were analyzed by a one-way ANOVA with a significance threshold of P < 0.05. The letters indicate the outcome (P < 0.05) of multiple comparisons based on Duncan's multiple range test (Duncan, 1955). 2-OB, 2-oxobutanoate; Pyr, pyruvate. See Supplemental Table 6 for corresponding data.
Although the ipms2 loss-of-function mutations alone had no significant impact on BCAA homeostasis (Supplemental Table 6), BCAA levels were altered in the ipms1-1D ipms2 double mutants compared with the wild-type or ipms1-1D single mutant plants (Figures 8A, 8C, and 8D; Supplemental Table 6 and Supplemental Figures 2B and 2C). We observed an up to 1.9-fold increase in Val+Leu in the double mutants compared with the wild type, in contrast to the ipms1-1D and ipms2 homozygous single mutants, which exhibited no change in Val+Leu (Figures 8A, 8C, and 8D; Supplemental Table 6). An up to 2.7-fold increase in Ile was also observed in the double mutants, which was not seen in either single mutant line (Figures 8A, 8C and 8D; Supplemental Table 6). In contrast, reduction or absence of IPMS2 did not influence partitioning between Val and Leu in the double mutants, which had the same proportion of Leu to Val+Leu as seen in the ipms1-1D single mutant (Figures 8C and 8D; Supplemental Table 6). Together, results with the ipms1-1D ipms2 double mutants revealed evidence for a role of the IPMS2 isoform in BCAA homeostasis.
Evidence for a Role of AHASS1 in BCAA Homeostasis
Transcript analysis and in vitro enzyme assays revealed differential gene expression and allosteric feedback regulation of the AHASS1 and AHASS2 isoenzymes. AHASS1 and AHASS2 transcript levels were anticorrelated in public microarray data, with more AHASS1 transcript than AHASS2 in vegetative tissues (Supplemental Figure 3). These results were validated by qRT-PCR analysis, where AHASS1 transcript was 4.5-fold more abundant than AHASS2 in 2-week-old Col-0 seedlings. In addition, AHASS1 and AHASS2 protein responded differently to BCAA inhibition in vitro (Figure 9). First, AHASS1 showed sensitivity to both Val and Leu (Figures 9A to 9C), in contrast to AHASS2, which only was sensitive to Val under our assay conditions (Figure 4C). Second, the AHASS1 isoenzyme was subject to synergistic inhibition by Val+Leu, consistent with the report by Lee and Duggleby (2001) (Figure 9D). In contrast, we observed a simple additive inhibitory effect of Val+Leu on wild-type AHASS2 activity (Figure 9E). We sought in vivo evidence for an impact of the allosteric regulation of the AHAS isoforms by testing the effects of exogenous applied BCAAs on germination and seedling growth of Col-0 wild type as well as ahass1 and ahass2 loss-of-function mutants (Figure 10; Supplemental Figures 4A to 4D). Wild-type seedling growth was strongly inhibited by a mixture of 0.5 mM Val plus 0.5 mM Leu (Figure 10A; Supplemental Figure 5A), whereas growth inhibition was not seen with any other pairwise mix that included Ile or with individual BCAAs at this concentration (Supplemental Figures 5B to 5F). The ahass1 mutants were tolerant of Val+Leu inhibition (Figures 10B and 10C), while the ahass2 lines exhibited wild-type-like sensitivity to Val+Leu (Figures 10D and 10E). Taken together, these data revealed differences in expression and allosteric regulation of the two AHAS isoforms and evidence for an in vivo role of AHASS1 in Val+Leu allosteric control.
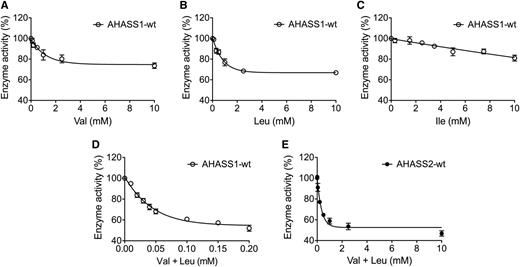
The AHASS1 Reconstituted Enzyme Is Inhibited by Val, Leu, and the Synergistic Effect of Val+Leu in Vitro.
(A) to (C) Val, Leu, and Ile inhibition of the wild-type AHASS1 enzyme.
(D) to (E) Val+Leu inhibition of wild-type AHASS1 and AHASS2 enzymes. Enzyme activity is shown as the percentage of activity without BCAA inhibitors. Note the difference in scale for the x axis of (D) and (E). Error bars represent sd of three technical replicates (using the same sample). The substrate sodium pyruvate was added to a final concentration of 200 mM in these assays. Refer to Methods for details.
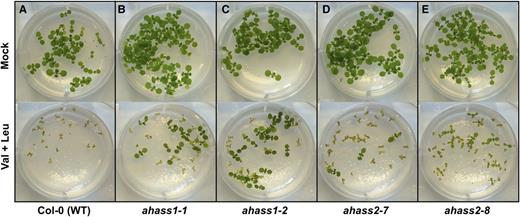
AHASS Genotype-Specific Seedling Responses to Val+Leu Treatment.
Growth inhibition by Val+Leu on wild-type Col-0 (A), ahass1 ([B] and [C]), and ahass2 ([D] and [E]) loss-of-function mutant seedlings was tested. Col-0, ahass1, and ahass2 seeds were sown on half-strength MS medium with or without equimolar 0.5 mM Val and Leu. Photographs were taken 1 week after stratification.
The role of AHASS1 in regulating BCAA homeostasis was further investigated by analyzing BCAA profiles of 2-week-old ahass1 loss-of-function single mutant seedlings (Figure 11). Both ahass1 mutants exhibited ∼2-fold increase in free seedling Val, whereas Ile and Leu remained at wild-type levels (Figure 11A; Supplemental Table 7). The altered Val levels in the ahass1 loss-of-function mutants provided evidence for an in vivo function of the AHASS1 isoform in regulating BCAA homeostasis.
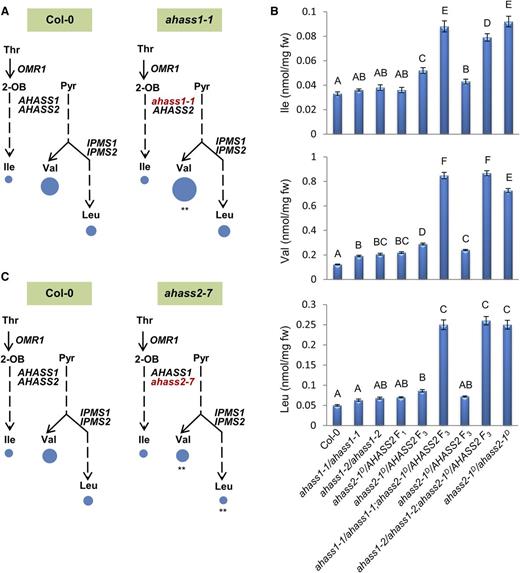
BCAA Profiling of ahass Loss-of-Function Single and Double Mutant Seedlings.
Free BCAAs were analyzed from 2-week-old seedlings of ahass1-1 (A) and ahass2-7 (C) loss-of-function single mutants as well as ahass1/ahass1;ahass2-1D/AHASS2 double mutants (B). Areas of the circles in (A) and (C) represent free BCAAs per milligram fresh weight. Circle areas are proportional to the molar amount of free Ile in wild-type Col-0 in (A). The asterisks in (A) and (C) indicate significant differences compared with the wild type (**P < 0.01, Student's t test). BCAA levels in (B) are shown as mean ± se of six to eight biological replicates (extracts from different individual plants). Data in (B) were analyzed by a one-way ANOVA with a significance threshold of P < 0.05. The letters indicate the outcome (P < 0.05) of multiple comparisons based on Duncan's multiple range test (Duncan, 1955). 2-OB, 2-oxobutanoate; Pyr, pyruvate. See Supplemental Tables 7 and 8 for corresponding data.
Double mutants were constructed between the two loss-of-function ahass1 mutations and the feedback-resistant ahass2-1D allele to further explore the role of these two isoforms. The AHASS2-1D mutant enzyme is resistant to all single BCAAs as well as Val+Leu (Figure 4C; Supplemental Figure 6). While ahass1 and ahass2-1D homozygous single mutants each were viable, we were unable to recover ahass1/ahass1;ahass2-1D/ahass2-1D double mutants after screening 96 plants in each ahass1 × ahass2-1D F2 population. In addition, <70% of the F2 seeds from each population germinated on unsupplemented medium. We hypothesize that lethality of the homozygous ahass1/ahass1;ahass2-1D/ahass2-1D double mutants is due to BCAA dyshomeostasis, as proposed for other amino acid metabolic networks (Joshi et al., 2006; Zhu and Galili, 2003). Consistent with the hypothesis, ahass1/ahass1;ahass2-1D/AHASS2 double mutant F3 seedlings exhibited higher BCAA levels compared with the corresponding single mutants: up to 7.3- and 5.2-fold higher Val and Leu than the wild type, respectively, compared with the up to 2.4-fold increases of Val and Leu in ahass1/ahass1 and ahass2-1D/AHASS2 single mutants (Figure 11B; Supplemental Table 8). In addition, BCAA accumulation in ahass1/ahass1;ahass2-1D/AHASS2 F3 seedlings was comparable to that seen in the homozygous ahass2-1D;ahass2-1D single mutant, which had 6.1- and 5.0-fold increases in Val and Leu, respectively, compared with the wild type (Figure 11B; Supplemental Table 8). Together, the ahass1 single and double mutant analysis supports the hypothesis that the AHASS1 isoform plays a role in maintaining BCAA homeostasis.
A similar approach was taken to analyze the role of AHASS2 isoform in regulating BCAA homeostasis in vivo. Changes in BCAA profiles of the ahass2 loss-of-function mutants were mixed. On the one hand, free Val and Leu were modestly reduced in ahass2-7, to 0.76- and 0.64-fold of the wild type, respectively, whereas Ile was unaffected (Figure 11C; Supplemental Table 7). In contrast, ahass2-8 had wild-type levels of the BCAAs (Supplemental Table 7). In addition, an up to 1.8-fold upregulation of AHASS1 transcript levels was detected in the ahass2 loss-of-function mutants by qRT-PCR (Supplemental Figure 4E); this is in contrast to the lack of change in AHASS2 transcript level observed in ahass1 loss-of-function mutants (Supplemental Figure 4F). Together, characterization of the ahass single and double mutants reinforces the hypothesis that the AHASS1 isoform has a role in maintaining BCAA homeostasis in vivo.
Ile Deficiency Underlies Val+Leu Toxicity on Seedling Growth
We asked how exogenous Val+Leu inhibit the growth of wild type Col-0 seedlings. Two mechanisms were previously documented for in vivo toxicity resulting from AHAS activity inhibition using herbicides. One is toxicity due to accumulation of the AHAS substrate 2-oxobutanoate, documented in the bacterium Salmonella typhimurium (Van Dyk and LaRossa, 1986; Primerano and Burns, 1982), while BCAA starvation was proposed for plants (Shaner and Singh, 1993). The relatively minor inhibitory effect of up to 1 mM exogenous 2-oxobutanoate or pyruvate on Col-0 seedling growth argues against toxicity due to intermediate accumulation (Supplemental Figure 7A). In contrast, Ile supplementation reversed the Val+Leu-mediated inhibition of Col-0 seedlings (Supplemental Figure 7B). Given that we observed ∼20% residual OMR1 enzyme activity at 10 mM Ile in vitro (Figure 3D), 2-oxobutanoate could accumulate in plants treated with 0.5 mM Ile. The strongest evidence for the Ile starvation toxicity hypothesis is the reversal of Val+Leu inhibition by Ile in the Ile feedback-insensitive omr1-12D mutant (Supplemental Figure 7C). This is because Ile addition to OMR1-12D is even less prone to reduction of 2-oxobutanoate than the wild-type enzyme (Figure 3D). Collectively, these data support the hypothesis that the in vivo Val+Leu inhibition of Arabidopsis seedling growth is due to Ile starvation rather than inhibitor accumulation.
Feedback-Resistant Mutants Accumulate Higher Seed BCAAs
The feedback-resistant mutants show increases in seed BCAAs (Table 5) qualitatively similar to those seen in seedlings (Tables 3 and 4). Consistent with an in vivo role of OMR1 in seed Ile homeostasis, omr1D mutant seeds had up to 8.9-fold increase in Ile compared with the wild type (Table 5). However, these Ile increases were subtle compared with the up to 140-fold increase seen in leaf (Table 3). Seed Val and Leu levels were boosted in the omr1-11D and omr1-13D mutants, by up to 3.7- and 3.9-fold, respectively, compared with the wild type (Table 5). Results with the ahass2-1D and ipms1-1D homozygous single mutants showed that AHAS and IPMS allostery regulates Val and Leu homeostasis in seeds, with ahass2-1D increasing total Val+Leu, by up to 5.5-fold, and ipms1-1D altering Val/Leu partitioning by ∼20% (Table 5), similar to that observed for 2-week-old mutant seedlings (Table 4). These data provide evidence for a similar regulatory hierarchy of the three committed enzymes in seedling and seed BCAA homeostasis and the impacts of these feedback-insensitive mutations in boosting seed BCAA levels.
Feedback-Resistant Mutations Affect Seed Free BCAA Levels
| Category | Mutant | Ile (nmol/mg DW) | Ile (FC)a | Val (nmol/mg DW) | Val (FC)a | Leu (nmol/mg DW) | Leu (FC)a | Thr (nmol/mg DW) | Thr (FC)a | Val+Leu (nmol/mg DW) | Val+Leu (FC)a | Val/(Val+Leu) (Ratio × 100) | Leu/(Val+Leu) (Ratio × 100) |
|---|---|---|---|---|---|---|---|---|---|---|---|---|---|
| Wild type | Col-0 | 0.18 ± 0.005 | 0.54 ± 0.03 | 0.24 ± 0.01 | 0.71 ± 0.04 | 0.78 ± 0.04 | 69 ± 1 | 31 ± 1 | |||||
| omr1D | omr1-11D | 1.6 ± 0.2** | 8.9 | 2.0 ± 0.2** | 3.7 | 0.93 ± 0.1** | 3.9 | 2.4 ± 0.3** | 3.4 | 3.0 ± 0.2** | 3.8 | 69 ± 1 | 31 ± 1 |
| omr1-12D | 0.20 ± 0.01* | 1.1 | 0.56 ± 0.03 | NCb | 0.27 ± 0.01 | 1.1 | 0.63 ± 0.1 | 0.89 | 0.83 ± 0.03 | 1.1 | 67 ± 2 | 33 ± 2 | |
| omr1-13D | 0.34 ± 0.04** | 1.9 | 0.77 ± 0.1** | 1.4 | 0.35 ± 0.03** | 1.5 | 0.93 ± 0.1* | 1.3 | 1.1 ± 0.1** | 1.4 | 69 ± 2 | 31 ± 2 | |
| Wild type | Col-0 | 0.22 ± 0.01 | 0.60 ± 0.04 | 0.28 ± 0.02 | 0.81 ± 0.1 | 0.88 ± 0.05 | 68 ± 1 | 32 ± 1 | |||||
| ahass2-1D | tfl101 | 0.86 ± 0.1** | 3.9 | 3.4 ± 0.4** | 5.7 | 1.4 ± 0.3** | 5.0 | 2.5 ± 0.2** | 3.1 | 4.8 ± 0.7** | 5.5 | 72 ± 2 | 28 ± 2 |
| tfl106 | 0.60 ± 0.05** | 2.7 | 1.7 ± 0.1** | 2.8 | 1.1 ± 0.1** | 3.9 | 2.0 ± 0.1** | 2.5 | 2.8 ± 0.2** | 3.2 | 62 ± 1** | 38 ± 1** | |
| Wild type | Col-0 | 0.20 ± 0.01 | 0.56 ± 0.03 | 0.31 ± 0.02 | 0.67 ± 0.1 | 0.87 ± 0.05 | 64 ± 1 | 36 ± 1 | |||||
| ipms1-1D | tfl102 | 0.31 ± 0.02** | 1.6 | 0.51 ± 0.02 | 0.91 | 0.56 ± 0.04** | 1.8 | 1.0 ± 0.2 | 1.5 | 1.1 ± 0.06* | 1.3 | 48 ± 1** | 52 ± 1** |
| tfl111 | 0.44 ± 0.02** | 2.2 | 0.65 ± 0.03 | 1.2 | 0.85 ± 0.02** | 2.7 | 1.4 ± 0.4 | 2.1 | 1.5 ± 0.04** | 1.7 | 43 ± 1** | 57 ± 1** |
Levels of free BCAAs in dry seeds of omr1D, ahass2-1D, and ipms1-1D mutants are expressed as mean ± se of six to eight biological replicates (extracts from different individual plants). The asterisks indicate significant differences compared to Col-0 wild type (*P < 0.05, **P < 0.01, Student's t test). DW, dry weight.
FC, fold change compared to the wild type.
NC, no change compared to Col-0 wild type.
| Category | Mutant | Ile (nmol/mg DW) | Ile (FC)a | Val (nmol/mg DW) | Val (FC)a | Leu (nmol/mg DW) | Leu (FC)a | Thr (nmol/mg DW) | Thr (FC)a | Val+Leu (nmol/mg DW) | Val+Leu (FC)a | Val/(Val+Leu) (Ratio × 100) | Leu/(Val+Leu) (Ratio × 100) |
|---|---|---|---|---|---|---|---|---|---|---|---|---|---|
| Wild type | Col-0 | 0.18 ± 0.005 | 0.54 ± 0.03 | 0.24 ± 0.01 | 0.71 ± 0.04 | 0.78 ± 0.04 | 69 ± 1 | 31 ± 1 | |||||
| omr1D | omr1-11D | 1.6 ± 0.2** | 8.9 | 2.0 ± 0.2** | 3.7 | 0.93 ± 0.1** | 3.9 | 2.4 ± 0.3** | 3.4 | 3.0 ± 0.2** | 3.8 | 69 ± 1 | 31 ± 1 |
| omr1-12D | 0.20 ± 0.01* | 1.1 | 0.56 ± 0.03 | NCb | 0.27 ± 0.01 | 1.1 | 0.63 ± 0.1 | 0.89 | 0.83 ± 0.03 | 1.1 | 67 ± 2 | 33 ± 2 | |
| omr1-13D | 0.34 ± 0.04** | 1.9 | 0.77 ± 0.1** | 1.4 | 0.35 ± 0.03** | 1.5 | 0.93 ± 0.1* | 1.3 | 1.1 ± 0.1** | 1.4 | 69 ± 2 | 31 ± 2 | |
| Wild type | Col-0 | 0.22 ± 0.01 | 0.60 ± 0.04 | 0.28 ± 0.02 | 0.81 ± 0.1 | 0.88 ± 0.05 | 68 ± 1 | 32 ± 1 | |||||
| ahass2-1D | tfl101 | 0.86 ± 0.1** | 3.9 | 3.4 ± 0.4** | 5.7 | 1.4 ± 0.3** | 5.0 | 2.5 ± 0.2** | 3.1 | 4.8 ± 0.7** | 5.5 | 72 ± 2 | 28 ± 2 |
| tfl106 | 0.60 ± 0.05** | 2.7 | 1.7 ± 0.1** | 2.8 | 1.1 ± 0.1** | 3.9 | 2.0 ± 0.1** | 2.5 | 2.8 ± 0.2** | 3.2 | 62 ± 1** | 38 ± 1** | |
| Wild type | Col-0 | 0.20 ± 0.01 | 0.56 ± 0.03 | 0.31 ± 0.02 | 0.67 ± 0.1 | 0.87 ± 0.05 | 64 ± 1 | 36 ± 1 | |||||
| ipms1-1D | tfl102 | 0.31 ± 0.02** | 1.6 | 0.51 ± 0.02 | 0.91 | 0.56 ± 0.04** | 1.8 | 1.0 ± 0.2 | 1.5 | 1.1 ± 0.06* | 1.3 | 48 ± 1** | 52 ± 1** |
| tfl111 | 0.44 ± 0.02** | 2.2 | 0.65 ± 0.03 | 1.2 | 0.85 ± 0.02** | 2.7 | 1.4 ± 0.4 | 2.1 | 1.5 ± 0.04** | 1.7 | 43 ± 1** | 57 ± 1** |
Levels of free BCAAs in dry seeds of omr1D, ahass2-1D, and ipms1-1D mutants are expressed as mean ± se of six to eight biological replicates (extracts from different individual plants). The asterisks indicate significant differences compared to Col-0 wild type (*P < 0.05, **P < 0.01, Student's t test). DW, dry weight.
FC, fold change compared to the wild type.
NC, no change compared to Col-0 wild type.
DISCUSSION
Although plants are the main source of animal dietary essential amino acids, plant BCAAs are rarely in balance with the nutritional requirements of these primary consumers. Understanding the regulation of BCAA biosynthesis can inform breeding and transgenic approaches to improve plant nutritional quality. Despite the documented in vitro feedback regulation of the BCAA committed enzymes in plants and microbes (Lee and Duggleby, 2001; Chen et al., 2010; de Kraker et al., 2007; Duggleby and Pang, 2000; Pang and Duggleby, 2001; Curien et al., 2008; de Kraker and Gershenzon, 2011), relatively little is known about how these enzymes influence free amino acid homeostasis in vivo. In contrast, altered regulation of IPMS is of documented importance in specialized metabolism. The evolution of methionine-derived glucosinolate biosynthesis in the Brassicaceae (de Kraker and Gershenzon, 2011) and acylsugar production in glandular trichomes of cultivated and wild tomatoes (Ning et al., 2015) included deletion of the IPMS feedback regulatory C-terminal domain combined with altered transcriptional regulation, leading to the production of specialized metabolic enzyme genes.
In this study, we characterized Arabidopsis feedback-resistant and loss-of-function mutants of BCAA committed enzymes, both singly and in combination. This work leads us to propose a model for a regulatory hierarchy in which the three committed enzymes, OMR1, AHAS, and IPMS, control BCAA levels in leaves and seeds. These results illustrate that paralogous isoforms contribute unequally to regulation. Taken together, our results indicate that the control of Arabidopsis free amino acid abundance results from the interplay between these committed enzymes. The complexities that were observed, and the previously documented differences in plant growth and seed viability associated with increases in different essential amino acids and plant species (Angelovici et al., 2009; Zhu and Galili, 2003), suggest that engineering of improved amino acid balance will benefit from detailed understanding of the genetic and biochemical architecture of this network in the target crop.
A Regulatory Model for Arabidopsis BCAA Homeostasis
The regulatory model that comes from this study includes several key components. The most straightforward is that Ile homeostasis is primarily determined by OMR1 feedback control. This is dramatically illustrated by the >140-fold increase in Ile in omr1-11D mutant seedlings, with only 1.5- and 3.8-fold increases in Val and Leu, respectively (Figures 6A and 6B, Table 3). This very high Ile overproduction only resulted in a 50% decrease in the precursor amino acid Thr, suggesting that regulation of the earlier steps in the network responded to increased flux through OMR1 (Table 3). This phenotype, which was not reported for previously published feedback-insensitive OMR1 mutants (Mourad and King, 1995), suggests that engineering increased crop plant Ile can be attempted without changes to aspartate kinase and homoserine dehydrogenase regulation (Figure 1). The up to 3.5-fold increase in Ile in the ahass2-1D mutants suggests that AHAS enzyme activity has a minor role in Ile homeostasis (Figures 6C and 6E, Table 4). This could result from reduced mutant AHAS Ile sensitivity or alternatively from increased soluble Val indirectly causing reduced Ile inhibition of OMR1 (Halgand et al., 2002). Reisolation of the ahass2-1D allele in the weak OMT-resistant omt4 line is consistent with this hypothesis (Supplemental Table 1). These results support the notion that there is regulatory crosstalk, even in the case of Ile regulation by threonine deaminase.
Analysis of the ahass2-1D mutant revealed that AHAS allostery mainly affects the Val/Leu subnetwork, with up to a 7.9-fold increase in total seedling Val+Leu (Figures 6C and 6E, Table 4). Furthermore, combining the omr1D mutations with ahass2-1D caused additive effects on free BCAA levels (Figures 7A and 7B; Supplemental Table 4), reinforcing the mutually independent regulation of Ile and Val/Leu subnetworks by OMR1 and AHAS. The observed increase in ipms1-1D seedling Leu and decreased Val argues that IPMS allosteric inhibition regulates partitioning between these amino acids (Figures 6C and 6D, Table 4). Interestingly, Leu levels increased in proportion to Val in ahass2-1D mutants despite the presence of Leu-inhibited wild-type IPMS enzyme activity (Figures 6C and 6E, Table 4). This presumably is a result of the >50% residual in vitro IPMS activity at full Leu inhibition observed in this (Figure 5D) and another study (de Kraker et al., 2007). This proportional Val/Leu increase in ahass2-1D reinforces the in vivo role of IPMS in Val/Leu partitioning. Further supporting evidence came from the increased Val/Leu ratio in ipms1 loss-of-function mutant seedlings compared with the wild type (Figures 8A and 8B; Supplemental Table 6). Consistent with the single mutant results, the doubly heterozygous ahass2-1D/AHASS2;ipms1-1D/IPMS1 mutant had increased total Val+Leu level and Leu/Val ratio compared with the wild type (Figure 7E; Supplemental Table 5). These results demonstrated regulation of Val and Leu homeostasis by both IPMS and AHAS. Taken together with the OMR1 analysis, these findings provide a useful in vivo regulatory starting model of BCAA homeostasis for engineering crops producing high BCAAs.
Isoenzymes Contribute Unequally to Maintaining BCAA Homeostasis
Half of the genes in Arabidopsis are duplicated, a result of whole-genome duplications and small-scale gene duplications (Jiang et al., 2013; Panchy et al., 2016). Studying the function of paralogous genes is important for understanding the retention mechanism and its impact on physiological homeostasis. We investigated two such gene pairs in this study, AHASS and IPMS, and found evidence that both isoforms of each enzyme play roles in BCAA homeostasis. This reinforces the conclusion of Curien et al. (2009) that isoenzymes contribute unequally to the regulation of flux and are not functionally redundant, and could contribute to future testing and refinement of mathematical models for this network. Our results are consistent with the hypothesis that the two differentially regulated Arabidopsis AHASS isoforms have overlapping function (Figures 11A and 11C; Supplemental Table 7). Despite the genetic redundancy, these genes, which emerged before the divergence of the Arabidopsis-Solanum lineages (Supplemental Figure 8 and Supplemental File 1), have acquired demonstrably unique characteristics. They are differentially regulated at the mRNA level (Supplemental Figure 3), and loss of the more highly expressed AHASS1 isoform reversed the toxic effect of Val+Leu seen on wild-type seedling growth (Figures 10A to 10C). This reveals the potent in vivo inhibitory effect of Val+Leu as well as a role of the AHASS1 isoform in conferring such feedback regulation. Second, lethality of the homozygous ahass1/ahass1;ahass2-1D/ahass2-1D double mutants provides further evidence for an essential role of AHASS1 in maintaining BCAA homeostasis.
The two IPMS paralogs emerged after the divergence of Arabidopsis-Populus lineages (Supplemental Figure 9 and Supplemental File 2), suggesting a more recent origin than the AHASS gene pair. They are also found in a syntenic block of the Arabidopsis α-whole genome duplication (Bowers et al., 2003). While sharing qualitatively similar transcript profiles during vegetative development and generally similar enzymatic properties, IPMS1 and IPMS2 transcripts display different abundance (Supplemental Figure 1) (de Kraker et al., 2007). Our genetic analysis reveals a clear role for the IPMS1 isoform in Leu homeostasis: T-DNA disruption and feedback-insensitive mutation in the more highly expressed IPMS1 resulted in altered Val/Leu ratios (Figures 8A to 8C; Supplemental Table 6). In contrast, loss of IPMS2 in an otherwise wild type background led to no change in free BCAAs (Supplemental Table 6). This stands in contrast to the surprising result that combining loss-of-function ipms2 alleles with the deregulated ipms1-1D enzyme leads to a modest increase in seedling BCAAs compared with the ipms1-1D single mutant (Figures 8A, 8C, and 8D; Supplemental Table 6). This result could reflect a distinct role for IPMS2 or could be an indirect effect of less vigorous growth of the double mutant compared with either single mutant line. Collectively, our findings with AHAS and IPMS provide evidence that each subfunctionalized isoenzyme contributes to BCAA homeostasis in Arabidopsis.
Tools for Engineering BCAA Levels
Our results suggest that BCAA levels and ratios can be manipulated in crop plants using a combination of allosteric and loss-of-function mutations. For example, deregulating both OMR1 and AHAS has the potential to increase all three BCAAs, and further modification of IPMS could be used to manipulate the relative abundance of Val and Leu. Increases in BCAAs in both vegetative tissue and mature seeds of the mutants highlight the usefulness of deregulated enzymes in improving nutritional quality in seed (Tables 3 to 5). This adds to our tools for manipulating seed amino acid homeostasis, which was previously shown to be influenced by BCAA catabolism (Peng et al., 2015; Angelovici et al., 2013; Araújo et al., 2010; Gu et al., 2010). These combined results are timely given the rapid development of new genetic and analytical methods including genome editing and facile mass spectrometry approaches, which can be deployed to improve the nutritional quality of target crops.
METHODS
Mutagenesis
Mutagenesis of Arabidopsis thaliana was performed using modified published methods (Jander et al., 2003; Kim et al., 2006). All manipulations were done at room temperature in a chemical hygiene hood, and the EMS solution was detoxified with a 10× excess of 5 M NaOH. Fifty thousand wild-type Col-0 seeds were washed with 0.1% Tween 20 (Sigma-Aldrich) for 15 min on a shaker and then washed with 50 mL water. Washed seeds were resuspended with 50 mL 0.2% EMS (Sigma-Aldrich) in deionized water and gently rocked on a shaker overnight. The next morning, the EMS solution was decanted and the seeds were washed twice with 50 mL water and left to shake gently in 50 mL water for 4 h. The water was then poured off and the seeds (M1) were resuspended in room temperature (22°C) 0.1% agar and planted onto soil-less mix (Redi-earth; Hummert) into 12 flats stratified at 4°C for 3 d to promote uniform germination. The M1 plants were grown under 16/8-h light/dark cycle (a mix of cool white fluorescent and incandescent bulbs was used; the irradiance was 100 µmol m−2 s−1 photosynthetic photon flux density) for 10 weeks. The M2 progeny from each flat were bulk harvested into independent seed pools. The growth conditions for wild-type and mutant Arabidopsis plants in this study were the same as previously described (Lu et al., 2008), except that a 16/8-h (light/dark) photoperiod was used.
EMS and T-DNA Insertional Mutant Analysis
Seeds from this M2 population or a mixed population with M4 and M5 seed (Van Eenennaam et al., 2003; Jander et al., 2004) were surface sterilized and 200 to 250 seeds were sown on each plate (100 × 25 mm; Thermo Scientific) containing 30 mL half-strength Murashige and Skoog (MS) medium (Caisson Labs) with 0.2 to 0.3 mM TFL (Matrix Scientific) or 0.4 to 0.8 mM OMT (Santa Cruz Biotechnology). Two-week-old putatively inhibitor-resistant plants were selected and transplanted onto half-strength MS plates without inhibitor to recover before transplanting onto soil-less mix for M3 seed production. DNA was extracted from the leaves of the putative TFL- and OMT-resistant plants using a DNeasy Plant Mini kit (Qiagen), and the genomic regions corresponding to the regulatory domains of OMR1, AHASS1, AHASS2, IPMS1, IPMS2, and AK-HSDH I were amplified and Sanger sequenced to identify EMS-induced mutations. Primers used for amplification and sequencing are summarized in Supplemental Table 9.
T-DNA insertional mutants ipms1-4 (SALK_101771), ipms1-5 (WiscDsLoxHs221_05F), ipms2-1 (WiscDsLox426A07), ipms2-2 (SALK_046876), ahass2-7 (WiscDsLoxHs009_02G), ahass2-8 (WiscDsLoxHs110_12G), ahass1-1 (SALK_096207), and ahass1-2 (SALK_108628) were obtained from ABRC. The T-DNA insertions in these mutants were validated through PCR as described by Ajjawi et al. (2010). Primers used for genotyping are listed in Supplemental Table 9. OMT- and TFL-resistant single and double mutants were donated to ABRC (https://abrc.osu.edu/). Refer to Supplemental Table 10 for stock numbers.
Segregation Analysis of Feedback-Resistant Mutants
Feedback-insensitive mutants in the Col-0 genetic background were crossed with Ler wild type, and the F1 plants were sown on half-strength MS plates containing 0.4 mM OMT or 0.2 mM TFL. Resistant F1 plants were genotyped and transferred to half-strength MS plates for recovery and moved to soil-less mix to generate F2 seeds. About 150 to 200 F2 seeds of each mutant were sown on half-strength MS plates containing 0.6 mM OMT or 0.3 mM TFL, and resistant plants were transplanted onto half-strength MS plates for recovery. Leaf samples were archived onto FTA PlantSaver cards (GE Healthcare) and prepared for PCR following the manufacturer's instructions. Cleaved amplified polymorphic sequence markers CAPS1-1, CAPS2-1, and CAPS3-1, which are linked to OMR1, AHASS2, and IPMS1, respectively, were used to genotype the resistant F2 plants. The marker AMU-4-272, which is not linked to any of the candidate genes, was used as a control. Primers used to amplify these genetic markers are listed in Supplemental Table 9.
Vector Construction and Protein Expression
Total RNA was isolated from 2-week-old Arabidopsis seedlings with an RNeasy plant mini kit (Qiagen), and first-strand cDNA synthesis was performed with SuperScript III reverse transcription system (Invitrogen) with oligo(dT) primer (Invitrogen). For the expression of His-tagged proteins, the coding regions of OMR1, AHASL, and IPMS1 without their predicted target peptides (TargetP 1.1 server; http://www.cbs.dtu.dk/services/TargetP/) were amplified using Phusion high-fidelity DNA polymerase (NEB) with primers 42 and 43 (OMR1) (Niehaus et al., 2014), 44 and 45 (AHASL), and 46 and 47 (IPMS1) (Supplemental Table 9). The resulting PCR products were purified (QIAquick PCR purification kit; Qiagen), double digested with NcoI and NotI (OMR1) or NcoI and XhoI (AHASL and IPMS1) and ligated into pET28b. The two AHAS small subunits AHASS1 and AHASS2 have low solubility and were expressed in frame with an N-terminal GST tag. A 6×His tag was attached to the C termini of AHASS1 and AHASS2 recombinant proteins to facilitate purification. The sequence encoding the predicted mature AHASS1 and AHASS2 proteins was amplified with primers 48 to 51 (Supplemental Table 9). Purified PCR products were double digested with BamHI and XhoI and ligated into pGEX-4T-1 vector to express the GST fusion proteins with C-terminal His tags. All the constructs were validated by DNA sequencing and used to transform Escherichia coli strain BL21 (DE3) Rosetta.
E. coli strains harboring the pET28b constructs were used to inoculate 1 liter (OMR1 constructs) or 300 mL (AHASL and IPMS1 constructs) Luria-Bertani medium containing 100 mg/L kanamycin and 34 mg/L chloramphenicol. E. coli strains carrying the AHASS1 and AHASS2 constructs were grown in Luria-Bertani medium containing 100 mg/L ampicillin and 34 mg/L chloramphenicol, and AHASS recombinant proteins were routinely purified from 1 liter of cell culture. Cells were incubated at 37°C until OD600 of 0.7 to 0.8 and were cooled on ice; isopropyl β-d-1-thiogalactopyranoside (Denville Scientific) was added to a final concentration of 0.5 mM, and cell cultures were incubated overnight at 22°C (for OMR1 expression), 16°C (for the expression of AHASL, AHASS1, and AHASS2), or room temperature (21 to 25°C, for IPMS1 expression). Cells were harvested by centrifugation the next morning and the cell pellets were stored at −80°C until use.
His-Tagged Protein Purification
All proteins in this study were purified with Ni-NTA agarose (Qiagen) following the manufacturer's instructions. Purification steps were performed at 4°C. Ni-NTA agarose was equilibrated with the corresponding lysis buffer before binding to the proteins. To purify His-tagged OMR1 proteins, the cell pellet was homogenized in 45 mL lysis buffer A (pH 8.0, 50 mM potassium phosphate, 10 mM imidazole, 300 mM NaCl, and 1 mM Ile) and disrupted with a sonicator (W225; Heat Systems Ultrasonics) using eight 30-s pulses at 50% power. Cell lysates were cooled on ice for 2 min between pulses. Insoluble cell debris was removed by a 15 min centrifugation at 12,500g at 4°C, and the supernatant was incubated with Ni-NTA agarose resin on a shaker at 4°C for ∼1 h. The protein-bound resin was then transferred to a Poly-Prep chromatography column (2 mL bed volume, 10 mL reservoir; Bio-Rad) and washed with 30 mL of wash buffer (lysis buffer A containing 20 mM imidazole). His-tagged OMR1 protein was eluted with 3 mL of elution buffer (lysis buffer A containing 200 mM imidazole). Protein eluates were desalted into 4 mL buffer containing 50 mM HEPES, pH 7.5, 1 mM EDTA, 1 mM DTT, 1 mM Ile, and 10% (v/v) glycerol using an Econo-Pac 10 DG column (Bio-Rad). OMR1 proteins were concentrated to ∼20 mg/mL with Amicon Ultra-15 10,000 NMWL centrifugal filters (Millipore), aliquoted, snap frozen with liquid nitrogen, and stored at −80°C. Protein concentration was determined using the Bio-Rad protein assay system with BSA (Sigma-Aldrich) as a standard. For the purification of the feedback-resistant OMR1D enzymes, 5 mM Ile was added to the purification buffers.
Purification of His-tagged AHASL was performed with 12 mL lysis buffer B (50 mM Tris-HCl buffer, pH 7.5, 300 mM NaCl, 5 mM MgCl2, 10 µM flavin adenine dinucleotide [FAD; Sigma-Aldrich], and 15% [v/v] glycerol), 8 mL wash buffer (lysis buffer B containing 30 mM imidazole but no glycerol), and 3 mL elution buffer (buffer B with 200 mM imidazole but no glycerol). AHASL protein eluate was then desalted into 4 mL desalting buffer (25 mM potassium phosphate, pH 7.5, 5 mM MgCl2, 10 µM FAD, and 15% [v/v] glycerol), and stored at −80°C.
AHASS1 and AHASS2 recombinant proteins were purified with 45 mL lysis buffer, 30 mL wash buffer, and 3 mL elution buffer, and then desalted into 4 mL desalting buffer. The compositions of the buffers were the same as that used for AHASL except that FAD was not added.
To purify His-tagged IPMS1, the cell pellet was homogenized with 12 mL lysis buffer C (50 mM Tris-HCl buffer, pH 8.0, 300 mM NaCl, 10 mM imidazole, 10% [v/v] glycerol, and 10 mM of MgCl2), and resin-bound protein was washed with 8 mL wash buffer (lysis buffer C with 30 mM imidazole but no glycerol) and eluted with 3 mL elution buffer (lysis buffer C with 250 mM imidazole but no glycerol). IPMS1 proteins were desalted immediately into 4 mL buffer containing 50 mM Tris-HCl (pH 8.0), 1 mM MgCl2, and 10% (v/v) glycerol. Due to the instability of the proteins, IPMS1 enzyme assays were performed immediately after protein purification.
Protein purification, desalting, and determination procedures for AHASL, AHASS1, AHASS2, and IPMS1 were the same as those for OMR1.
Enzyme Assays
OMR1 enzyme activity assays were performed by monitoring the formation of 2-oxobutanoate (Wessel et al., 2000; Niehaus et al., 2014). Reaction mix (100 μL) containing 100 mM potassium phosphate buffer (pH 8.0), 40 mM l-Thr (Sigma-Aldrich), 0.05 µM enzyme, and varying concentrations of l-Ile (Sigma-Aldrich) (for testing Ile inhibition) or 100 mM potassium phosphate buffer (pH 8.0), 0.05 µM enzyme, and various concentrations of l-Thr (for kinetic measurements) was incubated at room temperature and 2-oxobutanoate was measured by absorbance at 230 nm using a multilabel plate reader (2104 EnVision) at 20 min. Pre-experiments indicated that the enzyme reactions of wild-type and mutant OMR1 proteins were linear for the first 22 min under these assay conditions. A no enzyme reaction was used as a control. Kinetic analysis was performed with Prism (GraphPad Software).
AHAS activity was assayed using the method of Lee and Duggleby (2001) with some modifications. The catalytic subunit AHASL (12 nM) was incubated with ∼300 nM AHASS1 or ∼150 nM AHASS2 at 30°C for 10 min to reconstitute active enzyme. Potassium phosphate buffer (200 mM, pH 7.5), 1 mM thiamine diphosphate, 10 µM FAD, and 10 mM MgCl2 were added and the reaction mixture was incubated at 30°C for another 10 min to allow cofactor binding. To measure the K m and catalytic parameters of the reconstituted enzymes, various concentrations of sodium pyruvate were added to initiate the enzyme reaction. BCAA inhibition of enzyme activity was assayed by simultaneously adding 200 mM sodium pyruvate and amino acid inhibitors of varying concentrations to initiate the enzyme reaction. After incubating at 30°C for 30min, the reaction was quenched with 25 μL 3 M H2SO4, followed by incubation at 60°C for 15 min to convert acetolactate to acetoin. Two hundred microliters of freshly prepared 1:1 mix of 5% α-naphthol solution in 10 M NaOH (Sigma-Aldrich) and 0.5% creatine (Chem Service) was added and incubated at 60°C for another 15 min to convert acetoin to a product with an absorbance peak at 525 nm. OD525 was measured with a spectrophotometer (Thermo Spectronic Biomate 3) and kinetic data acquired by subtracting the OD525 of a no enzyme control. Product production was determined with an acetoin (Sigma-Aldrich) standard curve.
IPMS1 activity was assayed with a previously described spectrophotometric end point assay using 5,5-dithiobis-(2-nitrobenzoic acid) (DTNB, Sigma) (de Kraker et al., 2007). All steps of the assay followed the same procedures used by de Kraker and coworkers except for an extended incubation time at 30°C—20 min instead of 10 min.
qRT-PCR and Transcript Analysis
Total RNA was isolated from the aerial tissue of 2-week-old wild-type Col-0 and the mutants as described above. Aerial tissue was harvested individually from four plants (biological replicates) of the wild-type and each mutant line. Reverse transcription was performed using M-MLV reverse transcriptase (Invitrogen) following the manufacturer's instructions. qRT-PCR was performed on a 7500 Fast real-time PCR system (Applied Biosystems) with Fast SYBR Green PCR master mix (Applied Biosystems). EIF4A1 was used as the endogenous control. Relative changes in the transcript levels of the target genes in the mutants compared with wild-type plants were evaluated using the 2−∆∆Ct method (Livak and Schmittgen, 2001). To compare the transcript levels of AHASS1 and AHASS2 in 2-week-old wild-type Col-0, absolute quantification was performed with the standard curve method. Primers used for qRT-PCR are listed in Supplemental Table 9.
Transcript analysis was performed on ipms1-4, ipms1-5, ipms2-1, and ipms1-1D ipms2-1 with ACTIN2 as a control. Primers used to amplify IPMS1, IPMS2, and ACTIN2 transcripts are summarized in Supplemental Table 9.
Public microarray data used in this study was adapted from AtGenExpress (http://jsp.weigelworld.org/expviz/expviz.jsp) (Schmid et al., 2005).
Amino Acid Extraction and LC-MS/MS Analysis
Wild-type Col-0 and mutants for amino acid profiling were grown at 22°C, 16/8-h light/dark cycle (a mix of cool white fluorescent and incandescent bulbs was used; the irradiance was 100 µmol m−2 s−1 photosynthetic photon flux density). omr1D, ahass2-1D, ipms1-1D, ahass1, ahass2, ipms1, and ipms2 single mutants and ipms1-1D ipms2 double mutants were planted in soil-less mix (Redi-earth; Hummert). Aerial parts of the 2-week-old seedlings (10–20 mg) or dry seeds (5–7 mg) from six to eight individual plants (biological replicates) of wild-type Col-0 and each mutant line were extracted and measured individually for free amino acid levels.
For amino acid profiling of the leaves of ahass2-1D/AHASS2;omr1D/OMR1, ipms1-1D/IPMS1;omr1D/OMR1 and ahass2-1D/AHASS2;ipms1-1D/IPMS1 double heterozygous mutants, crosses were made between the homozygous feedback-resistant single mutants and between wild-type Col-0 and the homozygous single mutants. F1 seeds of the resulting single and double mutants as well as wild-type Col-0 were sown on half-strength MS plates and aerial tissue of the 2-week-old seedlings was harvested for the amino acid assay.
To test free amino acid levels in ahass1/ahass1;ahass2-1D/AHASS2 double mutants, the homozygous ahass2-1D mutant tfl106 was crossed with homozygous ahass1-1 and ahass1-2, respectively. The resulting F1 plants were allowed to self-pollinate to produce F2 seeds. F2 seeds from the two populations were sown on MS plates containing 0.2 mM TFL and ahass1/ahass1;ahass2-1D/AHASS2 (homozygous for the T-DNA insertion on AHASS1 and heterozygous for the feedback-resistant mutation on AHASS2) and ahass2-1D/AHASS2 (heterozygous ahass2-1D and wild-type AHASS1) F2 individuals selected from the resistant plants via genotyping. These F2 plants were allowed to self-pollinate to generate F3 seeds. F3 seeds were sown on MS plates containing 0.2 mM TFL and 1-week-old resistant plants were transplanted onto unsupplemented MS plates and grown for another week. A small portion of the expanded leaf from each 2-week-old F3 seedling was archived onto FTA PlantSaver cards (GE Healthcare) for genotyping and the remaining aerial tissue was harvested and stored at −80°C. The harvested F3 seedlings at −80°C with desired genotypes were analyzed for free amino acids. Wild-type Col-0, ahass2-1D/AHASS2 F1, and homozygous ahass1 and ahass2-1D mutants were planted, harvested, and assayed using the same procedure, except that wild-type Col-0 and homozygous ahass1 mutants were grown on MS plates without TFL before transplanting onto unsupplemented MS plates. To be consistent, a small portion of the expanded leaf was removed from all plants that were subjected to the amino acid assay.
Leaf and seed amino acid extractions for LC-MS/MS (liquid chromatography-tandem mass spectrometry) analysis followed a previously documented method (Angelovici et al., 2013) with some modifications. The extraction buffer was prepared with 12 isotope-labeled amino acid standards (Cambridge Isotope Laboratories); it contains 12 µM Gly-D2-15N1, 8 µM dl-Ala-D4 and dl-Asp-D3, and 4 µM l-Gln-U-13C5, l-Leu-D10, l-Lys:2HCl-U-13C6 15N2, l-His-D3, l-Met-D3, l-Phe-D8, Ser-D3, l-Trp-D5, and l-Val-D8. DTT (Roche) was added to the extraction buffer to a final concentration of 19 µM. Less than 20 mg fresh leaf tissues or 5 to 7 mg dry seeds were disrupted with a TissueLyser (Qiagen). Dry seeds were homogenized in 400 μL extraction buffer, and frozen leaf tissues were homogenized first and then suspended in 400 μL extraction buffer. The mixture was incubated at 90°C for 5 min and then centrifuged at 3200g for 30 min; the supernatant was transferred to a 0.45-µm low binding hydrophilic polytetrafluoroethylene filter plate (Millipore) and centrifuged at 2000g for 30 min. Flow-through was collected and stored at −80°C until analysis. A series of samples that contained the 12 heavy-labeled amino acid standards at the same concentrations as that in the extraction buffer as well as the 20 standard amino acids (Sigma-Aldrich) at various concentrations (from 0.1–100 µM) were prepared to generate the calibration curve.
Leaf and seed extracts as well as the standard curve samples were analyzed by LC-MS/MS with the published 5.6 min, three-function method with some modifications (Angelovici et al., 2013). In addition to the 18 amino acids Angelovici et al. measured, we analyzed Asn in seeds and both Asn and Cys in seedlings.
Statistical Analysis
Statistically significant groups in this study were determined by Student's t tests or ANOVA analysis followed by multiple comparisons based on Duncan's multiple range test (Duncan, 1955). See Supplemental File 3 for ANOVA tables.
Accession Numbers
GenBank/EMBL accession numbers for sequences used to build the AHASS and IPMS phylogenetic trees are listed in Supplemental Figures 8 and 9, respectively. The Arabidopsis Genome Initiative gene identifiers for the genes used in this study are as follows: At3g10050 (OMR1), At2g31810 (AHASS1), At5g16290 (AHASS2), At3g48560 (AHASL), At1g18500 (IPMS1), At1g74040 (IPMS2), At1g31230 (AK-HSDH I), At3g13920 (EIF4A1), and At3g18780 (ACTIN2).
Supplemental Data
Supplemental Figure 1. Transcript profiles of Arabidopsis IPMS1 and IPMS2 in different tissues and developmental stages.
Supplemental Figure 2. Transcript analysis of ipms loss-of-function single and double mutants.
Supplemental Figure 3. Comparison of AHASS1 and AHASS2 transcript levels during development.
Supplemental Figure 4. Transcript analysis of ahass loss-of-function single mutants.
Supplemental Figure 5. Individual and combined effects of BCAAs on the growth of wild-type Col-0.
Supplemental Figure 6. The AHASS2-1D reconstituted enzyme is resistant to Val+Leu in vitro.
Supplemental Figure 7. The inhibition of wild-type Col-0 and omr1-12D by Val+Leu can be reversed by Ile supplementation.
Supplemental Figure 8. Phylogenetic relationships among AHASS sequences from different species.
Supplemental Figure 9. Phylogenetic relationships among IPMS sequences from different species.
Supplemental Table 1. Summary of OMT- and TFL-resistant mutants.
Supplemental Table 2. Genetic linkage analysis of the OMT and TFL resistance traits.
Supplemental Table 3. OMR1 enzyme kinetic analysis.
Supplemental Table 4. Levels of free BCAAs in doubly heterozygous ahass2-1D/AHASS2;omr1D/OMR1 and ipms1-1D/IPMS1;omr1D/OMR1 mutant seedlings.
Supplemental Table 5. Levels of free BCAAs in doubly heterozygous ahass2-1D/AHASS2;ipms1-1D/IPMS1 mutant seedlings.
Supplemental Table 6. Levels of free BCAAs in ipms feedback-resistant and loss-of-function single and double mutant seedlings.
Supplemental Table 7. Levels of free BCAAs in ahass1 and ahass2 loss-of-function single mutant seedlings.
Supplemental Table 8. Levels of free BCAAs in ahass1/ahass1;ahass2-1D/AHASS2 double mutant seedlings.
Supplemental Table 9. Primers used in this study.
Supplemental Table 10. ABRC stock numbers of the mutants.
Supplemental File 1. AHASS alignment used to construct the phylogenetic tree in Supplemental Figure 8.
Supplemental File 2. IPMS alignment used to construct the phylogenetic tree in Supplemental Figure 9.
Supplemental File 3. ANOVA tables.
Acknowledgments
We thank Dean DellaPenna for providing labeled amino acid standards; Ruthie Angelovici, Jan-Willem de Kraker, Thomas Niehaus, Padmanabhan Kaillathe, and members of the Yan Lu and Last groups for helpful discussions; and Kathryn Harmer for plant care and general lab work. LC-MS/MS assays were performed in the MSU Mass Spectrometry and Metabolomics Core Facility. This work was supported by the National Science Foundation (Grants MCB-119778 and MCB-124400).
Glossary
- BCAA
branched-chain amino acid
- AHAS
acetohydroxyacid synthase
- IPMS
isopropylmalate synthase
- TFL
5,5,5-trifluoro-dl-leucine
- OMT
l-O-methylthreonine
- MS
Murashige and Skoog
- FAD
flavin adenine dinucleotide
- LC-MS/MS
liquid chromatography-tandem mass spectrometry
AUTHOR CONTRIBUTIONS
A.X. and R.L.L. conceived the research, designed the experiments, and wrote the article. A.X. performed the experiments and analyzed the data.
References
Author notes
Address correspondence to [email protected].
The author responsible for distribution of materials integral to the findings presented in this article in accordance with the policy described in the Instructions for Authors (www.plantcell.org) is: Robert L. Last ([email protected]).

Articles can be viewed without a subscription.
