


Abstract
To respond to pathogen attack, selection and associated evolution has led to the creation of plant immune system that are a highly effective and inducible defense system. Central to this system are the plant defense hormones jasmonic acid (JA) and salicylic acid (SA) and crosstalk between the two, which may play an important role in defense responses to specific pathogens or even genotypes. Here, we used the Arabidopsis thaliana-Botrytis cinerea pathosystem to test how the host's defense system functions against genetic variation in a pathogen. We measured defense-related phenotypes and transcriptomic responses in Arabidopsis wild-type Col-0 and JA- and SA-signaling mutants, coi1-1 and npr1-1, individually challenged with 96 diverse B. cinerea isolates. Those data showed genetic variation in the pathogen influences on all components within the plant defense system at the transcriptional level. We identified four gene coexpression networks and two vectors of defense variation triggered by genetic variation in B. cinerea. This showed that the JA and SA signaling pathways functioned to constrain/canalize the range of virulence in the pathogen population, but the underlying transcriptomic response was highly plastic. These data showed that plants utilize major defense hormone pathways to buffer disease resistance, but not the metabolic or transcriptional responses to genetic variation within a pathogen.
INTRODUCTION
The photosynthetic capacity of plants to generate much of their own energy and resources makes them attractive targets for exploitative species, such as microbial pathogens. These attacks can lead to strong selective forces on the plant genome in wild ecosystems and can cause significant financial and yield losses in agricultural crops (Bergelson et al., 2001; Van der Hoorn et al., 2002; Mauricio et al., 2003; Rose et al., 2007; Fisher et al., 2012; Hörger et al., 2012; Züst et al., 2012; Karasov et al., 2014). In turn, pathogens have evolved an array of virulence mechanisms based on their infection strategy that causes a prolonged selection pressure on plants to evolve complex and coherent innate immune systems. The resulting immune system must simultaneously detect and interpret a breadth of potential pathogen signals to mount an appropriate response tailored to the pathogen's infection strategy. For instance, pathogens can be classified based on their feeding requirements (biotrophic versus necrotrophic pathogen) or by their host plant range (specialist versus generalist). Biotrophic pathogens, such as powdery mildews and rusts, infect the host and strive to circumvent triggering the host immune system through the use of effector proteins, which inhibit the detection of the pathogen and/or triggering of the plant immune system (Stergiopoulos and de Wit, 2009; Spanu et al., 2010; Okmen and Doehlemann, 2014). This allows the pathogen to absorb nutrients from the living host cell while avoiding host defenses. This strategy can drive specialization in the pathogen to focus on infecting one or a few species of host plants. By contrast, necrotrophic pathogens are often generalists that can have a broad host range throughout plants and are frequently characterized by a high level of intraspecific genetic diversity relative to specialist pathogens (Bolton et al., 2006; Williamson et al., 2007). These generalist pathogens, such as Botrytis cinerea and Sclerotinia sclerotiorum, actively kill host cells through a combination of toxic metabolites, lytic enzymes, and microRNAs (Lyu et al., 2016). The ubiquitous presence of microbes that differ in host range and infection strategy within an environment means that an individual plant likely interacts with multiple organisms that have a diverse array of infection strategies, and the plant must interpret these disparate signals to mount a coherent defense. To optimize the coordination of these defense responses, the plant utilizes a complex array of mechanisms to perceive the presence of the pathogen and then to transmit this signal via an interacting set of hormone signal transduction pathways to specifically modulate actual defense outputs. However, it is not presently known how these defense signaling pathways coordinately function in the presence of pathogens that have diverse virulence strategies.
The first line of active defense against specialist biotrophic pathogens is the plant eukaryotic innate immune system, which detects the presence of a pathogen and activates pattern-triggered immunity (PTI) (Jones and Dangl, 2006). PTI is a general form of qualitative resistance that functions against nonadapted, nonspecialist pathogens. To circumvent PTI responses, successful specialist pathogens often secrete or inject effector proteins that target diverse host cellular processes to evade or suppress PTI signaling. Selection then drives the formation of plant resistance genes (R genes), such as nucleotide binding site leucine-rich repeat proteins, that can either directly or indirectly detect the presence of the pathogen effectors and trigger effector-triggered immunity (ETI). This creates an evolutionary Red Queen selective cycle (Z-scheme), whereby more resistance genes are created in an ongoing arms race between plant defense and pathogen host immune suppression (Van Valen, 1973; Bergelson et al., 2001; Dangl and Jones, 2001; Jones and Dangl, 2006; Benton, 2009; Pritchard and Birch, 2014; Fei et al., 2016; Iakovidis et al., 2016; Keller et al., 2016). The foundation of this highly specific and mechanistic model of pathogen detection assumes an ecologically intimate specialist connection between host and pathogen, where the individual pathogen species or isolate exists primarily on one or a few plant species. By contrast, the vast ecological host ranges of even individual isolates of generalist pathogens like B. cinerea do not readily fit into the assumptions of this mechanistic model, as this pathogen can simply evade any new resistance mechanism by moving to another equally suitable plant host. While some molecules, such as chitin and mannitol, can trigger PTI to provide resistance against generalist fungi, it is not fully understood how generalist pathogens fit into the intricate host/pathogen coevolution assumption foundational to ETI/PTI (Voegele et al., 2005; Staal et al., 2008; Stergiopoulos and de Wit, 2009; Liu et al., 2012; Meena et al., 2015; Patel and Williamson, 2016).
After the initial pathogen detection by the PTI/ETI systems, these signals integrate via complex plant signaling networks that control the expression of plant defenses to shape downstream defense strategies. These defense transduction and coordination pathways are shaped by the defense hormones salicylic acid (SA) and jasmonic acid (JA) that function to shape downstream immune responses. Commonly, the literature links the SA pathway to defense responses against biotrophic pathogens and the JA pathway to necrotroph/herbivore responses (Vlot et al., 2009; He et al., 2012; Yang et al., 2015). The accumulation of SA and the change of cellular redox state release the defense regulatory protein NONEXPRESSOR OF PATHOGENESIS GENES1 (NPR1) to translocate to the nucleus and interact with members of the basic leucine zipper transcription factor family and induce defense responses (Clarke et al., 1998; Mou et al., 2003; Pieterse and Van Loon, 2004; Mukhtar et al., 2009; Moreau et al., 2012; Wu et al., 2012; Yan and Dong, 2014; Saleh et al., 2015). The JA response is mediated by the bioactive JA-Ile conjugate stimulating the interaction of the E3 ubiquitin ligase SCFCOI1 with the JA-ZIM-domain (JAZ) (Xie et al., 1998; Xu et al., 2002; Wasternack, 2007; Browse, 2009). This leads to the degradation of the JAZ proteins that repress transcription of JA-responsive genes by binding transcriptional activators (i.e., MYC2 and the APETALA2/ethylene-responsive element binding factor [AP2/ERF] transcription factor ORA59) (Thines et al., 2007; Pré et al., 2008; Chini et al., 2009; Sheard et al., 2010; Zarei et al., 2011; Zander et al., 2014; Zhang et al., 2015b). At the level of individual gene expression, the JA and SA signaling pathways appear to competitively intercommunicate, or crosstalk, which can result in antagonistic molecular interactions between these two pathways, potentially to optimize the defense to the specific attacker (Thaler et al., 2012; Caarls et al., 2015). Most studies of these signaling pathways have largely been conducted using specialist pathogens and/or individual genotypes of other pathogens with the assumption that these pathways function similarly across a diverse array of pathogen genotypes of the same or different taxonomic groups. However, given that generalists can have genetically diverse pathogen genotypes and contain significant variation in virulence mechanisms, it is possible that studying how this variation interacts with plant defense pathways could affect our view of how plant defense signaling functions. One possibility is that the defense signaling pathways help the plant to canalize its defense response across a broad array of pathogen genetic diversity. In this context, we define canalization as production by the plant host of a narrow range of phenotypes when confronted with a wide range of pathogen diversity (Waddington, 1942, 1959; Queitsch et al., 2002; Lachowiec et al., 2016). Another response to a diverse array of virulence mechanisms could be a plastic response where the range remains the same but the specific response is shifted, or finally, no change in canalization or plasticity. The degree to which each of these phenomena contribute to host defense responses remains an open question.
The Arabidopsis thaliana-B. cinerea pathosystem is an ideal system to investigate how the plant innate immune system coordinates decisions in the presence of natural intraspecific genetic diversity within the pathogen. B. cinerea is a necrotrophic pathogen that causes significant crop losses both pre- and postharvest, most dramatically in the developing world (Williamson et al., 2007). Additionally, B. cinerea is a true haploid ascomycete that infects a wide range of evolutionarily distinct plant hosts, from bryophytes to eudicots. B. cinerea has elevated natural genetic variation that results in multiple major-effect polymorphisms in known virulence mechanisms, including the production of phytotoxic metabolites (Colmenares et al., 2002; Dalmais et al., 2011), enzymes that detoxify plant defense metabolites (Ferrari et al., 2003; Pedras et al., 2005, 2007, 2008, 2009, 2011; Stefanato et al., 2009; Rowe et al., 2010), and the ability to degrade plant cell walls (Rowe and Kliebenstein, 2007; Schumacher et al., 2012, 2015; Kumari et al., 2014). Because wild B. cinerea isolates have recombination and random mating, a population of isolates is a random intermixed sample of the diverse virulence mechanisms (Rowe and Kliebenstein, 2007; Kretschmer et al., 2009; Rowe et al., 2010; Kumari et al., 2014; Atwell et al., 2015; Corwin et al., 2016a, 2016b; Zhang et al., 2016). This allows us to use a population of isolates to challenge a plant's innate immune system with a diverse array of natural inputs from a single pathogen species and assess the flexibility of the signaling network (Finkers et al., 2007a, 2007b; Rowe and Kliebenstein, 2008; Davis et al., 2009; Corwin et al., 2016b; Zhang et al., 2016).
To test how plants respond to a high level of standing genetic variation in a generalist necrotrophic pathogen, we infected Arabidopsis with 96 genetically diverse natural B. cinerea isolates. This was done by infecting three Arabidopsis genotypes, including wild-type Columbia-0 (Col-0) and two immune-deficient mutants, coi1-1 (jasmonate insensitive) and npr1-1 (defective in some SA-mediated defenses), to allow us to measure the quantitative influence of the SA and JA defense pathways in the response to pathogen diversity and their role in canalization of defense responses. Defense response traits, such as lesion size, camalexin production, and the plant's transcriptomic response were measured in a replicated and randomized complete block design, which allowed for all Arabidopsis × B. cinerea genotypic combinations to be tested. Using this experimental design, we partitioned the effects of genetic variation in the host and pathogen variation as well as their interactions. The variation for the vast majority of Arabidopsis transcripts was controlled by an equal interaction of hormone-perception variation in Arabidopsis and genetic variation in B. cinerea. By coupling principal component analysis (PCA) with gene coexpression networks, we identified four main host response networks that were the predominant targets of the genetic interaction between host and pathogen. These networks included genes focused on camalexin production, a suite of plastid-encoded genes and two other defense pathways. Furthermore, COI1 (CORONATINE INSENSITIVE1) and NPR1 appeared to canalize the response to the diverse pathogens when measuring resistance, but not when measuring transcriptomic responses. Instead, the SA and JA pathways appear to provide alternative molecular signaling routes to obtain similar phenotypic outcomes in response to the diverse pathogen isolates.
RESULTS
Natural Genetic Variation of B. cinerea Alters Lesion Area on Arabidopsis
To test how genetic variation within the species B. cinerea differentially probes the major plant defense pathways, we infected a collection of 96 diverse B. cinerea isolates onto the Col-0 accession of Arabidopsis (Supplemental Data Set 1) (Atwell et al., 2015; Corwin et al., 2016a). This collection of natural isolates was obtained mainly from California with a sampling of available international germplasm. They represent a wide range of genomic, phenotypic, and virulence variation (Rowe and Kliebenstein, 2007; Atwell et al., 2015; Corwin et al., 2016a). In conjunction with wild-type Col-0, we also included the immuno-compromised, single-gene knockout mutants coi1-1 and npr1-1, which abolish or diminish the major defense processing of the JA and SA pathways respectively (Xie et al., 1998; Xu et al., 2002; Thines et al., 2007; Chini et al., 2009; Sheard et al., 2010; Yan and Dong, 2014). Plants were infected with 6-fold replication across two independent experiments using a randomized complete block design for a total of 12 infected leaves per isolate/mutant pair. Two infected leaves per experiment were collected at 16 h postinfection (HPI) to measure plant transcript abundance in response to the diverse B. cinerea genotypes. The remaining four infected leaves within each experiment were imaged at 72 HPI to measure lesion area and collected for camalexin extraction. Each individual infection consists of a single 4 μL droplet of 40 spores diluted in 0.5× organic grape juice. While this provides a small energy boost to the germinating spores, B. cinerea also typically requires sugars as germination signals and this helps to ensure consistent germination (Cotoras et al., 2009). This detached leaf assay system has been successfully utilized to understand the Arabidopsis-B. cinerea pathosystem (ten Have et al., 1998; Thomma et al., 1999a; Ferrari et al., 2003; Denby et al., 2004; Kliebenstein et al., 2005; Han et al., 2010; Windram et al., 2012). As with any experimental system, changing the inoculum media may alter the specific patterns observed.
To determine whether natural genetic variation in the B. cinerea population has heritable effects on lesion area and camalexin abundance, we used a general linear model (GLM), which assumes a Gaussian distribution, to estimate broad sense heritability (H2) as well as model-corrected means (LSMeans) and se (Supplemental Data Set 2). The residuals from these models adhere to Gaussian distribution confirming the a priori assumptions. Heritability due to variation across the B. cinerea isolates measures the fraction of lesion area variation that can be contributed to natural genetic variation in this B. cinerea population. The Arabidopsis genotype-specific heritability is the phenotypic variation solely controlled by the differences among Arabidopsis genotypes (i.e., wild-type Col-0, JA-insensitive mutant coi1-1, and SA-insensitive mutant npr1-1). By contrast, the heritability attributed to the interaction between pathogen isolate and host genotype illustrates the degree to which plant genotypes respond differentially among the B. cinerea isolates in a nonadditive fashion. Natural genetic variation in the pathogen population and variation among the immuno-compromised Arabidopsis defense mutants significantly influenced lesion area to a similar extent, as they account for the same proportion of variance (H2 Isolate = 0.164, H2 HostGenotype = 0.151, respectively; Table 1, Figure 1A). There was also a significant interaction between pathogen and plant genotypes that contributed about one third of the heritability of the host or pathogen alone, showing that the pathogen's genetic variation differentially interacts with the host defense pathways (H2 Isolate x HostGenotype = 0.047; Table 1, Figure 1A). To explore how isolates differentially interact with the host defense pathways, we used model-corrected means and standard errors for each isolate in downstream analyses.
F-Tables of the GLM for Lesion Area and Induced Camalexin Accumulation
| Lesion Area | Camalexin | |||||||||
|---|---|---|---|---|---|---|---|---|---|---|
| Factor | df | SS | F Value | P Value | H2 | df | SS | F Value | P Value | H2 |
| Experiment | 1 | 346,818 | 1,569.48 | <0.0001 | 1 | 45,191 | 1,473.27 | <0.0001 | ||
| Plant Geno | 2 | 214,653 | 485.69 | <0.0001 | 0.164 | 2 | 20,824 | 339.44 | <0.0001 | 0.152 |
| Isolate Geno | 95 | 197,493 | 9.41 | <0.0001 | 0.151 | 95 | 5,900 | 2.02 | <0.0001 | 0.043 |
| Exp:GFlat | 6 | 31,410 | 23.69 | <0.0001 | 6 | 3,989 | 21.68 | <0.0001 | ||
| Plant:Isolate | 190 | 61,607 | 1.47 | <0.0001 | 0.047 | 189 | 5,916 | 1.02 | 0.414 | 0.043 |
| Exo:GFlat:AFlat | 24 | 26,866 | 5.07 | <0.0001 | 24 | 1,708 | 2.32 | <0.0001 | ||
| Residuals | 1,944 | 429,577 | 1743 | 53,465 | ||||||
F-tables from the whole-experiment GLM across three Arabidopsis genotypes for lesion area and camalexin accumulation using type II sums of squares. The GLM includes terms for the experiment (Exp), growing flat (GFlat), agar flat (AFlat), plant genotype (Plant Geno), and isolate genotype (Isolate Geno) and the interaction of plant and isolate genotype (Plant:Isolate). Agar flat is nested within growing flat that is nested within experiment. df is the degrees of freedom for each term within the model. SS is the type II sum of squares variation. F-value and P value indicate the statistical significance for a given term within the model. The broad-sense heritability (H2) was estimated for B. cinerea isolate and/or Arabidopsis genotype, as well as their interaction in the model.
| Lesion Area | Camalexin | |||||||||
|---|---|---|---|---|---|---|---|---|---|---|
| Factor | df | SS | F Value | P Value | H2 | df | SS | F Value | P Value | H2 |
| Experiment | 1 | 346,818 | 1,569.48 | <0.0001 | 1 | 45,191 | 1,473.27 | <0.0001 | ||
| Plant Geno | 2 | 214,653 | 485.69 | <0.0001 | 0.164 | 2 | 20,824 | 339.44 | <0.0001 | 0.152 |
| Isolate Geno | 95 | 197,493 | 9.41 | <0.0001 | 0.151 | 95 | 5,900 | 2.02 | <0.0001 | 0.043 |
| Exp:GFlat | 6 | 31,410 | 23.69 | <0.0001 | 6 | 3,989 | 21.68 | <0.0001 | ||
| Plant:Isolate | 190 | 61,607 | 1.47 | <0.0001 | 0.047 | 189 | 5,916 | 1.02 | 0.414 | 0.043 |
| Exo:GFlat:AFlat | 24 | 26,866 | 5.07 | <0.0001 | 24 | 1,708 | 2.32 | <0.0001 | ||
| Residuals | 1,944 | 429,577 | 1743 | 53,465 | ||||||
F-tables from the whole-experiment GLM across three Arabidopsis genotypes for lesion area and camalexin accumulation using type II sums of squares. The GLM includes terms for the experiment (Exp), growing flat (GFlat), agar flat (AFlat), plant genotype (Plant Geno), and isolate genotype (Isolate Geno) and the interaction of plant and isolate genotype (Plant:Isolate). Agar flat is nested within growing flat that is nested within experiment. df is the degrees of freedom for each term within the model. SS is the type II sum of squares variation. F-value and P value indicate the statistical significance for a given term within the model. The broad-sense heritability (H2) was estimated for B. cinerea isolate and/or Arabidopsis genotype, as well as their interaction in the model.
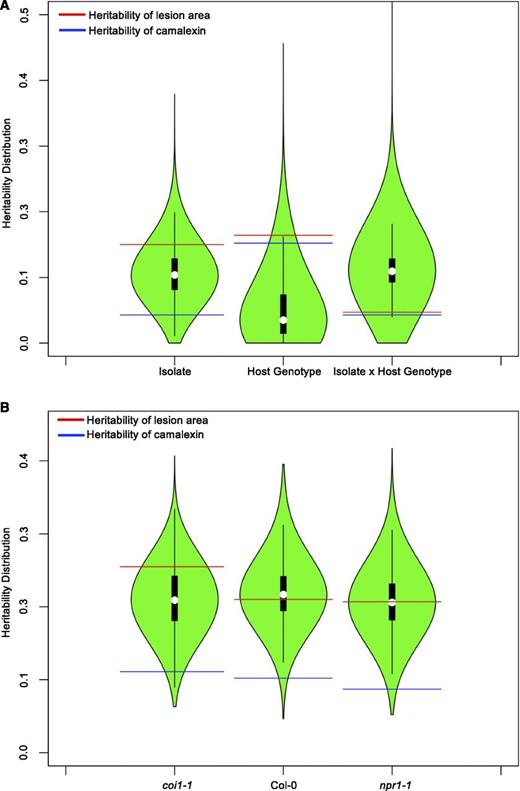
Distribution of Genetic Variation Controlling Defense Responses.
Violin plots illustrating the distribution of estimated broad-sense heritability (H2) values for transcripts responding to 96 B. cinerea isolates across Arabidopsis genotypes. Heritability is partitioned across the different sources, 96 pathogen genotypes (Isolate), the Col-0, coi1-1, and npr1-1 plant genotypes (Host), and the corresponding interaction. The red lines indicate heritability values for lesion area, while blue shows those for camalexin accumulation in the same experiments. Plant defense-related phenotypes of camalexin accumulation and lesion area were measured on leaves from three Arabidopsis genotypes at 72 HPI with 96 diverse B. cinerea isolates. The transcriptomic analysis was conducted by sequencing mRNA extracted from infected Arabidopsis leaves at 16 HPI.
(A) Heritability distributions for all 23,898 detected Arabidopsis transcripts in B. cinerea infected plant tissues.
(B) Heritability values for Arabidopsis transcripts in B. cinerea infected plant tissues estimated by individually modeling the Col-0, coi1-1, and npr1-1 genotypes. The Arabidopsis genotypes are presented on the horizontal axis.
Using the entire population of 96 B. cinerea isolates to compare the Arabidopsis genotypes’ effect on B. cinerea showed that both the coi1-1 and npr1-1 mutations have a significant effect on lesion area compared with wild-type Col-0 (Table 1, Figure 2; an interactive plot, see Supplemental Data Set 3). The dramatic increase in lesion area of coi1-1 agrees with previous work showing that JA signaling is important for Arabidopsis defense against necrotrophs (Figure 2B) (Thomma et al., 1998, 1999b; Denby et al., 2004; Ferrari et al., 2007; Rowe et al., 2010). Interestingly, the npr1-1 mutant in SA signaling also showed a significantly increased susceptibility to the genetically diverse B. cinerea population, albeit with a smaller lesion relative to coi1-1 (Figure 2B). This shows that the SA-mediated innate immune responses also play an important role in plant resistance to necrotroph pathogens. Additionally, the significant interaction of pathogen and host implied that the pathogen genotypes elicit different responses across the immune compromised mutants, which led us to search for alternative patterns using hierarchical clustering (Figure 2A; for an interactive plot, see Supplemental Data Set 3). One major pattern is represented by the common B05.10 model isolate, where virulence is similar on the wild-type Col-0 and npr1-1 genotypes, with the coi1-1 mutant having increased susceptibility (Figure 2F) (Rowe et al., 2010). A contrasting pattern is illustrated by isolate 1.03.22 that maintains the enhanced virulence on coi1-1, but also displayed enhanced virulence on npr1-1 (Figure 2C). A third pattern as shown by isolate Apple 404 supports the theoretical antagonism, where there is increased virulence on the JA signaling mutant, coi1-1, and decreased virulence on the SA signaling mutant, npr1-1 (Figure 2D). A final pattern as shown by 2.04.11 is one in which the coi1-1 and npr1-1 mutants did not have any effect on the interaction (Figure 2E). We were unable to identify broader patterns in the isolates as there were no significant associations with any metadata related to these isolates, such as geography or host origin. Thus, this shows that there is variation within this population in how B. cinerea interacts with the Arabidopsis wild-type Col-0, npr1-1, and coi1-1.
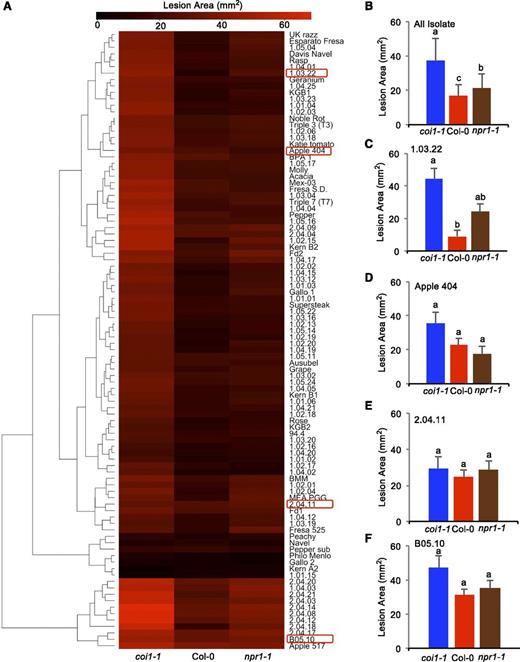
Variation in Arabidopsis Susceptibility across Host Genotypes Driven by Natural Genetic Variation in B. cinerea.
Model-corrected lesion area means were estimated using the linear model with all the data from three Arabidopsis genotypes at 72 HPI with 96 B. cinerea isolates. The three Arabidopsis genotypes are either labeled at the bottom of the figure in (A) or shown with different color bars in (B) to (F), with red for wild-type Col-0, blue for the JA-insensitive mutant coi1-1, and brown for the SA mutant npr1-1. Error bars represent se for eight total samples across two independent experiments (n = 8).
(A) Hierarchical clustering of lesion areas produced by 96 B. cinerea isolates across Arabidopsis genotypes. Color key indicates the lesion area value. Red boxes show the position of isolates highlighted in (C) to (E).
(B) The average lesion area produced by 96 B. cinerea isolates within each Arabidopsis genotype.
(C) Lesion area of isolate 1.03.22.
(D) Lesion area of isolate Apple 404.
(E) Lesion area of isolate 2.04.11.
(F) Lesion area of isolate B05.10. Different letters above each bar show significant differences as determined by post-hoc Tukey's HSD test following linear modeling.
Variation in Camalexin Accumulation in Response to B. cinerea Genetic Variation
To compare lesion formation to plant biochemical defense responses to genetic variation in B. cinerea, we measured the induction of camalexin accumulation across the three host genotypes at 72 HPI. Camalexin is a known phytoalexin in Arabidopsis that provides defense against B. cinerea depending upon the ability of the fungus to detoxify camalexin (Zhou et al., 1999; Stefanato et al., 2009; Rowe et al., 2010). Genetic variation in the host and pathogen significantly affected camalexin accumulation (Table 1; Supplemental Figure 1 and for an interactive plot, see Supplemental Data Set 4). However, unlike lesion area, there was no significant evidence for an interaction between host and pathogen genetic variation. Compared with heritability for lesion area, camalexin displayed a lower pathogen-dependent heritability (H2 Isolate = 0.043), but with a similar plant-dependent heritability (H2 HostGenotype = 0.152) (Table 1, Figure 1A). This indicates that variation in camalexin accumulation across this experiment is more dependent on differences between the wild-type Col-0, npr1-1, and coi1-1 plants and differences between the isolates than on their nonadditive interaction (Figure 3A).

Correlation between Camalexin Accumulation and Lesion Area across Arabidopsis Genotypes.
The relationship of camalexin and lesion area measured on leaves from three Arabidopsis genotypes at 72 HPI with 96 B. cinerea isolates was compared using model-corrected means. The three Arabidopsis genotypes are wild-type Col-0 (red dot), JA-insensitive mutant coi1-1 (blue triangle), and SA mutant npr1-1 (brown diamond).
(A) Scatterplots are shown comparing camalexin accumulation and lesion area across the 96 isolates within each of the three Arabidopsis genotypes. The 90% confidence ellipse intervals are drawn for each Arabidopsis genotype for reference. The regressions with the highest correlation are shown, with the equations being as follows: coi1-1, y = −2.1x + 40.7, P = 0.013; Col-0, y = −0.06x2 + 0.88x + 14.4, P = 0.014; npr1-1, y = −0.16x2 + 2.2x + 14.6, P = 0.012.
(B) Scatterplots are shown comparing lesion area (top left) and camalexin accumulation (bottom right) across pairwise Arabidopsis genotypes.
Camalexin Has Differential Effectiveness across B. cinerea Genetic Variation
Previous studies using one or a few B. cinerea isolates to focus on genetic difference in the Arabidopsis host have shown a negative correlation between camalexin content and lesion area across host genotypes (Ferrari et al., 2003; Denby et al., 2004; Corwin et al., 2016a, 2016b). This larger population of B. cinerea isolates allows us to test how genetic diversity in the pathogen influences the effectiveness of plant molecular defenses, specifically camalexin. We used a linear model to test correlations between camalexin and lesion area across the isolates in the three Arabidopsis genotypes, which showed a significant negative correlation in coi1-1 (r = −0.28, P valuecoi1-1 = 0.01, n = 96), but no significant linear correlation in wild-type Col-0 and npr1-1 (P valueCol-0 = 0.63, n = 96; P valuenpr1-1 = 0.90, n = 96, respectively) (Figure 3A; Supplemental Table 1). A visual analysis of the camalexin × lesion area plot for Col-0 infected leaves suggested the potential for a curvilinear relationship, which was confirmed by fitting a significant second-degree polynomial model between the two phenotypes in wild-type Col-0 and npr1-1 (P value ≤ 0.01 for both) (Figure 3A; Supplemental Table 1). There was no significant second-degree polynomial correlation between camalexin and lesion area in coi1-1. The curvilinear relationship in Col-0 and npr1-1 is a positive correlation within lower levels of camalexin accumulation, suggesting that camalexin is responding to increasing pathogen virulence and is not a major contributor to resistance in Col-0 and npr1-1 for those isolates. As camalexin accumulates beyond the inflection point of the curve (∼8 ng/mm), the relationship turns negative suggesting that camalexin is beginning to contribute to host resistance (Figure 3A). Interestingly, these different shaped correlations between camalexin and lesion size across the host genotypes was not reflected in different correlations of lesion across the host genotypes (Figure 3B). However, it should be noted that the residuals are not evenly distributed in these correlations suggesting a higher-order structure to lesion size (Figure 3B). This contradiction in relationships between camalexin and lesion area between the genotypes indicates that while JA-dependent signaling is important for camalexin defense, there are other signals able to induce camalexin in the absence of JA. Thus, the pathogen's genetic variation differentially affects lesion area and camalexin accumulation across the host genotypes.
Plasticity in the Arabidopsis Transcriptomic Response to B. cinerea Genetic Variation
The camalexin analysis suggested that Arabidopsis biochemical responses to B. cinerea natural genetic variation may highlight different aspects of the interaction than are observable with lesion area. To conduct a broader survey of the molecular basis of the plant defense response against the B. cinerea invasion, we performed transcriptomic analysis by sequencing mRNA extracted from infected Arabidopsis leaves at 16 HPI. This time point was chosen as there should be minimal lesion outgrowth from the initial infection site and represents a significant switch in the Arabidopsis transcriptome in response to B. cinerea infection (Windram et al., 2012). The transcriptome of each Arabidopsis genotype × B. cinerea isolate combination was measured in fourfold replication across two independent experiments, including uninfected control (mock-treated) samples, for each Arabidopsis genotype. Specifically, there are two independent samples for each Arabidopsis genotype × B. cinerea isolate in each of two independent experiments providing four samples total. Each sample was made into an independent library and sequenced as a pool of 96 providing on average 1,172,000 ± 26,000 mappable Arabidopsis reads per library, or ∼4,500,000 reads per Arabidopsis genotype × B. cinerea isolate interaction. Using a negative binomial GLM, we tested for significance of all factors on each Arabidopsis transcript and obtained the proportion of variation (η2) due to the pathogen genotypes and plant mutants, least square means (log2), and se for transcript abundance (Table 2; Supplemental Data Sets 5 to 7).
Hub Genes and Bottlenecks Identified from Four Gene Coexpression Networks across Arabidopsis Genotypes
| Net | AGI | Gene | Function | Col-0 | coi1-1 | npr1-1 |
|---|---|---|---|---|---|---|
| I | AT1G02920 | GSTF7 | Glutathione S-transferase F7 | Hub_4 | Hub_27/BN_31 | |
| AT1G02930 | GSTF6 | Glutathione S-transferase F6 | Hub_34/BN_31 | |||
| AT1G10700 | PRS3 | Phosphoribosyl pyrophosphate synthase 3 | Hub_13 | BN_39 | ||
| AT1G15520 | ABCG40 | ABC transporter G family member 40 | Hub_1/BN_1 | Hub_16/BN_28 | ||
| AT1G25220 | ASB1 | Anthranilate synthase beta subunit 1 | Hub_3/BN_9 | BN_3 | Hub_4/BN_10 | |
| AT1G26420 | FOX5 | Flavin-dependent oxidoreductase FOX5 | Hub_36/BN_36 | |||
| AT1G28190 | F3H9.15 | Uncharacterized protein | Hub_12/BN_18 | |||
| AT1G32350 | AOX3 | Ubiquinol oxidase 3 | Hub_28/BN_37 | |||
| AT1G60730 | At1g60730 | Probable aldo-keto reductase 5 | Hub_33/BN_21 | |||
| AT1G66580 | RPL10C | 60S ribosomal protein L10-3 | Hub_2/BN_2 | Hub_20/BN_19 | ||
| AT1G74360 | At1g74360 | Probable LRR receptor-like serine | Hub_3 | Hub_11/BN_7 | ||
| AT1G80840 | WRKY40 | Probable WRKY transcription factor 40 | BN_33 | |||
| AT2G04400 | IGPS | Indole-3-glycerol phosphate synthase | Hub_4/BN_12 | Hub_1/BN_3 | ||
| AT2G16900 | At2g16900 | Phospholipase-like protein (PEARLI 4) family | Hub_7/BN_8 | Hub_10/BN_6 | ||
| AT2G17720 | P4H5 | Prolyl 4-hydroxylase 5 | Hub_22/BN_20 | |||
| AT2G30770 | CYP71A13 | Indoleacetaldoxime dehydratase | Hub_32/BN_38 | |||
| AT2G34500 | CYP710A1 | Cytochrome P450 710A1 | Hub_25/BN_26 | |||
| AT2G35980 | YLS9 | Protein YELLOW-LEAF-SPECIFIC GENE9 | Hub_31/BN_40 | |||
| AT2G38860 | DJ1E | Protein YELLOW-LEAF-SPECIFIC GENE5 | Hub_10 | Hub_40 | ||
| AT3G12740 | ALIS1 | ALA-interacting subunit 1 | BN_5 | Hub_2/BN_1 | ||
| AT3G17240 | LPD2 | Dihydrolipoyl dehydrogenase 2 | BN_4 | Hub_13/BN_2 | ||
| AT3G26670 | NIPA8 | Probable magnesium transporter NIPA8 | Hub_19/BN_15 | |||
| AT3G26830 | CYP71B15 | PHYTOALEXIN DEFICIENT3 | Hub_9 | Hub_37 | ||
| AT3G48850 | MPT2 | Mitochondrial phosphate carrier protein 2 | Hub_26/BN_27 | |||
| AT3G48890 | MSBP2 | Membrane steroid-binding protein 2 | Hub_8/BN_3 | Hub_7/BN_17 | ||
| AT3G52400 | SYP122 | Syntaxin-122 | Hub_23/BN_5 | |||
| AT3G54640 | TSA1 | Tryptophan synthase alpha chain | Hub_6 | BN_1 | Hub_18/BN_29 | |
| AT4G05020 | NDB2 | NAD(P)H-ubiquinone oxidoreductase B2 | Hub_38/BN_23 | |||
| AT4G20830 | At4g20830 | Reticuline oxidase-like protein | Hub_1/BN_4 | Hub_8/BN_11 | ||
| AT4G25030 | F13M23.10 | AT4G25030 protein | Hub_11/BN_7 | |||
| AT4G36988 | CPuORF49 | Uncharacterized protein | BN_11 | Hub_24/BN_25 | ||
| AT4G36990 | HSFB1 | Heat stress transcription factor B-1 | Hub_9/BN_12 | |||
| AT4G37370 | F6G17.20 | Cytochrome P450 | Hub_35/BN_35 | |||
| AT5G04930 | ALA1 | Aminophospholipid flippase 1 | BN_32 | |||
| AT5G05730 | ASA1 | Anthranilate synthase alpha subunit 1 | Hub_2/BN_6 | Hub_6/BN_16 | ||
| AT5G08300 | At5g08300 | Succinyl-CoA ligase | BN_13 | Hub_29/BN_13 | ||
| AT5G08790 | NAC081 | NAC domain-containing protein 81 | Hub_12 | Hub_3/BN_4 | ||
| AT5G12930 | T24H18_90 | Uncharacterized protein | BN_30 | |||
| AT5G13080 | WRKY75 | Probable WRKY transcription factor 75 | Hub_39 | |||
| AT5G13490 | AAC2 | Adenine nucleotide translocator 2 | Hub_14/BN_8 | |||
| AT5G17990 | TRP1 | Anthranilate phosphoribosyltransferase | Hub_21/BN_22 | |||
| AT5G25930 | T1N24.22 | Leucine-rich repeat receptor-like protein kinase | Hub_17/BN_24 | |||
| AT5G38900 | At5g38900 | FrnE protein-like | Hub_30/BN_34 | |||
| AT5G54500 | FQR1 | Flavodoxin-like quinone reductase 1 | BN_2 | Hub_15/BN_14 | ||
| AT5G54810 | TSB1 | Tryptophan synthase beta chain 1 | Hub_5/BN_10 | Hub_5/BN_9 | ||
| II | ATCG00860 | YCF2-1 | Protein Ycf2.1 | Hub_1/BN_1 | Hub_1/BN_1 | |
| ATCG01280 YCF2-2 | Protein Ycf2.2 | Hub_2/BN_2 | Hub_2/BN_2 | |||
| III | AT1G68840 | RAV2 | AP2/ERF and B3 domain-containing transcription repressor | BN_4 | ||
| AT2G16018 | At2g16018 | Uncharacterized protein | Hub_3/BN_1 | |||
| AT2G23880 | Hub_1 | BN_6 | ||||
| AT2G25900 | Hub_1/BN_2 | |||||
| AT3G02515 | At2g25900 | Zinc finger domain-containing protein 23 | Hub_2/BN_3 | BN_2 | ||
| AT3G31442 | Hub_2/BN_3 | Hub_4 | ||||
| AT3G52700 | At3g52700 | Putative uncharacterized protein | BN_4 | |||
| AT3G58780 | SHP1 | Agamous-like MADS box protein AGL1 | Hub_2/BN_5 | |||
| AT5G30269 | Hub_1/BN_1 | |||||
| AT5G24915 | Hub_4 | Hub_5/BN_3 | ||||
| AT5G43065 | Hub_3 | Hub_3/BN_2 | ||||
| AT5G65420 | CYCD4-1 | Cyclin-D4-1 | BN_1 | |||
| IV | AT1G06680 | PSBP1 | Oxygen-evolving enhancer protein 2-1 | Hub_2 | Hub_10 | |
| AT1G08380 | PSAO | Photosystem I subunit O (PSI-O) | Hub_3 | |||
| AT1G31330 | PSAF | Photosystem I reaction center subunit III | Hub_4 | Hub_3/BN_9 | ||
| AT1G32060 | At1g32060 | Phosphoribulokinase | BN_4 | BN_14 | ||
| AT1G54780 | At1g54780 | UPF0603 protein | Hub_7/BN_3 | |||
| AT1G55670 | PSAG | Photosystem I reaction center subunit V | Hub_2 | BN_7 | Hub_8 | |
| AT1G61520 | LHCA3 | Photosystem I chlorophyll a/b binding protein | Hub_4 | |||
| AT1G68010 | HPR | NADH-dependent hydroxypyruvate reductase 1 | BN_3 | BN_8 | ||
| AT1G74470 | CHLP | Geranylgeranyl diphosphate reductase | Hub_5/BN_1 | BN_15 | ||
| AT1G79040 | PSBR | Photosystem II 10-kD polypeptide | BN_13 | |||
| AT2G23880 | Hub_1 | |||||
| AT2G06520 | PSBX | Photosystem II subunit X | BN_2 | BN_10 | ||
| AT2G30570 | PSBW | Photosystem II reaction center W protein | BN_8 | |||
| AT2G46820 | CURT1B | Protein CURVATURE THYLAKOID 1B | Hub_8/BN_5 | Hub_15/BN_7 | ||
| AT3G14420 | GLO1 | Peroxisomal (S)-2-hydroxy-acid oxidase | BN_6 | |||
| AT3G47470 | LHCA4 | Chlorophyll a/b binding protein 4 | Hub_1/BN_3 | Hub_14 | ||
| AT3G54050 | FBP | Fructose-1,6-bisphosphatase | BN_2 | Hub_4/BN_12 | ||
| AT3G56940 | CRD1 | Copper response defect 1 protein | Hub_9/BN_2 | |||
| AT3G61470 | LHCA2 | Photosystem I chlorophyll a/b binding protein 2 | Hub_5/BN_4 | |||
| AT4G01050 | STR4 | Sulfurtransferase 4 | BN_5 | Hub_2/BN_1 | ||
| AT4G05180 | PSBQ2 | Oxygen-evolving enhancer protein 3-2 | Hub_6 | Hub_11 | ||
| AT4G10340 | LHCB5 | Light-harvesting complex II protein 5 | Hub_3 | Hub_12 | ||
| AT4G32260 | atpG | ATP synthase beta chain (subunit II) | Hub_13/BN_4 | |||
| AT5G19940 | PAP8 | Probable plastid-lipid-associated protein 8 | Hub_5/BN_5 | |||
| AT5G66570 | PSBO1 | Oxygen-evolving enhancer protein 1-1 | Hub_1/BN_1 | Hub_7/BN_6 | Hub_6/BN_11 | |
Arabidopsis genes identified as the top 10% of hubs and bottlenecks from the four coexpression networks (Net) in Arabidopsis wild-type Col-0, JA-insensitive mutant coi1-1, and SA-insensitive mutant npr1-1. Hub genes are nodes with more than five edges in a given network. Bottleneck genes (BN) are nodes with a higher score of betweenness centrality in a given network. Genes identified as hub genes and/or bottlenecks are labeled as Hub or BN, respectively, with a rank number of connectivity or score of betweenness centrality. For example, Hub_27/BN_31 indicates the gene AT1G02920 is identified as a hub gene with the 27th highest connectivity and as bottleneck gene with the 31st highest betweenness centrality score in Network I from Arabidopsis mutant npr1-1. AGI, Arabidopsis Genome Initiative.
| Net | AGI | Gene | Function | Col-0 | coi1-1 | npr1-1 |
|---|---|---|---|---|---|---|
| I | AT1G02920 | GSTF7 | Glutathione S-transferase F7 | Hub_4 | Hub_27/BN_31 | |
| AT1G02930 | GSTF6 | Glutathione S-transferase F6 | Hub_34/BN_31 | |||
| AT1G10700 | PRS3 | Phosphoribosyl pyrophosphate synthase 3 | Hub_13 | BN_39 | ||
| AT1G15520 | ABCG40 | ABC transporter G family member 40 | Hub_1/BN_1 | Hub_16/BN_28 | ||
| AT1G25220 | ASB1 | Anthranilate synthase beta subunit 1 | Hub_3/BN_9 | BN_3 | Hub_4/BN_10 | |
| AT1G26420 | FOX5 | Flavin-dependent oxidoreductase FOX5 | Hub_36/BN_36 | |||
| AT1G28190 | F3H9.15 | Uncharacterized protein | Hub_12/BN_18 | |||
| AT1G32350 | AOX3 | Ubiquinol oxidase 3 | Hub_28/BN_37 | |||
| AT1G60730 | At1g60730 | Probable aldo-keto reductase 5 | Hub_33/BN_21 | |||
| AT1G66580 | RPL10C | 60S ribosomal protein L10-3 | Hub_2/BN_2 | Hub_20/BN_19 | ||
| AT1G74360 | At1g74360 | Probable LRR receptor-like serine | Hub_3 | Hub_11/BN_7 | ||
| AT1G80840 | WRKY40 | Probable WRKY transcription factor 40 | BN_33 | |||
| AT2G04400 | IGPS | Indole-3-glycerol phosphate synthase | Hub_4/BN_12 | Hub_1/BN_3 | ||
| AT2G16900 | At2g16900 | Phospholipase-like protein (PEARLI 4) family | Hub_7/BN_8 | Hub_10/BN_6 | ||
| AT2G17720 | P4H5 | Prolyl 4-hydroxylase 5 | Hub_22/BN_20 | |||
| AT2G30770 | CYP71A13 | Indoleacetaldoxime dehydratase | Hub_32/BN_38 | |||
| AT2G34500 | CYP710A1 | Cytochrome P450 710A1 | Hub_25/BN_26 | |||
| AT2G35980 | YLS9 | Protein YELLOW-LEAF-SPECIFIC GENE9 | Hub_31/BN_40 | |||
| AT2G38860 | DJ1E | Protein YELLOW-LEAF-SPECIFIC GENE5 | Hub_10 | Hub_40 | ||
| AT3G12740 | ALIS1 | ALA-interacting subunit 1 | BN_5 | Hub_2/BN_1 | ||
| AT3G17240 | LPD2 | Dihydrolipoyl dehydrogenase 2 | BN_4 | Hub_13/BN_2 | ||
| AT3G26670 | NIPA8 | Probable magnesium transporter NIPA8 | Hub_19/BN_15 | |||
| AT3G26830 | CYP71B15 | PHYTOALEXIN DEFICIENT3 | Hub_9 | Hub_37 | ||
| AT3G48850 | MPT2 | Mitochondrial phosphate carrier protein 2 | Hub_26/BN_27 | |||
| AT3G48890 | MSBP2 | Membrane steroid-binding protein 2 | Hub_8/BN_3 | Hub_7/BN_17 | ||
| AT3G52400 | SYP122 | Syntaxin-122 | Hub_23/BN_5 | |||
| AT3G54640 | TSA1 | Tryptophan synthase alpha chain | Hub_6 | BN_1 | Hub_18/BN_29 | |
| AT4G05020 | NDB2 | NAD(P)H-ubiquinone oxidoreductase B2 | Hub_38/BN_23 | |||
| AT4G20830 | At4g20830 | Reticuline oxidase-like protein | Hub_1/BN_4 | Hub_8/BN_11 | ||
| AT4G25030 | F13M23.10 | AT4G25030 protein | Hub_11/BN_7 | |||
| AT4G36988 | CPuORF49 | Uncharacterized protein | BN_11 | Hub_24/BN_25 | ||
| AT4G36990 | HSFB1 | Heat stress transcription factor B-1 | Hub_9/BN_12 | |||
| AT4G37370 | F6G17.20 | Cytochrome P450 | Hub_35/BN_35 | |||
| AT5G04930 | ALA1 | Aminophospholipid flippase 1 | BN_32 | |||
| AT5G05730 | ASA1 | Anthranilate synthase alpha subunit 1 | Hub_2/BN_6 | Hub_6/BN_16 | ||
| AT5G08300 | At5g08300 | Succinyl-CoA ligase | BN_13 | Hub_29/BN_13 | ||
| AT5G08790 | NAC081 | NAC domain-containing protein 81 | Hub_12 | Hub_3/BN_4 | ||
| AT5G12930 | T24H18_90 | Uncharacterized protein | BN_30 | |||
| AT5G13080 | WRKY75 | Probable WRKY transcription factor 75 | Hub_39 | |||
| AT5G13490 | AAC2 | Adenine nucleotide translocator 2 | Hub_14/BN_8 | |||
| AT5G17990 | TRP1 | Anthranilate phosphoribosyltransferase | Hub_21/BN_22 | |||
| AT5G25930 | T1N24.22 | Leucine-rich repeat receptor-like protein kinase | Hub_17/BN_24 | |||
| AT5G38900 | At5g38900 | FrnE protein-like | Hub_30/BN_34 | |||
| AT5G54500 | FQR1 | Flavodoxin-like quinone reductase 1 | BN_2 | Hub_15/BN_14 | ||
| AT5G54810 | TSB1 | Tryptophan synthase beta chain 1 | Hub_5/BN_10 | Hub_5/BN_9 | ||
| II | ATCG00860 | YCF2-1 | Protein Ycf2.1 | Hub_1/BN_1 | Hub_1/BN_1 | |
| ATCG01280 YCF2-2 | Protein Ycf2.2 | Hub_2/BN_2 | Hub_2/BN_2 | |||
| III | AT1G68840 | RAV2 | AP2/ERF and B3 domain-containing transcription repressor | BN_4 | ||
| AT2G16018 | At2g16018 | Uncharacterized protein | Hub_3/BN_1 | |||
| AT2G23880 | Hub_1 | BN_6 | ||||
| AT2G25900 | Hub_1/BN_2 | |||||
| AT3G02515 | At2g25900 | Zinc finger domain-containing protein 23 | Hub_2/BN_3 | BN_2 | ||
| AT3G31442 | Hub_2/BN_3 | Hub_4 | ||||
| AT3G52700 | At3g52700 | Putative uncharacterized protein | BN_4 | |||
| AT3G58780 | SHP1 | Agamous-like MADS box protein AGL1 | Hub_2/BN_5 | |||
| AT5G30269 | Hub_1/BN_1 | |||||
| AT5G24915 | Hub_4 | Hub_5/BN_3 | ||||
| AT5G43065 | Hub_3 | Hub_3/BN_2 | ||||
| AT5G65420 | CYCD4-1 | Cyclin-D4-1 | BN_1 | |||
| IV | AT1G06680 | PSBP1 | Oxygen-evolving enhancer protein 2-1 | Hub_2 | Hub_10 | |
| AT1G08380 | PSAO | Photosystem I subunit O (PSI-O) | Hub_3 | |||
| AT1G31330 | PSAF | Photosystem I reaction center subunit III | Hub_4 | Hub_3/BN_9 | ||
| AT1G32060 | At1g32060 | Phosphoribulokinase | BN_4 | BN_14 | ||
| AT1G54780 | At1g54780 | UPF0603 protein | Hub_7/BN_3 | |||
| AT1G55670 | PSAG | Photosystem I reaction center subunit V | Hub_2 | BN_7 | Hub_8 | |
| AT1G61520 | LHCA3 | Photosystem I chlorophyll a/b binding protein | Hub_4 | |||
| AT1G68010 | HPR | NADH-dependent hydroxypyruvate reductase 1 | BN_3 | BN_8 | ||
| AT1G74470 | CHLP | Geranylgeranyl diphosphate reductase | Hub_5/BN_1 | BN_15 | ||
| AT1G79040 | PSBR | Photosystem II 10-kD polypeptide | BN_13 | |||
| AT2G23880 | Hub_1 | |||||
| AT2G06520 | PSBX | Photosystem II subunit X | BN_2 | BN_10 | ||
| AT2G30570 | PSBW | Photosystem II reaction center W protein | BN_8 | |||
| AT2G46820 | CURT1B | Protein CURVATURE THYLAKOID 1B | Hub_8/BN_5 | Hub_15/BN_7 | ||
| AT3G14420 | GLO1 | Peroxisomal (S)-2-hydroxy-acid oxidase | BN_6 | |||
| AT3G47470 | LHCA4 | Chlorophyll a/b binding protein 4 | Hub_1/BN_3 | Hub_14 | ||
| AT3G54050 | FBP | Fructose-1,6-bisphosphatase | BN_2 | Hub_4/BN_12 | ||
| AT3G56940 | CRD1 | Copper response defect 1 protein | Hub_9/BN_2 | |||
| AT3G61470 | LHCA2 | Photosystem I chlorophyll a/b binding protein 2 | Hub_5/BN_4 | |||
| AT4G01050 | STR4 | Sulfurtransferase 4 | BN_5 | Hub_2/BN_1 | ||
| AT4G05180 | PSBQ2 | Oxygen-evolving enhancer protein 3-2 | Hub_6 | Hub_11 | ||
| AT4G10340 | LHCB5 | Light-harvesting complex II protein 5 | Hub_3 | Hub_12 | ||
| AT4G32260 | atpG | ATP synthase beta chain (subunit II) | Hub_13/BN_4 | |||
| AT5G19940 | PAP8 | Probable plastid-lipid-associated protein 8 | Hub_5/BN_5 | |||
| AT5G66570 | PSBO1 | Oxygen-evolving enhancer protein 1-1 | Hub_1/BN_1 | Hub_7/BN_6 | Hub_6/BN_11 | |
Arabidopsis genes identified as the top 10% of hubs and bottlenecks from the four coexpression networks (Net) in Arabidopsis wild-type Col-0, JA-insensitive mutant coi1-1, and SA-insensitive mutant npr1-1. Hub genes are nodes with more than five edges in a given network. Bottleneck genes (BN) are nodes with a higher score of betweenness centrality in a given network. Genes identified as hub genes and/or bottlenecks are labeled as Hub or BN, respectively, with a rank number of connectivity or score of betweenness centrality. For example, Hub_27/BN_31 indicates the gene AT1G02920 is identified as a hub gene with the 27th highest connectivity and as bottleneck gene with the 31st highest betweenness centrality score in Network I from Arabidopsis mutant npr1-1. AGI, Arabidopsis Genome Initiative.
Of the 23,898 Arabidopsis genes that were quantifiable across infected samples across all three host genotypes, 20,328 (85%) transcript abundances responded differentially among the 96 diverse B. cinerea genotypes (false discovery rate [FDR]-adjusted P value < 0.001; Supplemental Table 2), indicating that diverse B. cinerea isolates triggered large-scale genome-wide differences in host gene expression in a pathogen-genotype-dependent manner during infection. In a similar fashion, the host genetic variation between the three plant genotypes significantly altered the expression of 88% of Arabidopsis genes within this experiment. Importantly, 34% of the Arabidopsis host genes showed significantly altered expression due to the interaction of pathogen and host genotypes (FDR-adjusted P value < 0.001; Supplemental Table 2 and Supplemental Data Set 7), which further demonstrates the differential interaction of natural variation within B. cinerea to these defense hormone pathways. Thus, the Arabidopsis genotypes and the diversity among B. cinerea isolates leads to a dramatic reshaping of the plant's transcriptomic defense response.
To quantify the transcriptomic impact of genetic variation in the host and pathogen, we estimated the proportion of variance (η2) of each Arabidopsis transcript due to variation among the host genotypes (wild-type Col-0, coi1-1, and npr1-1), genetic variation in the pathogen (96 diverse isolates), and the interaction of host x pathogen (Figure 1). The average Arabidopsis transcript was equally affected by genetic variation in the pathogen and the interaction of pathogen × host (H2 Isolate x HostGenotype = 0.111, H2 Isolate = 0.108) (Figure 1). By contrast, the effect of the host's variation on the average transcript was lower (H2 HostGenotype = 0.05). This contrasts with both lesion size and camalexin, where the interaction of host and pathogen had the smallest effect. Thus, the interaction between pathogen and plant genetic variation significantly influences the host's transcriptional responses when being attacked by diverse B. cinerea isolates. This indicates that the plant transcriptome is highly sensitive to genetic variation in the pathogen and how natural variation in the pathogen influences the SA and JA pathways in the plant (Figure 1A).
Plasticity of Known Arabidopsis Defense Pathways and Genes
To visualize the response of well-characterized plant defense pathways across the diverse B. cinerea genotypes in wild-type Col-0, coi1-1, and npr1-1 Arabidopsis genotypes, we examined transcript levels of individual genes in these pathways. We initially focused on the transcriptional response of specific pathways associated with camalexin production and defense signaling (Supplemental Data Set 7). In wild-type Col-0 and coi1-1 genotypes, all B. cinerea isolates gave rise to increased camalexin related transcript abundance for these genes, while some isolates lead to significant decrease from the mock level in the npr1-1 genotype (Figure 4A; Supplemental Figure 2D and Supplemental Data Set 7) (Zhou et al., 1999; Schuhegger et al., 2006; Liu et al., 2010).

Plasticity in Arabidopsis Defense-Related Genes in Response to B. cinerea Genetic Variation.
The Arabidopsis genotypes, wild-type Col-0, JA-insensitive mutant coi1-1, and SA mutant npr1-1, are shown on the x axis. Violin plots show the distribution of transcript accumulation in response to the 96 B. cinerea isolates for specific transcripts. Red lines indicate the average transcript accumulation in mock-treated plant tissues for each Arabidopsis genotype. The transcripts shown are PAD3 (A), AOS (B), PDF1.2b (C), PR1 (D), WRKY54 (E), ycf2-A (F), PNSB2 (G), and LHCA2 (H).
We further compared the individual transcriptional performance of genes involved in JA and SA biosynthesis, perception, and downstream responses. The transcript abundance for most tested genes associated with JA synthesis and signaling was induced in wild-type Col-0 in response to infection by all B. cinerea isolates and showed opposing responses in the coi1-1 and npr1-1 mutants (Figure 4; Supplemental Figure 2). However, JASMONATE RESISTANT1 (JAR1), showed both activated and repressed transcriptional responses depending upon the specific B. cinerea isolate (Supplemental Figure 2C) (Staswick et al., 2002). More critically, there were isolates that had the ability to induce JA response genes, such as PLANT DEFENSIN1.2 (PDF1.2), VEGETATIVE STORAGE PROTEIN1 (VSP1), and VSP2 in the JA signaling deficient coi1-1 background (Figure 4C) (Penninckx et al., 1996; Ellis and Turner, 2001).
Most SA-responsive genes showed transcriptional responses that differed across the diverse B. cinerea isolates and were opposite of the above JA responses. They showed the highest transcript accumulation in the coi1-1 mutant, moderate in Col-0, and downregulation in the npr1-1 mutant (Figures 4E and 5; Supplemental Figure 2E). A key exception to this pattern is ENHANCED DISEASE SUSCEPTIBILITY5 (EDS5), the multidrug and toxin extrusion transporter that exports SA from the plastid, which showed a pattern that was largely independent of plant genotype and dominated by pathogen genetic variation (Supplemental Figure 2G) (Nawrath et al., 2002; Ferrari et al., 2003). Importantly, there were isolates that could shift this pattern such as Noble Rot that can actually induce transcripts like PR1 in an npr1-1 mutant background (Figure 5). This suggests that these isolates contain signals that can bypass NPR1 dependency for PR1 and other SA-responsive gene regulation (Figure 5). It remains to be characterized what these other signals may involve. Thus, the SA and JA related transcripts show a similar pattern of expression that is a mix of effects from the host and pathogen genetic variation.
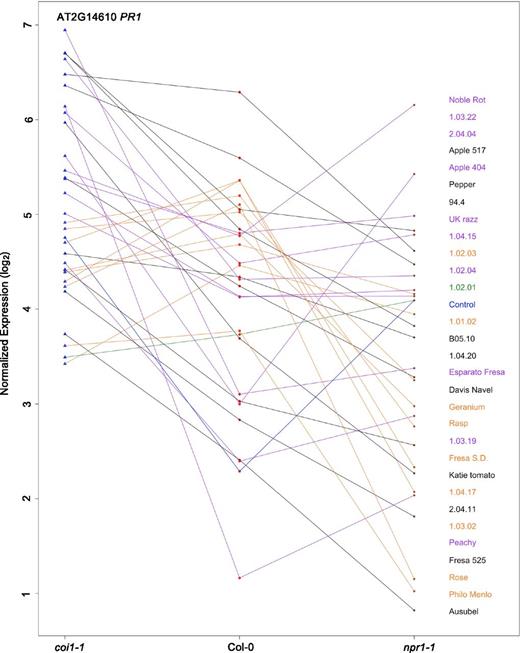
PR1 Expression across Arabidopsis Genotypes.
Rank plot showing the relationship of PR1 expression across three host genotypes (x axis) in control and in response to 30 diverse B. cinerea isolates (right). The isolates shown on the plot were chosen to provide an image of the major patterns found in the full collection of 96 isolates. The isolate names are shown in the same order as the lines for the npr1-1 mutant. The three Arabidopsis genotypes are wild-type Col-0 (red dot), JA-insensitive mutant coi1-1 (blue triangle), and SA mutant npr1-1 (brown diamond). The model-corrected means for transcript of PR1 are utilized for this plot. The transcript expression levels of PR1 across three Arabidopsis genotypes in control or induced by the same isolate are represented with colored connecting lines. Blue line indicates the expression levels of PR1 in the control treated samples. Purple lines indicate isolates where the expression levels of PR1 are higher in coi1-1 and npr1-1 than in Col-0. Black lines indicate isolates where the PR1 expression levels are higher in coi1-1 than in Col-0 but lower in npr1-1. Orange lines indicate isolates where the highest PR1 expression levels are in Col-0. The green line indicates an isolate with slightly higher PR1 expression levels in npr1-1 and slightly lower in coi1-1.
We finally investigated transcriptomic performance of genes in the Arabidopsis basal defense and plant innate immune system (Supplemental Figure 3 and Supplemental Data Set 5). Most transcripts associated with PTI were positively, albeit differentially, regulated in response to infection by diverse B. cinerea isolates on the three Arabidopsis genotypes as found for SA- and JA-responsive genes (Supplemental Figure 3). A key outlier is ACCELERATED CELL DEATH11 (ACD11), which was strongly suppressed in response to all 96 B. cinerea isolates in coi1-1 while showing no response to B. cinerea infection on wild-type Col-0 and npr1-1 (Supplemental Figure 3H). Interestingly, ACD11 suppresses the hypersensitive response and cell death, suggesting that in the coi1-1 background, this suppression of ACD11 function could enhance the hypersensitive response and sensitivity to B. cinerea (Brodersen et al., 2005). Thus, the use of a population of B. cinerea and plant signaling mutants illustrates that there is a wide diversity of host transcriptional networks involved in the response to B. cinerea infection. Additionally, the npr1-1 and coi1-1 mutants do not completely abolish host defense responses to the pathogen, but instead reprogram this response and some isolates can bypass the need for COI1 in JA signaling (Rowe et al., 2010).
Individual Gene Association
To test if any individual transcripts are highly correlated with lesion area across all the Arabidopsis genotypes and B. cinerea isolates, we utilized a Spearman's rank correlation with all of the data. This showed that in any individual Arabidopsis genotype, no transcript had a correlation above r = 0.49 and using all the genotypes led to the maximum r = 0.52 (Supplemental Data Set 8). Thus, it does not appear that there is any singular gene or subset of genes that are highly correlated with resistance and lesion area. This supports the perspective that host resistance to B. cinerea is extremely polygenic (Corwin et al., 2016a). Interestingly, three of the top 10 highest positively correlated genes encode a chitinase, a chitin-inducible gene (AT5G25260), and a PAMP-inducible kinase FRK1 (Passarinho et al., 2001; Millet et al., 2010; Yeh et al., 2016; Nie et al., 2017). A fourth gene in the top 10 is UGT76B1, which controls crosstalk between the SA and JA pathways (von Saint Paul et al., 2011). In support of these observations was the finding that the top 100 correlated genes are enriched in biotic response terms when conducting a Gene Ontology (GO) enrichment analysis. At the other end of the spectrum, the gene with the highest negative correlation to lesion area was MUSE7, which is a conserved kinase substrate that influences NLR protein regulation (Johnson et al., 2017). The only enriched GO terms in the genes with a strong negative correlation to lesion size relate to photosynthesis. Thus, while the correlation of gene expression for individual genes with lesion area is low, genes that are the most positively correlated often appear to have functions related to pathogen resistance.
Variation of Arabidopsis Gene Coexpression Networks
To identify collections of genes in Arabidopsis that have a common transcriptional response to the genotypic variation in B. cinerea, we used a gene coexpression network approach (Zhang and Horvath, 2005; Dong and Horvath, 2007; Kliebenstein, 2009). In contrast to previous studies that used a single genetic isolate of the pathogen and different time points as source of variation, this analysis is based on natural genetic variation in the pathogen, which allows for a new perspective (Windram et al., 2012; Howard et al., 2013; Lewis et al., 2015). We first calculated the nonparametric Spearman's rank correlation coefficient of model-corrected transcript means for all gene pairs within each Arabidopsis genotype and filtered for highly correlated gene pairs (R > 0.95). Using correlation thresholds at 0.9, 0.8, and 0.7 produced comparable network structures, albeit with greatly increased gene membership. Analysis of the pairwise correlation networks identified a set of 131 genes that were commonly coexpressed among the Arabidopsis genotypes. These 131 genes coalesced into four coexpression networks that had five or more genes and were subsequently named Networks I, II, III, and IV, respectively (Figure 6; Supplemental Data Sets 9 to 11 and Supplemental Figure 4). Using these genes as kernels, we extended these four core response networks within each genotype to include all coexpressed genes within each Arabidopsis genotype (R > 0.95). This showed that while the four networks contain a similar core of genes, their network architecture changes between the Arabidopsis wild type and the immune-deficient mutants. For example, the total gene membership (nodes) in Network I was 123 in wild-type Col-0, 34 in coi1-1, and 403 in npr1-1 (Figure 6; Supplemental Data Sets 9 to 11 and Supplemental Figure 4). The dramatic change in network membership across the Arabidopsis mutant backgrounds demonstrates the ability of plant defense hormones to shape coordinated defense responses across the diverse B. cinerea genotypes.
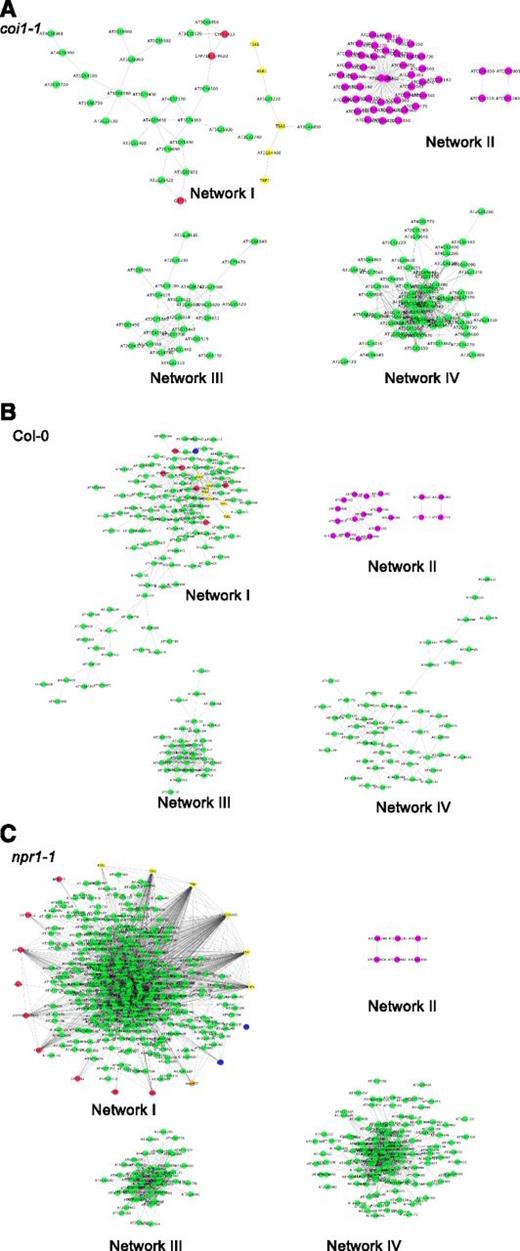
Gene Coexpression Networks Associated with Variation in Arabidopsis Transcriptomic Responses to Natural Genetic Variation in B. cinerea.
The four core transcript networks as estimated both by PCA and correlation are shown with the suggested biological function determined by GO enrichment. These are as follows: Network I, JA and SA signaling processes and camalexin biosynthesis; Network III, defense and cell cycle; Networks II and IV, photosynthesis. Nodes within each network represent Arabidopsis transcripts. Purple nodes show transcripts encoded by the plastid genome. Red and yellow nodes represent biosynthetic genes for camalexin and tryptophan, respectively. Blue and orange nodes represent genes in the JA- and SA-signaling pathways, respectively. The interrelationship between the nodes within each network represents similarity between the expression levels of transcript. The similarity matrix is computed using Spearman's rank correlation coefficient. The interrelationship between the genes within these networks is shown for the Arabidopsis genotypes wild-type Col-0 (A), JA-insensitive mutant coi1-1 (B), and SA-insensitive mutant npr1-1 (C).
We tested for two types of nodes within each network, hub genes (highly connected nodes) and bottlenecks (high centrality hubs), to identify the potential biological function of each network and the potential drivers of interactions. Hub genes, genes with a high degree of connectivity, in a biological network are nodes with comparatively high levels of connectivity and are often assumed to be vital for network function (Yu et al., 2007). Using both connectivity and centrality scores, we identified the top 10% of hub and bottleneck genes in each core network within each genotype (Table 2). This showed that the hub and bottleneck genes for Network I were predominantly biosynthetic enzymes, such as PHYTOALEXIN DEFICIENT3 (PAD3) and TRYPTOPHAN SYNTHASE ALPHA1 (TSA1), required for the production of camalexin and its precursor tryptophan (Supplemental Data Set 12). This agreed with GO analysis and KEGG analysis that Network I is dominated by JA and SA signaling processes and indole biosynthesis (Supplemental Data Set 13).
Networks II and IV were both associated with chloroplast function (Figure 6; Supplemental Data Sets 9 to 12). Network II consists entirely of genes encoded within the plastid genome, indicating its biological function might be associated with defense-associated roles for plastids (Supplemental Data Set 12). It needs to be noted that as the methodology utilized poly(A) purification, the plastid genes are dependent on poly(A) stretches within the gene and as such, the quantification of these genes may have a differential and unknown bias than the nuclear genes. The only hub genes in this network are the YCF2.1 and YCF2.2 loci, whose function is presently unclear (Table 2). Similarly, genes in Network IV are highly enriched in nuclear-encoded photosynthetic genes that are centered upon the photosystem reaction centers located in the chloroplast (Supplemental Data Set 13). Together, these networks suggest that B. cinerea genetic variation directly affects the functioning of the photosynthetic apparatus within the Arabidopsis plastid during the pathogenic interaction. While both networks influence plastid function, they are differently regulated in response to genetic diversity among the B. cinerea isolates, as Network II's interconnectivity decreases in an npr1-1 background but increases in a coi1-1 background in comparison to the wild type. By contrast, Network IV's connectivity increases in both npr1-1 and coi1-1 (Figure 6; Supplemental Data Sets 9 to 11). The expression of genes of Network II was repressed in infected wild-type Col-0, and this repression was enhanced in npr1-1 (Supplemental Data Set 7). This suggests that JA functions to repress these plastid-encoded genes, while SA activates their expression. The network and GO analysis showed that Network III was associated with defense and cell cycle genes previously unlinked to B. cinerea interactions (Supplemental Data Set 13). Thus, the four core host transcript coexpression networks that coordinately respond to genetic variation in the pathogen are focused on networks that function in metabolic host defense responses and chloroplast gene regulation.
Arabidopsis Wild Type Transcriptomic Variation Can Identify Altered Resistance
To quantify the network's transcriptional response, we utilized PCA to obtain weighted eigengenes to measure the network responses of Arabidopsis transcripts to variation across the 96 B. cinerea isolates within the wild-type Col-0 genome (Alter et al., 2000). An eigengene is a vector that allows the direct measurement of a network of genes as a single value. It builds from a set of weightings for each gene in the network. The eigengene value/score is calculated by multiplying the gene's weight by the gene's transcript level and summing this for all the genes in the network. The weightings provide some indication of how the gene connects to the network. This showed that the first four principal components corresponded to Networks I to IV, respectively, i.e., PC1 is an eigenvector describing the variance in expression of the genes in Network I (Figure 7; Supplemental Figure 5). Comparing the PCA to the coexpression networks showed that genes within Network I largely contribute to PC1, while Network II largely contributes to PC2, suggesting that the principle components in PC-ordination space are being driven in a network dependent manner (Supplemental Figure 5 and Supplemental Data Set 12). We then utilized the loading vector for each eigengene to calculate the corresponding value for the control samples and the B. cinerea infected coi1-1 and npr1-1 transcriptomes (Figure 7). Network 1/PC1 associates with 63% of the transcriptome variation in Col-0 and the projected eigengenes for this vector link to 53% and 83% of the transcriptome variation in coi1-1 and npr1-1, respectively. Network 2/PC2 explained 5% of the Col-0 variation and 3% of the variation in both coi1-1 and npr1-1. Interestingly, the uninfected control samples are not extreme outliers within the ordination field among the first two components as they reside just barely outside the 90% confidence interval (Figure 7). Thus, the transcriptomes for the wild-type Col-0, coi1-1, and npr1-1 genotypes are responding to the pathogen's genetic diversity within a transcriptomic space that is not being significantly expanded, or altered, by the loss of either JA or SA signaling. This further suggests that the coi1-1 and npr1-1 mutants do not abolish the ability to respond to B. cinerea, but instead help transform and shape the transcriptional response.

PCA Comparison of Arabidopsis Transcriptomic Profiles Responding to Natural Genetic Variation in B. cinerea.
Scatterplots show the scores of the first two principal components estimated using the response of the top 2000 transcripts responding to B. cinerea within the total data set using the mean response in Col-0. Red dots show the scores for the response to the individual isolates in Arabidopsis wild-type Col-0. Blue triangles show the response of coi1-1, and brown diamonds show the response of the SA-insensitive mutant npr1-1. Red, blue, and brown crosses represent the imputed score from mock treated samples from Col-0, coi1-1, and npr1-1, respectively. The 90% confidence ellipse intervals are drawn on scores of the first two principal components from each Arabidopsis genotype for reference.
Using the eigenvector-derived weighted values for the different networks, we tested whether the transcriptomic responses at an early infection time point (16 HPI) were linked with later lesion development and camalexin induction (72 HPI) (Supplemental Table 3). Linear modeling with all three host genotypes showed that the early transcriptome response of Network I at 16 HPI is highly linked to resistance at 72 HPI. This relationship was significantly different between the host genotypes, with wild-type Col-0 having a negative correlation and npr1-1 having a positive correlation between PC1 of the 16 HPI transcriptional response and the 72 HPI lesion area (Figure 8; Supplemental Tables 1 and 3). Including the eigengene for Network II/PC2 in the model as an interaction term with Network I/PC1 improved the model's ability to link the transcriptomic response to lesion size and camalexin accumulation, suggesting that resistance is connected to an interaction of these two networks as well as other networks (Supplemental Tables 1 and 3). Thus, by combining information across the transcripts using eigengenes, we can develop a statistical model that describes lesion size variation at 72 HPI using transcriptomic variation measured at 16 HPI.
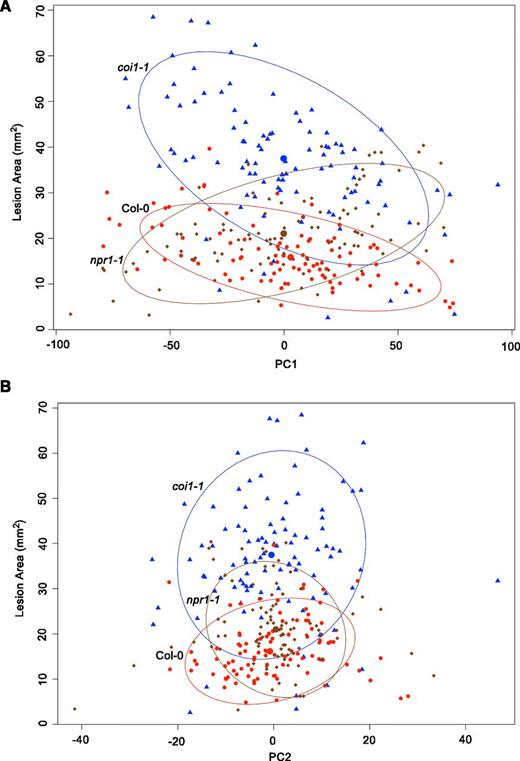
Correlation between Lesion Area and Transcriptome Responses of Arabidopsis Genotypes.
Scatterplots are shown comparing lesion area as measured at 72 HPI to the transcriptomic response at 16 HPI as measured using the first two principal components. The three Arabidopsis genotypes are wild-type Col-0 (red dot), JA-insensitive mutant coi1-1 (blue triangle), and SA mutant npr1-1 (brown diamond). Each point represents the model-corrected mean for each of the 96 isolates. The 90% confidence ellipse intervals are drawn for reference lesion area versus transcriptome PC1 (A) and lesion area versus transcriptome PC2 (B).
Genetic Variation in B. cinerea Identifies Different Canalization and Plasticity Roles for COI1 and NPR1
The significant interaction of the Arabidopsis defense hormone perception with the B. cinerea isolates suggests that COI1 and NPR1 control the response of Arabidopsis when faced with a diversity of pathogen virulence mechanisms via one of two options (Weinig, 2000; Liefting et al., 2009; Palacio-López et al., 2015). First, COI1/NPR1 may canalize the plant's response by channeling the response to a diversity of stimuli/attacks into a single focused, coherent outcome. Alternatively, COI1/NPR1 may control the plasticity of the plant's response to this diverse mixture of attacks without canalizing the response. These alternatives can be visualized using a rank order plot. For example, if the isolates are plotted in their rank across the three Arabidopsis genotypes, NPR1/COI1-mediated canalization would generate an image where the rank of isolates is the same (i.e., no crossing lines), but with an increase or decrease in the range of the lesion area. By contrast, plasticity within a rank order plot would show the same general range of isolates between the Arabidopsis genotypes, but the rank of the isolates would dramatically change, leading to crossing lines. Present theory about SA and JA simply argues that the plant hormones control the response to pathogens, but it is unknown whether they control canalization and/or plasticity in response to diverse isolates (Figure 1). To assess this possibility, we visualized the rank order of diverse B. cinerea isolates, to see if this fluctuates among the three Arabidopsis genotypes depending on the defense phenotypes, from resistance to the transcriptional network (Figure 9). Rank plots of lesion area showed that the significant isolate × host genotype effect is a result of a lack of canalization/buffering in the npr1-1 and coi1-1 genotypes. The range of lesion sizes is larger in these two mutant host genotypes, but there is little change in the isolate's relative rank in comparison to the wild-type Col-0 host, suggesting that COI1/NPR1 largely canalize host resistance (Figure 9A). Comparing camalexin accumulation to lesion area, the rank order of the isolates is largely fluctuating, especially in the npr1-1 background, suggesting that the defense hormones contribute to plasticity but not canalization in camalexin production (Figure 9B). Proceeding to the transcriptome-derived eigenvectors for Network I/PC1 and Network II/PC2 showed that there was no evidence of coi1-1 or npr1-1 canalizing the transcriptomic response, as the range of the response is similar between all three host genotypes. Instead, the coi1-1 and npr1-1 mutants illuminate a highly plastic transcriptome where there are dramatic rank order shifts in how the plant's transcriptome responds to the genetic diversity of the pathogen (Figures 9C and 9D). Interestingly, npr1-1 seems to function to invert the rank order of the wild-type Col-0 responses. Thus, the transcriptional response to the diverse B. cinerea isolates across the Arabidopsis hosts shows greater isolate × host genotype interactions than the resulting lesion size. This suggests that the JA and SA pathways function to canalize the final resistance phenotypes (lesion area) while not similarly buffering the initial transcriptional responses.

Differential Interactions of Host × Pathogen Genotype across Host Defense Responses.
Rank plots showing the relationship of Arabidopsis defense responses across three host genotypes (x axis) in response to 96 diverse B. cinerea isolates. The three Arabidopsis genotypes are wild-type Col-0 (red dot), JA-insensitive mutant coi1-1 (blue triangle), and SA mutant npr1-1 (brown diamond). The model-corrected means for all traits are utilized for these plots. The connecting lines are colored in a gradient from green to purple based on their value in the Col-0 host genotype.
(A) Lesion area at 72 HPI.
(B) Camalexin accumulation at 72 HPI.
(C) Transcriptome PC1 at 16 HPI.
(D) Transcriptome PC2 at 16 HPI.
DISCUSSION
Using a large collection of natural B. cinerea isolates, we assessed how Arabidopsis responds to quantitative genetic diversity in a generalist necrotrophic pathogen. This showed extensive genetic variation among pathogen genotypes for lesion formation, camalexin accumulation, and host-transcriptomic responses that were dependent upon the interaction of the host innate immune system and pathogen genotype. The host and pathogen genotypes had similar effects, which was unexpected as we utilized two major effect Arabidopsis mutants that largely eliminate JA (coi1-1) and SA (npr1-1) downstream signaling, which should overwhelm the phenotypic variance among B. cinerea genotypes (Xie et al., 1998; Xu et al., 2002; Mou et al., 2003; Sheard et al., 2010; Wu et al., 2012). While most models assume that these mutants abolish responses, the varied response to the diverse isolates indicates that while these mutants may diminish their specific response (i.e., SA or JA dependent), they lead to new and increased responses in other networks. This indicates that coi1-1 does not abolish the plant's ability to detect and respond to B. cinerea but simply alters the overall defense response. It should be noted that both coi1-1 and npr1-1 are pleiotropic mutations that have significant effects on all downstream processes, which includes crosstalk between the SA and JA pathways. As such, we are interpreting these data concerning the genetic effect of removing these key nodes, rather than specific mechanistic molecular insight.
In contrast to the common model where SA and JA function to induce or repress specific plant responses, the lesion area measurements show that a key function of the SA and JA pathways is to canalize the overall defense response to the diverse B. cinerea isolates. However, this canalization function did not similarly influence the transcriptional response to these same B. cinerea isolates. Instead, the SA and JA signaling mutants create dramatically plastic transcriptomic responses to the pathogen's genetic variation that occur within the same range as the wild-type Col-0 (Figure 9). This suggests that the SA and JA pathways canalize lesion formation, not by creating a single coordinated transcriptomic response, but by choosing between different molecular responses to the diverse isolates. As such, the wild-type Col-0 genotype gives the appearance of canalized responses to the diverse B. cinerea isolates that is achieved by the downstream signaling pathways picking and choosing among a myriad of response modules, some with positive and some with negative effects on the interaction, that together sum up to a net lesion size. This summation of positive and negative effects agrees with the observation that the coi1-1 and npr1-1 mutants both lead to decreased resistance to the pathogen population even though they are widely believed to be antagonistic.
Natural Genetic Variation in B. cinerea Influences Plant Transcriptomic Response
The interaction of plants with pathogens involves the passage of molecular signals back and forth between the two organisms. With specialist pathogens, this is frequently highlighted by the presence of single large-effect qualitative virulence genes (Glazebrook, 2005). By contrast, the Arabidopsis response to the 96 diverse B. cinerea isolates is quantitative and showed no evidence of bimodality or multimodality (Table 1, Figures 2 and 3A). This suggests that this collection of B. cinerea genotypes does not contain large-effect qualitative virulence loci; instead, this generalist uses a highly polygenic virulence architecture (Denby et al., 2004; Finkers et al., 2007b; Rowe and Kliebenstein, 2008; Corwin et al., 2016b; Zhang et al., 2016). This agrees with previous B. cinerea mechanistic studies that identify a large collection of standing genetic variation that controls a wide range of specific virulence mechanisms (Choquer et al., 2007; Rowe and Kliebenstein, 2007; Noda et al., 2010; Rowe et al., 2010; Dalmais et al., 2011; Michielse et al., 2011; Shlezinger et al., 2011; Windram et al., 2012; Pearson and Bailey, 2013; Kumari et al., 2014; An et al., 2015; Atwell et al., 2015; Hevia et al., 2015; Plaza et al., 2015; Schumacher et al., 2015; Zhang et al., 2015a; Corwin et al., 2016a, 2016b; Lopez-Cruz et al., 2017; Zhang et al., 2016). Taken together, this supports the perspective that the Arabidopsis-B. cinerea interaction involves a large polygenic pool of genetic variation in the host and pathogen that interact to determine the outcome (Figures 2 and 9A) (van Kan, 2006).
Relative Importance of Camalexin Mediated Defense
The dominant network with altered responses to the genetic variation in the pathogen isolates was Network I, which contains the majority of biosynthetic genes for camalexin and its precursor, tryptophan, along with key transcription factors known to regulate camalexin production, including MYB122, WRKY40, and ANAC042 (Pandey et al., 2010). The regulatory hierarchy of this biosynthetic pathway is highly flexible with different pathogen species or stresses frequently identifying different key transcription factors or regulatory processes (Glazebrook and Ausubel, 1994; Thomma et al., 1999a; Glazebrook, 2001; Mengiste et al., 2003; Ren et al., 2008; Mao et al., 2011; Birkenbihl et al., 2012; Saga et al., 2012; Frerigmann et al., 2015). It is possible that this regulatory flexibility is why the camalexin network is a major network responding to pathogen genetic diversity.
While camalexin controls resistance to some B. cinerea isolates depending upon their genotype, little is known about how this phytoalexin may influence the interaction with a broad population of isolates (Kliebenstein et al., 2005; Bednarek et al., 2011; Rajniak et al., 2015; Frerigmann et al., 2016). Comparing the transcript accumulation for all the enzymes in the biochemical pathway and the final defense metabolite showed that while camalexin accumulation is highly diminished in the coi1-1 background, the transcriptional response of the genes encoding the biosynthetic enzyme is largely intact in this JA mutant (Figure 4A; Supplemental Figure 1). Interestingly, the npr1-1 mutant also showed a general decrease in camalexin levels that positively correlated with a reduced transcriptional response. Thus, JA and SA are both positive regulators of camalexin accumulation in response to the population of B. cinerea isolates via transcriptional and posttranscriptional processes. Interestingly, expression of camalexin genes is more sensitive to genetic variation among the pathogen isolates than to the major mutants in the SA/JA perception pathways in the plant (Supplemental Data Set 7). Further use of the pathogen's natural variation in stimulating signaling and biosynthesis of camalexin in Arabidopsis may provide new insights into plant-pathogen interactions that have not previously been studied.
JA/SA Molecular Antagonism versus Additivity
JA and SA signaling pathways are classified as the major plant defense hormones against necrotrophs and biotrophs, respectively (Vlot et al., 2009; Mahesh et al., 2012; Mengiste, 2012; Mulema and Denby, 2012; Windram et al., 2012; Yang et al., 2015). In response to the population of B. cinerea isolates, marker genes in JA and SA responses behaved largely as expected with JA-responsive genes downregulated or off in the coi1-1 background and vice versa for SA/npr1-1 (Figures 4 and 5; Supplemental Figure 2). Interestingly, this contrasts with our observation that the resistance to the average B. cinerea isolate is significantly increased in both npr1-1 and coi1-1. Thus, SA and JA signaling both provide resistance to B. cinerea and are not in antagonism at this level. Further complicating our ability to interpret the SA/JA signaling pathways is the fact that there were isolates that could elicit JA and SA signaling within coi1-1 and npr1-1 mutant backgrounds and bypass JA/SA perception. For example, there were B. cinerea isolates that could induce the JA marker PDF1.2 in the coi1-1 mutant, while some isolates could stimulate SA responses, such as PR1, in the npr1-1 background (Figures 4 and 5). As both npr1-1 and coi1-1 block perception of SA and JA respectively, this is not caused by fungus exogenously producing the hormone to attenuate host defenses. Instead, these individual isolates suggest that these classical JA- and SA-specific transcripts can be stimulated by alternative pathways (Sato et al., 2010; Tsuda et al., 2013; Kim et al., 2014). Thus, these specific isolates can provide unique tools to query previously unrecognized defense signaling pathways.
The Plastid Transcriptome and B. cinerea Interactions
Two of the four major plant transcriptional networks that were influenced by natural genetic variation in B. cinerea were directly associated with plastid function. Network II (PC2) solely contained genes encoded in the plastid genome with no associated nuclear locus (Figure 6). Most genes in Network II are involved in photosystem I, with the uncharacterized transcript YFC2 acting as a hub (Table 2, Figure 6). The expression and network structure of the plastid-encoded Network II was influenced by the npr1-1 and coi1-1 mutants, suggesting that the SA-JA signal systems that function within the nucleus and cytosol can lead to rapid shifts in the expression of plastid-encoded genes. Network IV contained nuclear-encoded chloroplast-localized genes involved in photosynthesis and reactive oxygen species production (Figure 6; Supplemental Data Sets 9 to 12) or in PC2 (Supplemental Data Set 14). Furthermore, these results are consistent with downregulation of genes associated with chloroplast organization after infection (Windram et al., 2012). While the importance of the plastid in plant defense is beginning to be highlighted, the roles of these plastid systems in altering interactions with B. cinerea have barely been investigated to date (Serrano et al., 2016). One possibility comes from the observation that JA signaling induces chlorosis surrounding the developing B. cinerea lesion in a pathogen genotype-dependent manner (Rowe et al., 2010; Corwin et al., 2016a). This chlorosis surrounding the lesion may play a role either directly or indirectly in defense. Alternatively, the plastids are major sites of amino acid synthesis that lead to the production of precursors for a number of plant defense metabolites and signals. These results indicate that there is a broader need to understand how the plastid responses are coordinated into the broader pathogen response.
Summary
We generated phenotypic and transcriptomic data in Arabidopsis wild-type Col-0 and JA- and SA-insensitive mutants challenged by 96 diverse B. cinerea isolates and applied a variety of computational and statistical tools to obtain a detailed comprehension of varied defense responses in multiple layers of the defense system in plants infected with necrotrophic pathogens. We identified four gene coexpression networks as well as eigengene vectors in Arabidopsis responsible for the defense response triggered by natural genetic variation in necrotrophic pathogens. An exciting future challenge will be the identification of integrating transcriptional network models from both pathogen and plant, which may provide more insights on the strategies employed by two organisms for attack and defense. Further biochemical and evolutionary analysis of genes predicted by the network models will drive the discovery of novel pathogen targets in plants and facilitate resistance crop breeding in sustainable agriculture.
METHODS
Plants Material and Growth Conditions
For all experiments listed, we used the Arabidopsis thaliana accession Col-0 and the well-characterized mutants coi1-1 and npr1-1, two mutant plant genotypes that abolish the major defense perception pathways of JA and SA, respectively. We grew the three genotypes over two independent experiments as part of a larger experiment. The plants were planted within 18 pot flats with one plant per pot using a randomized complete block design. Each flat contained three independent plants of each genotype with three other genotypes filling the remaining pots. Using a total of 30 flats per experiment, we grew 90 plants per genotype per experiment and two independent experiments were conducted separately. The Arabidopsis seeds were vernalized in 0.1% phytoagar at 4°C for 4 d in the dark. Three seeds of each genotype were placed in the center of a cell filled with soil (Sunshine Mix #1; Sun Gro Horticulture) and the flat covered with a humidity dome to maintain high humidity during germination. The humidity dome was removed one week after germination and the plants were thinned to one plant per cell. Plants were watered twice a week and grown in a growth chamber at 22°C under a photoperiod of 10 h light/14 h dark. High output fluorescent bulbs were set for an output of 150 µE. Five weeks after sowing, we chose the first fully mature adult leaf and the next five to six leaves in the developmental cycle as these leaves are highly similar and placed them on 1% phytoagar in large plastic flats identical to those used under the pots (agar flats) prior to infection with Botrytis cinerea. Under our growth conditions, flowering does not occur until week 9-10 and no senescence was observed on any of the leaves used.
Fungal Isolate Growing Conditions and Inoculations
For growth and inoculation of a pathogen, we utilized a long-established detached leaf assay that allows for high-throughput analysis and is typically consistent with whole plant assays (Govrin and Levine, 2000; Ferrari et al., 2003; Mengiste et al., 2003; Denby et al., 2004; Sharma et al., 2005; Mulema and Denby, 2012; Boydom, 2013). A total of 96 B. cinerea isolates were selected for their phenotypic and genotypic differences (Supplemental Data Set 1). These isolates are all natural isolates that were largely isolated in California from a diversity of crops. There is also a set of international isolates obtained from other labs (Supplemental Data Set 1). Previous work with gene-specific sequencing and genome sequencing of a subset of these isolates has shown that there is no significant population structure when comparing California to the international isolates, suggesting that they represent a sample of the global intermating population (Atwell et al., 2015; Corwin et al., 2016a).
A summary of the pathogen inoculation and growth is as follows. Small canned peach slices (∼3 cm3) in Petri plates were inoculated from frozen glycerol stocks of isolated spores and were incubated on the bench top for one week. Spores were collected by submerging the sporulating peach slices in 5 mL filter-sterilized ultrapure water and agitated with a flame-sterilized glass rod. The solution was filtered through a syringe containing a small plug of sterilized glass wool to remove hyphal and plant particles followed by a mild centrifugation in a bucket rotor at room temperature at 1000 rpm for 15 min. The supernatant was discarded and the spore pellet was resuspended in sterilized 0.5× organic grape juice (Santa Cruz Organics). Spore concentration was determined using a hemacytometer and spore solutions were diluted to 10 spores/μL using the 0.5× organic grape juice. Leaves detached from 5-week-old Col-0, coi1-1, and npr1-1 were inoculated with 4 μL of the diluted spore solution and were incubated at room temperature on a flat containing ∼2 cm of 1% phytoagar covered with a humidity dome. B. cinerea isolates were inoculated in a randomized complete block design across the six trays. The inoculations all occurred within an hour of dawn for the leaves and the light period of the leaves was maintained. Two of the six blocks were harvested at 16 HPI for RNA extraction by transferring the infected leaf into a 2-mL Eppendorf tube containing one 4-mm and four 2.4-mm stainless steel ball bearings and immediately submerging the tube in liquid nitrogen. Frozen tubes were stored at −80°C until RNA extraction. The infected leaves were first photographed for lesion analysis and then placed in 400 μL of 90% methanol for camalexin extraction at 72 HPI.
RNA-Seq Library Construction, Sequencing, and Alignment
RNA-seq library construction was mainly based on previous methods (Kumar et al., 2012). Frozen infected leaves were homogenized by rapid agitation in a bead beater followed by direct mRNA isolation and purification from tissue lysate using the DynaBeads Oligo(dT)25 Kit (Invitrogen). The first-strand synthesis of mRNA was created using the SuperScript III kit (Invitrogen) with random primers and RNaseOut. The second strand synthesis was accomplished using 50 units of DNA Pol I (Fermentas) with an equal mix of 2.5 mM dNTPs and 1.6 units of RNase H. The resulting cDNA was purified using 0.8× of AMPure beads and fragmented using the Fragmentase enzyme (New England Biolabs) for 20 min at 37°C. Fragmented cDNA was repaired using the End Repair Kit (New England Biolabs) and an A-base was added using the exo-Klenow fragment (New England Biolabs) with 0.8× AMPure bead cleanup steps between both reactions. A barcoded sequencing adapter (NEXTflex DNA Indexed Adapters; Bioo Scientific) was ligated to sample fragments using the NEB Quick Ligase ligation kit (New England Biolabs). Adapter-ligated fragments were size selected using 0.8× Ampure beads and PCR-enriched using the Phusion Master Mix (New England Biolabs) and 10 μM PE sequencing primers. PCR conditions ran for 98°C for 30 min followed by 14 cycles of 98°C for 30 s, 62°C for 30 s, 72°C for 30 s, and final extension at 72°C for 5 min. A total of 2 μL of the PCR-enriched samples was run on a 1.5% agarose gel to test for successful amplification. Successfully amplified samples were size-selected using 0.7× AMPure beads. Amplified and size selected libraries were pooled in groups of 96 libraries according to the unique indexed barcodes within the adapter and submitted for single-read, 50-bp sequencing on a single lane of Illumina HiSeq 2500 at the U.C. Davis Genome Center-DNA Technologies Core. A pool of 96 libraries represented a single replicate of one plant genotype across all isolates and was sequenced as a unit. As there were four independent samples for each isolate on each genotype, there were four pools of libraries for Col-0, four for coi1-1, and four for npr1-1. This is a total of 1164 libraries accounting for all RNA samples. After sequencing, 61 libraries were discarded due to poor quality. This left at least three independent samples for all host genotype x pathogen isolate combinations.
Fastq files from individual HiSeq lanes were separated by adapter index into individual RNA-seq library samples. Individual libraries were qualitatively assessed for overall read quality and overrepresented sequences using FastQC software (version 0.11.3; www.bioinformatics.babraham.ac.uk/projects/). To align the reads to the Arabidopsis TAIR10.25 cDNA reference genome, we used Bowtie 1 V.1.1.2 with phred33 quality scores (http://sourceforge.net/projects/bowtie-bio/files/bowtie/1.1.2/) (Langmead et al., 2009). The first 10 bp of the reads were trimmed by the fastx toolkit due to low quality at the beginning of reads (http://hannonlab.cshl.edu/fastx_toolkit/commandline.html). Gene counts were pulled from the resulting sam file using a combination of SAMtools (Li et al., 2009) and custom R scripts and then summed across gene models to reduce overrepresentation of genes with multiple splice variants.
Picture Analysis and Lesion Measurement
Pictures of 72 HPI leaves were analyzed using a custom semiautomated image analysis pipeline implemented in the R V3.2.1 statistical environment (R Core Team, 2011) to measure lesion traits as previously described (Corwin et al., 2016b). Briefly, leaves were identified as highly saturated objects with a green hue in HSV colorspace using the EBImage and CRImage packages in R (Failmezger et al., 2010; Pau et al., 2010). Lesions were identified as low saturation, brown objects within the leaf area, and independent leaf and lesion masks were generated. Lesion masks were refined individually by a technician due to a high variance in lesion appearance. Lesion areas and perimeters were then calculated using EBImage to calculate the number of pixels in the lesion object and convert to area using a ruler reference within each image to determine the number pixels per centimeter.
Camalexin Detection
Camalexin was extracted from mock treated and B. cinerea-infected leaves and measured via HPLC analysis as previously described (Kliebenstein et al., 2005). Briefly, leaves were homogenized in 400 μL of 90% methanol followed by centrifugation to remove precipitates. The supernatant was transferred to a fresh 96-well autosampler plate and 50 μL of the extract was run on an Agilent 1100 series HPLC equipped with an Agilent Lichrocart 250-4 RP18e 5-µm column. Camalexin was detected using a fluorescence detector with an excitation at 318 nm and emission at 385 nm. Separation of camalexin from the complex mixture was accomplished using an aqueous to acetonitrile gradient (5 min gradient from 63 to 69% acetonitrile, 30-s gradient from 69 to 99% acetonitrile, 2 min at 99% acetonitrile, and a postrun equilibration of 3.5 min at 63% acetonitrile). A standard curve from purified camalexin had been previously determined for this method and used to quantify camalexin. Camalexin content was normalized to the perimeter of the lesion (ng/mm) (Kliebenstein et al., 2005).
Statistical Analysis Methods
All the analyses were conducted using the R V3.2.1 statistical environment (R Core Team, 2011). To test for the ability of natural variation within B. cinerea to impact disease-related phenotypes, we ran the following generalized linear model with a Gaussian link function for camalexin and lesion area, and with a negative binomial link function for all transcripts:
camalexin/lesion area:

transcripts in a single host genotype:

transcripts among infected samples in host genotypes:

transcripts among infected and uninfected samples in host genotypes:

where the main effects E, N, I, and H are denoted as experiment, infection status, isolate genotype, and plant host genotype, respectively. Nested effects of the growing flat (Gf) within the experimental replicates and agar flat (Af) nested within growing flat are also accounted. For camalexin and lesion area, mock controls were zero for all samples tested and therefore were not included in the model and did not necessitate accounting for variation in infection status (N). However, infection status was included among the transcripts to account for the large amount of variation between infected and uninfected leaves. For host transcripts, gene count data obtained from RNA-seq experiments were subjected to analysis using multiple statistical tools. Normalization on gene counts was first conducted using the TMM method in function calcNormFactors() from the “edgeR” package (Robinson and Smyth, 2008; Robinson et al., 2010; Robinson and Oshlack, 2010; Nikolayeva and Robinson, 2014), and normalized pseudo-counts were obtained for downstream analysis. The linear model was conducted on normalized gene counts using function glm.nb() from the “MASS” package (Venables and Ripley, 2002). Model-corrected means and standard errors for camalexin, lesion area, and each transcript within each isolate were determined using the “lsmeans” V2.19 package (Lenth, 2016). Raw P values for the F-test and χ2 test were determined by Type II sums of squares using the ANOVA function from the “car” package (Fox and Weisberg, 2011). Transcript P values were FDR corrected (P value < 0.05) for multiple tests of significance (Benjamini et al., 2001; Strimmer, 2008). Broad-sense heritability of each phenotype and transcripts as the proportion of variance attributed to B. cinerea genotype, Arabidopsis genotype, or their interaction effect to the total variance within the model were estimated. We then compared broad-sense heritability of transcripts involved in the camalexin, tryptophan, JA, and SA biosynthesis pathways in each Arabidopsis genotype. The violin plots were generated to depict the distribution of heritability using the “vioplot” package (Hintze and Nelson, 1998).
Gene coexpression networks for all Arabidopsis transcripts were generated using the model-corrected means for each isolate. Spearman's rank correlation coefficient of these model-corrected means of transcript in plant tissues derived from each infected Arabidopsis genotype were calculated for all gene pairs. Gene pairs with a positive Spearman's correlation greater than 0.95 in each data set were selected as coexpressed genes and overlapped genes from three selected gene data sets were used to construct gene coexpression networks. Gene coexpression networks were visualized using Cytoscape V3.2.1 (Java version 1.8.0_60) (Shannon et al., 2003). Genes identified from each Arabidopsis genotype represented the nodes in the networks and were named based on AGI locus IDs as published by TAIR10 (Lamesch et al., 2012). The B. cinerea induced transcript profiles of genes involved in camalexin, tryptophan, SA, and JA pathways, as well as in plant immune systems, were illustrated by violin plots (Hintze and Nelson, 1998). Tukey's multiple comparison was performed using the HSD test function from the “agricolae” R package (Mendiburu, 2016).
To investigate the associations among Arabidopsis wild-type Col-0, coi1-1, and npr1-1 challenged by 96 diverse B. cinerea isolates, we conducted a Mantel test on correlation matrices generated by model-corrected transcript means in each Arabidopsis genotype using a custom R script based on the function getPermuteMatrix() from the “vegan” V2.3.0 package (Mantel, 1967; Oksanen et al., 2016). The Mantel test was inferred following 999 permutations using Spearman's Rank coefficient method.
We selected the top 2000 genes whose expression was significantly regulated by B. cinerea infection. PCA was performed on model-corrected means of each transcript in Arabidopsis wild-type Col-0 using the princomp function in R to capture the unobserved data structure (R Core Team, 2011). The first two principal component score values for two mutant data sets, as well as transcripts in the mock control samples, were imputed using wild-type Col-0 as training model. We then conducted PCA on transcripts of each Arabidopsis mutant to obtain the data structure. We employed an ANOVA model to identify the statistical significance of influence of host genotype, each principal component, or a specific interaction between host genotype and a given principal component. The ANOVA model was as follows:

Heat map visualization used for clustering analysis of lesion and camalexin was conducted in R using the heatmap2 function from the “gplot” R package (Warnes et al., 2016). Gene annotation was obtained using https://www.araport.org/. GO enrichment analysis was performed with a BiNGO plug-in in the Cytoscape environment using Fisher's extract test with multiple testing correction of FDR at 0.05 (Benjamini and Hochberg, 1995; Maere et al., 2005).
Accession Numbers
Sequence data from this article can be found in the GenBank/EMBL data libraries under the following accession numbers: ACD11, AT2G34690; ANAC042, AT2G43000; AOS, AT5G42650; chitinase, AT2G43570; COI1, AT2G39940; EDS5, AT4G39030; FRK1, AT2G19190; JAR1, AT2G46370; LHCA2, AT3G61470; MUSE7, AT5G46020; MYB122, AT1G74080; NPR1, AT1G64280; UGT76B1, AT3G11340; PAD3, AT3G26830; PDF1.2, AT5G44420; PNSB2, AT1G64770; PR1, AT2G14610; VSP1, AT5G24780; VSP2, AT5G24770; WRKY40, AT1G80840; and WRKY54, AT2G40750.
Supplemental Data
Supplemental Figure 1. Variation in camalexin accumulation across Arabidopsis genotypes induced by natural genetic variation in B. cinerea.
Supplemental Figure 2. Plasticity in Arabidopsis jasmonate- and salicylic acid-responsive gene expression regulated by diversity in B. cinerea.
Supplemental Figure 3. Plasticity in Arabidopsis basal defense-related gene expression regulated by diversity in B. cinerea.
Supplemental Figure 4. Overlap of network associated host genes across three Arabidopsis genotypes.
Supplemental Figure 5. PCA on induced transcriptome in Arabidopsis wild-type Col-0.
Supplemental Table 1. Correlation analysis of lesion size and camalexin against the first two principal components of the transcriptome.
Supplemental Table 2. Summary of negative binomial general linear models for Arabidopsis transcripts.
Supplemental Table 3. ANOVA model tables of lesion area and camalexin induced by B. cinerea across Arabidopsis genotypes.
The following materials have been deposited in the DRYAD repository under accession number http://dx.doi.org/10.5061/dryad.7gd5q.
Supplemental Data Set 1. Description of B. cinerea isolates.
Supplemental Data Set 2. Model adjusted means for defense phenotypes and score values of PCA.
Supplemental Data Set 3. Variation in Arabidopsis susceptibility across host genotypes driven by natural genetic variation in B. cinerea.
Supplemental Data Set 4. Variation in Arabidopsis camalexin accumulation across host genotypes driven by natural genetic variation in B. cinerea.
Supplemental Data Set 5. Model adjusted means for all transcripts measured in all genotypes of this study.
Supplemental Data Set 6. se for all transcripts measured in all genotypes of this study.
Supplemental Data Set 7. Transcriptomic analysis of significance and heritability.
Supplemental Data Set 8. Spearman Rank correlation.
Supplemental Data Set 9. Gene coexpression architecture for responses in the Arabidopsis wild-type Col-0.
Supplemental Data Set 10. Gene coexpression architecture for responses in the Arabidopsis mutant coi1-1.
Supplemental Data Set 11. Gene coexpression architecture for responses in the Arabidopsis mutant npr1-1.
Supplemental Data Set 12. Gene membership of the four Arabidopsis coexpression networks.
Supplemental Data Set 13. GO enrichment of the four Arabidopsis coexpression networks.
Supplemental Data Set 14. Top 5% genes regulated by B. cinerea isolates in each Arabidopsis genotype, clustered by PCA.
Acknowledgments
This work was supported by NSF Division of Integrative Organismal Systems Award 1339125 to D.J.K., by the USDA National Institute of Food and Agriculture, Hatch project number CA-D-PLS-7033-H to D.J.K., by Danish National Research Foundation Grant DNRF99 to D.J.K., and by China Scholarship Council Grant 20130624 to W.Z.
AUTHOR CONTRIBUTIONS
J.A.C. and D.J.K. conceived and designed the experiments. W.Z., R.E., D.C., and J.F. performed the experiments. W.Z., J.A.C., F.C., S.A., and D.J.K. analyzed the data. W.Z., J.A.C., and D.J.K. wrote the article.
References
Author notes
Address correspondence to [email protected].
The author responsible for distribution of materials integral to the findings presented in this article in accordance with the policy described in the Instructions for Authors (www.plantcell.org) is: Daniel J. Kliebenstein ([email protected]).

Articles can be viewed without a subscription.
