


Abstract
Transcriptional reprogramming is integral to effective plant defense. Pathogen effectors act transcriptionally and posttranscriptionally to suppress defense responses. A major challenge to understanding disease and defense responses is discriminating between transcriptional reprogramming associated with microbial-associated molecular pattern (MAMP)-triggered immunity (MTI) and that orchestrated by effectors. A high-resolution time course of genome-wide expression changes following challenge with Pseudomonas syringae pv tomato DC3000 and the nonpathogenic mutant strain DC3000hrpA- allowed us to establish causal links between the activities of pathogen effectors and suppression of MTI and infer with high confidence a range of processes specifically targeted by effectors. Analysis of this information-rich data set with a range of computational tools provided insights into the earliest transcriptional events triggered by effector delivery, regulatory mechanisms recruited, and biological processes targeted. We show that the majority of genes contributing to disease or defense are induced within 6 h postinfection, significantly before pathogen multiplication. Suppression of chloroplast-associated genes is a rapid MAMP-triggered defense response, and suppression of genes involved in chromatin assembly and induction of ubiquitin-related genes coincide with pathogen-induced abscisic acid accumulation. Specific combinations of promoter motifs are engaged in fine-tuning the MTI response and active transcriptional suppression at specific promoter configurations by P. syringae.
INTRODUCTION
Currently the primary methods of disease control against crop pathogens are agrochemical sprays or the deployment of classical plant disease resistance (R) genes using marker-assisted breeding. However, pathogens rapidly overcome most R genes in the field and regulatory changes and a lack of new chemistries have led to a shortage of effective agrochemicals. Therefore, innovative methods need to be developed to provide alternative strategies for crop health (Dangl et al., 2013). One possibility is to reengineer existing plant defense networks (Grant et al., 2013). A prerequisite to such an approach is comprehensive knowledge of core transcriptional networks recruited during defense and the molecular strategy pathogens deploy to overcome plant innate immunity. A first step toward attaining this knowledge is ensuring a fundamental understanding of how plant-pathogen interactions are propagated at the transcriptional level.
Plants have evolved a robust innate immune system that provides broad-spectrum protection against a variety of pathogens with wide-ranging lifestyles (Jones and Dangl, 2006). Effective plant immunity requires the efficient perception of potentially pathogenic microbial-associated molecular patterns (MAMPs) by a range of host-encoded extracellular pattern recognition receptors (PRRs) (Belkhadir et al., 2014; Böhm et al., 2014; Macho and Zipfel, 2014; Zipfel, 2014). These stimuli are translated into the rapid transcriptional activation of a network of MAMP-triggered immunity (MTI) responses (Buscaill and Rivas, 2014). This germ-line-encoded MTI provides robust defense against a diverse variety of pathogens and offers biotechnological potential to improve resistance in elite crop varieties. Over the past decade, significant progress has been made in identifying MAMP receptors and their cognate ligands from a range of phytopathogens, including the archetypal PRRs, the leucine-rich repeat-containing receptor kinase FLAGELLIN SENSING2 that recognizes bacterial flagellin (Gómez-Gómez and Boller, 2000), and the LYSM domain-containing PRR that recognizes fungal cell wall chitin (Wan et al., 2008). Combined biochemical and genetic studies are beginning to uncover additional components of these PRR complexes and provide insight into how these receptors are activated and recycled (Göhre et al., 2008; Greeff et al., 2012; Xin and He, 2013; Macho and Zipfel, 2014; Zipfel, 2014). However, a detailed, highly resolved temporal analysis of the transcriptional responses underpinning MTI and a mechanistic understanding of how these activated networks confer resistance to nonadapted pathogens is lacking.
Superimposed on PRR activation of MTI is the capacity of pathogens to produce effectors, comprising both small molecules and proteins. Effectors are usually delivered into the host cell where they target one or more susceptibility factors to attenuate both MTI and effector-triggered immunity (ETI) and reconfigure host metabolism to provide pathogen nutrition (Cui et al., 2010, 2015; Feng and Zhou, 2012; Macho and Zipfel, 2015). Effectors act at a number of levels in the MTI signaling cascade to attenuate this defense response (leading to effector-triggered susceptibility [ETS]), including at the PRR interface, or targeting the Golgi, chloroplast, mitochondria, or the nucleus (Macho and Zipfel, 2015). Underpinning successful effector-driven disease development is a network of complex transcriptional reprogramming events. These early responses collectively overcome MTI and promote pathogen growth. Central to ETS is the pathogen-driven modulation of the host hormonal balance, the extent and direction of which appears to be linked to the pathogen's lifestyle (Robert-Seilaniantz et al., 2011; Pieterse et al., 2012; Kazan and Lyons, 2014). These hormonal perturbations, manifested at both the level of biosynthesis and signaling, are under strong transcriptional control.
Recent comparative genomic sequencing efforts have revealed both reduced and highly plastic pathogen genomes and facilitated the identification of an expanding catalog of predicted candidate effector proteins, many of which appear to be pathogen lifestyle specific (Win et al., 2012). With the exception of some conserved pattern motifs, the effector proteins reveal little about their role in pathogen virulence strategies, reflecting the emerging paradigm that they function cooperatively and redundantly, often targeting multiple host components and pathways to successfully promote disease (Lee et al., 2008; Lindeberg et al., 2012; Xin and He, 2013; Macho and Zipfel, 2014). Successful pathogenesis requires suppression of host defense and nutrient acquisition. How this is achieved largely remains enigmatic, including knowledge of the sequence of events necessary to orchestrate disease progression. What is clear is that genetic studies have revealed the existence of many core plant defense components that confer enhanced susceptibility across a broad spectrum of pathogens, suggesting that despite deploying disparate effectors, pathogen virulence strategies converge on conserved regulatory hubs (Glazebrook, 2005; Kazan and Lyons, 2014).
Transcriptional reprogramming underpins plant disease and defense strategies. MTI, ETS, or ETI networks are all dependent upon transcriptional activation and regulation (Buscaill and Rivas, 2014). Effectors may act posttranslationally to modify components of a signaling network, for example, by acetylation, or act directly as transcriptional repressors or activators (Lee et al., 2008; Macho and Zipfel, 2014). Thus, understanding the transcriptional dynamics associated with disease development affords the possibility of developing precise approaches to intercept pathogen virulence strategies and rewire host defense responses (Grant et al., 2013). Such approaches first require the capture and interpretation of expression profiles derived from high-resolution sampling of leaves responding to virulent pathogens. To gain an overview of the transcriptional phases of disease development, it is necessary to understand how the expression signature of transcription factors drives or represses expression of downstream network components.
Recently, significant progress has been made toward developing algorithms to mathematically model high-resolution RNA expression data sets. However, analysis of gene expression arising from interactions between two biological organisms is challenging, and inherent restrictions include insufficient and/or inappropriate time points to provide robust expression profiles for individual genes and to infer statistically significant changes in expression signatures over the infection time frame. An ideal pathosystem will allow confluent and synchronous infection to prevent excessive dilution of signal with uninfected or asynchronous cellular responses. It would provide data to discriminate between transcriptional networks associated with MTI and ETS, providing currently lacking insight into the role of effectors and/or the host response to effector perturbation of innate immunity to be captured (Kazan and Lyons, 2014).
The Arabidopsis thaliana-Pseudomonas syringae pv tomato DC3000 (DC3000) pathosystem is ideally suited to dissecting both MTI and ETS processes at the transcriptional level (Xin and He, 2013). DC3000 is highly virulent on Arabidopsis. DC3000 directly delivers 28 effector proteins (Cunnac et al., 2009) into the host cell through the type III secretion system (T3SS) as well as small molecules such as the phytotoxin coronatine (Bender et al., 1998). These virulence factors collectively suppress MTI and enhance nutrient availability, therefore enabling bacterial multiplication. A key structural component of the T3SS pilus is the HrpA protein (Roine et al., 1997). DC3000hrpA- mutants activate MTI but cannot form a T3SS to deliver the suite of effectors required to suppress MTI. They also produce minimal amounts of coronatine (de Torres Zabala et al., 2009). Thus, DC3000hrpA- infection triggers MTI in the host. Detailed comparisons between mock, DC3000hrpA-, and DC3000 treatments capture gene expression associated with MTI, effector-mediated suppression of MTI, and subsequent transcriptional changes associated with metabolic reconfigurations that favor pathogen nutrition, e.g., deployment of SWEET transporters (Chen et al., 2010, 2012).
To date, a small number of studies have captured single or limited time points of foliar infections with P. syringae (Thilmony et al., 2006; Truman et al., 2006). These lack temporal context, do not adequately discriminate MTI responses from effector-mediated transcriptional reprogramming, and lack corroborating data to link suppression of defense with pathogen proliferation. An mRNA-seq study of virulent and avirulent challenges did not capture MTI, and the three combined time points and complexity of the data limited the ability to interpret phase transitions and/or to temporally pinpoint and monitor key processes (Howard et al., 2013). In this study, we generate and analyze high-temporal resolution (13 time points) microarray data reporting MTI induced by DC3000hrpA- treatment and ETS caused by virulent DC3000 challenge. Inclusion of mock-treated leaves allowed the capture of both gene expression dynamics of MTI induced by DC3000hrpA- and how those expression profiles were modulated by DC3000. We provide a timeline for how the host deploys its defense transcriptome and how components of this may be modulated by effectors. We define sets of promoter elements that potentially drive these changes and using different mathematical approaches define coregulatory and network models that predict key regulators of plant defense and potential targets of effector manipulation.
RESULTS
Transcriptional Dynamics of MTI and ETS Revealed from a Large-Scale, Highly Resolved Time Series Expression Study
To design a high-resolution expression experiment, we used previous transcriptomic (de Torres Zabala et al., 2009), proteomic (Jones et al., 2006a, 2006b), and metabolomics (Ward et al., 2010) studies to inform sampling times. We additionally constructed a FLAGELLIN INDUCED RECEPTOR KINASE1 (FRK1; At2g19190) promoter luciferase fusion to ensure the earliest stages of ETS were captured (see Methods). We used high inoculum (OD600 0.15; ∼0.75 × 10⁸ colony-forming units [cfu] mL−1) syringe infiltration of a single fully expanded leaf per plant. Figure 1A illustrates that DC3000 but not DC3000hrpA- challenge suppressed FRK1:luciferase reporter expression between 3 and 6 h postinfiltration (hpi). As effector delivery in this system does not occur until ∼90 min postinfection (Grant et al., 2000), following an initial 0 hpi sample, we then sampled at 2 hpi and subsequently at 3, 4, 6, 7, 8, 10, 11, 12, 14,16, and 17.5 hpi. For each treatment (mock inoculation, DC3000 infection, and DC3000hrpA- infection), leaf 8 from four 34-d-old Col-4 rosettes was sampled, providing four biological replicates per time point, per treatment. In addition, four technical replicates were conducted per biological replicate, including a dye swap. In total, the experiment used 312 two-color microarrays (i.e., two samples hybridized to each array) with 624 samples consisting of 13 time points × 3 treatments × 4 biological replicates × 4 technical replicates. RNA was prepared and hybridized to CATMA spotted microarrays (Allemeersch et al., 2005) using a randomized loop array design (Supplemental Figure 1) to maximize the comparative power of the experiment. Data were extracted and normalized as previously reported (Breeze et al., 2011) to generate a single expression value for each gene in each biological replicate at each time point in each of the three treatments. The expression profiles for each individual probe on the CATMA array can be viewed using a Web tool (under the “Data” section at http://go.warwick.ac.uk/presta). This plots the expression profiles at all time points for the infected (DC3000 and DC3000hrpA-) and mock-inoculated leaves. Variation in expression is shown as a bar representing one se.
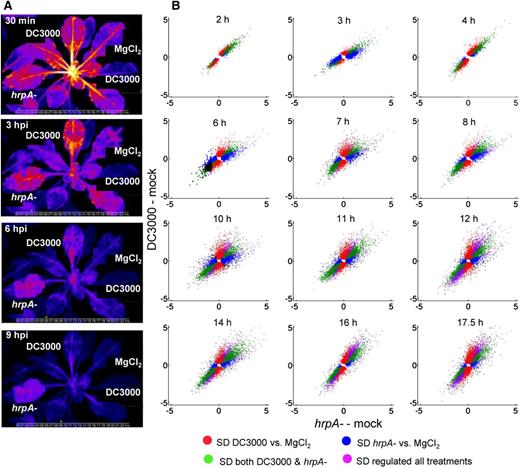
Dynamics of Differentially Expressed Genes during MTI and Disease Development.
(A) Infection dynamics reveal suppression of MAMP-triggered defense responses by DC3000 using a reporter line expressing FRK1 (At2g19190) fused to luciferase. Rapid suppression of FRK1 expression is evident between 3 and 6 hpi following DC3000 challenge, whereas FRK1 expression decreases more slowly in the DC3000hrpA-challenged leaf.
(B) Dynamics of expression in Arabidopsis leaves after challenge with either DC3000 or the DC3000hrpA- mutant, representing disease and defense responses respectively. Gene expression is represented graphically at each time point by a scatterplot. The y axis indicates log2 fold change between DC3000 infection and mock, while the x axis indicates log2 fold change between DC3000hrpA- and mock. In these plots, green represents DEGs changing in the same direction in both virulent DC3000 and mutant DC3000hrpA- challenges compared with mock (MgCl2) inoculation. Therefore, genes categorized as green represent MAMP response genes not modified by effectors. Red represents DEGs between DC3000 and mock challenge but not between DC3000hrpA- and mock challenge. Thus, red represents genes actively influenced (induced or repressed) by effectors relative to mock and DC3000hrpA- infection. Conversely, blue represents MAMP-responsive genes whose response is attenuated by effectors. In summary, for DEGs in one treatment relative to mock, red represents effector-driven changes relative to DC3000hrpA- treatment compared with mock; blue represents MAMP responses modified by effectors; green represents persistent MAMP responses. Violet indicates DEGs between all three treatments, and these appear late in the time course. Gene expression analysis was performed using the LIMMA package in Bioconductor using a P value cutoff of 0.05 and FDR applied using the Benjamini-Hochberg method.
To first provide a global overview of transcriptional dynamics across the time course, we used scatterplots to represent commonalities and differences in gene expression between DC3000 (ETS) and DC3000hrpA- (MTI) challenges relative to the mock control based on a pairwise comparison of all genes at each time point. Significantly differentially expressed genes (DEGs) between pairs of treatments at each time point were determined with the Bioconductor package LIMMA (Smyth et al., 2005) using the Benjamini-Hochberg false discovery rate (FDR) correction and a P value cutoff of 0.05 (Supplemental Data Set 1). Scatterplots are used in Figure 1B to illustrate the dynamics of DEGs between DC3000 and DC3000hrpA- challenges relative to mock. In these plots the y axis indicates log2 fold change between DC3000 infection and mock, while the x axis indicates log2 fold change between DC3000hrpA- and mock. Individual DEGs are then colored based on their expression patterns in the three treatments. Green represents DEGs changing in the same direction in both DC3000 and DC3000hrpA- challenges compared with mock (MgCl2) inoculation. Therefore, genes categorized as green represent MAMP response genes similarly differentially expressed by both DC3000 or DC3000hrpA- challenge. Red represents genes differentially expressed between DC3000 and mock challenge but not between DC3000hrpA- and mock challenge (these lie roughly along the line x = 0, hence no fold change in response to DC3000hrpA- infection compared with mock). Thus, red represents DEGs actively influenced by effectors (induction or repression). Conversely, blue represents MAMP-responsive genes whose expression is attenuated by DC3000 (i.e., these genes exhibit little fold change between DC3000 infection and mock). In summary, the DEGs observed between treatments are represented as such: red, effector-driven changes; blue, MAMP responses suppressed by effectors; green, persistent MAMP responses.
Our pairwise differential expression analysis also identified genes that were differentially expressed between DC3000 and DC30000hrpA-, in addition to DC3000 versus mock and DC3000hrpA- versus mock. In Figure 1, violet genes are differentially expressed between all three treatments with the same direction of expression change in both pathogen infections compared with mock. These appear late in the time course.
As expected, at 2 hpi, the majority of DEGs are MAMP responsive. Green and red dominate. The significant red component suggests that effectors are just beginning to have an impact because at this time point there are no DEGs between DC3000 and DC3000hrpA-. Without further experimentation it is not possible to determine whether these transcriptional changes are part of the pathogen virulence strategy or are the result of a weak initial ETI response. A rapid, but transient, change between 2 and 3 hpi captures the first significant effector-driven transcriptional differences between DC3000 and DC3000hrpA- challenges. At 3 hpi, the impact of effectors was striking, despite the amplitude of these responses being relatively small. The strong blue signal indicates DEGs in DC3000hrpA- but not DC3000, signifying an initial transcriptional suppression of MTI by effectors resulting in realignment of gene profiles in DC3000-infected leaves back to the mock signature. By 4 hpi the profile changes again, with persistent MAMP- (green) and DC3000-driven changes (red, corresponding to ETS or weak ETI) dominant and with an obvious increase in amplitude. From 4 to 6 hpi another major change in MTI and ETS is evident, illustrated by the strong blue and red profiles, respectively, and by appearance of a violet signal. This pattern subsequently consolidates and is characterized by an increasing number of DEGs over time with a diminishing blue signal and the emergence of a strong violet signal. Notably, persistent MAMP-responsive expression (green) remains a major component across the time course. This reflects a continued role for activated PRRs in a sustained host-defensive response and indicates that effectors only modulate a subset of MAMP-responsive genes.
The Majority of Transcriptional Changes Are Initiated by 6 hpi
To take full advantage of the temporal nature of our data sets and to ensure we captured the breadth of the transcriptional response, DEGs were found using three techniques specifically adapted to time series data (Supplemental Figure 2 and Supplemental Data Set 2): a locally adapted Gaussian Process two-sample test modeling time series (GP2S; Stegle et al., 2010) that calculates differential expression based on a Bayes factor calculated between two models, one that assumes that the microarray time series in both conditions are samples drawn from an identical shared distribution and an alternative model that describes the time series in both conditions as samples from two independent distributions; Bayesian Analysis of Time Series data (Angelini et al., 2008), which uses the ratios of the expression in the different time series treatments to calculate the Bayes factor, indicating whether a gene is differentially expressed and fits a function to this expression-ratio time series; and Microarray Analysis of Variance (MAANOVA; Wu et al., 2003), which can be applied to the statistical analysis of gene expression data from two-color cDNA microarrays with sophisticated experimental design. These three methods can identify different sets of DEGs, and all have advantages and different weaknesses. For example, we are confident in the genes identified by GP2S from our previous work (Breeze et al., 2011; Windram et al., 2012). However, due to the process-fitting algorithm, the GP2S algorithm is not ideally suited to capture genes that change rapidly in expression as seen in the rapid transitions early in the infection process (Figure 1B). As no method resulted in enriched false positives within the Venn areas in Supplemental Figure 2, we therefore took the union of DEGs predicted by these three methods to allow us to increase the scope of our differential expression analysis. To find the time at which expression of these DEGs first diverges between treatments, we applied the Gaussian process gradient tool (Breeze et al., 2011). Figure 2 shows the time at which the gradient significantly deviates from zero for the log expression ratios, i.e., the point at which the gradient of the expression ratio significantly increases (upregulation) or decreases (downregulation) from zero for mock-subtracted DC3000hrpA- expression (Figure 2A; MTI responses), mock-subtracted DC3000 expression (Figure 2B), or effector-driven differences in DC3000hrpA- subtracted DC3000 expression (Figure 2C). Note that Figure 2 is labeled with the time at which the gradient starts to change. As many of the transcriptional changes captured in the data set are rapid MTI-related responses, the expression of a significant proportion of genes has already clearly differentiated between treatments by 2 hpi; therefore, the gradient appears to be changing from 0 hpi. Comparison of both DC3000 and DC3000hrpA- challenges with mock shows that the majority of genes exhibit first differential expression within 6 hpi, with a notable peak evident 2 hpi, consistent with a strong MTI response. Comparing the time of expression divergence (gradient change) across treatment comparisons, more DEGs were detected during infection with DC3000 (as inferred from Figure 1), but overall both challenges have similar temporal profiles. The impact of effectors increases from 2 hpi (Figure 2C), with a strong peak in differential expression at 6 hpi, before declining. Between 7 and 10 hpi, very few new genes exhibit divergent expression in the two treatments for the first time and virtually none after 10 h. These data illustrate that the majority of the transcriptional response to MTI and ETS is initiated within the first 6 hpi. These signatures are subsequently modified in amplitude and direction or sustained in response to further effector activities during succeeding time points as captured in Figure 1.
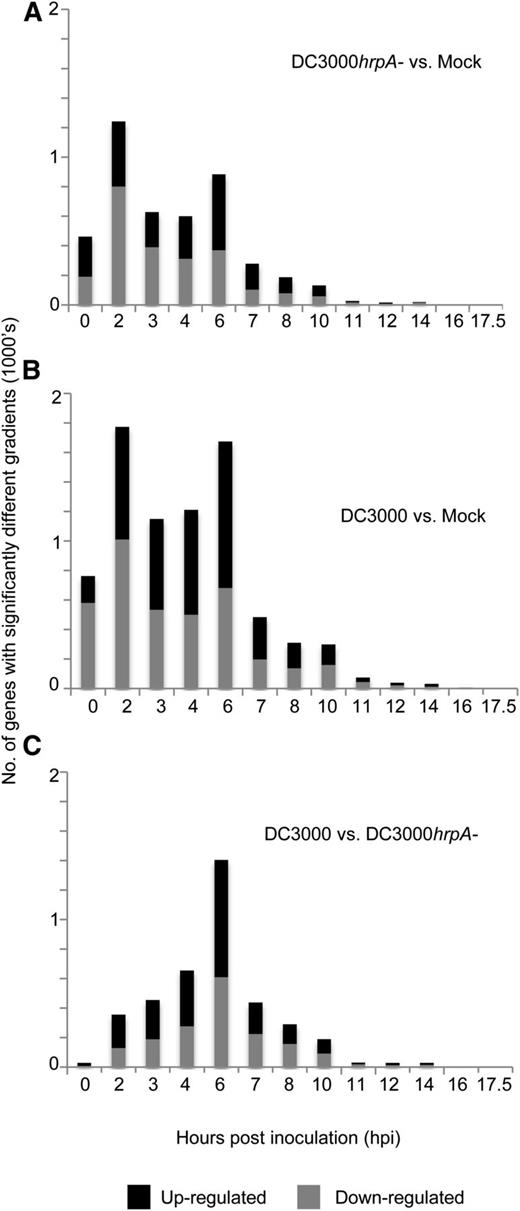
Time at Which Gradients of DEGs Begin to Significantly Differ between Treatments.
The histograms show the times at which the gradient profile of log expression ratios of DEGs between treatment pairs first diverges from zero as determined by the gradient tool (Breeze et al., 2011). Threshold for up/downregulation is three standard deviations of the gradient being significantly non-zero (Pnon-zero < 0.05).
(A) Mock-subtracted expression during DC3000hrpA- infection.
(B) Mock-subtracted expression during DC3000 infection.
(C) DC3000hrpA-subtracted expression during DC3000 infection.
Early Effector Activity Leads to Major Transcriptional Changes Prior to Increased Bacterial Growth
Using the time series DEGs, we next mapped the temporal structure of MTI- and effector-induced gene expression (Figure 2) on to the respective pathogen growth curves and used Gene Ontology (GO) selection (Ashburner et al., 2000) to capture existing knowledge of processes modulated by these contrasting challenges. GO selection was based on minimizing repetitive terms and maximizing informative terms (e.g., phytoalexin biosynthesis rather than cellular metabolism). Figure 3A illustrates the temporal changes in biological process ontologies (determined using BiNGO; Maere et al., 2005) enriched in genes differentially expressed during MTI (DC3000hrpA- versus mock challenge) mapped onto bar charts depicting DC3000hrpA- growth under identical inoculation conditions used for the microarray experiments. Figure 3B captures effector-modified gene expression (DC3000hrpA- versus virulent DC3000) mapped on to multiplication of the hrp mutant and virulent DC3000, sampling at 0, 4, 6, 7, 8, 9, 10, 12, and 21 hpi. Growth curves are annotated with overrepresented gene ontologies of up- (red) or downregulated (blue) genes separated by the time at which the gradients first diverge between treatments. Bacterial growth curves show that DC3000 does not grow significantly until 8 hpi, whereas DC3000hrpA- hardly multiplies during the time course (Figure 3B). Thus, the majority of the transcriptional responses to MTI and ETS seen in Figure 2 occur prior to multiplication of DC3000. Notably, a reproducible dip in bacterial growth shortly after infiltration can be seen in both DC3000 and DC3000hrpA- growth curves and has previously been reported (Mitchell et al., 2015). However, the dip in DC3000 growth appears to be more pronounced, suggesting that the delivery of effectors may initially be detrimental to DC3000 growth, perhaps suggesting a weak but ultimately unsuccessful ETI response within the host. To corroborate the bacterial growth dynamics, confocal images of YFP-expressing DC3000 (∼7.5 × 10⁸ cfu/mL) within Arabidopsis leaves captured 4, 8, and 22 hpi show the very limited growth of DC3000 at 8 hpi (Figure 3C).
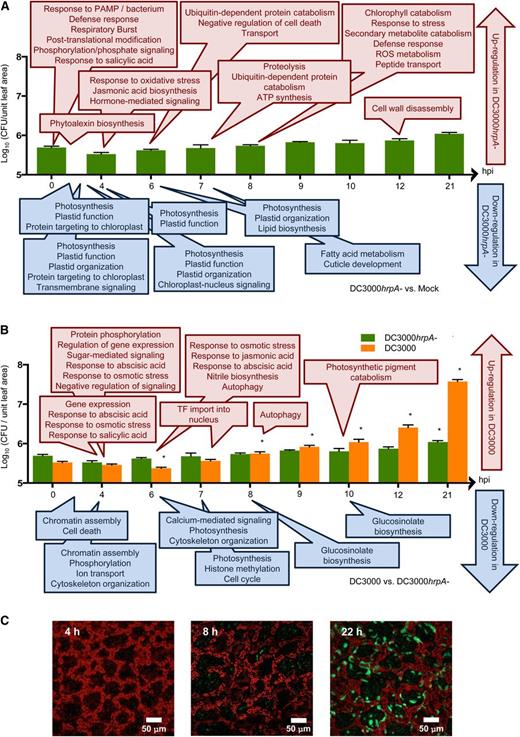
Growth Curves of DC3000 and DC3000hrpA-, with Selected GO Terms Enriched by Genes Changing Expression at Indicated Time Points.
Bacterial growth in log10(CFU/unit leaf area) of disarmed DC3000hrpA- (A) and virulent DC3000 (B) following syringe challenge of bacteria at 108 cells/mL. Asterisk represents significance growth differences between treatments as determined by Students t test (P < 0.5, n = 5; means ± sd). Growth curves are annotated with overrepresented gene ontologies of up- (red) or downregulated (blue) genes separated by the time at which the gradients of DEG profiles begin to deviate (Figure 2). Ontologies of DEGs between DC3000hrpA- to MgCl2 treatments (A); ontologies of DEGs between DC3000 and DC3000hrpA- challenges (B). GO enrichment was determined using BiNGO (Maere et al., 2005). Growth of YFP-expressing DC3000 within Arabidopsis leaves at 4, 8, and 22 hpi corroborates growth curve data (C).
As expected, the early biological process GOs induced by DC3000hrpA- challenge represented defense responses. These could be further refined into respiratory burst, phosphorylation, posttranslational modification, and salicylic acid (SA) synthesis, consistent with our emerging knowledge of how MAMP receptors respond to their cognate ligands (Kadota et al., 2014; Macho and Zipfel, 2014; Zipfel, 2014). A short time later, at 4 hpi and somewhat counterintuitively given the role of jasmonic acid (JA) in suppression of SA signaling, both JA synthesis and response to oxidative stress are overrepresented. As we compared syringe-infiltrated MgCl2 as the mock control, the JA response that occurred in DC3000hrpA- challenged but not mock-treated leaves is unlikely to have arisen from the wound response due to the inoculation technique. Interestingly, by 7 hpi, the most dominant ontology is ubiquitin-dependent protein metabolism, a process intimately linked to removal of key regulatory modules (Dudler, 2013). By contrast, a striking enrichment of GO terms associated with plastid-targeted genes, in particular photosynthesis-related processes, account for the earliest suppressed processes, occurring within 2 hpi. This appears to be a dynamic process, as additional plastid-related genes continue to be suppressed at 6 hpi. Changes in nuclear-encoded plastid genes have been reported previously in various host-pathogen responses (Bonfig et al., 2006; Truman et al., 2006; Zheng et al., 2012), but these studies have not captured the striking rapidity of this response nor clear attribution to MTI. By 7 hpi, components of fatty acid metabolism and cuticle development (implicating synthesis of waxes) are suppressed. Subsequent to 8 hpi, few other processes are induced, perhaps indicative of the quelling of the energy demanding MTI response in the absence of perceived effector modulation. Selected GO terms enriched in DEGs between DC3000 and mock-infiltrated leaves are shown in Supplemental Figure 3, and the full lists of significant GO terms for all treatment comparisons are given in Supplemental Data Set 3.
Analysis of genes that diverge between DC3000 and DC3000hrpA- enables the impact of ETS to be captured and examined in further detail and in isolation from persistent MTI expression. Notably, ontologies capturing an early induction in host response to abscisic acid (ABA) between 4 and 6 hpi reinforce the importance of this hormone in suppressing early MAMP responses and promoting susceptibility (de Torres Zabala et al., 2009). Also of note is the coordinated induction of negative regulators of signaling at 4 hpi. Negative regulation is proposed to be a key mechanism in reconfiguring host transcriptional responses to virulent pathogens (Kazan, 2006). This is paralleled by overrepresented ontologies for transcription factor (TF) import into the nucleus at 6 hpi and autophagy at 7 hpi. Photosynthetic processes, which initially occur as part of MTI in both treatments relative to mock, represents the most dominant effector-suppressed ontology. Suppression of photosynthetic processes is maintained throughout the time course in DC3000-infected leaves, whereas recovery of expression can be seen in DC3000hrpA- by 17.5 hpi. In addition, chromatin assembly (4 hpi), histone assembly (7 hpi), and glucosinolate biosynthesis (8 hpi) are the most notable ontologies among the suppressed genes, suggesting restriction of secondary metabolism and global reconfiguration of the transcriptome architecture. The most striking feature of the effector-induced host transcriptional reprogramming is that the majority occurs remarkably rapidly, well before significant bacterial multiplication (Figure 3B).
Although we used four single leaf replicates and two technical replicates per treatment per time point, this is a single time course. To validate our data, we compared the DEGs from this experiment with DEGs from corresponding time points and treatments identified by Truman et al. (2006) in a study run under very similar conditions at different locations (Supplemental Table 1). Strikingly, we saw highly significant concordance between these two studies, with a Spearman correlation ranging between 0.76 and 0.90, indicating a remarkable degree of reproducibility between these two experiments and supporting the integrity of these data.
Detailed Analysis of Gene Expression Patterns during MTI and ETS
To tease apart the complexity of these responses and identify the groups of genes showing MTI- and effector-responsive expression, we looked at how DEGs (Supplemental Figure 2) overlap between pairwise comparisons of the three treatments (Supplemental Figure 4 and Supplemental Data Set 4). Each area of the Venn diagram is labeled according to the transcriptional response output it represents. The DEGs in two or more pairwise comparisons (i.e., sections D, E, F, and G in Supplemental Figure 4) were further subdivided into those up- and downregulated and are illustrated by representative profiles in Figure 4. These genes represent four broad response subcategories. Category D is defined as MTI responsive; these 3880 genes behave similarly in both bacterial treatments relative to mock-inoculated leaves. The ontologies representing transport, ubiquitination, response to bacterium, phosphorylation, response to JA, and phytoalexin biosynthesis are enriched in induced genes in Category D, whereas suppressed genes are enriched in protein import and photosynthesis-related components. The large number of genes within this category represent core MTI response components not modulated by effectors (green in the pairwise comparison in Figure 1) and serve to highlight (1) the scale of the transcriptional reprogramming and (2) that a successful infection does not require wholesale, but rather selective, suppression of immunity-induced gene expression changes.
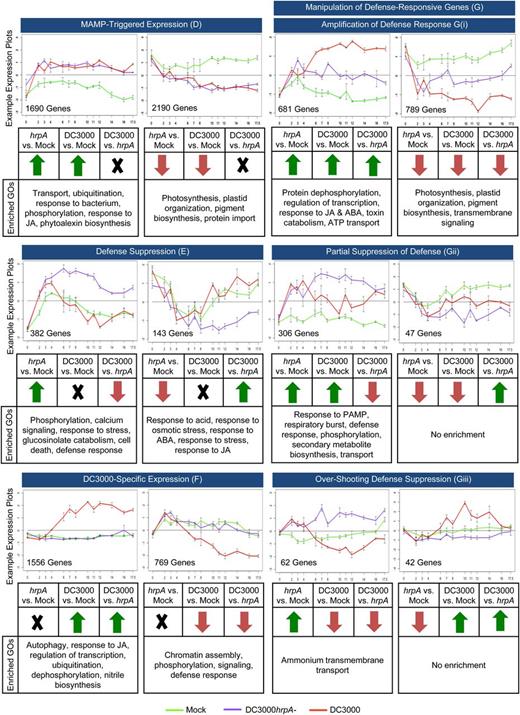
Response Categories of DEGs Capturing Different MTI and ETS Profiles.
Categories derived from the Venn diagram of DEGs (Supplemental Figure 4) showing direction of change. Numbers of genes falling into each category with accompanying expression plots (y axis, log relative gene expression; x axis, hpi; bars indicate se) for a representative example are shown. GO enrichments of each subcategory were established using BiNGO (Maere et al., 2005).
Category E contains 525 genes that are responsive to MTI during DC3000hrpA- infection, but that are suppressed (by either up- or downregulation) and return to mock expression levels by effector activity during DC3000 infection. Effector-suppressed Category E genes are enriched in ontologies capturing phosphorylation, calcium signaling, response to stress, glucosinolate catabolism, cell death, and defense responses. Notably, effector-induced ontologies in Category E capture induction of JA and ABA response genes.
A more detailed examination of Category E genes reveal several that encode known regulators of the defense response: the EF-Tu receptor (EFR), TGA3, WRKY53, RBOHD, PEN2, and PEN3. EFR specifically recognizes bacterial elongation factor, activates plant defense responses, and exists in a complex with RBOHD, responsible for the generation of reactive oxygen species during plant defense (Kadota et al., 2014). PEN2 and PEN3 are essential components of cell wall defense linked to metabolism and transport of secondary metabolites (Clay et al., 2009). TGA3 and WRKY53 encode TFs playing critical roles in defense against DC3000 (Kesarwani et al., 2007; Murray et al., 2007). Although it is clearly posttranscriptional events that determine the ultimate activity of these proteins, the suppression of their transcripts by virulent DC3000 suggests this plays a significant contribution as an effective virulence strategy.
The presence of six genes encoding putative R proteins within this group of suppressed defense genes is particularly striking, five of which encode the TIR class of R protein (TIR-NBS-LRR) and one encoding the coiled coil type (CC-NBS-LRR). R proteins are a crucial component of ETI, and suppression of these six putative R proteins by DC3000 effectors suggests that they may play a key role in the plant defense response. Indeed, two of these putative R proteins (AT1G12290 and AT4G09420) are able to interact with and potentially “guard” Arabidopsis proteins that themselves can interact with P. syringae effectors (Mukhtar et al., 2011). One hypothesis would therefore be that these R proteins are detecting the activity of pathogen effectors (via the intermediate interacting proteins); hence, effector-mediated transcriptional repression of these R proteins could help to dampen ETI. To our knowledge, recessive avr genes, i.e., pathogenic effectors that prevent the recognition of other effectors, have yet to be identified in P. syringae pv tomato, although such genes have been found in fungal and other bacterial plant pathogens (Iyer-Pascuzzi and McCouch, 2007).
Another hypothesis emerging from the analysis of DC3000-suppressed genes involves protein disulfide isomerase (PDI) activity. Four PDI genes (PDI1, 2, 5, and 6) are upregulated during MTI and suppressed by the virulent pathogen, presumably being indirect targets of one or more effectors. These PDI proteins are localized to the endoplasmic reticulum with at least one, PDI6, also being targeted to chloroplasts (Yuen et al., 2013; Wittenberg et al., 2014). Knockout mutants of PDI6 show reduced photoinhibition due to enhanced repair of photosystems (Garcia et al., 2008; Wittenberg et al., 2014). Hence, preventing induction of PDI6 may represent a strategy designed to maintain energy and nutrient supplies.
The signatures of the 2325 genes in Category F represent those uniquely responsive to DC3000 challenge. Their expression profiles are similar in DC3000hrpA- and mock-inoculated leaves, indicating that they are not components of MTI but that they represent specific effector-responsive transcriptional reprogramming. Without additional experimentation, it is not possible to determine whether these are transcribed as part of the pathogen virulence strategy or representative of a host response to effector activities. These genes may be involved in a host secondary defense response, may be responding to bacterial proliferation, or may be susceptibility targets of effectors that facilitate the infection process.
As expected, Category F encompasses a diverse range of genes reflecting the necessarily broad range of processes targeted by effectors or induced by the host in an attempt to mitigate the extent of effector activities. Ontologies enriched in these effector-induced genes include autophagy, response to JA, regulation of transcription, ubiquitination, and dephosphorylation, whereas suppressed genes include ontologies associated with chromatin assembly, phosphorylation, signaling, and defense response.
The most striking gene class downregulated in Category F was the family encoding receptor-like proteins (At-RLP). Arabidopsis has 57 RLPs, 15 of which are downregulated ∼10 hpi in Category F, consistent with effector-mediated attenuation of host defense capability. Two other notable features in this category were a large number of MYB domain-encoding genes (30) and four out of six of the ABA INSENSITIVE5 (ABI5) binding proteins that regulate ABA signaling (Garcia et al., 2008), including NINJA, the negative regulator of JA signaling (Pauwels et al., 2010).
Looking at biological processes, most notable were the strong suppression of transcripts (Supplemental Data Set 5) associated with chromatin reorganization (Figure 5A) and the induction of components annotated as playing a role in ubiquitination (Figure 5B), particularly as both these processes play broadly complementary roles in controlling transcriptional networks (Dantuma et al., 2006; Zhao et al., 2014).
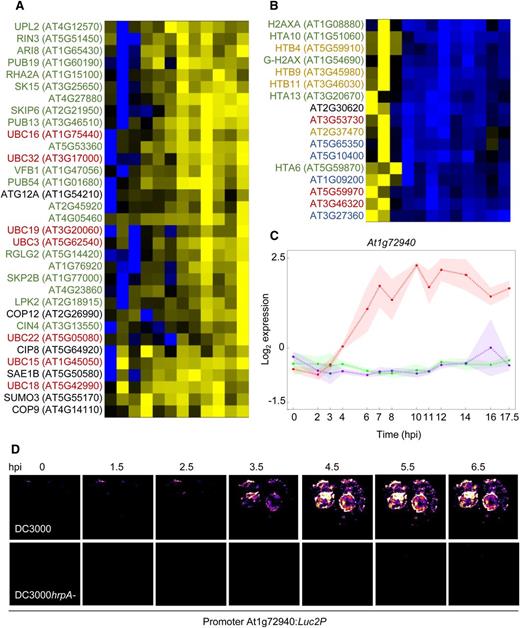
Analysis of Effector-Specific DEG Profiles Reveals Dynamic Changes in Functionally Related Genes and Possible ETI Responses.
Heat maps were generated for chromatin and ubiquitin related genes identified as differentially regulated in Category F (Supplemental Figure 4 and Supplemental Data Set 5). Genes were scaled on a per-gene basis and expression represented in blue for genes induced in DC3000hrpA- relative to DC3000 and yellow for genes that were significantly higher in DC3000 relative to DC3000hrpA-.
(A) Ubiquitin-associated genes differentially regulated in DC3000-challenged leaves. Annotated genes are color coded as follows: red = E2 ligases, green = E3 ligases, and black = other related genes (COPs, SUMOs, etc.).
(B) Chromatin-associated genes were strongly suppressed in DC3000-challenged leaves. Annotated histone genes are color coded as follows: green = H2A, yellow = H2B, blue = H3, red = H4, and black = H1 linker genes.
(C) Very rapid and strong induction of a gene encoding a predicted TIR plant disease resistance protein, At1g72940, suggests possible early ETI responses to effectors.
(D) Dynamics of expression were validated using transient expression of an At1g72940 promoter luciferase reporter fusion in N. benthamiana.
To validate the expression profiles, we made promoter luciferase fusions between two genes rapidly induced by effectors and tested their response to bacterial challenge by transient assay in Nicotiana benthamiana. We chose a classical TIR-NBS-LRR (At1g72940) and a RAB GTPase homolog C2B GTP binding transcription factor (At3g09910). In contrast to the suppression of R genes in Category E and RLPs in Category F above, the strikingly rapid induction of At1g72940 in response to DC3000 but not DC3000hrpA- challenge (Figure 5C) suggests activation of a host defense response to effectors and reinforces the possibility of active engagement of an early ETI response. At3g09910 showed a similar DC3000-responsive profile in N. benthamiana transient assays (Supplemental Figure 5), but consistent with the microarray data, the magnitude of response is significantly less than that driven by the At1g72940 promoter (Figure 5D).
Finally, Category G contains 1927 DEGs that behave differently across all three treatments. Broadly, Category G represents genes involved in the manipulation of defense. These genes can be further classified as follows: 681 and 789 genes with a DC3000 profile that appears to be an amplification or suppression, respectively, of the DC3000hrpA- response compared with mock and most likely to represent a sustained host defense response that serves to restrict pathogen multiplication; 306 and 47 genes that have an intermediate expression profile in that they are suppressed or induced, respectively, in DC3000-treated leaves compared with DC3000hrpA- but do not realign to expression levels in mock-infiltrated leaves, indicating a partial quelling of MTI. A further 62 and 42 genes show opposing responses to DC3000hrpA- or DC3000 compared with mock infection, respectively. These subcategories serve to highlight the underlying complexity of the transcriptional response.
Early Sustained Effector-Specific DEGs Are Predicted to Modulate Perception of External Stimuli and Chromatin Reorganization
We selected effector specific DEG profiles to probe processes initially targeted by DC3000. We identified 140 potential effector-induced genes and 42 potential effector-repressed genes using the criteria that the gene had a sustained (6 to 8 hpi) differential expression profile between DC3000 versus mock and between DC3000 versus DC3000hrpA-, but not between mock versus DC3000hrpA- (Supplemental Data Set 6). These genes are predicted to capture the initial host transcriptional changes driven by effector delivery and not induced during MTI. Unexpectedly, not a single GO term was overrepresented in the upregulated list (corrected P > 0.05). This is consistent with the hypothesis that effectors target a broad range of host genes and this interval captures early effector action before initial effects propagate through the network to affect significant numbers of genes in individual GO term categories. By contrast, in the suppressed genes set, we found highly significant overrepresentation of the term “chromatin assembly” (corrected P < 1.4e−12) with histones H1.2, GAMMA-H2AX, HTA13, HTB2, HTB9, HTB11, H3, and H4 strongly suppressed following effector delivery. Two representative examples are shown in Supplemental Figure 6. MEME analysis (Bailey et al., 2006) revealed that promoter sequences of five of these eight genes contained a paired Oct-TCA motif in close proximity to the transcriptional start site. This motif, originally identified in tobacco histone genes, has been shown to confer S phase-specific transcriptional activation (Taoka et al., 1999). These data suggest that effectors either directly bind to Oct-TCA and neighboring motifs or recruit/maintain transcriptional repressors on the promoters of these histones.
Additional inspection revealed suppression of 10 putative defense-related receptor-like kinase encoding genes (encoding three leucine-rich repeat receptor kinases, two cysteine-rich RLKs, three RLKs, and two TIR-domain resistance gene homologs), suggesting rapid ETS of these signaling modules. Our data imply that an early virulence strategy restricts components of chromatin assembly, which would have a global effect on nucleosome packaging, providing enhanced access for transcriptional regulators. Concomitantly, transcripts for putative defense receptors/resistance genes are suppressed to potentially dampen further host defense responses as seen for RLPs in Figure 4 Category F.
Investigation of Regulatory Elements Driving Establishment of Defense or Disease
Conserved DNA sequences upstream of transcriptional start sites represent important regulatory regions of the promoter (Baxter et al., 2012). The combinatorial arrangement of these motifs, the nature of the cognate TF regulation, TF availability, the presence of posttranslational modifications, and competing transcriptional repressors collectively determine gene expression. We extended our targeted MEME analysis of early effector specific genes to all expression patterns observed and all DEGs. We employed unsupervised clustering (SplineCluster; Heard et al., 2006) of expression profiles within each treatment (Supplemental Data Set 7) and then for all clusters analyzed motif occurrences (Supplemental Data Set 8). Clustering expression profiles over time lends strength to the hypothesis that genes in a cluster are not only coexpressed but also coregulated.
A total of 32 clusters across all treatment comparisons showed statistically significant overrepresentation for at least one motif (Figure 6). Variation is observed in terms of both the range of motifs distributed over different comparisons and different clusters within a comparison. Notably, where the same motif was linked with more than one expression cluster these expression clusters largely had similar temporal profiles, further validating genuine links between motif occurrence and temporal profiles. For example DC3000hrpA- clusters 48 and 49 are associated with the same motifs, as are DC3000-DC3000hrpA- clusters 2, 3 and 4.
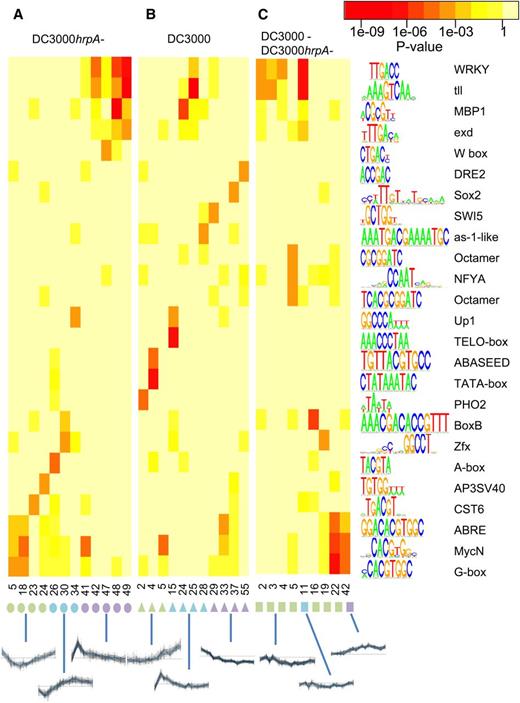
Revealing Links between TF Binding Motifs and Temporal Expression Patterns.
Overrepresentation of known TF binding motifs in promoters of gene clusters in three sets of expression clusters. Genes were clustered by expression in DC3000hrpA- (A), expression in DC3000 (B), and expression in DC3000hrpA- subtracted from DC3000 (C). Clusters were ordered by profile similarity. Cluster numbers are given on the horizontal axis, colored symbols indicate clusters with similar profiles, and a selected cluster expression profile of each type is plotted below. Names and sequence logo representations of TF binding motifs (where character size indicates nucleotide frequency) are shown on the vertical axis. Colored boxes correspond to P values. P values are comparable across rows and columns, i.e., not affected by cluster sizes (see Methods). Rows/columns where at least one cluster-motif pairing shows significant enrichment (P ≤ 1e−4) are shown (for full results, see Supplemental Data Set 8).
The motifs identified in the DC3000hrpA- comparison (Figure 6A) provide an insight into transcriptional regulation of MTI. Genes in clusters 5 and 18 are downregulated early following DC3000hrpA- challenge and contain G-box motifs, whereas clusters 42, 47, 48, and 49 contain W-box motifs and are upregulated early in infection. This is consistent with the role of WRKYs in the rapid gene activation early in the defense response (Eulgem et al., 2000; Eulgem and Somssich, 2007).
In addition to these motifs, notable plant-specific motifs uniquely overrepresented in DC3000hrpA- clusters include (1) a specific W-box in cluster 47 involved in elicitor-induced activation of the tobacco chitinase gene, which is bound by Nt-WRKYs 1, 2, and 4 (Yamamoto et al., 2004); (2) the A-box (TACGTA), which is overrepresented in cluster 26; (3) the AP3SV40 motif in cluster 24; (4) the Zfx box; and (5) BoxB in cluster 30.
A number of motifs were identified as strongly overrepresented specifically in DC3000 expression clusters (Figure 6B). In clusters showing suppression, these include (1) the DRE2 (drought-responsive element) core element, first described in the promoter of ABA-inducible Rab17 (Busk and Pagès, 1998), (2) SWI5 (Badis et al., 2008), and (3) an as-1-like motif found in the cucumber hydroxypyruvate reductase A promoter, required for cytokinin responsiveness (Jin et al., 1998). Cluster 15, characterized by rapid early gene induction, showed overrepresentation of the Telo-box (Axelos et al., 1989), a motif found in the 5′ region of numerous genes encoding components of the translational apparatus. Gene clusters with a late induction profile were characterized by overrepresentation of the ABASEED motif involved in ABA regulation and seed expression (Busk and Pagès, 1998), a specific variant of the TATA-box (cluster 4), or the PHO2 box motif (cluster 2).
The DC3000-DC3000hrpA- comparison (Figure 6C) highlights clusters that have combinatorial overrepresented motifs: WRKY (Eulgem et al., 1999), tll (Noyes et al., 2008b), and exd (Noyes et al., 2008a) motifs in cluster 11; and NF-Y (Mantovani, 1998) and two histone OCTAMER (Taoka et al., 1999) motifs in cluster 5 revealing a set of motifs that appear to recruit TFs that are central to ETS. Thus, both our targeted analysis of effector-suppressed genes and untargeted global motif analysis suggest effectors specifically target a subset of genes with OCT motifs. NF-Y motifs are marginally overrepresented in multiple clusters, and it is notable that NF-Y TFs have been shown to recruit histone deacetylase to NF-Y-containing motifs to inhibit promoter activity (Peng and Jahroudi, 2003), and NF-Y TFs are largely accepted as providing a fundamental link between chromatin and transcription (Dolfini et al., 2012).
DC3000 hrpA- clusters 42, 47, 48, and 49 that show a very rapid (2 to 3 hpi) MTI response are enriched in WRKY (Eulgem et al., 1999), tll (Noyes et al., 2008b), MBP1 (Pachkov et al., 2007), and exd (Noyes et al., 2008a) motifs (Figure 6A). Notably, DC3000-DC3000hrpA- clusters 2, 3, 4, and 11 are also enriched with these motifs; they are early induced in both DC3000 and DC3000hrpA- infections, but in DC3000 infection, the expression of genes with these defense-related promoter motifs is later suppressed (Figure 6C). By contrast, ABRE (Busk and Pagès, 1998), MycN (Chen et al., 2008), and G-box (Giuliano et al., 1988) motifs are highly overrepresented in DC3000-DC3000hrpA- clusters 22 and 42 (Figure 6C), comprising genes that are induced by effectors. Strikingly, these motifs are significantly overrepresented in genes that are suppressed early in the defense response to DC3000hrpA- challenge, implying ETS deploys active transcriptional suppression at specific promoter configurations. In summary, we demonstrate a degree of motif specificity and cooperativity in the complex transcriptional regulatory networks recruited during MTI and the modulation of innate immunity by effectors.
Multiple Time Series Coexpression Analysis Predicts Specific Regulation of Pathogen-Responsive Genes
As explained above, coexpression of genes has regularly been used as an indicator of coregulation, and coexpression throughout a high-resolution time series as described here should enhance the likelihood of identifying such coregulated genes. We extended this analysis using Wigwams (Polanski et al., 2014) to identify genes coexpressed across at least two of the three time series treatments. In contrast to SplineCluster, Wigwams does not partition the genes into clusters but identifies modules of genes showing statistically significant coexpression (i.e., not all genes in the analysis will end up in a module). The statistical test in Wigwams discriminates between coexpression stemming from the abundance of a particular expression profile and coexpression indicative of coregulatory mechanisms acting in multiple time series, which is of higher relevance to understanding the underlying gene expression dynamics of the host response. In total, 309 modules (containing 6685 unique genes) were identified that showed statistically significant coexpression in at least two time series (Supplemental Data Set 9). These modules contain genes that may not exhibit expression profile similarities between treatments, but they have similar expression profiles to each other within two or more treatments. For example, the module represented in Figure 7A includes genes that all share a pattern of sustained upregulation in DC3000 and transient upregulation in the other two time series which, by the Wigwams test, is not a mere consequence of the abundance of such trajectories in the individual time series. In an attempt to identify regulatory events positively or negatively modulating their transcription, modules were evaluated for enrichment of known TF binding motifs in the genes’ upstream sequences. A total of 31 modules were enriched for known TF binding motifs targeted by a range of different TF families (Supplemental Data Set 10A). We determined the genes within these modules that contained the enriched TF binding motif(s) in their promoter sequences, hence the most likely coregulated group, and two examples are shown in Figures 7A and 7B and Supplemental Data Set 10B.
Genes Containing the Same Transcription Factor Binding Site(s) in Their Upstream Promoter Sequences Are Coexpressed across Multiple Conditions.
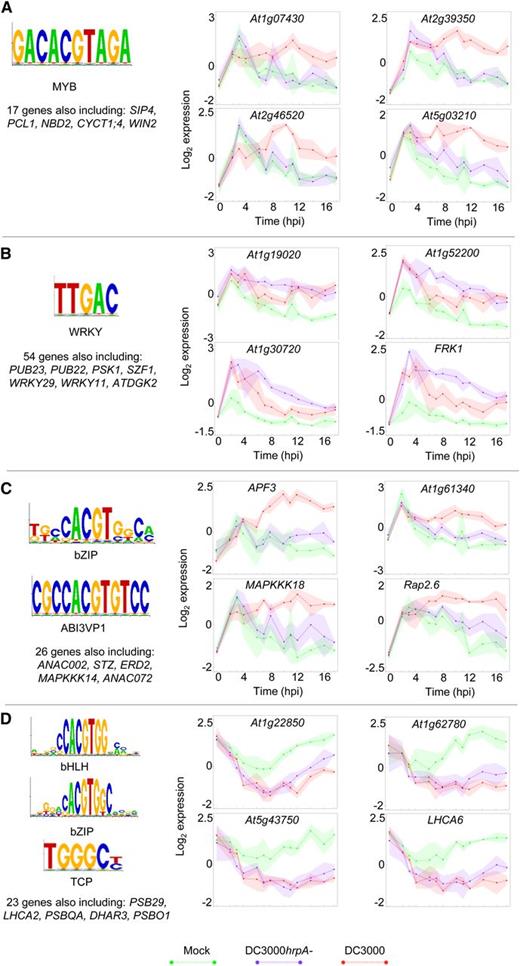
Wigwams modules containing genes showing statistically significant coexpression across at least two of the three conditions were tested for enrichment of TF binding motifs in gene promoter sequences. Genes containing enriched motifs in their promoters were identified. In all cases, the mean expression profile of representative genes is shown (green, mock; purple, DC3000hrpA-; red, DC3000) with shading indicating sd. The binding motifs, relevant TF family, and names of key genes are provided.
(A) Genes coexpressed during DC3000hrpA- and DC3000 infection and containing a MYB TF binding motif (PLACE: S-000355) in their upstream 500-bp sequences.
(B) Genes coexpressed during DC3000hrpA- and DC3000 infection and containing a WRKY TF binding motif (PLACE: S-000390) in their promoters.
(C) and (D) Examples of genes from Wigwams modules enriched for motifs bound by different families of TFs suggesting combinatorial TF activity regulates expression of these genes.
(C) Genes coexpressed during DC3000hrpA- and DC3000 infection and containing a bZIP binding motif (M00441) and an ABI3VP1 binding motif (S-000145) in their promoters.
(D) Genes coexpressed during DC3000hrpA- and DC3000 infection containing bHLH (M00435), bZIP (M00442), and TCP (S-000474) binding motifs in their upstream promoter sequences.
The 17 genes in Figure 7A show coexpression across DC3000hrpA- and DC3000 infection, and all contain a MYB TF binding motif in their promoters, suggesting their expression could be controlled by a MYB TF. Intriguingly, this group of genes includes three protein phosphorylation enzymes (two kinases and a phosphatase) with known positive effects on defense or defense gene expression: PKS5, WIN2, and CRK45. PKS5 phosphorylates NPR1, and expression of two NPR1 target genes, WRKY38 and WRKY62, is reduced in pks5 mutants (Xie et al., 2010). Overexpression of the phosphatase WIN2 enhances resistance against DC3000, and WIN2 has been shown to interact with HopW1-1, an effector present in DC3000 (Lee et al., 2008). Similarly, overexpression of the cysteine-rich receptor-like kinase CRK45 enhances expression of defense genes and resistance against DC3000, and mutants lacking CRK45 show increased susceptibility to the pathogen (Zhang et al., 2013). These genes appear to be part of an ultimately unsuccessful effector-triggered immune response driven by a MYB TF. A second group of potentially coregulated genes is shown in Figure 7B. These 54 genes contain a WRKY TF binding site in their promoters and exhibit coexpression across both pathogen infection time series and the mock-inoculated time series. The group features several genes with a role in defense against P. syringae. PUB22, PUB23, and WRKY11 all encode negative regulators of P. syringae disease resistance (Journot-Catalino et al., 2006; Trujillo et al., 2008) with FRK1 and WRKY29 key genes induced in response to infection (Asai et al., 2002, Figure 1A). Furthermore, WRKY29 induces expression of itself and FRK1 (Asai et al., 2002), validating their membership of the same Wigwams module and suggesting that WRKY29 may regulate the other genes in this group.
Conserved noncoding sequences usually encompass multiple TF binding site, suggesting that combinatorial activity of TFs is often required for gene induction or repression (Baxter et al., 2012). We searched for Wigwams modules that were enriched for motifs bound by two or more different TF families and, hence, potentially subject to combinatorial regulation. Two examples of such sets of genes are shown in Figures 7C and 7D and Supplemental Data Set 10B. Figure 7C features 26 genes coexpressed in the mock and DC3000 time series that contain motifs bound by bZIP and ABI3/VP1 TFs in their promoters. This group includes several known ABA-inducible genes, such as Rap2.6 (Zhu et al., 2010), AFP3 (Garcia et al., 2008), STZ (Sakamoto et al., 2004), ANAC072 (Tran et al., 2004), and MAPKKK18 (Menges et al., 2008). Furthermore, ATAF1 and ANAC072 are components of the ABA signaling pathway and affect the response of the plant to ABA (Fujita et al., 2004; Jensen et al., 2008). The Arabidopsis ABI3 TF and its monocot ortholog VP1 are known to play essential roles in ABA-dependent responses. Although ABI3/VP1 is reported to be seed specific, there are 14 members of this TF family in Arabidopsis (Riechmann et al., 2000) and other members may play a similar role in other tissues. The hypothesis that coexpression of these genes depends on binding of two TF families is strengthened by the identification of a bZIP protein in rice (Oryza sativa) that interacts with VP1 and mediates ABA-dependent gene expression (Hobo et al., 1999). The final example (Figure 7D) is a group of 23 genes coexpressed in the DC3000 and DC3000hrpA- infections and containing bZIP, bHLH, and TCP motifs in their promoter sequences. This group contains a number of photosynthetic genes, such as PSB29 (Keren et al., 2005), LHCA6 (Ifuku et al., 2005), PSB27 (Chen et al., 2006), PNSL2 (Ifuku et al., 2005), PSBQA, and PSBO1 (Murakami et al., 2005). Photosynthetic genes are known to be downregulated in response to many environmental stress conditions including P. syringae challenge (Bonfig et al., 2006; Truman et al., 2006; de Torres-Zabala et al., 2015, Figure 3), and this finding suggests the downregulation is coordinated by TFs from different families with different DNA binding domains. Select phytochrome interacting factors (bHLH TFs) and TCPs have recently been shown to have a role in promoting P. syringae multiplication (Weßling et al., 2014).
Modeling the Transcriptional Network Topology during Disease and Defense
With the exception of the module in Figure 7B, the Wigwams analysis above predicts the family of TF regulating a module but does not elucidate specific TF-target gene interactions. Our high-resolution time series experiment was specifically designed to apply network inference approaches, allowing predictions of putative causal regulatory interactions between genes. As TFs determine the topology of transcriptional networks, we inferred regulatory interactions between TFs differentially expressed early during DC3000 and/or DC3000hrpA- infection using the Causal Structure Identification (CSI) algorithm (Penfold and Wild, 2011; Penfold et al., 2015). We modeled TFs differentially expressed at or before 8 hpi to capture the key early events associated with establishment of MTI and activation of ETS. These time points also ensured that expression data are not confounded by increased bacterial multiplication in the compatible interaction. We anticipate that the network topology (i.e., specific TF-promoter cis-element interaction) is the same during challenge with either DC3000 or DC3000hrpA- but that the flow of information through the network will differ. Specific TFs, their subcellular location, posttranslational modifications, and expression levels will determine information flow during the different bacterial challenges. The CSI algorithm is capable of identifying connections between genes that are only “active” in a subset of the available data sets, providing the expression profiles in the other data sets do not contradict them. Hence, network inference was performed using the expression data for the mock, DC3000, and DC3000hrpA- infections simultaneously.
The resulting network model features 609 interactions between 433 nodes, thus representing a relatively sparse interaction interface (Supplemental Data Set 11). These more linear associations may be indicative of a strategy to rapidly activate TFs driving specific subnetworks rather than using an extended transcriptional cascade. Such a topology would add robustness and make pathogen intervention approaches more challenging. A similar sparse relatively independent network topology was inferred in a recent “global” model of effector-triggered immunity derived from a range of disparate data sets (Dong et al., 2015). The network model is shown in Figure 8 with node color illustrating the differential flow of information through the network in response to DC3000 or DC3000hrpA- infection and the impact of effectors. Expression at a single time point is shown in Figure 8, and a movie capturing the dynamic changes in expression of the whole network can be found in Supplemental Data Set 12. To facilitate visualization and interpretation, genes are classified into eight groups, referenced 1 to 8 clockwise, according to the difference in their expression between DC3000 and DC3000hrpA- infection and containing 3, 23, 59, 87, 53, 92, 81, and 35 nodes, respectively. This arrangement is designed to highlight the complexity of network topologies driving the multiple signaling outputs and the inherent host MTI and ETS responses. In Figure 8A, the network nodes are colored according to the difference in expression level between DC3000hrpA- and the mock with red indicating a TF is upregulated after DC3000hrpA- challenge compared with mock and green indicating downregulation. Figure 8B shows the same network with the nodes colored according to the difference in expression level after DC3000 infection compared with mock inoculation, and Figure 8C shows the network with nodes colored according to the difference in expression between DC3000 and DC3000hrpA- infection. Nodes with higher expression after DC3000 infection are colored red and those with higher expression following DC3000hrpA- challenge are colored green.
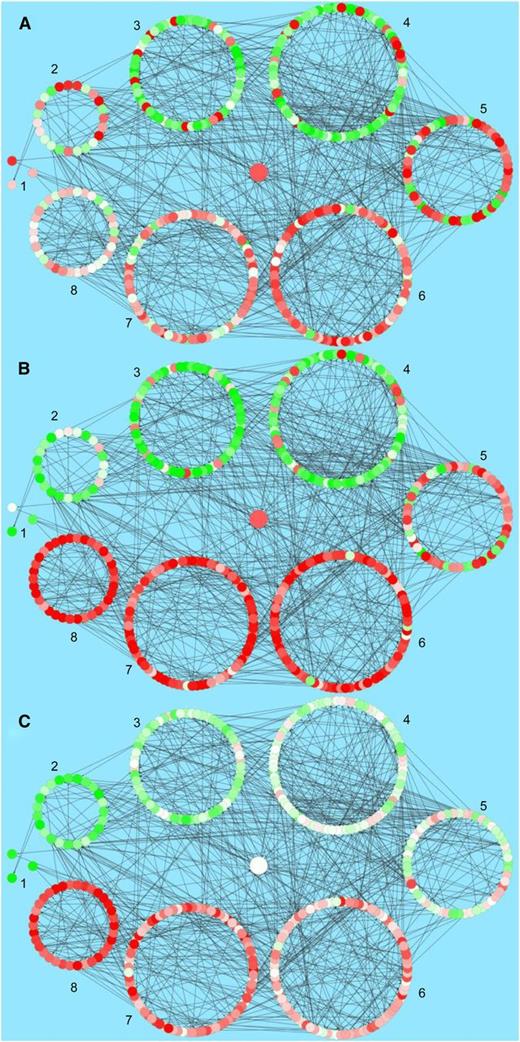
The Inferred Transcription Factor Network Model, Jointly Obtained for Mock, DC3000hrpA-, and DC3000.
The model is limited to genes deemed differentially expressed in at least two of the three pairwise differential expression comparisons and showing an early response. The visualization shows the expression levels of the genes in the network at 8 hpi in a comparison between DC3000hrpA- (A) and mock, DC3000 and mock (B), and DC3000 and DC3000hrpA- (C). Higher expression levels in the former condition always correspond to red colored nodes, while green nodes represent higher expression in the latter condition. For ease of viewing, the genes in the network were grouped based on their expression trend in the DC3000 and DC3000hrpA- delta profile, as shown in (C).
The network visualizations in Figures 8A and 8B demonstrate that the majority of the network TFs are expressed in a similar manner (i.e., up- or downregulated) in response to DC3000 or DC3000hrpA- infection, although expression is also modulated by treatment (Figure 8C), as inferred above (Figures 1 to 4).
Figure 8C (shown dynamically in Supplemental Movie 1) captures network flux in response to effector delivery and groups 1, 2, and 8 highlight markedly contrasting gene expression responses to the presence of effectors. White nodes are similarly induced by DC3000 or DC3000hrpA- challenge, reflecting that a significant component of the MTI network is not actually perturbed by effectors. This is particularly pronounced in network groups 4, 5, and 6, whereas groups 3 and 7 comprise a mixture of MTI-responsive and effector-modulated components.
Each network group has numerous interesting components, and we highlight a few of these. Group 3 (59 members) is characterized by six auxin response factor/IAA TFs, nine homeobox domain-containing TFs, and six WRKY TFs. Notably, all WRKY TFs (WRKYs 9, 11, 17, 22, 38, 48, and 54) are strongly induced by DC3000hrpA- but not DC3000, suggesting these are key defense targets transcriptionally suppressed by effectors. The majority of Group 4 components (87 TFs) were associated with MTI (Figure 8C). Interestingly, there was a strong representation of genes related to floral and leaf development, including five CONSTANS-like genes, a regulator of CONSTANS, CAULIFLOWER, AINTEGUMENTA, ETTIN (ARF3), REDUCED VERNALIZATION2, AGAMOUS-LIKE87, BELLRINGER, LATE ELONGATED HYPOCOTYL, MERISTEM LAYER1, and ASYMMETRIC LEAVES1 as well as chloroplast-localized RNA POLYMERASE SIGMA FACTORS 2, 4, A, and F. Downregulation of these TF genes associated with developmental processes appears to be a core MTI response, unaltered by effectors, underlining the interrelationship of transcriptional regulation in development and innate immunity.
Group 2 consists of genes strongly suppressed by effectors. Of the 23 nodes, >25% (6) represent MYB domain containing TFs (reinforcing the strong MYB domain representation seen in Category F). These comprise a number of negative regulators of transcription, including RAV1 and RAV2, and TCP20 (a negative regulator of senescence and cell size; Lopez et al., 2015). Thus, a strategy for rapid transcriptional activation of pathways by effectors may be to suppress negative regulators of susceptibility targets.
Crucially we can use this network to predict the specific action of pathogen effectors during DC3000 infection. For example, the TFs in group 8 are strongly induced following infection with DC3000, whereas they show minimal change compared with mock after DC3000hrpA- inoculation, suggesting that pathogen effector proteins drive their expression. We analyzed the network to identify TFs that were predicted to regulate several of these effector-activated TFs. We hypothesize that effectors cause misregulation of these upstream TFs, which subsequently upregulate their downstream TF target genes. Three TFs predicted to regulate a number of the TFs in group 8 are XND1 (AT5G64530), FBH3 (AT1G51140), and AT2G40620, all of which show a remarkably rapid change in expression specifically in response to DC3000 infection around 3 to 4 hpi (Figure 9). This coincides with the timing of the first effector-driven changes in gene expression and is consistent with these three TFs playing a key role in mediating effector influence within the plant.
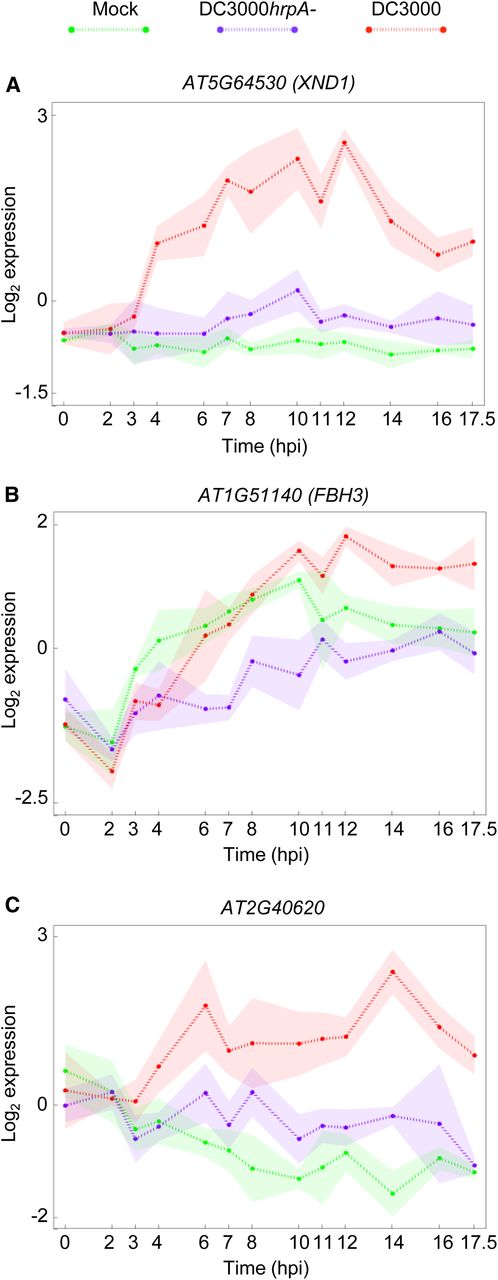
The Expression Profiles of Three Genes Present in the Inferred Transcription Factor Network Model.
Three genes were identified as having a high number of downstream targets among genes upregulated in DC3000 response while being downregulated in DC3000hrpA- response. The identified genes are XND1 (AT5G64530), FBH3 (AT1G51140), and AT2G40620. XND1 is thought to negatively regulate cell death, FBH3 contributes to early flowering, and AT2G40620's function is currently unknown.
XND1 is a member of the NAC (NAM, ATAF, CUC) TF family and is thought to negatively regulate programmed cell death in xylem cells (Zhao et al., 2008). This would be consistent with its predicted effector-mediated upregulation as a hemibiotrophic pathogen would benefit from suppression of cell death. FBH3 encodes a basic helix-loop-helix TF that can activate expression of the CONSTANS gene and cause early flowering (Ito et al., 2012). Early flowering in response to P. syringae infection has been observed (Korves and Bergelson, 2003), but whether this is a developmental response driven by the plant (as a means to escape disease) or driven by the pathogen is not clear. Our findings are consistent with the active manipulation of flowering within the host plant. AT2G40620 encodes a bZIP TF of unknown function. Our network analysis suggests that these three TFs could represent key hubs playing a major role in the promotion of susceptibility by virulent P. syringae (as mediators of effector-driven transcriptional change) and would be candidates for network disruption studies. The mechanism by which these three TFs are upregulated in response to effectors is not clear, yet their position in the network (upstream nodes) suggests that effectors either target their promoters directly or more likely interact posttranscriptionally with other TFs to regulate expression of these hubs. TFs whose activity is determined posttranscriptionally would not be detected in our transcriptional network model. Linking our regulatory network to specific effectors via effector-host protein interaction will be the focus of future research.
DISCUSSION
The Chronology of Effector-Mediated Transcriptional Reprogramming
Reprogramming of key components of host transcription to facilitate suppression of plant immune responses and acquisition of sufficient carbon and nitrogen resources for bacterial multiplication underpins successful infection by pathogens. Here, we describe a detailed comparative analysis of transcriptional responses in P. syringae-infected Arabidopsis leaves.
The primary objectives of this study were to move knowledge beyond single and dual time point studies and (1) capture and contrast the transcriptional dynamics associated with MTI and how these were modified during ETS, (2) reveal new insights into bacterial virulence mechanisms from the complement of genes targeted by pathogen effector activities during a susceptible interaction, and (3) provide high-quality data sets that can be used by researchers to explore specific transcriptional subnetworks associated with MTI and ETS in detail. To achieve these goals, we sampled four single leaf biological replicates at 13 time points. Including both technical replicates and dye swaps, we probed 16 arrays for each treatment at any specific time point, resulting in a detailed and highly replicated infection data set comprising 312 two-color arrays in total. No plant inoculation method is ideal. Dipping or spraying has the advantage of addressing stomatal immunity, but disadvantages include the use of high pathogen inoculums and gross differences in bacterial load across the individual leaf sampled. As pathogens enter via the stomata, there are spatial differences in pathogen distribution and asynchronous infections, confounding any interpretation of time course data. By contrast, syringe challenge with a defined inoculum concentration ensures (1) infection is as synchronous as possible, avoiding confounding gene expression values, (2) as much foliar tissue as possible is exposed to the bacterial treatments to maximize response signatures, and (3) leaves of identical developmental stages can be challenged to reduce effects of developmental stages. However, the possibility remains that interactions or common responses between wounding from the syringe inoculation and the infection process may be masked.
Analysis of this information-rich data set with a range of computational tools provided insights into the earliest transcriptional events triggered by effector injection, regulatory mechanisms recruited, and biological processes targeted. Central to our study was the ability to relate transcriptional changes to in planta bacterial growth. Effector-driven transcriptional modulation was evident as early as 3 hpi, consistent with in planta suppression of luciferase activity seen in leaves of DC3000-challenged FRK1-luciferase lines (Figure 1). Many genes, particularly those responding to DC3000 challenge, showed complex patterns of regulation, often with expression profiles showing very early perturbations from their initial trajectories. Strikingly, despite more than a third of the transcriptome being differentially expressed across our time course, the majority of transcriptional responses (measured by the time at which gradients of expression significantly diverge from mock challenge) were initiated within the first 6 hpi (Figure 2). This is ∼4 h after effector delivery (Grant et al., 2000) and significantly before measurable increases in bacterial growth at 8 hpi (Figure 3). These early transcriptional changes and complex dynamics during initial effector-mediated transcriptional reprogramming have not been captured in previous studies constrained by resolution and sampling strategy.
Within 2 hpi, the impact of effectors was evident in the comparisons between mock and DC3000 or DC3000hrpA- challenges (Figure 1), although at this early stage there were no DEGs between DC3000 and DC3000hrpA- challenges. By contrast at both 3 and 4 hpi substantial changes in transcriptional dynamics between DC3000 and DC3000hrpA- treatments were evident, consistent with early effector activity targeting multiple points of activated PRR signaling pathways (Macho and Zipfel, 2015). By 6 hpi a persistent pattern began to emerge, characterized by an increasing magnitude and number of DEGs between all treatments over time as initial effector targets activated specific transcriptional networks. However, is it important to note that not all effector-mediated transcriptional responses are necessarily part of a pathogen virulence strategy. Some may be associated with early, or failed, ETI responses. The early effector responses seen at 2 and 3 hpi with DC3000 in Figure 1, the significantly reduced growth at 6 hpi (Figure 3; reported in Mitchell et al., 2015), and rapid induction of a TIR-NBS-LRR transcript (At1g72940; Figure 5C) all are evidence for an early ETI response.
Approximately 4000 MAMP-responsive genes were identified across the time course (Figure 4) and represented a major component of the compatible response. These results indicate that while MTI responses are remarkably complex, it is not necessary for effectors to suppress the entire MAMP-responsive network, but rather effectors can selectively suppress specific components or subnetworks to successfully promote disease. This is consistent with the hypothesis that effector target proteins are key components of the host immune response.
The earliest MTI transcriptional response sampled, occurring between 0 and 2 hpi, captured ontologies associated with the respiratory burst, phosphorylation, posttranslational modification, and SA synthesis (Figure 3). One of the most prominent MTI responses was a rapid and sustained suppression of a large proportion of transcripts encoding photosynthetic components, occurring within 2 hpi and being sustained for the first 10 hpi. Thereafter, the majority of these transcripts in DC3000hrpA-treated leaves returned to mock levels by 17.5 hpi, whereas in DC3000-treated leaves, transcripts largely remained suppressed. These profiles support an increasing belief that chloroplasts are potential integrators of plant immune responses (Stael et al., 2015), and recent experimental evidence in support of this was derived using a subset of the data presented here (de Torres-Zabala et al., 2015).
The impact of effectors was early, regulating transcripts encoding a diverse range of proteins. Gene ontologies highlighted ABA biosynthesis as one of the earliest processes induced by effector activity, in agreement with our previous studies (de Torres-Zabala et al., 2007; de Torres Zabala et al., 2009). In parallel, transcriptional regulators were overrepresented among early DC3000-induced genes, consistent with an active suppression of MTI transcription responses (Li et al., 2015) and reflected by overrepresentation of ontologies associated with autophagy (Patel and Dinesh-Kumar, 2008) and TF import into the nucleus coincident with initial bacterial multiplication ∼8 hpi.
Biological Processes Impacted by Effectors
Two general patterns of effector modulation of host transcription were evident. Effectors could modify MAMP-responsive expression through repressing accumulation or preventing suppression of transcripts. We identified 525 MTI-responsive genes that in DC3000 challenge were reconfigured by effectors to a mock profile (Figure 4). Among these genes were previously well-characterized regulators of defense responses, including EFR, TGA3, WRKY53, RBOHD, PEN2, and PEN3. The vast majority of effector-modulated gene profiles were represented by the specific induction or suppression of a diverse variety of 2325 host genes, which were not MAMP responsive (i.e., same profile in mock and DC3000hrpA- challenges; Figure 4). Notable was the overrepresentation of genes involved in transcriptional repression and ubiquitination (Figure 5A), genes encoding MYB domains, and the repression of genes encoding plant receptor-like kinases. We hypothesize that the coordinated transcriptional reconfiguration of these processes represents a fundamental pathogen virulence strategy. Repression of plant receptor-like kinases to attenuate PRR signaling or induction of ubiquitin ligase activity encoding genes to facilitate targeted proteolysis are intuitive strategies. However, most striking was the differential regulation of a range of genes involved in chromatin remodeling.
An Emerging Role for Chromatin Remodeling Early in the Susceptible Interaction
The earliest sustained transcriptional responses specifically upregulated by DC3000 but not by DC3000hrpA- showed no statistical overrepresentation of any GO functional category term. In stark contrast, early downregulated genes showed a highly significant enrichment for “chromatin assembly.” This indicates that at early infection stages, effector activities have not sufficiently propagated through the network to converge onto sufficient numbers of genes in any functional category to yield a statistical signal, whereas downregulation of chromatin assembly genes was rapid (Figure 5B). Consistent with these findings, motif analysis of promoters of early downregulated genes identified the octamer-TCA motif as enriched in these genes and particularly in the subset of chromatin-related gene promoters. The link between this motif and DC3000-specific downregulation was also reinforced in an unbiased analysis of all temporal expression clusters (Figure 6C).
Covalent modifications or “marking” of histone tail residues is crucial for regulation of gene transcription within the chromatin context. Histone lysine methyltransferases and histone lysine demethylases act collectively to impart specific methylation patterns on particular histone lysine residues (Berr et al., 2011; Zentner and Henikoff, 2013). A large number of histone encoding genes were suppressed by effectors including class 3 and 4 histones as well as Histone 2A (HTAs 10, 13, and 6) and Histone 2B (HTBs 4, 9, and 11). Notably, HTB9 encodes DECREASED DNA METHYLATION2/cytosine methyltransferase 1 (DDM2/MET1) (Kankel et al., 2003), suggesting that effectors are actively remodeling chromatin early in the infection process. Reprogramming of chromatin remodeling was reinforced by specific analysis of early (6 to 8 hpi) effector-modulated genes, identifying Histones H1.2, GAMMA-H2AX, HTA13, HTB2, HTB9, HTB11, H3, and H4 among the 42 genes suppressed early, with the majority of the others being a mixture of immunity related receptors (Supplemental Data Set 6).
In parallel to repression of numerous histone encoding genes, effectors also induced some chromatin remodeling genes. The induction of HDA15, encoding a histone deacetylase, which negatively regulates chlorophyll biosynthesis and photosynthesis gene expression in etiolated seedlings (Liu et al., 2013), would be likely to contribute to the sustained suppression of photosynthetic genes observed in Figure 3. Additionally the SET-domain containing genes KRYPTONITE (SDG33) and ASHH1 (SDG26) were induced early in infection. These encode H3K9MTs implicated in crosstalk between DNA and histone methylation (Du et al., 2014) and in transcription regulation and flowering time control (Berr et al., 2015). Thus, the suppression of histone-encoding genes and the selective induction of genes involved in covalent modification of histones evidenced from this study is consistent with an early pathogen strategy to render stretches of DNA more accessible to TFs. It is particularly notable that these changes coincide with increased ABA ∼6 hpi (de Torres-Zabala et al., 2007; de Torres Zabala et al., 2009). Mechanistic links to chromatin remodeling and ABA (Chinnusamy et al., 2008; Ma et al., 2011) or deubiquitination (Sridhar et al., 2007) are emerging. The Arabidopsis homolog of the yeast SWI3 subunit of SWI/SNF (Switch/Sucrose Nonfermenting) chromatin-remodeling complexes (Sarnowski et al., 2002), SWI3B, interacts with the PP2C, HAB1. swi3b mutants show reduced sensitivity to ABA, implicating SWI3B as a novel positive regulator of ABA signaling regulated by HAB1 (Saez et al., 2008). By contrast, the Arabidopsis ATPase BRAHMA SWI2/SNF2 complex represses the ABI5 bZIP transcription factor, which is important in regulating a range of ABA-mediated functions, including vegetative growth and water stress responses (Han et al., 2012).
Predictions of Regulatory Relationships Underlying MTI and ETS
To gain further insight into how differential MTI and ETS transcriptional signatures evolved, we looked for individual and combinatorial TF binding motifs in promoter elements, first using unsupervised clustering to identify DEGs that exhibit similar treatment-specific expression profiles and then screening these clusters for overrepresentation of known TF binding motifs. In addition to previously reported WRKY boxes in early-induced genes, we also found G-boxes enriched within clusters of suppressed genes and enrichment of specific motifs in gene clusters showing opposing expression profiles. For example, specific combinations of motifs (WRKY, tll, MBP1, and exd) engaged in fine-tuning the MTI response are recognized and targeted for suppression following effector delivery. It is well documented that some WRKYs can act as repressors of MTI depending upon the context of the response (Pandey and Somssich, 2009). Conversely, we found motifs (ABRE, MycN, and G-box) enriched in genes rapidly suppressed in response to MAMP recognition yet highly overrepresented in two effector-induced clusters. Collectively, these data strongly support the hypothesis that ETS deploys active transcriptional suppression at specific promoter configurations that are targets of MTI.
Our analysis further provided evidence for unique motifs in DC3000-responding gene clusters, identifying specific motifs in both early and late induced clusters and in clusters with genes rapidly suppressed by DC3000 challenge. Reinforcing a role for chromatin remodeling in disease progression, we identified both histone OCTAMER and NFY motifs in effector-modulated genes. Notably, NFY TFs are implicated in recruiting histone deacetylases to the promoters (Dolfini et al., 2012).
In parallel, we used the Wigwams algorithm (Polanski et al., 2014) to identify 31 gene modules with a strong statistical probability of being coregulated across the multiple time series. Consistent with the overrepresentation of MYB binding domains (Category F in Figure 4), we identified a module of 17 genes containing a MYB TF binding motif in their promoters, many of which have experimental evidence supporting a role in plant defense. ABA is central to DC3000's virulence strategy (de Torres-Zabala et al., 2007, 2009). Wigwams predicted a module of 26 genes whose promoters are enriched in bZIP and ABI3/VP1 TF binding domains (ABI3/VP1 TFs are regulators of ABA signaling). Wigwams also identified a module of suppressed genes overrepresented in photosynthetic components that contain bZIP, bHLH, and TCP binding motif in their promoters. Thus, these results highlight the utility of using coregulatory predictions to provide insight into how components of complex processes may be coordinately transcriptionally regulated.
Network Modeling Highlights Key Effector-Modulated Genes
Finally, we used CSI to generate a TF network model of the regulatory events controlling transcriptional reprogramming during infection and defense. We focused on transcriptional events up to 8 hpi, thus capturing the networks recruited during the crucial stages of infection and defense and before the first detectable increase in bacterial growth. The network was unexpectedly sparse, with only 609 interactions predicted between 432 TFs. This may reflect the evolved nature of effector activity, with effectors targeting multiple host proteins to activate parallel, relatively independent signaling pathways rather than a cascading transcriptional response. We identified a core MTI network not perturbed by effectors and interconnected modules with markedly contrasting responses to the presence of effectors. The model provides predictive information about the consequences of activated MTI and possible tactics pathogens use to cause disease. It predicts that a strategy for rapid transcriptional activation of pathways by effectors may be to suppress negative regulators of susceptibility targets, and it is likely these include MYB domain-containing TFs. It also predicts that the strong suppression of TFs involved in developmental processes, particularly floral and leaf development, by MAMPs may underlie the mechanism that regulates the trade-off between growth and defense. The modeling predicts three TFs, XND1, FBH3, and the bZIP AT2G40620 are at the apex of a transcriptional cascade regulating a number of the TFs that collaborate to suppress host defenses. A future challenge is to identify the specific TFs directly posttranslationally modified by effectors (Li et al., 2015) that initiate the transcriptional cascade including how effector induced chromatin changes remodel the nature of the genomic landscape to facilitate the transcriptional reprogramming by early effector induced TFs to permit disease progression.
METHODS
Sowing and Plant Growth Conditions
Arabidopsis thaliana seed (Col-4) were suspended in sterile 0.1% agarose and stratified for 3 d at 4°C in darkness. Seeds were sown using a disposable Pasteur pipette onto ∼7-cm square pots of sieved compost mix (Levington's F2 compost+sand [LEV206]:vermiculite [medium grade] mixed in a 6:1 ratio). Plants were grown in individual pots grown in trays under a controlled environment conditions comprising a 10-h photoperiod of 120 µmol m−2 s−1 at 23°C (day), 20°C (night), and relative humidity of 65%. Trays were repositioned every 3 to 4 d during the growth phase to negate position effects in the growth room. Two days prior to experimentation, plants were separated into individual pots and randomized. The challenged leaf, leaf 8, was identified and marked the day before and all plants for each treatment and time point were selected randomly from these to reduce any systematic error.
Pseudomonas syringae Growth and Maintenance
Maintenance and challenge of bacteria were as described (de Torres et al., 2006). Pseudomonas syringae pv tomato strain DC3000 carrying the empty broad host range vector pVSP61 (Innes et al., 1993) and the disarmed DC3000hrpA- mutant strain were grown on solidified King's B media (King et al., 1954) containing 50 μg mL−1 rifampicin and 25 μg mL−1 kanamycin. For inoculation, overnight cultures were grown at 28°C. Cells were harvested, washed, and resuspended in 10 mM MgCl2. Cell density was adjusted to OD600 0.15 (∼0.75 × 10⁸ cfu mL−1).
Pathogen Challenges
Treatments were begun 2.5 h after subjective dawn using 34-d-old plants by infiltration on the abaxial surface with a 1-mL needleless syringe containing bacteria (OD600 0.15; ∼0.75 × 10⁸ cfu mL−1) or 10 mM MgCl2 (mock). Leaf 8 on four individual plants was challenged per treatment (DC3000, DC3000hrpA-, or mock), and inoculated plants were left under a light bench in the laboratory (22°C). Samples were taken 0, 2, 3, 4, 6, 7, 8, 10, 11, 12, 14, and 17.5 hpi. Leaves were harvested by cutting at the petiole/leaf blade junction and were immediately snap-frozen and stored at −80°C until used for RNA preparation.
Bacterial Growth Measurements
All bacterial growth measurements were determined from a minimum of five independent replicates, each comprising three challenged leaves/plant. Significant growth differences between treatments were determined by Student's t test (P < 0.5), with error bars representing sd of the mean. All experiments were repeated at least three times.
Plant RNA Extraction
RNA was extracted according to de Torres et al. (2006) from a single leaf ground to a fine powder in a liquid nitrogen precooled mortar. The resultant RNA was cleaned up using a Qiagen RNeasy Plant mini kit according to the manufacturer's instructions and samples eluted in 30 μL of RNase-free water.
Microarray Hybridization
Cy3- and Cy5-labeled cDNA probes were generated from extracted RNA samples and hybridized to CATMA arrays (Allemeersch et al., 2005), and the arrays were processed as described (Breeze et al., 2011). Samples were labeled and hybridized to arrays according to a randomized loop design (as described in Breeze et al., 2011; Supplemental Figure 1), facilitating key sample comparisons, while minimizing the number of arrays required. Four biological and four technical replicates (including a dye swap) were used for each combination of three treatments and 13 time points; in total, 312 two-color arrays were used to generate the transcriptome data set.
Analysis of Microarray Data
Data quality checks and normalization were conducted using a locally adapted MAANOVA package workflow (Wu et al., 2003). Spatial and dye-bias artifacts were removed from the data through normalization using locally weighted scatterplot smoothing transformation.
Identification of DEGs
The following selection of methods was used to rigorously capture genes showing differential expression.
For Figure 1, the Bioconductor package LIMMA (Linear Models for Microarray Data) was applied to log2-transformed and normalized data sets (Smyth et al., 2005), applying multiple testing correction method “separate,” a P value cutoff of 0.05, and FDR correction using the Benjamini-Hochberg method. For Figure 2 onwards, DEGs were selected based upon the three methods described below, and probes above the point at which the false positive level exceeds 10% were included in the list of differentially expressed probes. The three lists of differentially expressed probes for each pairwise comparison of treatments were merged, duplicate probes removed, and the list ordered based on the combined rank from all methods. (1) MAANOVA (Wu et al., 2003) was used to fit an ANOVA model to the data, from which normalized relative probe expressions were obtained. Per-probe F tests were conducted and probes were ranked using the resulting F statistics. Probes above the point at which the percentage of false positives exceeded 10% were deemed differentially expressed.
A locally adapted GP2S method (Stegle et al., 2010) applied Gaussian processes to model the time series data to infer a likelihood of differential expression. The resulting per-probe Bayes factors were ranked from most to least likely to be differentially expressed.
Bayesian Analysis of Time Series data (Angelini et al., 2008) adopts a Bayesian approach to estimating expression profiles, identifying genes differentially expressed over time, and to rank them. Ratios of the treatments were used as input expression values.
Clustering by Gene Expression Profile
SplineCluster (Heard et al., 2006) was implemented to cluster DEGs that share similar expression profiles, with sweepmergers between allocations to allow movement of allocated genes between clusters to maximize the resulting log likelihood. Genes for the DC3000hrpA- versus mock comparison were clustered with a prior precision of 0.0001 on the basis of DC3000hrpA- expression. DEGs for the DC3000 versus mock comparison were clustered using DC3000 expression profiles with a prior precision of 0.0001. DEGs between DC3000hrpA- and DC3000 were clustered using a prior precision of 0.0005 using the difference in expression between the two infections (log2DC3000hrpA-log2DC3000). In each case, clustering was performed using a range of prior precision values and the most informative set of clusters selected balancing variation within each cluster versus variation between clusters. Sweepmergers for the clustering of all comparisons was set to 10,000 iterative reclassifications.
GO Enrichment
GO enrichments were assessed using BiNGO (Maere et al., 2005).
Time of First Differential Expression
An in-house implementation of the Gaussian process gradient analysis (Breeze et al., 2011) was used to identify the time at which genes first exhibit differential expression, using a delta expression profile for each gene obtained by subtracting expression levels in bacterial challenged leaves from mock expression.
Promoter Motif and Transcription Factor Family Analysis
MEME was used to search for any enriched motifs within 200 bp of the promoters of genes affected early by effectors. Publically available position-specific scoring matrices (PSSMs) were collected from the PLACE and JASPAR databases (Higo et al., 1999; Sandelin et al., 2004). To remove redundancy PSSMs were clustered by similarity, and a representative of each cluster was chosen for screening. Promoter regions corresponding to 200 bp upstream of the transcription start site were from Ensembl Plants database (release 50).
For any given PSSM and promoter, the sequence was scanned and a matrix similarity score computed (Kel et al., 2003) at each position on both strands. P values for each score were computed from a score distribution obtained by applying the PSSM to randomly generated sequences. A binomial test for the occurrence of k sites with observed n values within a sequence of length 200 bp was performed on the top k nonoverlapping hits. The parameter k was optimized within the range 1 to 5 for minimum binomial P value to allow detection of binding sites without a fixed threshold per binding site. To determine the presence or absence of a PSSM in a promoter, the top 1000 promoters, sorted by P value, were selected. For each PSSM, its frequency in promoters of each cluster was compared with its occurrence in all promoters in the genome. Clusters were downsampled (R Stats “sample” function) to 100 genes to allow better comparison of hypergeometric P values across differently sized clusters. Motif enrichment was calculated using the hypergeometric distribution (phyper function in the R stats package). P value ≤1e-4 were considered significant to allow for multiple testing.
Wigwams Module Mining
Wigwams (Polanski et al., 2014) was used to identify groups of genes statistically significantly coexpressed across two or more of the three time course data sets. The gene list was filtered to only include genes deemed differentially expressed in at least two of the three performed pairwise comparisons. The gene expression profiles were not standardized in order to capture the scope of the dynamics in the modeling.
Network Modeling
A joint network model for all three treatments was inferred using CSI (Penfold and Wild, 2011; Penfold et al., 2015). A preselection of genes limited the ones used in modeling to TFs differentially expressed in at least two of the three performed pairwise comparisons and showcasing a TOFDE of no later than 8 h in at least one of the performed TOFDE analyses. A pathogen growth profile was also present in the data as a putative network node, with the values for the missing points obtained with a spline fit. The Gaussian process hyperparameter prior was left unchanged and the maximum indegree was set to 2. The marginal probability of each possible regulatory connection was then calculated to generate a marginal adjacency matrix; a threshold probability of 0.1 was used to generate final networks. Connections not joined with the resulting main network structure were trimmed. For the purpose of Figure 8 groupings, the area between the expression profile curves for DC3000 and DC3000hrpA- was computed for each of the genes and the network was divided into eight subnetwork groups linearly spaced between the observed minimum and maximum.
Accession Numbers
Microarray data were deposited in the Gene Expression Omnibus under accession number GSE56094. The gene identifiers corresponding to gene names mentioned in the text are given in Supplemental Table 2.
Supplemental Data
Supplemental Figure 1. Experimental design for the microarray hybridizations.
Supplemental Figure 2. Differentially expressed probes and genes.
Supplemental Figure 3. Growth curve and GO term enrichment for DC3000 versus mock inoculation.
Supplemental Figure 4. Venn diagram of DEG overlap between pairs of treatments.
Supplemental Figure 5. Transient expression of luciferase in N. benthamiana under the RAB GTPase homolog At3g09910 promoter.
Supplemental Figure 6. Two examples of downregulated genes in the first wave of effector action.
Supplemental Table 1. Validation of CATMA microarray infection data.
Supplemental Table 2. Arabidopsis gene identifiers for gene names mentioned in the text.
Supplemental Data Set 1. LIMMA 3D trend data for Figure 1.
Supplemental Data Set 2. DEGs from time series algorithms.
Supplemental Data Set 3. Go term enrichment in clusters of DEGs.
Supplemental Data Set 4. Venn diagram information for Figure 4.
Supplemental Data Set 5. Gene list of ubiquitin and histone-associated genes up- and downregulated, respectively, by effector activity.
Supplemental Data Set 6. Genes whose expression is effector driven between 6 and 8 hpi.
Supplemental Data Set 7. Gene membership of clusters.
Supplemental Data Set 8. Motif enrichment in gene clusters.
Supplemental Data Set 9. Wigwams module membership.
Supplemental Data Set 10. Wigwams module motif enrichment.
Supplemental Data Set 11. Network model.
Supplemental Movie 1. Movie of network model dynamics.
Acknowledgments
This work was supported by the BBRSC-funded grant Plant Response to Environmental Stress Arabidopsis Systems Approaches to Biological Research (SABR) program grants BB/F005806/1 to J.B., K.D., V.B.-W., D.R., D.L.W., S.O., C.H., J.P., C.A.P., D.J.J., J.M., B.F., L. Bowden, P.B., and L. Baxter and BB/F005903/1 to W.T., M.d.T.-Z., M.G., and N.S., by the Leverhulme Trust to M.G. and S.K., and by Engineering and Physical Sciences Research Council (EPSRC) Grant EP/I036575/1 to C.A.P. and D.L.W. S.J. was funded by an Exeter Systems Biology studentship. R.H. was funded by the EPSRC/BBSRC-funded Warwick Systems Biology Doctoral Training Centre. L.A.L. was funded by a BBSRC SABR studentship.
Glossary
- MAMP
microbial-associated molecular pattern
- PRR
pattern recognition receptor
- MTI
MAMP-triggered immunity
- ETI
effector-triggered immunity
- ETS
effector-triggered susceptibility
- T3SS
type III secretion system
- cfu
colony-forming unit
- hpi
hours postinfiltration
- DEG
differentially expressed gene
- FDR
false discovery rate
- GP2S
Gaussian Process two-sample test modeling time series
- MAANOVA
Microarray Analysis of Variance
- GO
Gene Ontology
- SA
salicylic acid
- JA
jasmonic acid
- TF
transcription factor
- PDI
protein disulfide isomerase
- ABA
abscisic acid
- CSI
Causal Structure Identification
- PSSM
position-specific scoring matrice
AUTHOR CONTRIBUTIONS
L.A.L., W.T., M.d.T.-Z., G.L., and M.G. carried out experiments. W.T., M.d.T.-Z., L.A.L., K.P., S.J., L. Bowden, J.M., C.A.P., D.J.J., C.H., L. Baxter, J.P., A.M., J.S., R.H., D.R., D.L.W., S.O., V.B.-W., N.S., K.D., J.B., and M.G. were responsible for data processing, analysis, and tool development. L.A.L., K.P., S.J., A.M., L. Baxter, D.L.W., D.R., J.B., S.O., V.B.-W., M.G., and K.D. all had input into the design of the experiments and analysis. L.A.L., K.D., and M.G. wrote the manuscript with contributions from all authors.
References
Author notes
These authors contributed equally to this work.
Current address: The Roslin Institute, Edinburgh EH25 9RG, UK.
Current address: Science and Advice for Scottish Agriculture, Edinburgh EH12 9FJ, UK.
Current address: Department of Plant Biology, University of Minnesota, St. Paul, MN 55108.
Current address: Applied Statistics, Rothamsted Research, Harpenden AL5 2JQ, UK.
Current address: Department of Plant-Microbe Interactions, Utrecht University, 3584 CH Utrecht, The Netherlands.
Address correspondence to [email protected].
The author responsible for distribution of materials integral to the findings presented in this article in accordance with the policy described in the Instructions for Authors (www.plantcell.org) is: Murray Grant ([email protected]).

Articles can be viewed online without a subscription.
