


Abstract
We surveyed the iron nutrition-responsive transcriptome of Chlamydomonas reinhardtii using RNA-Seq methodology. Presumed primary targets were identified in comparisons between visually asymptomatic iron-deficient versus iron-replete cells. This includes the known components of high-affinity iron uptake as well as candidates for distributive iron transport in C. reinhardtii. Comparison of growth-inhibited iron-limited versus iron-replete cells revealed changes in the expression of genes in chloroplastic oxidative stress response pathways, among hundreds of other genes. The output from the transcriptome was validated at multiple levels: by quantitative RT-PCR for assessing the data analysis pipeline, by quantitative proteomics for assessing the impact of changes in RNA abundance on the proteome, and by cross-species comparison for identifying conserved or universal response pathways. In addition, we assessed the functional importance of three target genes, VITAMIN C 2 (VTC2), MONODEHYDROASCORBATE REDUCTASE 1 (MDAR1), and CONSERVED IN THE GREEN LINEAGE AND DIATOMS 27 (CGLD27), by biochemistry or reverse genetics. VTC2 and MDAR1, which are key enzymes in de novo ascorbate synthesis and ascorbate recycling, respectively, are likely responsible for the 10-fold increase in ascorbate content of iron-limited cells. CGLD27/At5g67370 is a highly conserved, presumed chloroplast-localized pioneer protein and is important for growth of Arabidopsis thaliana in low iron.
INTRODUCTION
Iron is an essential nutrient for virtually all life forms because of its broad function as a catalyst, particularly of redox reactions and reactions involving O2 chemistry. Iron is found in two stable oxidation states, Fe(II) or Fe(III), associated directly with ligands from amino acid side chains in proteins as in mononuclear iron in iron superoxide dismutase or di-iron enzymes like acyl-acyl carrier protein desaturases and methane mono-oxygenases or assembled into organic and inorganic cofactors like hemes or iron-sulfur centers. The redox potentials and reactivities of iron proteins are determined by the number and type of coordinating ligands.
Despite its abundance on earth, iron has limited bioavailability because of its relative insolubility in the Fe(III) oxidation state, which is the prevalent form in most aerobic environments (Guerinot and Yi, 1994; Staiger, 2002). Accordingly, iron metabolism uses transport systems involving chelation and redox chemistry (often multiple sequential steps) followed by biosynthesis of heme, inorganic Fe/S, or other clusters (Theil, 2004; Lill and Mühlenhoff, 2008; Philpott and Protchenko, 2008; Kosman, 2010). In eukaryotic cells, there is the additional complication of subcellular compartmentation and delivery of iron or assembled cofactors across membranes, and this is exacerbated in plants where the plastid is yet another compartment (Jeong and Guerinot, 2009). In multicellular organisms, transport from sites of assimilation (roots or gastrointestinal tract) to sites of utilization (leaves, muscle, or reticulocytes) involves redox chemistry and chelation as well (Hellman and Gitlin, 2002; De Domenico et al., 2008; Morrissey and Guerinot, 2009; Schultz et al., 2010).
Nevertheless, despite the occurrence of sophisticated acquisition mechanisms, organisms can be chronically undernourished for iron, as evidenced by high prevalence of anemia worldwide and by iron limitation of primary productivity (Morel et al., 1991; Hell and Stephan, 2003; Benoist et al., 2008; Behrenfeld et al., 2009). We and others have used Chlamydomonas reinhardtii as a reference organism for understanding the impact of poor iron nutrition on bioenergetic pathways in plants and acclimation mechanisms (Merchant et al., 2006; Clemens et al., 2009).
C. reinhardtii, a chlorophyte alga, is usually grown in the laboratory photoautotrophically (in the presence of light and CO2) in defined medium containing the required mineral nutrients or photoheterotrophically (in the presence of light and acetate) where the availability of a reduced carbon source precludes a requirement for photosynthesis (Harris, 2009). Interestingly, some molecular responses to iron deficiency are connected to metabolic demand. Specifically, the iron-rich photosynthetic apparatus is dispensable in low iron, acetate-containing medium but is maintained in iron-poor, CO2-grown cells (Naumann et al., 2007; Terauchi et al., 2010). The loss of photosynthetic complexes occurs by programmed degradation of the chlorophyll protein complexes, starting with disconnection of the photosystem I (PSI) antenna (light-harvesting complex I) and followed by the loss of PSI, the light-harvesting complex I antenna proteins, and photosystem II (La Fontaine et al., 2002; Moseley et al., 2002; Naumann et al., 2005). The abundances of the respiratory complexes are unchanged in acetate-grown cells. Other responses, such as upregulation of iron assimilation, are less dependent on the mode of growth, and we used the expression pattern of iron-uptake components as an indicator of iron nutritional status (La Fontaine et al., 2002).
Specifically, we defined three operational stages of iron nutrition: the iron-replete situation, corresponding to ∼20 μM iron in standard C. reinhardtii medium; the iron-deficient situation, corresponding to 1 to 3 μM iron, where classical iron deficiency chlorosis is not evident, but the expression of FOX1 (a sentinel gene for poor iron nutrition, encoding a multicopper oxidase involved in high-affinity transport) is dramatically upregulated; and the iron-limited situation, corresponding to ≤0.5 μM iron, where the growth of cells is inhibited because of insufficient nutritional supply of iron (Merchant et al., 2006). Reporter gene assays established that the change in expression of genes FEA1, FOX1, and FTR1, encoding various iron assimilation components, occurs at the level of transcription, indicating that comparative transcriptomics might reveal new components of the nutritional iron regulon (Allen et al., 2007a; Deng and Eriksson, 2007; Fei et al., 2009, 2010). To distinguish primary responses, we compared iron-sufficient to asymptomatic iron-deficient cells under photoautotrophic as well as photoheterotrophic conditions, and to distinguish the impact of poor iron nutrition on various stress response pathways, we included iron-limited cells. A parallel comparison of the proteome indicated excellent positive correlation between changes in RNA and protein abundance for a subset of differentially expressed genes, suggesting that these are mechanistically important for acclimation, and negative correlation for RNAs encoding iron binding proteins, suggesting that these changes represent a feedback response to the loss of function of the corresponding proteins.
To identify responses that might be specific for chloroplast biology, we surveyed previously published microarray data for iron deficiency responses in two other evolutionarily distant organisms in the plant lineage: Arabidopsis thaliana and rice (Oryza sativa). A comparison revealed a set of responses shared with C. reinhardtii, including a few plastid proteins. Functional tests of two genes, MONODEHYDROASCORBATE REDUCTASE 1 (MDAR1) and CONSERVED IN THE GREEN LINEAGE AND DIATOMS 27 (CGLD27), by biochemistry and reverse genetics indicated their relevance for growth in iron-poor conditions.
RESULTS
The Iron Assimilation Pathway Is a Sentinel of Cellular Iron Status
Cells of wild-type strain 2137 (CC-4532) were grown under illumination in batch culture in standard Tris-phosphate medium with or without acetate supplementation and with different amounts of iron supplementation (Figure 1). As noted previously, when acetate is available for photosynthesis-independent growth, the cells sacrifice the photosynthetic apparatus, evident by a nearly 75% decrease in chlorophyll content and reduced F v/F m (Moseley et al., 2002; Terauchi et al., 2010). In the absence of acetate, the loss of chlorophyll is less dramatic and photochemical activity is maintained. To distinguish pathways of acclimation of iron deficiency in the context of iron utilization for bioenergetic membranes in respiration versus photosynthesis, we sought to describe the C. reinhardtii iron deficiency transcriptome in both the presence and absence of acetate in the growth medium.
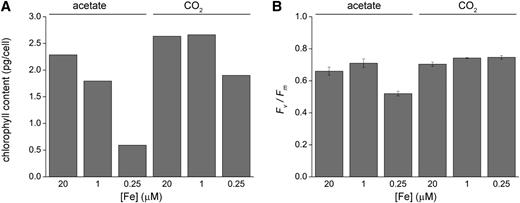
Iron Limitation Has a Major Effect on Photosynthesis in Photoheterotrophically Grown C. reinhardtii Cells.
(A) Total chlorophyll content of photoheterotrophic versus photoautotrophic cells. Cells were grown in the presence of acetate or CO2 in various concentrations of iron (replete, deficient, and limited), and chlorophyll abundance was measured as described in Methods.
(B) Maximum quantum efficiency of photosystem II in photoheterotrophic versus photoautotrophic cells in response to iron nutrition. C. reinhardtii cells were grown in iron-replete, iron-limited, and iron-deficient media, and chlorophyll fluorescence was analyzed in liquid cultures as described in Methods. Error bars represent the sd from three biological replicates.
In previous work, we found that cells in fully iron-replete medium consume 3 μM iron (out of 20 μM) by the time they reach stationary phase (>107 cells mL−1), corresponding to luxury consumption (Page et al., 2012). Nevertheless, when they are iron-limited, they can manage with much less through the activation of iron-sparing responses, corresponding to economical consumption (Merchant and Helmann, 2012). Therefore, in medium containing low micromolar amounts of iron, the cells transition from luxury uptake and utilization to an iron economy mode. We used the expression of genes in the iron assimilation pathway (La Fontaine et al., 2002; Allen et al., 2007a) as sentinels or markers of iron status as cells inoculated into medium containing various amounts of iron (corresponding to limited, deficient, and replete) progressed through lag and log phase to stationary phase (Figure 2).
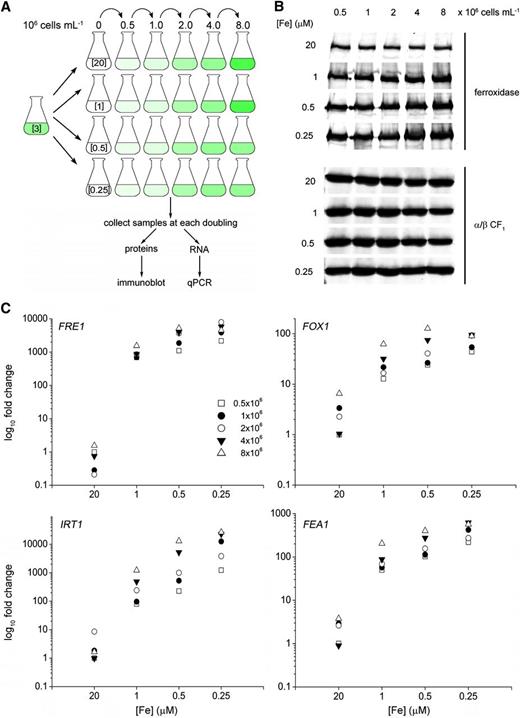
Iron Nutrition–Dependent Expression of Genes Encoding Components of Iron Assimilation Pathways.
(A) Schematic representation of the experiment. Briefly, C. reinhardtii cells grown photoheterotrophically in iron-replete conditions (3 μM iron) to a cell density of 2 × 10⁶ cells mL−1 were used to inoculate cultures containing different iron concentrations (representing replete [20], deficient [1], and limited [0.25] and [0.5] with concentrations in μM) to a cell density of 104 cells mL−1. Samples were collected for biochemical analyses at the indicated cell densities corresponding to early, mid, late logarithmic, and stationary phases. qPCR, quantitative PCR.
(B) Ferroxidase abundance in response to iron nutrition and cell density. Twenty micrograms of total membrane protein was separated by denaturing PAGE and transferred to a membrane, which was probed with antibodies against ferroxidase and CF1.
(C) Expression of marker genes for iron nutritional status is increased at early stages of photoheterotrophic growth. Expression of sentinel genes was analyzed by quantitative real-time PCR. Fold change was calculated according to the 2–ΔΔCT (cycle threshold) method (Livak and Schmittgen, 2001).
The FOX1, FRE1, IRT1, and FEA1 genes are expressed at very low levels in replete medium (20 μM). In medium containing 1 μM iron, these genes are more highly expressed. For FOX1, FRE1, and FEA1, there is a marginal increase in RNA abundance as iron content is reduced below 1 μM, and this pattern is recapitulated in the protein profile for the ferroxidase (Figure 2B). As continued growth and division further depletes iron from the medium, expression increases further (cf. each set of points and see particularly the IRT1 gene). At iron concentrations that limit growth (≤0.5 μM iron), the sentinel genes are highly expressed shortly after inoculation, even at low cell densities; the responses at 0.25 μM are stronger than at 0.5 μM. These results reinforce the importance of intracellular iron content and quota. Therefore, we chose 20, 1, and 0.25 μM iron to generate replete, deficient, and limited cells, respectively. Because of the effect of cell density on iron status and, hence, gene expression, we sampled each culture at the same cell density (of 3 × 10⁶ cells mL−1) so that externally supplied iron is a proxy for intracellular iron availability (Figure 3).
Identification of Iron Nutrition–Responsive Genes.
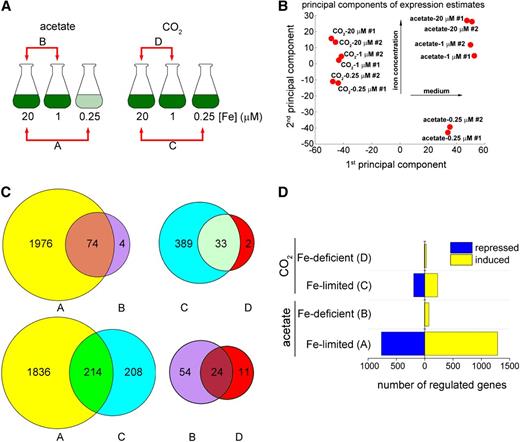
C. reinhardtii cells were grown photoheterotrophically (acetate) or photoautotrophically (CO2) under iron-replete (20 μM iron), iron-deficient (1 μM iron), and iron-limited (0.25 μM iron) conditions. Cells were collected at a density of 3 × 10⁶ cells mL−1.
(A) Illustration of growth conditions and of comparisons A, B, C, and D. The pale-green color depicted for iron-limited conditions indicates that the cells are chlorotic.
(B) Principal component analysis of the transcriptome groups the experiments based first on carbon source (first principal component) and then on iron levels (second principal component).
(C) The Venn diagrams show the differentially expressed genes identified (fold change ≥ 2, FDR <5%). The numbers in the intersections represent the genes revealed in two comparisons.
(D) Induced (yellow) or repressed (blue) genes under photoheterotrophic (acetate) and photoautotrophic (CO2) iron-deficient and iron-limited conditions. The correspondence between each set of bars and the relevant comparison in (B) are indicated in parentheses.
Total RNA was analyzed by sequencing cDNAs on the Illumina GAIIx platform. Between 0.7 and 1 Gb of 35-nucleotide sequences (and 2 to 3 Gb of 100-nucleotide sequences) were obtained from each sample and aligned to the C. reinhardtii draft genome (version 4, Augustus 10.2 annotation) (Stanke et al., 2008; http://www.phytozome.net/chlamy) as described previously (Urzica et al., 2012). Approximately 90% of all reads align to the genome, and from those, 70 to 75% aligned uniquely to the Augustus 10.2 gene models (see Supplemental Data Set 1 online, first sheet). Note that the Augustus 10.2 annotation was compiled with support from ∼2 Gb of 454 reads derived from RNA isolated from various conditions, including iron deficiency (http://genomes.mcdb.ucla.edu/Cre454/). Therefore, this set of gene models is likely to include most of the genes in the iron regulon. Expression estimates for each gene model in each sample were calculated as described previously (Urzica et al., 2012) and are provided in units of reads per kilobase of exons in each model per million of aligned reads (RPKMs) (see Supplemental Data Set 1 online, second sheet) (Mortazavi et al., 2008).
Two Principal Components
We rationalized that a comparison of replete (20 μM) to asymptomatic (1 μM) iron-deficient cells would reveal direct responses to reduced iron availability, whereas comparisons of replete and deficient to iron-limited conditions (0.25 μM) would reveal second-stage or secondary mechanisms involved in coping with sustained or prolonged iron limitation (Figure 3A; see Supplemental Data Sets 2 and 3 online, three sheets each). Comparisons of differentially accumulating RNAs in photoautotrophic versus photoheterotrophic conditions should illuminate the impact of photosynthesis switching from an essential to a dispensable pathway (see Supplemental Figure 1 and Supplemental Data Set 4 online, 10 sheets).
Principal component analysis of the data from all experiments indicates that the first principal component groups the data by growth medium, revealing, not surprisingly, that carbon source is a much more important determinant of genome-wide pattern of expression relative to iron nutrition, which is the second component by which the data are grouped (Figure 3B). The analysis shows a much tighter distribution of the iron-limited data with the iron-deficient and iron-replete from photoautotrophically grown cells, consistent with less dramatic phenotypic differences (Figure 1), whereas the data from iron-limited photoheterotrophic cells are more distinct compared with the data from iron-deficient and iron-replete conditions, again consistent with the strong phenotypes (Figure 1; Terauchi et al., 2010).
For the functional classification of iron deficiency responses, we chose genes whose expression level is higher than the median level of expression (based on RPKMs) and that are at least twofold differentially expressed with a false discovery rate (FDR) <5%. In acetate-grown cells (photoheterotrophic), we found that 78 and 2050 genes were differentially expressed in iron-deficient and iron-limited cells, respectively (Figure 3C, comparing set A with B). Out of the 2050 genes regulated under iron limitation, 1286 showed greater mRNA abundance (referred to subsequently as induced, regardless of the underlying mechanism), whereas 764 genes had reduced transcript abundance (referred to subsequently as repressed). Under iron deficiency, from the total of 78 differentially expressed genes, most (74) were upregulated (Figure 3D). Most of the differentially expressed genes in the iron-limited photoheterotrophic cells (1976 out of 2050) were unique to the limitation condition, while only a handful of differentially regulated genes (four of 78) were unique to the deficiency situation (Figures 3C and 3D). The majority of the differentially regulated genes in iron deficiency then were differentially regulated under both conditions (1 and 0.25 µM iron), consistent with the premise in the experimental design, and suggesting that these 74 genes are primary targets of nutritional iron signaling in photoheterotrophic conditions (Figure 3C, intersection of comparison A-B; see Supplemental Data Set 2 online).
Many fewer genes were affected by iron nutrition under photoautotrophic conditions (0.04% CO2): 35 and 422 genes differentially expressed (greater than or equal to twofold change, FDR < 5%) in iron-deficient and iron-limited conditions, respectively (Figure 3C, comparison C-D; see Supplemental Data Set 3 online). As for the photoheterotrophically grown cells, most of the changes that occurred in iron deficiency were observed also in the iron-limited data set (33 out of 35). For 45 genes, regulation was verified by real-time RT-PCR on an independent set of RNA samples (see Supplemental Figure 2 online).
Functional Classification Emphasizes Transporters and Stress Responses
The set of 78 genes in comparison B (Figure 3A) representing the primary iron deficiency response includes those encoding assimilatory iron transport components (FTR1, FEAs, IRTs, and ferroxidase) and candidates (NRAMP4, Cre02.g099500, which is an ortholog of yeast Ccc1p/Arabidopsis VIT1, and Cre16.g687000, a ferroportin-like molecule) for intracellular/distributive iron transport, together constituting 17% of the iron deficiency regulon (13 of 78 genes) (Figures 4A and 4B, left panel, Table 1). Another notable set (25%) is the category of redox and stress proteins, indicative of a marked effect of low iron nutrition on cellular redox chemistry. Several of the genes in this category encode iron binding proteins like ferredoxins 3/6 and chloroplast DnaJ-domain proteins CDJ3/5, whose RNAs are increased in iron-deficient cells (Terauchi et al., 2009; Dorn et al., 2010; Table 2). By contrast, mRNAs for ferredoxin 2 are reduced in abundance. Since ferredoxin 2 is required for nitrate assimilation, its decrease may be part of an iron-sparing response: the protein would be less necessary in ammonium-grown cells (Terauchi et al., 2009).
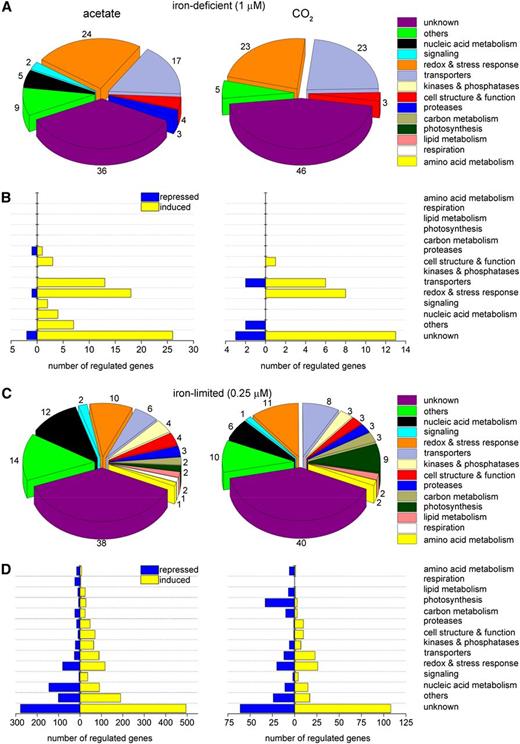
Similar Pathways Are Affected by Iron Nutrition in CO2- versus Acetate-Grown Cells.
The deduced protein sequences from comparisons B (78 genes) ([A] and [B], left panels), D (35 genes) ([A] and [B], right panels), A (2050 genes) ([C] and [D], left panels), and C (422 genes) ([C] and [D], right panels) were analyzed at the Pfam site (E-value 10−4) and/or by BLASTp analysis at NCBI or Phytozome. The protein domains were grouped according to their function in 14 categories: unknown, other, nucleic acid metabolism, signaling, redox and stress response, transporters, kinases and phosphatases, cell structure and function, proteases, carbon metabolism, photosynthesis, lipid metabolism, respiration, and amino acid metabolism. Unknowns refer to protein sequences for which a domain could not be identified or if the domain was identified as having an unknown function (DUF). Domains that could not be classified in any specific category were grouped into the “others” category. The numbers outside pie charts depict how much (in percentage) each functional category is represented in the total numbers of differentially expressed transcripts from each individual set of data.
Effect of Low Iron Nutrition on Abundance of RNAs Encoding Components of Iron Assimilation and Metabolism and Antioxidant and Signaling Pathways in Photoheterotrophic Cells
| RPKM | Fold Change | ||||||
|---|---|---|---|---|---|---|---|
| Process | Genea | Defline | 20b | 1b | 0.25b | 1/20 | 0.25/20 |
| Fe Homeostasis | FRE1 | Ferric-chelate reductase/ oxidoreductase | 0.18 | 895 | 3140 | 4972 | 17444 |
| IRT1 | Iron nutrition–responsive ZIP family transporter | nd | 1.2 | 204 | 14 | 2048 | |
| FEA2 | Iron-assimilating protein 2 | 6.9 | 378 | 2762 | 55 | 400 | |
| NRAMP4 | Natural resistance-associated macrophage domain protein | 4.9 | 46 | 189 | 9.4 | 39 | |
| FTR1 | Iron permease | 38 | 324 | 1264 | 8.5 | 33 | |
| IRT2 | Iron nutrition–responsive ZIP family transporter | 3.5 | 30 | 60 | 8.6 | 17 | |
| TEF22 | DOMON domain; cytochrome b 561/ferric reductase domain | 51 | 384 | 841 | 7.5 | 16 | |
| FEA1 | Iron-assimilating protein 1 | 248 | 2417 | 3629 | 9.7 | 15 | |
| Cre05.g241400 | Putative ferric reductase-like transmembrane component | 13 | 76 | 175 | 5.8 | 13 | |
| Cre02.g107550 | Similar to yeast CCC1 and plant VIT1 | 11 | 25 | 95 | 2.3 | 8.6 | |
| FOX1 | Multicopper ferroxidase | 178 | 795 | 1386 | 4.5 | 7.8 | |
| Cre16.g687000 | Similar to ferroportin | 6.7 | 22 | 51 | 3.3 | 7.6 | |
| Cre02.g099500 | Similar to yeast CCC1 and plant VIT1 | 22 | 32 | 56 | 1.5 | 2.5 | |
| Antioxidants | FER2 | Ferritin subunit | 0.05 | 7.1 | 65 | 142 | 1300 |
| MSD3 | Superoxide dismutase (Mn) | 1.0 | 43 | 546 | 43 | 546 | |
| PCS1 | Phytochelatin synthase | 3.8 | 26 | 125 | 6.8 | 33 | |
| MDAR1 | Monodehydroascorbate reductase | 45 | 214 | 1255 | 4.8 | 28 | |
| GRX6 | Glutaredoxin, CGFS type | 43 | 62 | 496 | 1.4 | 12 | |
| VTC2 | GDP-galactose:glucose-1-phosphate guanyltransferase | 19 | 47 | 195 | 2.5 | 10 | |
| FER1 | Ferritin subunit | 276 | 918 | 1694 | 3.3 | 6.1 | |
| GPX3 | Glutathione peroxidase | 2.5 | 3.8 | 10 | 1.5 | 4.0 | |
| TRX16 | Putative thioredoxin | 6.7 | 9.7 | 35 | 1.4 | 5.2 | |
| GSH1 | γ-Glutamylcysteine synthetase | 39 | 72 | 212 | 1.8 | 5.4 | |
| Cre01.g031500 | Putative ascorbate oxidase | 4.2 | 6.3 | 15 | 1.5 | 3.6 | |
| PRX6 | Thioredoxin dependent peroxidase | 12 | 8.7 | 45 | 0.7 | 3.8 | |
| Cre11.g471150 | Peroxiredoxin; alkyl hydroperoxide reductase | 6.4 | 8.7 | 21 | 1.4 | 3.3 | |
| TRX15 | Thioredoxin-like protein | 20 | 18 | 66 | 0.9 | 3.3 | |
| LIPA2 | Lipoic acid synthetase | 12 | 13 | 31 | 1.1 | 2.6 | |
| GST10 | Glutathione S-transferase | 68 | 90 | 175 | 1.3 | 2.6 | |
| TRX17 | Thioredoxin-like protein | 20 | 18 | 46 | 0.9 | 2.3 | |
| CDSP32 | Plastidic thioredoxin-like protein | 88 | 88 | 43 | 1.0 | 0.5 | |
| CAT1 | Catalase/peroxidase | 204 | 183 | 96 | 0.9 | 0.5 | |
| TRX11 | Putative plastidic thioredoxin-like protein | 24 | 19 | 8.6 | 0.8 | 0.4 | |
| GPX5 | Glutathione peroxidase | 177 | 139 | 59 | 0.8 | 0.3 | |
| CITRX | Thioredoxin-related protein CITRX | 128 | 127 | 39 | 1.0 | 0.3 | |
| CAT2 | Catalase/peroxidase | 19 | 23 | 5.6 | 1.2 | 0.3 | |
| LIPB | Lipoate protein ligase | 4.0 | 1.2 | 1.0 | 0.3 | 0.3 | |
| GST6 | Predicted protein with glutathione S-transferase domain | 26 | 25 | 3.2 | 1.0 | 0.1 | |
| Transcriptional Regulators | MYB4 | Myb-like homeodomain transcription factor | 0.24 | 0.38 | 5.6 | 1.6 | 23 |
| NAT19 | N-acetyltransferase | 0.43 | 1.4 | 8.5 | 3.3 | 20 | |
| MYB16 | Circadian clock–associated SWI/SNF complex | 1.8 | 2.0 | 27 | 1.1 | 15 | |
| Cre03.g172750 | MYND finger | 1.4 | 3.6 | 20 | 2.6 | 14 | |
| HMG6 | High mobility group protein | 1.3 | 1.9 | 16 | 1.5 | 12 | |
| NAT30 | N-acetyltransferase | 4.4 | 9.9 | 51 | 2.3 | 12 | |
| Cre05.g248550 | Hemerythrin HHE cation binding domain; CHY zinc finger | 3.6 | 8.2 | 35 | 2.3 | 9.7 | |
| MYB3 | Myb-like transcription factor | 4.7 | 5.0 | 28 | 1.1 | 6.0 | |
| Cre07.g335150 | Squamosa promoter binding protein | 4.4 | 5.6 | 22 | 1.3 | 5.0 | |
| NAT4 | N-acetyltransferase | 3.7 | 3.0 | 17 | 0.8 | 4.6 | |
| Cre24.g770450 | Basic helix-loop-helix family protein | 32 | 53 | 109 | 1.7 | 3.4 | |
Genes without functional annotation are indicated with the IDs corresponding to the version 4 assembly (Augustus 10.2). nd, not detected at the sequencing level used in this work. In such cases, fold changes were computed after imputation of missing values and should be understood as a lower bound of the actual value.
Genes are sorted with respect to the fold changes in iron-limited conditions (0.25/20).
[Fe] in μM.
| RPKM | Fold Change | ||||||
|---|---|---|---|---|---|---|---|
| Process | Genea | Defline | 20b | 1b | 0.25b | 1/20 | 0.25/20 |
| Fe Homeostasis | FRE1 | Ferric-chelate reductase/ oxidoreductase | 0.18 | 895 | 3140 | 4972 | 17444 |
| IRT1 | Iron nutrition–responsive ZIP family transporter | nd | 1.2 | 204 | 14 | 2048 | |
| FEA2 | Iron-assimilating protein 2 | 6.9 | 378 | 2762 | 55 | 400 | |
| NRAMP4 | Natural resistance-associated macrophage domain protein | 4.9 | 46 | 189 | 9.4 | 39 | |
| FTR1 | Iron permease | 38 | 324 | 1264 | 8.5 | 33 | |
| IRT2 | Iron nutrition–responsive ZIP family transporter | 3.5 | 30 | 60 | 8.6 | 17 | |
| TEF22 | DOMON domain; cytochrome b 561/ferric reductase domain | 51 | 384 | 841 | 7.5 | 16 | |
| FEA1 | Iron-assimilating protein 1 | 248 | 2417 | 3629 | 9.7 | 15 | |
| Cre05.g241400 | Putative ferric reductase-like transmembrane component | 13 | 76 | 175 | 5.8 | 13 | |
| Cre02.g107550 | Similar to yeast CCC1 and plant VIT1 | 11 | 25 | 95 | 2.3 | 8.6 | |
| FOX1 | Multicopper ferroxidase | 178 | 795 | 1386 | 4.5 | 7.8 | |
| Cre16.g687000 | Similar to ferroportin | 6.7 | 22 | 51 | 3.3 | 7.6 | |
| Cre02.g099500 | Similar to yeast CCC1 and plant VIT1 | 22 | 32 | 56 | 1.5 | 2.5 | |
| Antioxidants | FER2 | Ferritin subunit | 0.05 | 7.1 | 65 | 142 | 1300 |
| MSD3 | Superoxide dismutase (Mn) | 1.0 | 43 | 546 | 43 | 546 | |
| PCS1 | Phytochelatin synthase | 3.8 | 26 | 125 | 6.8 | 33 | |
| MDAR1 | Monodehydroascorbate reductase | 45 | 214 | 1255 | 4.8 | 28 | |
| GRX6 | Glutaredoxin, CGFS type | 43 | 62 | 496 | 1.4 | 12 | |
| VTC2 | GDP-galactose:glucose-1-phosphate guanyltransferase | 19 | 47 | 195 | 2.5 | 10 | |
| FER1 | Ferritin subunit | 276 | 918 | 1694 | 3.3 | 6.1 | |
| GPX3 | Glutathione peroxidase | 2.5 | 3.8 | 10 | 1.5 | 4.0 | |
| TRX16 | Putative thioredoxin | 6.7 | 9.7 | 35 | 1.4 | 5.2 | |
| GSH1 | γ-Glutamylcysteine synthetase | 39 | 72 | 212 | 1.8 | 5.4 | |
| Cre01.g031500 | Putative ascorbate oxidase | 4.2 | 6.3 | 15 | 1.5 | 3.6 | |
| PRX6 | Thioredoxin dependent peroxidase | 12 | 8.7 | 45 | 0.7 | 3.8 | |
| Cre11.g471150 | Peroxiredoxin; alkyl hydroperoxide reductase | 6.4 | 8.7 | 21 | 1.4 | 3.3 | |
| TRX15 | Thioredoxin-like protein | 20 | 18 | 66 | 0.9 | 3.3 | |
| LIPA2 | Lipoic acid synthetase | 12 | 13 | 31 | 1.1 | 2.6 | |
| GST10 | Glutathione S-transferase | 68 | 90 | 175 | 1.3 | 2.6 | |
| TRX17 | Thioredoxin-like protein | 20 | 18 | 46 | 0.9 | 2.3 | |
| CDSP32 | Plastidic thioredoxin-like protein | 88 | 88 | 43 | 1.0 | 0.5 | |
| CAT1 | Catalase/peroxidase | 204 | 183 | 96 | 0.9 | 0.5 | |
| TRX11 | Putative plastidic thioredoxin-like protein | 24 | 19 | 8.6 | 0.8 | 0.4 | |
| GPX5 | Glutathione peroxidase | 177 | 139 | 59 | 0.8 | 0.3 | |
| CITRX | Thioredoxin-related protein CITRX | 128 | 127 | 39 | 1.0 | 0.3 | |
| CAT2 | Catalase/peroxidase | 19 | 23 | 5.6 | 1.2 | 0.3 | |
| LIPB | Lipoate protein ligase | 4.0 | 1.2 | 1.0 | 0.3 | 0.3 | |
| GST6 | Predicted protein with glutathione S-transferase domain | 26 | 25 | 3.2 | 1.0 | 0.1 | |
| Transcriptional Regulators | MYB4 | Myb-like homeodomain transcription factor | 0.24 | 0.38 | 5.6 | 1.6 | 23 |
| NAT19 | N-acetyltransferase | 0.43 | 1.4 | 8.5 | 3.3 | 20 | |
| MYB16 | Circadian clock–associated SWI/SNF complex | 1.8 | 2.0 | 27 | 1.1 | 15 | |
| Cre03.g172750 | MYND finger | 1.4 | 3.6 | 20 | 2.6 | 14 | |
| HMG6 | High mobility group protein | 1.3 | 1.9 | 16 | 1.5 | 12 | |
| NAT30 | N-acetyltransferase | 4.4 | 9.9 | 51 | 2.3 | 12 | |
| Cre05.g248550 | Hemerythrin HHE cation binding domain; CHY zinc finger | 3.6 | 8.2 | 35 | 2.3 | 9.7 | |
| MYB3 | Myb-like transcription factor | 4.7 | 5.0 | 28 | 1.1 | 6.0 | |
| Cre07.g335150 | Squamosa promoter binding protein | 4.4 | 5.6 | 22 | 1.3 | 5.0 | |
| NAT4 | N-acetyltransferase | 3.7 | 3.0 | 17 | 0.8 | 4.6 | |
| Cre24.g770450 | Basic helix-loop-helix family protein | 32 | 53 | 109 | 1.7 | 3.4 | |
Genes without functional annotation are indicated with the IDs corresponding to the version 4 assembly (Augustus 10.2). nd, not detected at the sequencing level used in this work. In such cases, fold changes were computed after imputation of missing values and should be understood as a lower bound of the actual value.
Genes are sorted with respect to the fold changes in iron-limited conditions (0.25/20).
[Fe] in μM.
Effect of Low Iron Nutrition on Tetrapyrrole Biosynthesis and Iron-Containing Proteins in Acetate-Grown Cells
| RPKM | Fold Change | ||||||
|---|---|---|---|---|---|---|---|
| Process | Genea | Defline | 20b | 1b | 0.25b | 1/20 | 0.25/20 |
| Tetrapyrrole Biosynthesis | FLP | FLU chloroplast precursor | 16 | 30 | 199 | 1.9 | 13 |
| HEM15 | Ferrochelatase | 23 | 40 | 129 | 1.7 | 5.6 | |
| POR1 | Protochlorophyllide reductase | 64 | 47 | 243 | 0.7 | 3.8 | |
| CHLI2 | Magnesium chelatase subunit I | 46 | 38 | 154 | 0.8 | 3.4 | |
| GSA1 | Glutamate-1-semialdehyde aminotransferase | 36 | 23 | 119 | 0.6 | 3.3 | |
| CPX1 | Coproporphyrinogen III oxidase | 40 | 29 | 128 | 0.7 | 3.2 | |
| PBGD1 | Porphobilinogen deaminase | 32 | 20 | 101 | 0.6 | 3.1 | |
| CHLI1 | Magnesium chelatase subunit I | 66 | 44 | 192 | 0.7 | 2.9 | |
| GUN4 | Tetrapyrrole binding protein | 20 | 13 | 56 | 0.7 | 2.8 | |
| GTS2 | Glutamyl/glutaminyl-tRNA synthetase | 32 | 23 | 86 | 0.7 | 2.7 | |
| CHLD | Magnesium chelatase subunit D | 32 | 19 | 87 | 0.6 | 2.7 | |
| CLH1 | Chlorophyllase I | 2.2 | 2.4 | 6.0 | 1.1 | 2.7 | |
| ALAD | Δ-Aminolevulinic acid dehydratase | 132 | 103 | 342 | 0.8 | 2.6 | |
| CHLH1 | Magnesium chelatase subunit H | 63 | 62 | 159 | 1.0 | 2.5 | |
| UROS | Uroporphyrinogen-III synthase | 52 | 43 | 127 | 0.8 | 2.5 | |
| UROD1 | Uroporphyrinogen-III decarboxylase | 49 | 26 | 106 | 0.5 | 2.2 | |
| CHLG | Chlorophyll synthetase | 37 | 26 | 79 | 0.7 | 2.1 | |
| Iron Proteins | Cre09.g403550 | 2OG-Fe(II)-dependent oxidoreductase | 1.2 | 3.0 | 30 | 2.5 | 25 |
| Cre10.g427850 | PAS fold | 1.0 | 2.1 | 19 | 2.1 | 19 | |
| CDJ3 | Chloroplast DnaJ-like protein | 19 | 45 | 300 | 2.4 | 16 | |
| CDJ5 | Chloroplast DnaJ-like protein | 9.9 | 43 | 131 | 4.3 | 14 | |
| FDX6 | Ferredoxin 6 | 41 | 121 | 362 | 3.0 | 8.8 | |
| FDX3 | Ferredoxin 3 | 21 | 30 | 144 | 1.4 | 6.9 | |
| BKT1 | β-Carotene ketolase | 1.7 | 1.5 | 9.3 | 0.9 | 5.5 | |
| SOUL4 | SOUL heme binding protein | 4.3 | 4.6 | 21 | 1.1 | 4.9 | |
| SOUL1 | SOUL heme binding protein | 34 | 55 | 133 | 1.6 | 3.9 | |
| Cre10.g429750 | PAS fold | 2.8 | 3.1 | 10 | 1.1 | 3.6 | |
| FXL1 | FixL-like PAS domain protein | 3.4 | 5.5 | 12 | 1.6 | 3.5 | |
| ISC1 | Iron-sulfur cluster assembly protein | 31 | 50 | 91 | 1.6 | 2.9 | |
| Cre10.g466700 | 2OG-Fe(II)-dependent oxygenase | 6.2 | 8.4 | 18 | 1.4 | 2.9 | |
| Cre13.g586600 | Putative cytochrome b 561 ferric reductase | 4.8 | 5.5 | 16 | 1.1 | 3.3 | |
| ACH1 | Aconitate hydratase | 1152 | 1162 | 566 | 1.0 | 0.5 | |
| DES6 | ω6-Fatty acid desaturase | 1815 | 1807 | 892 | 1.0 | 0.5 | |
| CYC | Mitochondrial cytochrome c | 730 | 695 | 311 | 1.0 | 0.4 | |
| FDX2 | Ferredoxin 2 | 7.8 | 9.3 | 3.1 | 1.2 | 0.4 | |
| MitoNEET | Iron sulfur domain-containing CDGSH-type subfamily | 309 | 271 | 112 | 0.9 | 0.4 | |
| CYP197-1 | Cytochrome P450 | 28 | 28 | 9.8 | 1.0 | 0.4 | |
| GSN1 | Glutamate synthase, NADH-dependent | 81 | 88 | 28 | 1.1 | 0.3 | |
| Cre02.g093650 | Rieske [2Fe-2S] domain-containing protein | 421 | 356 | 127 | 0.8 | 0.3 | |
| SIR1 | Ferredoxin-sulfite reductase | 121 | 83 | 20 | 0.7 | 0.2 | |
| PHX5 | Prolyl 4-hydroxylase | 37 | 24 | 4.9 | 0.6 | 0.1 | |
Genes without functional annotation are indicated with the IDs corresponding to the version 4 assembly (Augustus 10.2).
Genes are sorted with respect to the fold changes in iron-limited conditions (0.25/20).
[Fe] in μM.
| RPKM | Fold Change | ||||||
|---|---|---|---|---|---|---|---|
| Process | Genea | Defline | 20b | 1b | 0.25b | 1/20 | 0.25/20 |
| Tetrapyrrole Biosynthesis | FLP | FLU chloroplast precursor | 16 | 30 | 199 | 1.9 | 13 |
| HEM15 | Ferrochelatase | 23 | 40 | 129 | 1.7 | 5.6 | |
| POR1 | Protochlorophyllide reductase | 64 | 47 | 243 | 0.7 | 3.8 | |
| CHLI2 | Magnesium chelatase subunit I | 46 | 38 | 154 | 0.8 | 3.4 | |
| GSA1 | Glutamate-1-semialdehyde aminotransferase | 36 | 23 | 119 | 0.6 | 3.3 | |
| CPX1 | Coproporphyrinogen III oxidase | 40 | 29 | 128 | 0.7 | 3.2 | |
| PBGD1 | Porphobilinogen deaminase | 32 | 20 | 101 | 0.6 | 3.1 | |
| CHLI1 | Magnesium chelatase subunit I | 66 | 44 | 192 | 0.7 | 2.9 | |
| GUN4 | Tetrapyrrole binding protein | 20 | 13 | 56 | 0.7 | 2.8 | |
| GTS2 | Glutamyl/glutaminyl-tRNA synthetase | 32 | 23 | 86 | 0.7 | 2.7 | |
| CHLD | Magnesium chelatase subunit D | 32 | 19 | 87 | 0.6 | 2.7 | |
| CLH1 | Chlorophyllase I | 2.2 | 2.4 | 6.0 | 1.1 | 2.7 | |
| ALAD | Δ-Aminolevulinic acid dehydratase | 132 | 103 | 342 | 0.8 | 2.6 | |
| CHLH1 | Magnesium chelatase subunit H | 63 | 62 | 159 | 1.0 | 2.5 | |
| UROS | Uroporphyrinogen-III synthase | 52 | 43 | 127 | 0.8 | 2.5 | |
| UROD1 | Uroporphyrinogen-III decarboxylase | 49 | 26 | 106 | 0.5 | 2.2 | |
| CHLG | Chlorophyll synthetase | 37 | 26 | 79 | 0.7 | 2.1 | |
| Iron Proteins | Cre09.g403550 | 2OG-Fe(II)-dependent oxidoreductase | 1.2 | 3.0 | 30 | 2.5 | 25 |
| Cre10.g427850 | PAS fold | 1.0 | 2.1 | 19 | 2.1 | 19 | |
| CDJ3 | Chloroplast DnaJ-like protein | 19 | 45 | 300 | 2.4 | 16 | |
| CDJ5 | Chloroplast DnaJ-like protein | 9.9 | 43 | 131 | 4.3 | 14 | |
| FDX6 | Ferredoxin 6 | 41 | 121 | 362 | 3.0 | 8.8 | |
| FDX3 | Ferredoxin 3 | 21 | 30 | 144 | 1.4 | 6.9 | |
| BKT1 | β-Carotene ketolase | 1.7 | 1.5 | 9.3 | 0.9 | 5.5 | |
| SOUL4 | SOUL heme binding protein | 4.3 | 4.6 | 21 | 1.1 | 4.9 | |
| SOUL1 | SOUL heme binding protein | 34 | 55 | 133 | 1.6 | 3.9 | |
| Cre10.g429750 | PAS fold | 2.8 | 3.1 | 10 | 1.1 | 3.6 | |
| FXL1 | FixL-like PAS domain protein | 3.4 | 5.5 | 12 | 1.6 | 3.5 | |
| ISC1 | Iron-sulfur cluster assembly protein | 31 | 50 | 91 | 1.6 | 2.9 | |
| Cre10.g466700 | 2OG-Fe(II)-dependent oxygenase | 6.2 | 8.4 | 18 | 1.4 | 2.9 | |
| Cre13.g586600 | Putative cytochrome b 561 ferric reductase | 4.8 | 5.5 | 16 | 1.1 | 3.3 | |
| ACH1 | Aconitate hydratase | 1152 | 1162 | 566 | 1.0 | 0.5 | |
| DES6 | ω6-Fatty acid desaturase | 1815 | 1807 | 892 | 1.0 | 0.5 | |
| CYC | Mitochondrial cytochrome c | 730 | 695 | 311 | 1.0 | 0.4 | |
| FDX2 | Ferredoxin 2 | 7.8 | 9.3 | 3.1 | 1.2 | 0.4 | |
| MitoNEET | Iron sulfur domain-containing CDGSH-type subfamily | 309 | 271 | 112 | 0.9 | 0.4 | |
| CYP197-1 | Cytochrome P450 | 28 | 28 | 9.8 | 1.0 | 0.4 | |
| GSN1 | Glutamate synthase, NADH-dependent | 81 | 88 | 28 | 1.1 | 0.3 | |
| Cre02.g093650 | Rieske [2Fe-2S] domain-containing protein | 421 | 356 | 127 | 0.8 | 0.3 | |
| SIR1 | Ferredoxin-sulfite reductase | 121 | 83 | 20 | 0.7 | 0.2 | |
| PHX5 | Prolyl 4-hydroxylase | 37 | 24 | 4.9 | 0.6 | 0.1 | |
Genes without functional annotation are indicated with the IDs corresponding to the version 4 assembly (Augustus 10.2).
Genes are sorted with respect to the fold changes in iron-limited conditions (0.25/20).
[Fe] in μM.
About 7% of differentially regulated genes under iron-deficient conditions encode proteins involved in signaling or involved in nucleic acid metabolism, whereas around 9% of differentially expressed genes encode proteins involved in other cellular processes (Figures 4A and 4B, left panel). Three genes (4%) encode proteins related to cell structure and function. A similar distribution of functional categories was observed when we analyzed the proteins differentially expressed under photoautotrophic iron deficiency (Figures 4A and 4B, right panels).
When we compared the sets of differentially expressed genes from acetate- versus CO2-grown cells, we noted 214 genes in common in the iron limitation condition (Figure 3C, comparison A-C) and only 24 in common in the deficiency condition (Figure 3C, comparison B-D). Manual curation of the set of 24 (see Supplemental Data Set 3 online, sheet 3) indicates heavy representation of genes encoding the above-mentioned assimilatory and distributive transporters as well as components involved in stress response.
For the differentially regulated genes in iron-limited conditions, a greater proportion of downregulated genes was noted, perhaps reflecting the slower growth, which defines the limited state (Figures 4C and 4D). There are no major differences in how each functional class is represented in the two trophic conditions, although we did note that the category of respiration is not represented at all in the data set from CO2-grown cells but includes a few downregulated genes in the data set from acetate-grown cells. Additionally, the category for photosynthesis includes several downregulated genes encoding subunits of PSI and its associated antenna in the former data set.
Several genes required for biogenesis of iron-only hydrogenase (HYDEF and HYDG) or coding for iron-containing proteins like PHX5 [encoding an Fe(II)-oxoglutarate dependent prolyl-4-hydroxylase], two hybrid-cluster proteins (HCP1 and HCP4), and MitoNEET-like (Cre01.g050550), which possesses a CDGSH iron-sulfur domain and presumably binds a [2Fe-2S] cluster, are downregulated in iron-limited photoheterotrophic cells, perhaps as part of the iron-sparing response. By contrast, mRNAs for other iron-containing proteins, such as members of the cytochrome P450 family (CYP744B1, CYP739A3, and CYP97C3), cytochrome b 561 (Cre13.g586600), or β-carotene ketolase (BKT1), increase. This may reflect the operation of a feedback mechanism geared toward ensuring the maintenance of these iron-containing proteins and is suggestive of a hierarchy of iron allocation to the many iron binding sites in the cell.
Taken together, functional analysis of genes regulated under iron-deficient and iron-limited conditions indicates changes in many iron-containing proteins and several transporters (a few, to our knowledge, not previously identified; Tables 1 and 2).
Iron Assimilation Components, Transporters, and Ferric-Chelate Reductases That Are Potentially Involved in Cellular Iron Distribution
The list of genes differentially expressed in iron deficiency (Figure 3A, comparisons B and D) was manually curated. In the first phase of the project, this involved improvement of the FM3.1 and FM4 models from the version 3 and 4 assemblies, respectively, and eventually the Augustus 5.1 and Augustus 10.2 models on the version 4 assembly, using coverage graphs to extend gene models, ESTs from 454 sequencing, and the paired-end reads to establish exon connectivity. In total, 73 gene models were improved, which in some cases allowed us to make functional assignments for a few uncharacterized loci.
Locus Cre05.g248300.t1.1 is such an example (Figure 5A). In the original FM3.1 annotation (181027), this differentially expressed gene was represented by a small (703 bp) single exon gene without assigned function. The initial revision driven by the coverage graphs (genomes.mcdb.ucla.edu) revealed a multi-exon locus encoding an NRAMP transporter. This revision, incorporated into the most recent set of Augustus 10.2 annotations, Cre05.g248300.t1.1, is still slightly underpredicted because of a short gap in the genome sequence (chromosome_5:3,313,508-3,313,612) just after the 12th exon. Two 454 reads (SRR057479.655472 and SRR057479.939001) from the University of California-Los Angeles–Joint Genome Initiative (JGI) project (http://genomes.mcdb.ucla.edu/Cre454/) cover the gap, and the final revised sequence, now available at Phytozome (Cre05.g248300.t1.3, version 5.3 assembly), extends the 12th exon with 153 bp corresponding to 51 amino acid residues.
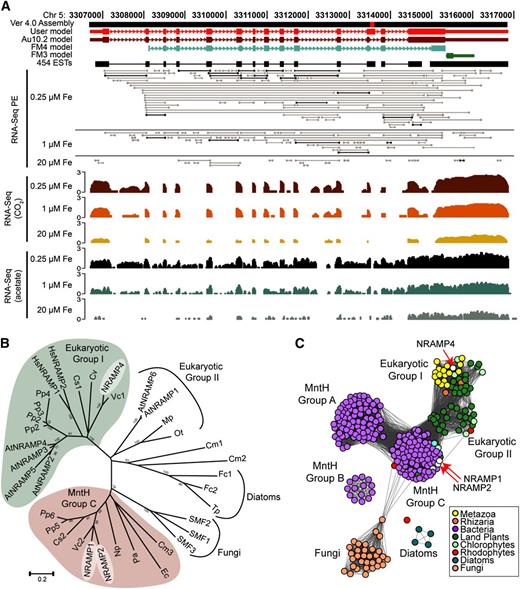
Identification of a New Protein of the NRAMP Transporter Family.
(A) Manual curation of the NRAMP4 gene model. The figure shows a snapshot of the University of California, Santa Cruz browser and the JGI browser view of a gap present in the 4.0 version of the genome assembly (red square). JGI gene models, from version 3 (FM3) and version 4 (FM4) genome assembly, are in green and blue, respectively. The Augustus 5 gene model is in dark red and Augustus 10.2 in brown. The manually curated model, which used 454 ESTs to correct for the gap, is red (user model). Paired-end reads (RNA-Seq PE track), used to establish exon connectivity, are shown using different levels of gray to highlight the more frequent pairs (in black). The RNA-Seq coverage, on a log10 scale (shown to the left), from iron-limited (0.25 μM), iron-deficient (1 μM), and iron-replete (20 μM) cells grown under photoheterotrophic (acetate) and photoautotrophic (CO2) conditions from one experiment is shown.
(B) Phylogenetic tree of NRAMPs homologs and orthologs from C. reinhardtii (NRAMP4, NRAMP1, and NRAMP2), Arabidopsis (At), Physcomitrella patens (Pp), Homo sapiens (Hs), Coccomyxa subellipsoidea C-169 (Cs), Chlorella variabilis NC64A (Cv), Volvox carteri f. nagariensis (Vc), Ostreococcus tauri (Ot), Micromonas pusilla CCMP1545 (Mp), Escherichia coli (Ec), Nostoc punctiforme (Np), Pseudomonas aeruginosa (Pa), Fragilariopsis cylindrus (Fc), Thalassiosira pseudonana (Tp), Cyanidioschyzon merolae (Cm), and S. cerevisiae (SMF1, SMF2, and SMF3).
(C) Protein similarity network of the NRAMP protein family. E-value cutoff for similarity was set at 1e-87.
Sequence analysis of the NRAMP4 protein revealed that it contains nine transmembrane helices as predicted by the TMHMM algorithm (Sonnhammer et al., 1998) (see Supplemental Figure 3 online). A phylogenetic tree and similarity network of NRAMP transporters indicates that the C. reinhardtii NRAMP4 belongs to Eukaryotic Group I (Blaby-Haas and Merchant, 2012) and clusters with Arabidopsis NRAMP2, 3, 4, and 5 and with the mammalian counterparts (Figures 5B and 5C). It has been shown that Arabidopsis NRAMP3 and NRAMP4 are also induced in iron deficiency and both are targeted to the vacuole (Thomine et al., 2003; Lanquar et al., 2005). Since eukaryotic NRAMP proteins are involved in Fe2* and/or Mn2* transport, we used the pattern of expression as an indication of function. NRAMP4 transcripts are ninefold induced in iron-deficient cells independent of carbon source, and this increases to 30- and 40-fold in iron-limited cells (Figures 6A and 6B). There are two other previously described NRAMP transporters encoded in the C. reinhardtii genome (NRAMP1 and NRAMP2), and these are more likely to function in Mn2* transport. Indeed, in contrast with NRAMP4, the tree and similarity network place NRAMP1 and NRAMP2 in the largely prokaryotic MntH Group B (Figures 5B and 5C). The expression of each NRAMP gene was evaluated in a separate experiment (Figure 6C). NRAMP1 and NRAMP2 transcripts are increased sixfold and twofold in manganese-starved cells, as previously observed (Allen et al., 2007b), while NRAMP4 mRNA levels are elevated 19-fold after 12 h and eightfold after 24 h of iron starvation, respectively. Hence, we propose that NRAMP4 is involved in iron homeostasis, most likely localized to an internal compartment like its Arabidopsis ortholog (Lanquar et al., 2005).
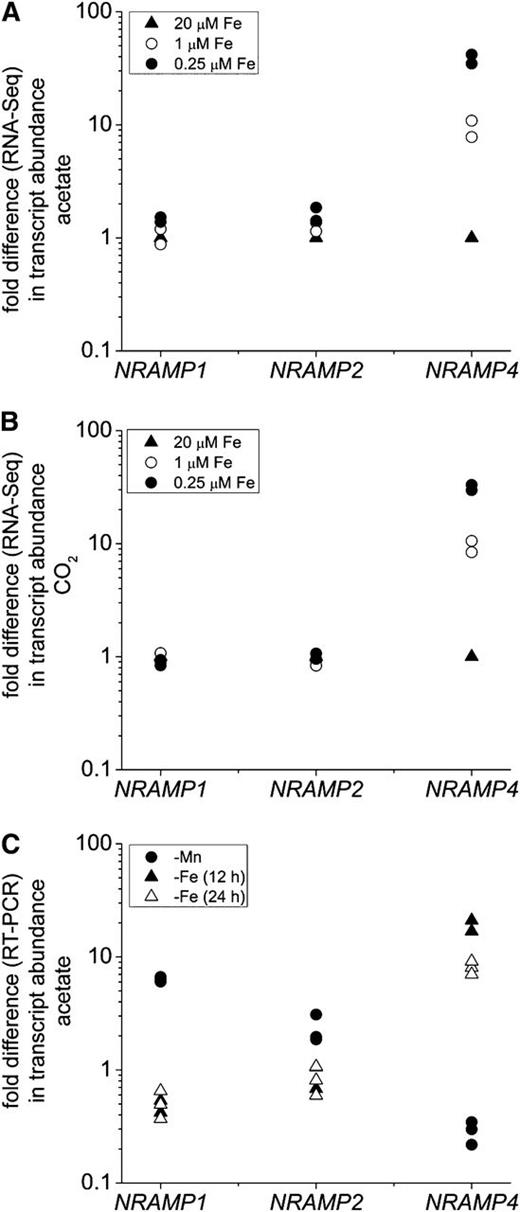
NRAMP4 Transcript Abundance Is Increased Specifically in Response to Poor Iron Nutrition in C. reinhardtii.
(A) and (B) NRAMP1, NRAMP2, and NRAMP4 transcript abundances estimated by RNA-Seq in C. reinhardtii cells grown under photoheterotrophic and photoautotrophic conditions and iron-replete, iron-deficient, and iron-limited conditions, respectively.
(C) Fold change of NRAMP transcripts assessed by real-time PCR in C. reinhardtii cells grown photoheterotrophically without manganese supplementation (circles) or without iron supplementation for the times indicated (triangles).
Other potential components of intracellular iron distribution are TEF22 (Cre12.g546500), a ferric-reductase domain–containing protein (Cre05.g241400), a putative ferroportin (Cre16.g687000), and two proteins with homology to plant VIT1 and yeast Ccc1p (Cre02.g107550 and Cre02.g099500; Table 1). The TEF22 transcript is more abundant in the presence of acetate compared with photoautotrophic cells (see Supplemental Data Set 5 online). TEF22 is induced 7.6- and 17-fold in photoheterotrophic cells in response to iron deficiency and iron limitation, respectively, and in CO2-grown cells even more dramatically, although the expression is always higher in acetate-grown cells. TEF22, located in the mitochondrion based on two proteomic studies (Allmer et al., 2006; Atteia et al., 2009), has a cytochrome b 561 ferric-reductase domain at its C-terminal end (see Supplemental Figure 4 online). It is distinct from the classical cytochrome b 561–only containing proteins as TEF22 also contains a soluble heme binding DOMON domain in the central region. TEF22 is phylogenetically related to mammalian ferric-chelate reductases (FRSS1-like) and in protein similarity networks groups separately from Cre13.g586600, an ascorbate-dependent cytochrome b 561 protein whose expression is increased 2.9-fold in iron limitation (see Supplemental Figure 5 online).
There are two homologs of Saccharomyces cerevisiae Ccc1p and Arabidopsis VIT1 (Table 1) (Li et al., 2001; Kim et al., 2006). These two proteins (Cre02.g107550 and Cre02.g099500) belong to a family of plant nodulin-like proteins, and their transcript abundances increase in response to poor iron nutrition (fivefold and twofold, respectively, under iron limitation; Table 1; see Supplemental Figure 6A online).
A previously undescribed putative ferric-reductase (Cre05.g241400) has increased transcript levels in response to poor iron nutrition under both photoheterotrophic and photoautotrophic conditions. This protein contains a conserved ferric-reductase–like transmembrane domain, an FAD binding domain, and a less conserved NAD binding domain near the C-terminal part (see Supplemental Figure 7 online). Ferric-reductase–like proteins are membrane proteins; indeed, Cre05.g241400 is predicted to possess nine transmembrane helices (see Supplemental Figure 7A online). The gene encoding this putative ferric-reductase (Cre05.g241400) is induced sixfold and ninefold in iron-deficient (1 μM iron) photoheterotrophically and photoautotrophically grown cells, respectively (see Supplemental Data Set 5 online). In iron limitation (0.25 μM iron), Cre05.g241400 is significantly induced (14-fold and 20-fold in acetate- and CO2-grown cells, respectively). C. reinhardtii Cre05.g241400 is more closely related to plant ferric-reductases than to the ferric-reductase protein family from yeast (see Supplemental Figure 7B online). Like TEF22, an ortholog of Cre05.g241400 is present in Volvox carteri, but not in other algae with sequenced genomes (as of 6/2012). A protein similarity network (see Supplemental Figure 7C online) confirms that this putative C. reinhardtii ferric-reductase (Cre05.g241400) is similar to plant ferric-reductases and distinct from bacterial or fungal proteins. The protein similarity network additionally indicates a clear separation of ferric-reductases from the sequence-related respiratory burst oxidases and NADH-5 oxidases (see Supplemental Figure 7C online, inset). Like TEF22, Cre05.g241400 is more dramatically upregulated in CO2-grown cells, although it is always more highly expressed in acetate-grown cells.
A gene encoding a ferroportin-like protein (Cre16.g687000) is among the set of upregulated transcripts (Table 1). Based on the sequence similarity to ferroportin homologs, we modified the gene model using an upstream initiator Met, thus extending the protein by 58 amino acids. The curated gene model is available on the JGI browser (http://genome.jgi.doe.gov/cgi-bin/dispGeneModel?db=Chlre4&tid=536149). The protein contains two ferroportin (FPN1) domains, one in the N terminus and the second one in the C terminus; therefore, we name it FPN1. As expected, FPN1 is a membrane protein containing eight transmembrane helices, four in each FPN domain (see Supplemental Figure 8A online). Protein network similarity suggests that C. reinhardtii FPN1 is closely related to proteins in Streptophytes and Stramenopiles and is more distant from plant IREG3 proteins (see Supplemental Figures 8B and 8C online).
Together, the analysis indicates that under low iron nutrition, C. reinhardtii cells have increased transcript levels for two putative ferric-reductases (TEF22 and Cre05.g241400). We propose that TEF22 and Cre05.g241400 might function together in reducing ferric iron to ferrous iron prior to its import into the mitochondria. There are two VIT1/CCC1 homologs and a ferroportin-like protein (FPN1), which we propose might function to transiently store iron in an intracellular compartment as it is mobilized by activation of iron-recycling mechanisms during poor iron availability in the growth medium.
Iron Limitation in C. reinhardtii Induces Nonenzymatic and Enzymatic Antioxidant Systems
Besides transporters, a second functional category represented in the data set includes several components of enzymatic and nonenzymatic antioxidant mechanisms. Most of these are induced in both photoautotrophic and photoheterotrophic cells, although the magnitude of the change and the basal level of expression in the replete situation may differ (e.g., see MSD3 transcript abundance in Supplemental Data Sets 2 and 3 online). Genes encoding chloroplast ferritins (FER1 and FER2), chloroplast manganese-superoxide oxidase (MSD3), and monodehydroascorbate reductase (MDAR1) are substantially upregulated (RPKM 102 to 103, fold changes from 6 to 103, depending on basal expression in the replete cells) (Table 1). These proteins can protect the cells from reactive oxygen species, which are expected to increase as a consequence of compromised function of PSI Fe/S centers in iron-starved cells. MnSOD3 is plastid localized and its upregulation in iron deficiency/limitation increases the capacity of the plastid to handle superoxide (generated in the Mehler reaction) without drawing on scarce intracellular iron (Page et al., 2012). The increase in FER gene expression was also noted previously and was suggested to buffer chloroplast iron released by degradation of iron-containing proteins during iron salvage (Busch et al., 2008; Long et al., 2008). Chelation of iron would minimize the danger of iron reaction with hydrogen peroxide to generate hydroxyl radicals, which cannot be detoxified biochemically. The increase in MDAR1 and VITAMIN C 2 (VTC2) expression is a companion protective mechanism that detoxifies the hydrogen peroxide by increasing plastid ascorbate (Foyer and Noctor, 2011) (see below). Among enzymatic antioxidants, we noticed increased transcripts for glutaredoxin (GRX6), glutathione peroxidase (GPX3), thioredoxin-dependent peroxidase (PRX6), and a newly annotated peroxiredoxin (Cre11.g471150), but mainly only in the iron limitation stage when the cells are clearly stressed (Table 1).
Ascorbate is a well-known nonenzymatic antioxidant in the plant chloroplast (Gill and Tuteja, 2010; Foyer and Noctor, 2011). VTC2 catalyzes the committed step in de novo ascorbate biosynthesis in C. reinhardtii (Linster et al., 2007; Urzica et al., 2012), and MDAR1 catalyzes the conversion of monodehydroascorbate to ascorbate (Figure 7). This prompted us to validate the impact of changes in transcript abundance by measuring ascorbate content in iron-poor cells. Both photoautotrophically and photoheterotrophically grown cells have increased ascorbate content, in proportion with the increase in VTC2 transcript abundance (Figures 7A and 7B). The increased ascorbate pool may require more recycling enzyme (MDAR1) to maintain the level of reduction. Quantitative proteomics and enzymatic assay of cell extracts confirmed the increase in the polypeptide and enzymatic activity, in each case approximately threefold and sixfold in iron deficiency and limitation (Table 3, Figure 7C). The increase in MDAR1 protein abundance is recapitulated at activity levels, as MDAR1 activity increased 3.6- and 6.3-fold under iron deficiency and iron limitation conditions, respectively.
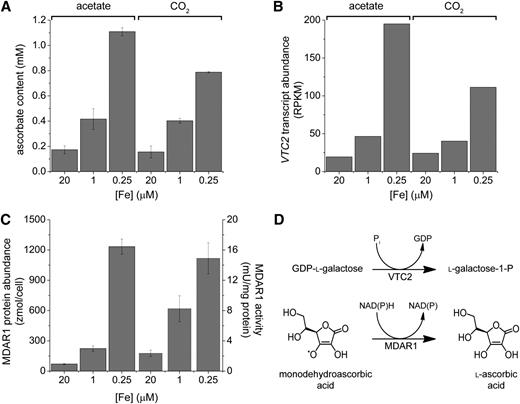
C. reinhardtii Cells Accumulate Vitamin C in Response to Low Iron Nutrition by de Novo Synthesis and Recycling.
C. reinhardtii cells were grown in iron-replete (20 μM iron), iron-deficient (1 μM iron), and iron-limited (0.25 μM iron) medium under photoheterotrophic (acetate) and photoautotrophic (CO2) conditions.
(A) Vitamin C levels were measured by reversed-phase HPLC against a standard curve (Urzica et al., 2012). The identity of the peak was validated by its susceptibility to ascorbate oxidase.
(B) RNA-Seq analysis indicates an increase in the VTC2 mRNA abundance under poor iron nutrition.
(C) Monodehydroascorbate reductase (MDAR1 encoded by MDAR1) activity and abundance is increased in response to iron deficiency. Extracts of soluble C. reinhardtii proteins from photoheterotrophically grown cells were analyzed for MDAR1 activity (right) and protein composition and abundance (left) by MSE.
(D) The reactions catalyzed by VTC2 and MDAR1. Error bars indicate sd; n = 3.
Changes in Abundances of Antioxidant and Iron-Containing Proteins in Photoheterotrophic Cells
| Protein Abundance (μmol/Cell) | Fold Change | Direction of Regulation | ||||||||
|---|---|---|---|---|---|---|---|---|---|---|
| Gene Name | Defline | Bound Fe Species | 20 µM Iron | 1 µM Iron | 0.25 µM Iron | 1/20 | 0.25/20 | 0.25/1 | Protein | mRNAa |
| Antioxidants | ||||||||||
| MSD3 | Mn superoxide dismutase | nd | 10 ± 3 | 73 ± 21 | na | na | 7 | ↑ | ↑ | |
| MDAR1 | Monodehydroascorbate reductase | 70 ± 4 | 224 ± 27 | 1234 ± 75 | 3 | 18 | 6 | ↑ | ↑ | |
| GRX6 | Glutaredoxin, CGFS type | nd | 6 ± 5 | 18 ± 6 | na | na | 3 | ↑ | ↑ | |
| GSH1 | Glutathione synthetase | 34 ± 0.7 | 45 ± 11 | 95 ± 19 | 1 | 3 | 2 | ↑ | ↑ | |
| NRX2 | Nucleoredoxin 2 | 8 ± 6 | nd | 26 ± 5 | na | 3 | na | ↑ | ↑ | |
| FER1 | Ferritin | Fe2* | 23 ± 2 | 68 ± 15 | 53 ± 11 | 3 | 2 | 1 | ↑ | ↑ |
| TRXH | Thioredoxin | 13 ± 0.6 | 17 ± 10 | 30 ± 6 | 1 | 2 | 2 | ↑ | = | |
| GSTS3 | Glutathione S-transferase | 13 ± 13 | 37 ± 22 | nd | 3 | na | na | ↑ | = | |
| CCPR1 | l-ascorbate peroxidase, heme-containing | Heme | 5 ± 3 | nd | 16 ± 4 | na | 3 | na | ↑ | ↓ |
| Iron-Containing Proteins | ||||||||||
| FEA2 | Iron-assimilating protein | Fe3* | nd | 97 ± 16 | 512 ± 77 | na | na | 5 | ↑ | ↑ |
| FEA1 | Iron-assimilating protein | Fe3* | 124 ± 21 | 735 ± 34 | 1356 ± 115 | 6 | 11 | 2 | ↑ | ↑ |
| SOUL1 | SOUL heme binding protein | Heme | 6 ± 0.3 | 10 ± 5 | 23 ± 2 | 2 | 4 | 2 | ↑ | ↑ |
| TEF22 | Predicted protein | Heme | nd | nd | 41 ± 26 | na | na | na | ↑ | ↑ |
| RIR2A | Ribonucleotide reductase R2 subunit | Di-iron | nd | 10 ± 0.7 | 11 ± 0.8 | na | na | 1 | ↑ | ↑ |
| ADH1 | Alcohol/acetaldehyde dehydrogenase | Fe2* | 6 ± 1 | 12 ± 6 | 33 ± 10 | 2 | 6 | 2 | ↑ | = |
| FSD1 | Iron superoxide dismutase | Fe2* | 340 ± 42 | 300 ± 48 | 320 ± 87 | 1 | 1 | 1 | = | = |
| CYC | Mitochondrial cytochrome c | Heme | 83 ± 14 | 66 ± 7 | 71 ± 11 | 1 | 1 | 1 | = | ↓ |
| ACH1 | Aconitatehydratase | [4Fe-4S] | 379 ± 25 | 408 ± 69 | 280 ± 35 | 1 | 1 | 1 | = | ↓ |
| FAB2 | Plastid acyl-ACP desaturase | Di-iron | 47 ± 19 | 56 ± 16 | 23 ± 9 | 1 | 0.5 | 0.4 | ↓ | ↑ |
| GSF1 | Ferredoxin-dependent Glu synthase | [3Fe-4S] | 108 ± 8 | 91 ± 3 | 43 ± 7 | 1 | 0.4 | 1 | ↓ | ↑ |
| HDS1 | 4-Hydroxy-3-methylbut-2-en-1-yl diphosphate synthase | [4Fe-4S] | 125 ± 37 | 95 ± 4 | 23 ± 7 | 1 | 0.2 | 0.2 | ↓ | ↑ |
| FRR2 | Ferredoxin thioredoxin reductase | [4Fe-4S] | 18 ± 2 | 14 ± 1 | 6 ± 2 | 1 | 0.4 | 0.4 | ↓ | = |
| LEU1L | Isopropylmalate dehydratase, large subunit | [4Fe-4S] | 159 ± 18 | 151 ± 25 | 54 ± 1 | 1 | 0.3 | 0.4 | ↓ | = |
| APR | Adenylylphosphosulfate reductase | [4Fe-4S] | 129 ± 26 | 104 ± 3 | 43 ± 10 | 1 | 0.3 | 0.4 | ↓ | = |
| GSN1 | Glu synthase, NADH-dependent | 2x[4Fe-4S]; [3Fe-4S] | 46 ± 10 | 32 ± 10 | 13 ± 2 | 1 | 0.3 | 0.4 | ↓ | ↓ |
| 01.g050550 | CDGSH Fe/S domain-containing protein | [2Fe-2S] | 37 ± 6 | 26 ± 6 | nd | 1 | na | na | ↓ | ↓ |
| HCP3 | Hybrid-cluster protein | [4Fe-2S-2O]; [4Fe-4S] | 11 ± 6 | 3 ± 0.4 | nd | 0.3 | na | na | ↓ | ↓ |
| PETF | Ferredoxin | [2Fe-2S] | 87 ± 35 | 30 ± 27 | nd | 0.3 | na | na | ↓ | ↓ |
Proteins were identified and quantified based on the signal intensity of the three most abundant peptides by MSE (Castruita et al., 2011). Values represent the averages of three biological replicates; sd is indicated. The up arrow indicates increases in RNA or protein abundance in iron-deficient or -limited cells, a down arrow indicates decreases, and an equals sign indicates that there is no change. The presence of bound Fe(II/III) species was inferred from sequence alignments and the conservation of Fe(II/III) coordinating residues in previously characterized members of those protein families from other organisms. The complete list of proteins identified and quantified by mass spectrometry (Elevated Energy) (MSE) is available in Supplemental Data Set 7 online.
Changes in mRNA abundances as analyzed by RNA-Seq. na, not applicable. nd, not detected.
| Protein Abundance (μmol/Cell) | Fold Change | Direction of Regulation | ||||||||
|---|---|---|---|---|---|---|---|---|---|---|
| Gene Name | Defline | Bound Fe Species | 20 µM Iron | 1 µM Iron | 0.25 µM Iron | 1/20 | 0.25/20 | 0.25/1 | Protein | mRNAa |
| Antioxidants | ||||||||||
| MSD3 | Mn superoxide dismutase | nd | 10 ± 3 | 73 ± 21 | na | na | 7 | ↑ | ↑ | |
| MDAR1 | Monodehydroascorbate reductase | 70 ± 4 | 224 ± 27 | 1234 ± 75 | 3 | 18 | 6 | ↑ | ↑ | |
| GRX6 | Glutaredoxin, CGFS type | nd | 6 ± 5 | 18 ± 6 | na | na | 3 | ↑ | ↑ | |
| GSH1 | Glutathione synthetase | 34 ± 0.7 | 45 ± 11 | 95 ± 19 | 1 | 3 | 2 | ↑ | ↑ | |
| NRX2 | Nucleoredoxin 2 | 8 ± 6 | nd | 26 ± 5 | na | 3 | na | ↑ | ↑ | |
| FER1 | Ferritin | Fe2* | 23 ± 2 | 68 ± 15 | 53 ± 11 | 3 | 2 | 1 | ↑ | ↑ |
| TRXH | Thioredoxin | 13 ± 0.6 | 17 ± 10 | 30 ± 6 | 1 | 2 | 2 | ↑ | = | |
| GSTS3 | Glutathione S-transferase | 13 ± 13 | 37 ± 22 | nd | 3 | na | na | ↑ | = | |
| CCPR1 | l-ascorbate peroxidase, heme-containing | Heme | 5 ± 3 | nd | 16 ± 4 | na | 3 | na | ↑ | ↓ |
| Iron-Containing Proteins | ||||||||||
| FEA2 | Iron-assimilating protein | Fe3* | nd | 97 ± 16 | 512 ± 77 | na | na | 5 | ↑ | ↑ |
| FEA1 | Iron-assimilating protein | Fe3* | 124 ± 21 | 735 ± 34 | 1356 ± 115 | 6 | 11 | 2 | ↑ | ↑ |
| SOUL1 | SOUL heme binding protein | Heme | 6 ± 0.3 | 10 ± 5 | 23 ± 2 | 2 | 4 | 2 | ↑ | ↑ |
| TEF22 | Predicted protein | Heme | nd | nd | 41 ± 26 | na | na | na | ↑ | ↑ |
| RIR2A | Ribonucleotide reductase R2 subunit | Di-iron | nd | 10 ± 0.7 | 11 ± 0.8 | na | na | 1 | ↑ | ↑ |
| ADH1 | Alcohol/acetaldehyde dehydrogenase | Fe2* | 6 ± 1 | 12 ± 6 | 33 ± 10 | 2 | 6 | 2 | ↑ | = |
| FSD1 | Iron superoxide dismutase | Fe2* | 340 ± 42 | 300 ± 48 | 320 ± 87 | 1 | 1 | 1 | = | = |
| CYC | Mitochondrial cytochrome c | Heme | 83 ± 14 | 66 ± 7 | 71 ± 11 | 1 | 1 | 1 | = | ↓ |
| ACH1 | Aconitatehydratase | [4Fe-4S] | 379 ± 25 | 408 ± 69 | 280 ± 35 | 1 | 1 | 1 | = | ↓ |
| FAB2 | Plastid acyl-ACP desaturase | Di-iron | 47 ± 19 | 56 ± 16 | 23 ± 9 | 1 | 0.5 | 0.4 | ↓ | ↑ |
| GSF1 | Ferredoxin-dependent Glu synthase | [3Fe-4S] | 108 ± 8 | 91 ± 3 | 43 ± 7 | 1 | 0.4 | 1 | ↓ | ↑ |
| HDS1 | 4-Hydroxy-3-methylbut-2-en-1-yl diphosphate synthase | [4Fe-4S] | 125 ± 37 | 95 ± 4 | 23 ± 7 | 1 | 0.2 | 0.2 | ↓ | ↑ |
| FRR2 | Ferredoxin thioredoxin reductase | [4Fe-4S] | 18 ± 2 | 14 ± 1 | 6 ± 2 | 1 | 0.4 | 0.4 | ↓ | = |
| LEU1L | Isopropylmalate dehydratase, large subunit | [4Fe-4S] | 159 ± 18 | 151 ± 25 | 54 ± 1 | 1 | 0.3 | 0.4 | ↓ | = |
| APR | Adenylylphosphosulfate reductase | [4Fe-4S] | 129 ± 26 | 104 ± 3 | 43 ± 10 | 1 | 0.3 | 0.4 | ↓ | = |
| GSN1 | Glu synthase, NADH-dependent | 2x[4Fe-4S]; [3Fe-4S] | 46 ± 10 | 32 ± 10 | 13 ± 2 | 1 | 0.3 | 0.4 | ↓ | ↓ |
| 01.g050550 | CDGSH Fe/S domain-containing protein | [2Fe-2S] | 37 ± 6 | 26 ± 6 | nd | 1 | na | na | ↓ | ↓ |
| HCP3 | Hybrid-cluster protein | [4Fe-2S-2O]; [4Fe-4S] | 11 ± 6 | 3 ± 0.4 | nd | 0.3 | na | na | ↓ | ↓ |
| PETF | Ferredoxin | [2Fe-2S] | 87 ± 35 | 30 ± 27 | nd | 0.3 | na | na | ↓ | ↓ |
Proteins were identified and quantified based on the signal intensity of the three most abundant peptides by MSE (Castruita et al., 2011). Values represent the averages of three biological replicates; sd is indicated. The up arrow indicates increases in RNA or protein abundance in iron-deficient or -limited cells, a down arrow indicates decreases, and an equals sign indicates that there is no change. The presence of bound Fe(II/III) species was inferred from sequence alignments and the conservation of Fe(II/III) coordinating residues in previously characterized members of those protein families from other organisms. The complete list of proteins identified and quantified by mass spectrometry (Elevated Energy) (MSE) is available in Supplemental Data Set 7 online.
Changes in mRNA abundances as analyzed by RNA-Seq. na, not applicable. nd, not detected.
In previous work, we noted an increase in the abundance of xanthophyll cycle pigments (although not nonphotochemical quenching) in iron-limited and iron-deficient cells with a more notable increase in photoheterotrophic conditions (Terauchi et al., 2010). Therefore, we surveyed genes encoding candidate enzymes of carotenoid metabolism in C. reinhardtii (Lohr et al., 2005, 2012) and Cre33.g783050, which was identified by BLAST search of the Augustus 10.2 annotation as an ortholog of Arabidopsis 15-cis-ζ-carotene isomerase. We noted increased mRNA abundances in acetate-grown cells but generally no changes or even reduced abundances in CO2-grown cells (see Supplemental Data Set 6 and Supplemental Figure 9 online). We note that many of the enzymes, HDS, BKT1, CHYB, CYP97A5, and CYP97C3 are iron containing, and the increase in transcript abundance may reflect feedback regulation from loss of functional protein (see below). The absence of change in mRNAs for these genes in iron-deficient CO2-grown cells might then indicate that those enzymes are resistant to loss of iron in photoautotrophic conditions.
Conservation of Iron Deficiency Responses between C. reinhardtii and Land Plants
In the past years, several genome-wide analyses were performed in iron-deficient plants (Colangelo and Guerinot, 2004; Dinneny et al., 2008; Buckhout et al., 2009; Zheng et al., 2009; Long et al., 2010; Yang et al., 2010). We wondered whether there might be conserved common responses to iron nutrition in the plant lineage. Therefore, we reviewed data sets from several such studies for orthologs of C. reinhardtii genes found in this work to be responsive to poor iron nutrition and found 14 proteins (Table 4). Among these are iron transporters like IRT1, IRT2, NRAMP4, VIT1-like, ferroportin, and a P-type ATPase homologous to Arabidopsis AHA2. In general, the pattern of regulation is similar (the transcripts are upregulated) with several exceptions. NRAMP4 is downregulated in rice (Zheng et al., 2009), and the VIT1-like gene (Cre02.g107550) is downregulated in all Arabidopsis and rice transcriptome studies (Dinneny et al., 2008; Zheng et al., 2009; Long et al., 2010; Yang et al., 2010). VIT1 expression is consistent with a function in long-term iron storage in seeds, whereas in a unicellular organism like C. reinhardtii, it is more likely to function in transitory storage during remobilization of iron from the chloroplast to the mitochondrion. The same is true for ferritins, which in C. reinhardtii are upregulated in deficiency, whereas in land plants they are downregulated (Briat et al., 1999; Busch et al., 2008; Dinneny et al., 2008; Long et al., 2008). MDAR1 is another globally conserved response, reflecting the importance of ascorbate as an antioxidant (Figure 7).
Conservation of Responses to Iron Nutrition between C. reinhardtii and Land Plants
| This Study | b | c | d | e | f | g | ||
|---|---|---|---|---|---|---|---|---|
| Transcript Regulation | ||||||||
| Protein Namea | Defline | C. reinhardtii | Arabidopsis | Rice | ||||
| IRT1b | Iron nutrition–responsive ZIP family transporter | ↑ | + | + | + | + | + | + |
| NRAMP4 | Putative Mn/metal transporter, NRAMP homolog | ↑ | + | + | + | + | + | − |
| IRT2b | Iron nutrition–responsive ZIP family transporter | ↑ | + | + | + | + | + | + |
| Cre10.g466050 | Expressed hypothetical protein | ↑ | + | + | + | + | ||
| Cre01.g061600 | Kelch repeat protein | ↑ | + | + | + | + | + | + |
| MDAR1 | Monodehydroascorbate reductase | ↑ | + | + | + | |||
| Cre14.g609500 | Expressed hypothetical protein | ↑ | + | |||||
| FER1b | Ferritin | ↑ | − | − | − | − | ||
| Cre16.g687000b | Similar to ferroportin | ↑ | + | + | + | + | + | |
| CGLD27 | Expressed hypothetical protein | ↑ | + | + | + | + | + | |
| CDJ3 | Chloroplast DnaJ-like protein | ↑ | + | + | + | + | ||
| Cre05.g248550b | Hemerythrin binding domain; CHY zinc finger, E3 ligase | ↑ | + | + | + | + | + | |
| Cre02.g107550 | VIT1 family | ↑ | − | − | − | − | ||
| PMA2b | P-type ATPase/cation transporter | ↑ | + | + | + | |||
Up arrow indicates an increase in expression in low iron relative to the replete situation. A plus sign indicates that a gene encoding an ortholog (or homolog) in Arabidopsis or rice is similarly regulated, a minus sign indicates opposite regulation, and a blank means that no information is available in the cited study. The data for Arabidopsis and rice were manually curated from (b) Colangelo and Guerinot (2004), (c) Dinneny et al. (2008), (d) Long et al. (2010), (e) Buckhout et al. (2009), (f) Yang et al. (2010), and (g) Zheng et al. (2009).
C. reinhardtii protein name and defline (protein description) is indicated.
Identification of orthologs by mutual best hit is often precluded for members of multigene families.
| This Study | b | c | d | e | f | g | ||
|---|---|---|---|---|---|---|---|---|
| Transcript Regulation | ||||||||
| Protein Namea | Defline | C. reinhardtii | Arabidopsis | Rice | ||||
| IRT1b | Iron nutrition–responsive ZIP family transporter | ↑ | + | + | + | + | + | + |
| NRAMP4 | Putative Mn/metal transporter, NRAMP homolog | ↑ | + | + | + | + | + | − |
| IRT2b | Iron nutrition–responsive ZIP family transporter | ↑ | + | + | + | + | + | + |
| Cre10.g466050 | Expressed hypothetical protein | ↑ | + | + | + | + | ||
| Cre01.g061600 | Kelch repeat protein | ↑ | + | + | + | + | + | + |
| MDAR1 | Monodehydroascorbate reductase | ↑ | + | + | + | |||
| Cre14.g609500 | Expressed hypothetical protein | ↑ | + | |||||
| FER1b | Ferritin | ↑ | − | − | − | − | ||
| Cre16.g687000b | Similar to ferroportin | ↑ | + | + | + | + | + | |
| CGLD27 | Expressed hypothetical protein | ↑ | + | + | + | + | + | |
| CDJ3 | Chloroplast DnaJ-like protein | ↑ | + | + | + | + | ||
| Cre05.g248550b | Hemerythrin binding domain; CHY zinc finger, E3 ligase | ↑ | + | + | + | + | + | |
| Cre02.g107550 | VIT1 family | ↑ | − | − | − | − | ||
| PMA2b | P-type ATPase/cation transporter | ↑ | + | + | + | |||
Up arrow indicates an increase in expression in low iron relative to the replete situation. A plus sign indicates that a gene encoding an ortholog (or homolog) in Arabidopsis or rice is similarly regulated, a minus sign indicates opposite regulation, and a blank means that no information is available in the cited study. The data for Arabidopsis and rice were manually curated from (b) Colangelo and Guerinot (2004), (c) Dinneny et al. (2008), (d) Long et al. (2010), (e) Buckhout et al. (2009), (f) Yang et al. (2010), and (g) Zheng et al. (2009).
C. reinhardtii protein name and defline (protein description) is indicated.
Identification of orthologs by mutual best hit is often precluded for members of multigene families.
Of particular interest is Cre05.g248550, homologous to Arabidopsis BRUTUS (BTS). Cre05.g248550 contains four hemerythrin domains scattered throughout the length of the protein, a CHY-type zinc finger domain, and a putative E3 ubiquitin-protein ligase domain in the C-terminal part (see Supplemental Figure 10A online). Cre05.g248550 has homologs in land plants and other algae like Chlorella sp NC64A, V. carteri, Ostreococcus sp RCC809, and Micromonas spp (see Supplemental Figure 10B online). A protein similarity network clearly shows that Cre05.g248550 is closely related to Arabidopsis BTS and distinct from animal FBXL5 proteins, which are iron-sensing E3 ligases (Salahudeen et al., 2009; Vashisht et al., 2009) (see Supplemental Figure 10C online). We suggest that Cre05.g248550, which is induced in both photoautotrophic and photoheterotrophic cells, may be a functional ortholog of BTS.
Besides the proteins involved in iron homeostasis, there are a few proteins of unknown function: Cre10.g466050 and CGLD27 are pioneer proteins (i.e., they do not have domains suggestive of function), whereas Cre01.g061600 has a Kelch repeat and therefore may be part of a regulatory network. CGLD27 encodes a highly conserved protein found in cyanobacteria and in all plastid-containing organisms, including diatoms (see Supplemental Figure 11 online). CGLD27 orthologs in Arabidopsis and rice are At5g67370 and Os03g0439700, respectively. The sequence contains a domain of unknown function (DUF1230), has three transmembrane segments, and is likely targeted to the chloroplast based on its relationship to open reading frame ycf36 encoded in some algal plastid genomes (Douglas and Penny, 1999).
In Arabidopsis, the CGLD27 ortholog is highly expressed in seeds, leaves, and flowers, whereas in roots its expression is the lowest (Figure 8A, left). The expression pattern is similar to that of FRO3 encoding a ferric-reductase. Genes like IRT1 (known to be involved in iron uptake in Arabidopsis) or FC (encoding ferrochelatase, an iron-using enzyme) have a different expression pattern (Figure 8A, right). In a time-course experiment with root cells, CGLD27 responds slightly more slowly than do IRT1 and FRO3, which are highly upregulated under iron deficiency, reaching a maximum after 24 h of growing in iron-deprived conditions (Long et al., 2010). In Arabidopsis, CGLD27 transcript levels increase progressively by 5-, 11-, and 12-fold after 24, 48, and 72 h of iron deficiency (Figure 8C).
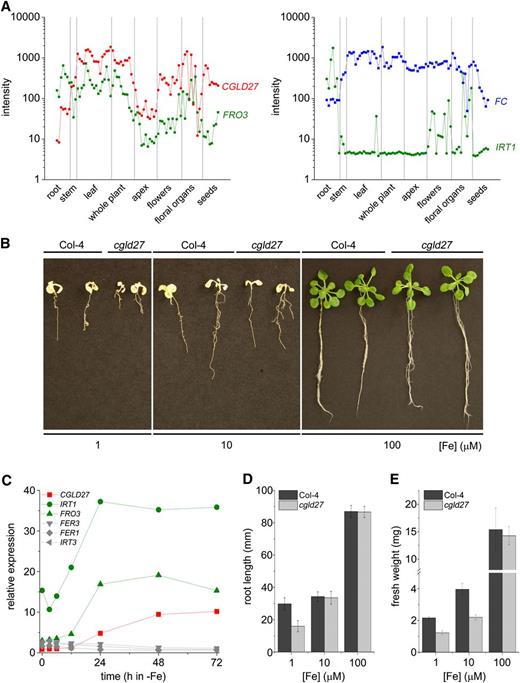
Arabidopsis cgld27 Shows Increased Sensitivity to Poor Iron Nutrition.
(A) Pattern of expression of CGLD27, FRO3, IRT1, and ferrochelatase (FC) in Arabidopsis organs. Signal intensities for these genes were extracted from AtGenExpress developmental microarrays (Schmid et al., 2005).
(B) Phenotype of Arabidopsis wild type (Col-4) and cgld27 mutant were grown in iron-replete (100 μM iron) and iron-deficient conditions (1 and 10 μM iron) for 2 weeks.
(C) Relative abundances of CGLD27, IRT1, IRT3, FRO3, FER1, and FER3 transcripts in response to iron starvation in Arabidopsis. Data are from Long et al. (2010).
(D) Root length of wild-type and cgld27 plants grown in the presence of 100, 10, and 1 μM iron (error bars indicate sd; n = 10).
(E) Fresh weight of wild-type and cgld27 plants grown in different iron concentrations (sd is indicated; n = 5).
We took advantage of a T-DNA insertional mutant with the insertion located in the second exon to test whether CGLD27 is required in iron-poor Arabidopsis plants. The mutant plants were grown under different iron concentrations: iron-replete conditions (100 μM iron) or iron-deficient (1 and 10 μM iron). In the presence of 10 to 100 μM iron, no visual phenotype could be observed between the wild type (Columbia-4 [Col-4]) and the cgld27 mutant (Figure 8B). When the plants were grown in the presence of 1 μM iron, the cgld27 mutant showed a stronger growth defect compared with Col-4. The mutant does not seem to be more chlorotic than Col-4 under iron-deficient conditions, but the root length is smaller in cgld27 plants grown under 1 μM iron (Figure 8D). We also noted that plant fresh weight decreased when grown under iron deficiency, an effect that is stronger (twofold) for cgld27 plants (Figure 8E). The phenotype is exacerbated in alkaline soil (pH 8.0) where the availability of iron is limited. Bayesian Markov Random Fields analysis (Kourmpetis et al., 2010) predicts a function for CGLD27/At5g67370 in carotenoid-xanthophyll metabolism. Moreover, At5g67370 is coexpressed with ZDS (encoding ζ-carotene desaturase) in the ATTED-II database of coexpressed genes (Obayashi et al., 2007, 2011).
Together, these results validate the transcriptome analysis in C. reinhardtii cells grown under poor iron nutrition and show the importance of cross-species comparison.
Transcriptional Regulation of Iron Deficiency Responses
Where tested, most of the highly regulated genes (FOX1, FTR1, FEA1, and MSD3) are controlled at the transcriptional level (Allen et al., 2007a; Page et al., 2012). Deletion analysis identified candidate iron response elements (FeREs) in the 5′ flanking regions of the FOX1, FTR1, FEA1, and ATX1 genes (Deng and Eriksson, 2007; Fei and Deng, 2007; Fei et al., 2009, 2010). Two distinctive cis-acting elements were identified: CAC(G/A)CG in the promoter regions of FOX1, FEA2, or FER1 and TG(G/C)CA in the promoters of FEA1, FRE1, and ATX1. To determine the relevance of these elements to the differentially expressed genes identified in this work, we searched the 5′ flanking regions after using the coverage graphs to adjust gene models to reflect the 5′ most end of each transcript (the presumed transcription start site). An unsupervised promoter analysis (Castruita et al., 2011) on different iron deficiency gene sets (Figure 3A, comparisons A-B, C-D, and B-D) shows that for short promoters (<1000 bp upstream of the transcription start site), CACGCG is the most overrepresented 6mer, both for photoheterotrophic and photoautotrophic conditions (see Supplemental Figure 12 online). The same analysis failed to find significant overrepresentation for motifs of the type TG(G/C)CA. Moreover, no significant results were found for longer words (7-8mers), indicating that the core sequence for FeREs of the type CAC(G/A)CG is restricted to these six nucleotides (see Supplemental Figure 12 online). We conclude that CAC(G/A)CG is likely to be a fundamental component of iron signaling, while TC(G/C)CA may regulate only a subset of genes through a parallel signal transduction pathway.
Besides the FeREs, little else is known about the regulation of iron-deficient responses in C. reinhardtii. Among the differentially expressed genes is Cre24.g770450 (see Supplemental Figure 13A online). Its expression is two- to threefold increased in iron-poor conditions in both CO2- and acetate-grown cells (Table 1). The C. reinhardtii protein is similar to the Arabidopsis group IV transcription factors (ILR3, bHLH34, bHLH104, and bHLH115) (see Supplemental Figure 13B online). In Arabidopsis, at least two basic helix-loop-helix (bHLH) transcription factors are involved in signaling iron deficiency responses, FIT1 and PYE. FIT1 expression is increased in iron-deficient roots, and the protein interacts with other bHLH factors (bHLH38 and bHLH39), forming a heterodimer that regulates FRE1 and IRT1 expression (Colangelo and Guerinot, 2004; Jakoby et al., 2004; Yuan et al., 2005, 2008). PYE interacts with the bHLH transcription factor ILR3, which itself interacts with BTS (discussed above) (Rampey et al., 2006; Long et al., 2010). Both PYE and BTS are upregulated in iron-deficient Arabidopsis. We hypothesize that the C. reinhardtii bHLH Cre24.g770450 protein might be an entry to identification of the network of transcriptional regulators that influence iron deficiency responses in algae.
Several other transcription factors are induced at the transcript level under iron-deficient and -limited conditions (Table 1). Among them, we identified three Myb-like transcription factors (MYB4, MYB16, and Cre12.g514400). Myb-like transcription factors have been previously associated with iron deficiency in plants, where they might function as regulators of iron deficiency responses (Chen et al., 2006; Ogo et al., 2006; Shen et al., 2008) or they are involved in senescence (Sperotto et al., 2008). Additionally, three genes coding for GCN5-related N-acetyltransferases (NAT19, NAT30, and NAT4) were strongly upregulated (Table 1). Several GNAT-like proteins were found to be induced in Arabidopsis in response to iron deficiency (Dinneny et al., 2008; Schuler et al., 2011). GCN5-related acetyltransferases are involved in histone acetylation and usually associated with the activation of gene transcription. Thus, at least in Arabidopsis and C. reinhardtii, iron limitation may result in enhanced histone acetylation that might be necessary to make chromosomal areas more accessible for transcriptional machineries.
Quantitative Analysis of the Soluble Proteome from Photoheterotrophically Grown C. reinhardtii Cells
To assess whether the changes in the transcriptome from iron-deficient and iron-limited cells are recapitulated at the protein level, we performed quantitative proteomics on the soluble proteome of the photoheterotrophic C. reinhardtii cells. After fractionation of total soluble proteins by gel electrophoresis and trypsin digestion of the fractions, we identified and quantified peptides derived from each fraction by liquid chromatography–tandem mass spectrometry. Data were searched against the Augustus 10.2 gene models (Phytozome). As many as 992 proteins were identified, of which 524 were reliably quantified (S.I. Hsieh, M. Castruita, D. Malasarn, E.I. Urzica, J. Erde, M.D. Page, D. Casero, M. Pellegrini, S.S. Merchant, and J.A. Loo, unpublished data). A subset of 53 proteins, relevant to this study, is presented here (see Supplemental Data Set 7 online).
The differentially expressed proteins can be divided into three groups. In one group are proteins whose changes in abundance (16 increased and seven decreased) match the changes observed for transcript abundance (Table 3). Among the ones that increase are iron assimilation proteins, FEAs and TEF22, antioxidant or stress response proteins, MnSOD3, monodehydroascorbate reductase, ferritin1 and GSH1, and, interestingly, ribonucleotide reductase, which is a highly prioritized iron-containing protein because of its role in DNA synthesis. By contrast, the proteins that decrease with corresponding decreases in mRNAs tend to contain bound iron. This includes many Fe/S cluster proteins, such as Cre01.g050550, HCP3, and ferredoxin. The coordinate decrease of both protein and RNA abundance suggests that these are downregulated as primary targets in an iron-sparing program. Several proteases, SCPL50, CEP1, and MMP13, are also increased in conjunction with their RNAs (Table 3; see Supplemental Data Set 7 online), perhaps implicating them in the degradative activities involved in iron recycling and photoprotection (Moseley et al., 2002; Page et al., 2012).
In a second group are proteins that are reduced in abundance without an effect on mRNA abundance. In this group are many Fe/S proteins (Table 3). It is possible that the protein levels cannot be maintained because of reduced iron supply for Fe/S biogenesis or that photooxidative stress results in damage of these proteins, leading to their eventual degradation. Finally, there is a third group, where changes in protein are opposite to those noted for the RNAs. Again, many (e.g., ADH1, FAB2, and GSF1), although not all (e.g., RPE1, PBGD1, UROD1, LCIC, and LCIB), of these are iron-containing proteins. For these, we suspect that increased RNA abundance is a secondary rather than direct effect of iron deficiency physiology: low protein abundance having a feedback effect on raising transcript levels. In fact, most of the Fe/S cluster–containing proteins identified in the proteomic analysis (Table 3; see Supplemental Data Set 7 online) are reduced in abundance in iron-limited cells, independent of their mRNA abundances, pointing to the impact of poor iron nutrition on Fe/S proteins.
Although we used only soluble fractions (supernatant from 253,000g centrifugation), we did identify peptides from membrane proteins (FOX1 and TEF22), indicative perhaps of some degradation in the extramembrane domains. Therefore, the abundance of these proteins is underestimated. Since the ferroxidase could not be detected in the proteome from iron-replete cultures, a fold change could not be calculated. Nevertheless, the change in FOX1 mRNA abundance is approximately comparable to the change in protein abundance estimated from immunoblots (Figure 2; La Fontaine et al., 2002).
Photoautotrophic versus Photoheterotrophic
There are substantial differences in the transcriptomes of photoautotrophic versus photoheterotrophic cells independent of iron nutrition. To focus attention on quantitatively meaningful changes, we applied a stringent cutoff fold change of ≥8 (FDR<5%). Samples were compared pairwise with carbon source as the variable (see Supplemental Figure 1, comparisons E to G, and Supplemental Data Set 4 online). The combination of (1) the stringent cutoff and (2) the different impact of iron deficiency on trophic status reduced the number of genes that are always differently expressed in CO2 versus acetate (intersection of comparisons E, F, and G) to only 114. These dramatically regulated genes are largely associated with carbon source utilization. In CO2-grown cells, the carbon concentrating mechanism is induced, while in acetate-grown cells, genes encoding enzymes involved in acetate utilization are induced. Of nine carbonic anhydrases, three contribute significantly to the CAH mRNA population, CAH1, CAH4, and CAH5, with abundances corresponding to 2332, 2184, and 1180 RPKM in iron-replete cultures, respectively. The mRNAs are maintained in iron-deficient and -limited cells, consistent with the operation of photosynthesis, whereas in acetate-grown cells, their low level of expression is further repressed. Interestingly, there are a few genes in this list representing uncharacterized proteins (e.g., Cre11.g477350, Cre59.g791750, Cre12.g554100, Cre01.g003950, Cre18.g748750, Cre10.g457194, Cre02.g073600, and Cre02.g120200) that we suspect, based on their pattern of expression, are likely to be involved in the carbon concentrating mechanism. A recent study (Fang et al., 2012) has suggested a potential function as Ci transporters for some of these proteins (e.g., Cre11.g477350, Cre59.g791750, Cre12.g554100, and Cre01.g00395). The gamma carbonic anhydrases are more highly expressed in acetate-grown cells, consistent with their function in mitochondrial respiration (Cardol et al., 2004, 2005).
The data set also gives an opportunity to compare the expression of individual members of gene families (see Supplemental Data Set 8 online). For instance, FBA3 with an expression level corresponding to ∼3 × 10³ RPKM is the most highly expressed fructose-1,6-bisphosphatase–encoding gene. Iron nutrition does not affect its abundance but does affect expression of a different isoform, FBA1, in acetate-grown but not in CO2-grown cells. Other examples include ACS3 versus ACS1 and ACS2, PGK1 versus PGK2, and RBCS2 versus RBCS1. RBCS2 is regulated by carbon source, with an expression level of 3 × 10⁴ RPKM in CO2-grown cells or approximately three- to fourfold greater than the level in acetate-grown cells.
DISCUSSION
In this study, we used RNA sequencing methods to reveal genes whose expression is affected by poor iron nutrition. In previous work, we identified components of iron assimilation (e.g., FEA1, FRE1, FOX1, and FTR1) in C. reinhardtii and noted (1) that the genes were transcriptionally regulated by iron and (2) that the increase in transcript abundance occurred when the iron content of the medium was marginally deficient, without an impact on chlorophyll content, photosynthesis, or growth rate. This suggested that a comparative transcriptome would be a fruitful approach to the identification of other target genes of nutritional iron signaling and further that genes that are upregulated in asymptomatic iron-deficient cells might represent direct targets of iron signaling (as expected for components of iron assimilation) rather than secondary consequences of stress resulting from loss of function of iron proteins.
C. reinhardtii cells have two lifestyles: autotrophic growth on CO2 and heterotrophic growth on acetate. In either case, metabolism depends on abundant iron proteins, the former on proteins of the photosynthetic apparatus in the chloroplast and the latter on mitochondrial respiratory complex proteins. We analyzed iron deficiency responses in both conditions to distinguish compartment- or pathway-specific processes and the occurrence of iron-sparing mechanisms that might control iron supply to mitochondria versus chloroplasts. The experiments also allowed us to compare the transcriptomes of acetate versus CO2-grown cells (Figure 3; see Supplemental Figure 1 and Supplemental Data Set 4 online). The expression estimates between independent experimental replicate samples are exceptionally similar over three orders of magnitude, as noted in previous studies (Castruita et al., 2011).
Interaction between C Source and Iron Nutrition
Similar numbers of genes are differently expressed in acetate-versus CO2-grown cells independent of iron supply (see Supplemental Figure 1 and Supplemental Data Set 4 online). In iron-replete medium, 3 to 4 × 10³ genes are differentially expressed if we use a twofold cutoff and ∼1 × 10³ with a fourfold cutoff (FDR <1%). In all cases, more genes are differentially expressed in iron-replete medium and the least in iron-limited medium. To focus the analysis on genes that showed significant fold change, we arbitrarily chose a cutoff of eightfold for presentation in this article, which yielded between 2 and 3 × 10² genes in each list and only 114 common among the three comparisons. This is because the expression of some of the genes is influenced by both carbon source and iron nutrition (e.g., LHCBM7 and MSD3), and in some comparisons the difference in expression does not reach the stringent eightfold cutoff. In other cases, the impact of iron nutrition is dependent on the mode of growth (autotrophic versus heterotrophic), as noted previously (Naumann et al., 2007; Terauchi et al., 2010). Genes in this category include DES6, Cre01.g056250 encoding a pioneer protein, and CGLD27, among others. Previous studies indicate that photoautotrophic cells are more effective at maintaining their iron quota, which means that given the same supply of iron in the medium, the gene regulation pathways may not be as highly activated in CO2-grown cells versus the acetate-grown ones.
Besides some components of the CCM (like CAH and LCI genes, which are documented to increase in cells grown at air levels of CO2; Yamano and Fukuzawa, 2009; Wang et al., 2011), the core list of 114 genes contains a number of known or candidate regulatory proteins (LCR1, CDKG2, PPP30, HOR1, and SNF2-like) or possibly biogenesis/assembly factors (DNJ15, DNJ31, MRPS17, and ribosomal proteins), reflecting the proliferation of mitochondrial versus chloroplast machinery in acetate- versus CO2-grown cells. The fact that there are several pioneer proteins in this list indicates considerable room for new discovery in understanding carbon metabolism in green algae. For instance, we note that a long-chain acyl-CoA ligase and a triacylglycerol lipase are more highly expressed in CO2- versus acetate-grown cells, suggesting that in the former situation, (activated) acetate may likely be generated by triacylglycerol and fatty acid degradation.
Tetrapyrrole Metabolism
One of the classic and diagnostic symptoms of iron deficiency is chlorosis, attributed to inhibition of chlorophyll biosynthesis (e.g., via reduced function of the di-iron cyclase but also via an effect on ferrochelatase for heme biosynthesis) and programmed degradation of chlorophyll-protein complexes (Spiller et al., 1982; Moseley et al., 2002; Yadavalli et al., 2012). Acetate-grown cells have reduced chlorophyll content under iron limitation, but photoautotrophic cells are less affected (Figure 1). Curiously, in acetate-grown cells, nearly all transcripts of the tetrapyrrole biosynthetic pathway (heme and chlorophyll branches) are increased in iron limitation, whereas in photoautotrophic cells, they are decreased (see Supplemental Figure 14 and Supplemental Data Set 9 online), suggesting that mRNA abundance is sensitive to feedback inhibition from the end products. Indeed, FLP1 and GUN4 (potential regulators of tetrapyrrole biosynthesis) are dramatically changed. FLP1 is induced 1.9- and 13-fold in response to iron deficiency and iron limitation, respectively (see Supplemental Data Set 9 online).
Conserved Responses to Poor Iron Nutrition
Only 24 genes are differently expressed in mildly iron-deficient cells independent of lifestyle, and they tend to encode iron transporters and associated functions or stress response proteins, particularly antioxidants (Table 1). We suggest that these are primary and direct targets of nutritional iron signaling, which is supported by the enrichment of candidate FeREs in the 5′ upstream sequences flanking the start site of transcription (see Supplemental Figure 12 online). When we compared the responses in C. reinhardtii to those documented in Arabidopsis, tomato (Solanum lycopersicum), and rice, transporters and antioxidant proteins were well represented as well, indicative of the importance of these processes throughout the plant lineage. In fact, several studies have demonstrated that iron deficiency results in enhanced antioxidant mechanisms in plants, algae, and diatoms (Zaharieva and Abadía, 2003; Allen et al., 2008; Li et al., 2008; Thamatrakoln et al., 2012).
Ascorbate appears to be a key defense response. In C. reinhardtii, this occurs by upregulation of de novo ascorbate synthesis via VTC2 as well as by recycling via MDAR1 (Figure 7D). We showed that increased MDAR1 transcript abundance results directly in increased protein and enzyme activity and contributes to the as much as 10-fold increased abundance in ascorbate content.
Other conserved responses include some uncharacterized proteins, such as CGLD27, Cre10.g466050, Cre01.g061600, and Cre14.g609500, and homologs of Arabidopsis BTS, an E3 ligase with an iron binding site that is known to be involved in regulation of iron homeostasis (Table 4). The fact that these responses are conserved over a billion years of evolution underscores their importance and relevance and suggests that reverse genetic analysis of these uncharacterized proteins could be especially rewarding for deeper understanding of the cell biology of nutritional iron homeostasis. Since CGLD27 is conserved also in cyanobacteria and diatoms, but is not present in the genomes of nonphotosynthetic organisms (Karpowicz et al., 2011), we tested its relevance in Arabidopsis and found that cgld27 plants displayed an aggravated iron starvation phenotype, consistent with a function in iron homeostasis (Figure 8). Although CGLD27 is likely localized to plastid membranes, it is expressed in roots; therefore, it is unlikely to function directly in photosynthesis. Rather, it must have a role in some other fundamental metabolic pathway that is dependent on iron.
In two cases, the direction of regulation in C. reinhardtii versus a higher plant is opposite. This might be a consequence of the different functions of cells in a multicellular organism with specialized organs. For instance, the root is specialized for iron uptake from the soil, while the green organs are sinks for iron utilization. Ferritin is one example of this, where it is increased in high iron conditions in plant roots to buffer and detoxify excess assimilated iron, whereas in C. reinhardtii chloroplasts, it has a role in transient buffering of iron as it is released from the degradation of chloroplast iron proteins en route to the mitochondrion (Briat and Lobréaux, 1997; Busch et al., 2008).
A comparison of iron deficiency transcriptomes of five Arabidopsis ecotypes identified a small set of 10 upregulated genes in all ecotypes or 24 upregulated genes in four out of five ecotypes out of hundreds or more than a thousand differentially regulated genes within an ecotype (Stein and Waters, 2012). There is a striking overlap between this set of 10 core/24 common genes from the Arabidopsis ecotype study and the 14 genes identified in this contribution. Interestingly, ferritin, classically used as an indicator of iron status, is not upregulated, at least at the transcript level, in all Arabidopsis ecotypes.
Iron Assimilation: Transporters and Ferrireductases
Because of the importance of iron as a nutrient, most organisms have multiple pathways for assimilating iron from various chemical forms (ferrous versus ferric and chelated versus insoluble oxides). Previously, we identified a number of iron assimilation components, FRE1, FOX1, FTR1, FEAs, and IRTs (Figure 9), in C. reinhardtii based on homology to those in yeast, animals, and Arabidopsis (Philpott, 2006; Jeong and Guerinot, 2009). We suggest that some of the newly identified targets are probably also involved in iron transport (Table 1). For instance, we hypothesize that C. reinhardtii PMA2, orthologous to Arabidopsis AHA7 and with high sequence similarity to Arabidopsis AHA2, might have a role in medium acidification to solubilize Fe(III). Both Arabidopsis genes (AHA2 and AHA7) are induced in response to iron deficiency (Colangelo and Guerinot, 2004; Dinneny et al., 2008; Santi and Schmidt, 2009; Yang et al., 2010). AHA2 is responsible for rhizosphere acidification, whereas AHA7 is required for the formation of iron-induced root hairs (Santi and Schmidt, 2009).

A Model for Signaling and Response to Poor Iron Nutrition in C. reinhardtii.
The signal, shown as x, is unknown, as is/are the transcription factor(s) (Tf). The vacuole may be identical to the previously described acidocalcisome (see text). Iron homeostasis components whose function is consistent with experimental documentation (localization and expression) are shown in purple, while those whose functions are more hypothetical (and identified in this study) are shown in turquoise. The identity of the labile iron (Fe) pool is not known. Transporters involved in Fe2* import into chloroplast and mitochondria are not known (gray). mETC, mitochondrial electron transfer chain; pETC, photosynthetic electron transfer chain.
Two genes, Cre01.g010400 and Cre13.g588700, encode C. reinhardtii proteins of unknown function. The change in expression noted in this work is consistent with the increased abundance of the corresponding proteins in an earlier independent proteomic study of plasma membrane proteins from iron-deficient C. reinhardtii cells (Reinhardt et al., 2006). We hypothesize that Cre01.g010400 and Cre13.g588700 may be components in a novel iron assimilation pathway (like the FEAs), or, based on their location in the plasma membrane, they might play a role in sensing extracellular iron supply.
Once inside the cell, iron has to be distributed to different intracellular compartments where it is needed in essential iron-containing proteins (chloroplast and mitochondrial electron transfer chains) (Figure 9). Iron-deficient C. reinhardtii cells upregulate several genes encoding transporters with the potential to function in intracellular metal distribution. These include NRAMP4, Cre16.g687000 encoding ferroportin, Cre02.g107550 encoding a CCC1-like transporter, and ATM3 (Figure 9).
The NRAMP proteins are conserved from bacteria to humans. They catalyze the H*-dependent transport of divalent metal ions, such as Mn2*, Fe2*, Co2*, Zn2*, Ni2*, or Cd2* (Courville et al., 2006; Nevo and Nelson, 2006). The yeast genome codes for three NRAMP transporters (Sm1p, Smf2p, and Smf3p), of which Smf3p is vacuolar membrane localized and its expression is regulated by iron nutrition, whereas mammals have two, SLC11A1 and SLC11A2 (Portnoy et al., 2000; Singh et al., 2007). The C. reinhardtii genome codes for three NRAMPs (NRAMP1, NRAMP2, and NRAMP4). Mammalian SCL11A2 (also called DCT1/DMT1) functions in iron import into enterocytes, after reduction of ferric iron by ferric-reductase at the apical membrane, and in Fe2* transport from the endosome during the transferrin cycle (Riedel et al., 1995; Andrews, 2000). NRAMP3 and NRAMP4 in Arabidopsis are both induced by iron deficiency (Thomine et al., 2000) and function to mobilize iron from vacuoles during seed germination (Lanquar et al., 2005). C. reinhardtii NRAMP4 is induced by iron deficiency under both photoheterotrophic and photoautotrophic conditions. Changes in NRAMP4 mRNA abundances are specific to iron-deficient cells, whereas the NRAMP1 and NRAMP2 genes are induced specifically in manganese-starved cells. Bioinformatic analyses revealed that NRAMP4 from C. reinhardtii is more closely related to Arabidopsis NRAMP3/4 and mammalian DCT1 than to the other C. reinhardtii NRAMP proteins. Therefore, we hypothesize that C. reinhardtii NRAMP4 is involved in remobilization of vacuolar iron stores needed for essential processes (photosynthesis and mitochondrial respiration) during low iron nutrition. A compartment called the acidocalcisome has been described in C. reinhardtii (Ruiz et al., 2001). This compartment contains polyphosphate and metals and is a specialized vacuolar structure based on proteomic analysis of Cyanidioschyzon merolae acidocalcisomes that identified V-ATPase subunits (Yagisawa et al., 2009). In addition, at least two candidate metal transporters, including a protein related to S. cerevisiae Ccc1 and a cation diffusion facilitator family member (putative Zn transporter), were described.
Cre02.g107550 encodes a protein related to S. cerevisiae Ccc1p and Arabidopsis VIT1. Yeast Ccc1p and plant VIT1 are vacuolar membrane proteins involved in transport of iron from the cytosol into the vacuoles (Li et al., 2001; Kim et al., 2006). Although the upregulation of C. reinhardtii CCC1-like seems counterintuitive, it is possible that it functions under iron deficiency to only transiently store the potentially toxic iron released from degraded or damaged iron-sulfur proteins into the vacuoles prior to its redistribution to intracellular compartments. A similar pattern of expression and function have been documented for a vacuolar zinc transporter in S. cerevisiae (ZRC1) (MacDiarmid et al., 2003). The pattern of expression of C. reinhardtii CCC1 is consistent with the similar counterintuitive upregulation of chloroplast ferritin in iron deficiency, which has been demonstrated to function as a chloroplast iron buffer during remodeling of the photosynthetic apparatus in iron-starved cells (Busch et al., 2008; Long et al., 2008).
Cre16.g687000 encodes a ferroportin-like protein (FPN1). Similar expression profiles have been observed for plant ferroportin IREG2/FPN2 and IREG3/MAR1 (Table 4) (Colangelo and Guerinot, 2004; Buckhout et al., 2009; Zheng et al., 2009; Long et al., 2010; Yang et al., 2010). Arabidopsis FPN2 is localized to vacuolar membranes and MAR1 to the plastid envelope membranes. The proteins can apparently transport divalent cations like Co2* and Ni2*, besides Fe2* (Schaaf et al., 2006; Conte et al., 2009; Morrissey et al., 2009). Among the likely functions are provision of iron to the plastid or sequestration of other divalent cations to the vacuole. The latter function is necessary in iron-deficient cells because members of the ZIP family (like IRT1/2, which are induced) are not as selective for iron as is the FTR1/FOX1 pathway and may bring in unwanted, potentially toxic, ions. For instance, plant IRT proteins are known to transport Cd2* (Connolly et al., 2002). In this context, it is worth noting the upregulation of glutathione and phytochelatin synthesis (Table 1), which detoxify cadmium by sequestration of Cd-PC complexes (Howe and Merchant, 1992; Clemens, 2006). Interestingly, a gene encoding a ferric-reductase–like protein (Cre05.g241400) is also upregulated. This could function to reduce intracellular ferric to ferrous prior to transport into the vacuole or the chloroplast, by analogy to Fre6p in yeast or FRO7 in Arabidopsis (Singh et al., 2007; Jeong et al., 2008).
There are three genes encoding cytochrome b 561 family proteins (TEF22, Cre14.g609900, and Cre13.g586600). TEF22 and Cre14.g609900 have a DOMON domain fused to a cytochrome b 561 ferric-reductase domain and are more related to mammalian FRRS-like ferric-reductases than they are to plant homologs (see Supplemental Figure 5 online). Mouse, rat, human, and Drosophila melanogaster SDR2 (FRRS1) are indeed functional ferric reductases, and mouse SDR2 is also regulated by iron (Vargas et al., 2003). Expression of mammalian duodenal cytochrome b (Dcytb), which generates the Fe2* used by DCT1/DMT1, is likewise regulated by iron nutrition (McKie et al., 2001; McKie, 2008), and two other mammalian cytochrome b 561 homologs from chromaffin granules and lysosomes function as ascorbate-dependent ferric-reductases (Njus et al., 1987; Fleming and Kent, 1991; Fleming et al., 1997; Su and Asard, 2006; Zhang et al., 2006). These cytochrome b 561 ferric-reductases each possess four conserved His residues involved in coordination of two heme molecules and conserved sites for ascorbate and monodehydroascorbate binding (Trost et al., 2000; Takeuchi et al., 2004; Su and Asard, 2006). The C. reinhardtii proteins retain the conserved residues, making them likely to be true ferrireductases (see Supplemental Figures 4 and 5 online).
Proteomic studies indicated that TEF22 is in the mitochondrion (Allmer et al., 2006; Atteia et al., 2009), whereas localization prediction programs (WolfPsort) place Cre14.g609900 and Cre13.g586600 at the plasma membrane. Cre13.g586600 does not contain a DOMON domain and is homologous to ascorbate-dependent cytochrome b 561 ferric-reductases. Thus, we propose that TEF22 is a ferric-reductase involved in supplying ferrous iron for mitochondrial respiratory complexes, whereas Cre14.g609900 may work with FRE1 at the plasma membrane. Note that TEF22 is always more highly expressed in acetate- versus CO2-grown cells, consistent with the proposed function. In the case of Cre13.g586600, whose monodehydroascorbate and ascorbate binding sites are well conserved, it is possible that it could function in ascorbate regeneration from monodehydroascorbate at the plasma membrane or vacuolar membrane.
Regulation of Iron Homeostasis
In higher plants, a number of transcription factors have been identified as components of the iron signaling response, including FIT1/FER, PYE, bHLH115, and ILR3 (Ling et al., 2002; Colangelo and Guerinot, 2004; Brumbarova and Bauer, 2005; Bauer et al., 2007; Dinneny et al., 2008; Jeong and Guerinot, 2009; Long et al., 2010). In addition, there is a posttranslational component involving an E3 ubiquitin ligase BTS (Long et al., 2010). The conservation of BTS in C. reinhardtii (Cre05.g248550) and the identification of a bHLH transcription factor (Cre24g.7700450) whose expression is induced in iron-deficient C. reinhardtii, suggests that the signaling pathway is conserved despite the years of evolutionary distance (Tables 1 and 4). This is analogous to the situation for both Cu and P signaling where the C. reinhardtii proteins have orthologs with similar function in Arabidopsis (Wykoff et al., 1999; Rubio et al., 2001; Kropat et al., 2005; Yamasaki et al., 2009; Bernal et al., 2012). CDJ3/5 (which are unique to chloroplast-containing organisms), may also serve a posttranslational role, for instance in the regulated assembly of chloroplast iron-containing proteins (Dorn et al., 2010). The Fe/S site in these J-domain proteins may be iron-sensors. Unlike copper signaling in C. reinhardtii, where there is a single master regulator, iron signaling appears to be more complex. There are multiple types of FeREs and genes that respond with different kinetics or sensitivity to iron, indicating a complex network of iron sensing and signaling.
METHODS
Strains and Culture Conditions
Chlamydomonas reinhardtii strain 2137 (wild type, mt −) was a gift from Laurens Mets (Spreitzer and Mets, 1981) and has been deposited at the Chlamydomonas Culture collection under accession CC-4532. The strain was grown in Tris-acetate-phosphate (TAP) or minimal medium (TP) with Hutner's trace elements (Harris, 2009; Terauchi et al., 2010) at 24°C and 50 to 100 μmol m−2 s−1 photon flux density. Iron nutritional stages were achieved by maintaining the strain in standard TAP medium (20 μM iron) and then transferred to iron-free TAP (or TP) supplemented with Fe-EDTA at the indicated concentrations as described (Moseley et al., 2002). The minimal medium (i.e., CO2-grown) cultures were bubbled constantly with air. The metadata associated with the RNA-Seq experiments is available at http://genomes.mcdb.ucla.edu/CreIron/.
Plant Material and Growth Conditions
Arabidopsis thaliana ecotype Col-4 was used as the wild type. A mutant with a T-DNA insert in the CGLD27 gene (At5g67370) was obtained from the Salk T-DNA collection (SALK_023292). Plants were grown (50 µmol m−2 s−1, 12-h-light/12-h-dark cycle) at 23°C on 0.8% agar-solidified Murashige and Skoog medium including 1% Suc (Fisher Scientific) with various concentrations of FeCl3 as indicated.
Nucleic Acid Analysis
Total RNA was extracted from exponentially grown C. reinhardtii cells as described previously (Quinn and Merchant, 1998). RNA quality was assessed on an Agilent 2100 bioanalyzer and by RNA hybridization as described (Allen et al., 2007a). The probe used for detection of CBLP was a 915-bp EcoRI fragment from the cDNA insert in plasmid pcf8-13 (Schloss, 1990). cDNA synthesis and quantitative real-time PCR was performed on technical triplicates as described (Allen et al., 2007a) using gene-specific primers listed in Supplemental Table 1 online. The data are presented as the fold change in mRNA abundance, normalized to an endogenous reference gene (CBLP or UBQ2), relative to the sample grown in iron-replete (20 µM) TAP medium. The abundance of two reference genes, CBLP and UBQ2, did not change under the conditions tested. For RNA-Seq, total RNA preparations were sequenced at Illumina as pair-end 35-mers for photoheterotrophically grown samples and as single-end 100-mers for photoautotrophically grown cells. Raw and processed sequence files are available at the National Center for Biotechnology Information (NCBI) Gene Expression Omnibus (accession number GSE35305). Mapping the reads to the C. reinhardtii genome (version FM4 assembly, Augustus 10.2 annotation) and calculation of transcript abundances in RPKM were performed as described previously (Urzica et al., 2012). Fold changes were computed from the average expression levels of biological replicates after regularization (imputation) of missing values. Differential expression analysis was performed using the DESeq package (Anders and Huber, 2010). P values obtained from DESeq were adjusted for multiple testing using Benjamini-Hochberg correction (Benjamini and Hochberg, 1995) to control FDRs. Expression patterns of differentially expressed genes were clustered with the R package MBCluster.Seq (Y. Si, P. Liu, P. Li, and T.P. Brutnell, unpublished data), which implements a model-based clustering model based on a negative binomial distribution. The coverage graphs can be visualized at http://genomes.mcdb.ucla.edu/CreIron/.
Phylogenetic Analysis
Phylogenetic relationships were inferred using the Maximum Likelihood method based on the Whelan and Goldman model (Whelan and Goldman, 2001). The bootstrap consensus tree inferred from 1000 replicates (Felsenstein, 1985) is taken to represent the evolutionary history of the taxa analyzed. Branches corresponding to partitions reproduced in <50% bootstrap replicates are collapsed. The percentage (>75%) of replicate trees in which the associated taxa clustered together in the bootstrap test (1000 replicates) are shown next to the branches (Felsenstein, 1985). Initial trees for the heuristic search were obtained automatically as follows. When the number of common sites was <100 or less than one-fourth of the total number of sites, the maximum parsimony method was used; otherwise, BIONJ method with MCL distance matrix was used. The tree is drawn to scale, with branch lengths measured in the number of substitutions per site. All positions containing gaps and missing data were eliminated. Evolutionary analyses were conducted in MEGA5 (Tamura et al., 2011). Sequence alignments are presented in Supplemental Data Sets 10 to 16 online.
Sequence Analysis
Alignments of protein homologs/orthologs were performed using MUSCLE (http://www.ebi.ac.uk/Tools/msa/muscle). Protein similarity networks were generated from an all-versus-all BLAST analysis (pairwise alignment between all pairs of proteins) as described (Blaby-Haas and Merchant, 2012).
Quantitative Proteome Analysis
C. reinhardtii strain 2137 (CC-4532) was grown photoheterotrophically (TAP) in the presence of 20 μM iron (replete), 1 μM iron (deficient), and 0.25 μM iron (limited) in triplicate cultures inoculated separately from three independent starter cultures. C. reinhardtii cells were collected at a density of ∼5 × 10⁶ cells mL−1 by centrifugation at 3440g for 5 min at 4°C (JA-20 rotor; Beckman), washed with 10 mM sodium-phosphate, pH 7.0, collected by centrifugation, and resuspended in the same solution containing 1 mM PMSF and 5 mM EDTA to a final density of 4 × 10⁸ cells mL−1. Cells were broken by two slow freeze-thaw cycles from –80 to 4°C, and insoluble material was removed by centrifugation at 4°C (16,000g for 10 min [F-45-24-11 rotor, Eppendorf 5415R centrifuge] followed by 253,000g for 20 min [TLA-110 rotor; Beckman]). Approximately 30 µg of protein from each sample was separated by SDS-PAGE (4 to 12% NuPage Bis-Tris gels; Invitrogen). Each gel lane was sliced into ∼3-mm bands and treated with trypsin (sequencing grade modified trypsin; Promega). The resulting tryptic peptides were extracted into a 50/50 water/acetonitrile solution containing 2.5% (v/v) formic acid and lyophilized. Peptides were resuspended in 1% formic acid containing 25 fmol/μL BSA trypsin digestion standard (MassPREP BSA Digestion Standard; Waters) and analyzed as previously described (Castruita et al., 2011). Peptides were analyzed using a Waters nanoAcquity ultraperformance liquid chromatograph coupled to a Waters Xevo quadrupole time-of-flight mass spectrometer. Peptides were separated on a 5-µm Symmetry C18 180 µm × 20-mm reversed-phase trap column in line with a 1.7-µm BEH130, 75 µm × 100-mm reversed-phase C18 analytical column and eluted on a 60 min 3% acetonitrile/0.1% formic acid to 40% acetonitrile/0.1% formic acid gradient at a flow rate of 0.3 µL/min to the electrospray ionization mass spectrometer. The liquid chromatography mass spectrometer was operated in the mass spectrometry (Elevated Energy) (MSE) data independent acquisition mode (Silva et al., 2006a, 2006b; Geromanos et al., 2009), a method that collects product and precursor data in parallel by continually switching the collision energy between low (6 eV) and elevated energy (ramped from 15 to 40 eV) during alternating scans (mass-to-charge ratio 50 to 2000). Product ions are correlated to precursor ions using reconstructed retention times (i.e., alignment of liquid chromatography retention times of the precursors and products) and chromatographic peak shapes. At least two 1-μL replicate injections from each gel band were analyzed by liquid chromatography–mass spectrometry.
Liquid chromatography–mass spectrometry raw data were processed, and peptides/proteins were identified and quantified using Protein Lynx Global Server (PLGS version 2.4; Waters) described by Li et al. (2009). Peptides were searched against the Augustus 10.2 protein database modified by replacement of some catalog models with individual user-curated models and supplemented with sequences for keratin, trypsin, BSA, and chloroplast and mitochondrial proteins from NCBI. Searches were limited to trypsin proteolysis fragments, and peptide precursor and product ion mass tolerances were set to 20 and 40 ppm, respectively. Other search parameters include minimum number of peptide matches (Castruita et al., 2011), minimum number of product ions per peptide (Geromanos et al., 2009), minimum number of product ions per protein (Geromanos et al., 2009), maximum number of missed tryptic cleavage sites (Geromanos et al., 2009), and maximum false positive rate (4%) (Li et al., 2009). Carbamidomethylation of Cys residues was set as a fixed modification, and Met oxidation, Asn and Gln deamidation, and N-terminal acetylation were set as variable modifications. For additional stringency, we required that a protein be detected in at least two different conditions to be considered identified and required that a protein be observed in two of three biological replicates in each condition to be considered quantifiable. The quality of replicates can be evaluated in Supplemental Data Set 7 online, sheet labeled “experimental replicates.”
Quantification of protein levels was achieved by the addition of an internal protein standard (BSA trypsin digest standard) to which the data set is normalized and uses up to the three most abundant shared peptides as described (Silva et al., 2005, 2006a, 2006b) to determine protein abundance. Changes in protein abundance were then determined based on whether they showed a statistically significant (P < 0.05 by student's t test) increase or decrease in abundance of at least 2-fold in magnitude between the iron-replete and iron-limited conditions. Proteins that were detected in only one of the conditions were included in the analysis only if their abundances were over 20 μmol/cell. Therefore, 992 proteins were identified in this analysis, of which ∼524 could be quantified reliably.
Monodehydroascorbate Reductase Activity
A total of 2 × 10⁸ cells were collected by centrifugation at 2500g for 3 min and washed in 10 mM sodium phosphate, pH 7.0. For monodehydroascorbate reductase activity measurements, cells were washed in 50 mM Tris-Cl, pH 7.0, and resuspended in 100 μL extraction buffer containing 50 mM K-PO4, pH 7.5, 1 mM DTT, and 10% glycerol. The cells were broken by three freeze/thaw cycles and the soluble extracts separated by centrifugation at 16,100g for 10 min at 4°C. Protein concentration was determined by the Lowry method against a bovine BSA standard. Monodehydroascorbate reductase (MDAR1) activity was determined as described previously (Miyake and Asada, 1992). The decrease in absorbance at 340 nm due to oxidation of NADH was monitored in a 1-mL reaction mixture containing 50 mM K-PO4 buffer, pH 7.5, 0.25 mM NADH, 2.5 mM ascorbate, 10 μL C. reinhardtii cell extract containing ∼35 to 50 μg of protein, and 0.5 units of ascorbate oxidase (from Cucurbita sp, EC 1.10.3.3, Sigma-Aldrich product A0157). The reaction was initiated by addition of ascorbate oxidase. The specific activity was calculated using the 6.22 mM−1 cm−1 extinction coefficient after the rate of nonspecific NADH oxidase was subtracted.
Ascorbate Measurement
Vitamin C content was measured as described previously (Urzica et al., 2012).
Immunoblot Analysis
Proteins were separated by denaturing PAGE (10 to 15% monomer), transferred to polyvinylidene fluoride, and detected as described (Chen et al., 2008). Primary antibody dilutions were ferroxidase (1:300) and CF1, (1:10,000). The primary antibody was diluted in blocking buffer and incubated at room temperature for 90 min. A 1:3000 dilution of goat anti-rabbit alkaline phosphatase (Southern Biotech) in blocking buffer was used as the secondary antibody for colorimetric detection with nitroblue tetrazolium and 5-bromo-4-chloro-3-indolylphosphate.
Chlorophyll Content Determination and Fluorescence Emission Analysis
Chlorophyll was extracted, and its concentration was estimated as described (Moseley et al., 2002). Room temperature fluorescence parameters were measured using an open FluorCam detector (Photon Systems Instruments). Fluorescence emissions were recorded from liquid cultures of cells after dark adaptation periods of at least 5 min. After measuring of the dark-adapted fluorescence level, F 0, to measure the maximum fluorescence level, F m, an 800-ms duration pulse of saturating light radiation (>1800 µmol photon m−2 s−1) was applied followed by a 40-ms delay in darkness and subsequently 10 ms of actinic illumination with saturating flashes at 20-ms intervals. The maximal photochemical efficiency of photosystem II (F v/F m) was calculated as (F m − F 0)/F m.
Gene Model Correction and Functional Annotation
To manually correct gene models, the JGI browser for the C. reinhardtii v4 draft genome assembly (http://genome.jgi-psf.org/Chlre4/) was accessed. RNA-Seq data and ESTs mapped against the C. reinhardtii v4 draft genome assembly (http://genomes.mcdb.ucla.edu/Cre454/) available on the University of California, Santa Cruz genome browser were accessed to compare gene models against transcriptome data. Gene models were corrected using predicted models, RNA-Seq data, ESTs, and protein homology as guides. Hypothetical proteins with poor coverage were ignored for the manual curation.
The protein sequences of all differentially expressed transcripts from Supplemental Data Set 2 online (acetate and photoheterotrophic) and Supplemental Data Set 3 online (CO2 and photoautotrophic), respectively, were analyzed at the Pfam site (E-value 1 × 10⁻⁴) and by individual BLASTp analysis at NCBI or Phytozome. The protein domains were grouped according to their function in 14 categories: unknown, other, nucleic acid metabolism, signaling, redox and stress response, transporters, kinases and phosphatases, cell structure and function, proteases, carbon metabolism, photosynthesis, lipid metabolism, respiration, and amino acid metabolism. Unknowns refer to protein sequences for which a domain could not be identified or if the domain was identified as having an unknown function. Domains that could not be classified in any specific category were grouped into the “others” category.
Accession Numbers
C. reinhardtii strain 2137 (wild type, mt −) has been deposited at the Chlamydomonas Culture collection under accession number CC-4532. RNA-Seq data are available at the NCBI Gene Expression Omnibus under accession number GSE35305. Supplemental Data Sets 1 to 16 are available at datadryad.org under accession number doi:10.5061/dryad.7sq5c.
Supplemental Data
The following materials are available in the online version of this article.
Supplemental Figure 1. Common and Distinct Genes Targeted in Photoautotrophically versus Photoheterotrophically Grown C. reinhardtii Cells.
Supplemental Figure 2. Fold Changes Estimated from RNA-Seq versus Real-Time PCR Experiments Are Well Correlated.
Supplemental Figure 3. NRAMP4 Homologous Sequences Are Highly Conserved in Algae, Plants, and Animal Species.
Supplemental Figure 4. C. reinhardtii TEF22 Is Similar to Animal Ferric-Reductases.
Supplemental Figure 5. Sequence Analysis of Cyt b 561 Domain-Containing Proteins.
Supplemental Figure 6. C. reinhardtii Genome Encodes Two VIT1-Like Proteins.
Supplemental Figure 7. C. reinhardtii Ferric Reductase-Like Protein (Cre05.g241400) Is Closely Related to Plant Ferric Reductases.
Supplemental Figure 8. C. reinhardtii Ferroportin Shows High Sequence Similarity to Algal, Plant, and Animal Ferroportins.
Supplemental Figure 9. Iron Limitation Induces Changes in Abundances of Transcripts Encoding Enzymes Required for Carotenoid Biosynthesis.
Supplemental Figure 10. Plant and Algal Hemerythrin-E3 Ligase-Like Proteins Are Highly Conserved.
Supplemental Figure 11. C. reinhardtii CGLD27 (Cre05.g237050) Shows High Sequence Similarity to Algal, Plant, and Cyanobacterial ycf36 Proteins.
Supplemental Figure 12. Promoter Analysis of Genes Differentially Expressed under Iron Deficiency.
Supplemental Figure 13. C. reinhardtii Basic Helix-Loop-Helix Transcription Factor (Cre24.g770450) Is Related to Subgroup IV of Plant bHLH Transcription Factors.
Supplemental Figure 14. Changes in mRNA Abundances of Genes Encoding the Enzymes of Tetrapyrrole Metabolism in C. reinhardtii.
Supplemental Table 1. Primer Sequences Used for Real-Time PCR.
Supplemental Data Set 1. Summary of RNA-Seq Statistics (Sheet1) and Transcript Abundance for All Augustus 10.2 C. reinhardtii Genes (Sheet 2).
Supplemental Data Set 2. Differentially Accumulating RNAs in Photoheterotrophic Conditions (Three Sheets).
Supplemental Data Set 3. Differentially Accumulating RNAs in Photoheterotrophic Conditions (Three Sheets).
Supplemental Data Set 4. Differentially Accumulating RNAs in Photoautotrophic versus Photoheterotrophic Conditions (10 Sheets).
Supplemental Data Set 5. Comparison of mRNA Abundances for Genes Encoding Metal Transporters.
Supplemental Data Set 6. Comparison of mRNA Abundances for Genes Encoding Enzymes of the Isoprenoid and Carotenoids Biosynthesis/Degradation Pathways.
Supplemental Data Set 7. Summary of Protein Abundances from MSE Analysis (Two Sheets).
Supplemental Data Set 8. Comparison of mRNA Abundances for Genes Encoding Carbon Metabolism Proteins.
Supplemental Data Set 9. Comparison of mRNA Abundances for Genes Encoding Subunits of the Tetrapyrrole Biosynthesis and Degradation Pathways.
Supplemental Data Set 10. Amino Acid Sequence Alignment Used to Produce Figure 5B.
Supplemental Data Set 11. Amino Acid Sequence Alignment Used to Produce Supplemental Figure 5B.
Supplemental Data Set 12. Amino Acid Sequence Alignment Used to Produce Supplemental Figure 6B.
Supplemental Data Set 13. Amino Acid Sequence Alignment Used to Produce Supplemental Figure 7B.
Supplemental Data Set 14. Amino Acid Sequence Alignment Used to Produce Supplemental Figure 8B.
Supplemental Data Set 15. Amino Acid Sequence Alignment Used to Produce Supplemental Figure 10B.
Supplemental Data Set 16. Amino Acid Sequence Alignment Used to Produce Supplemental Figure 13B.
Acknowledgments
This work was supported by the Division of Chemical Sciences, Geosciences, and Biosciences, Office of Basic Energy Sciences of the U.S. Department of Energy (DE-FD02-04ER15529).The mass spectrometry and bioinformatic analyses of Illumina sequencing data were supported by the University of California–Los Angeles Department of Energy Institute of Genomics and Proteomics (DE-FC03-02ER63421 to J.A.L., S.S.M., and M.P.) and the analysis of ascorbate metabolism by the National Institutes of Health (GM026020 to S.G.C.). S.I.H. and S.J.K. acknowledge support from an Institutional Ruth L. Kirschstein National Research Service Award (GM07185), C.E.B.-H. from an Individual Kirschstein National Research Service Award (GM100753), L.N.A. from University of California–Los Angeles Graduate Division, and H.Y. from the Toyobo Foundation. We thank Janette Kropat and Martin Lohr for help with the figures on the chlorophyll and carotenoids metabolism pathways.
AUTHOR CONTRIBUTIONS
S.S.M. conceived the project. S.S.M., E.I.U, H.Y., and S.I.H. designed the experiments. E.I.U., H.Y., L.N.A., and S.I.H. performed the experiments. D.C. performed the bioinformatic analysis of RNA-Seq data and generated Figure 3B, Supplemental Figure 1D online, and Supplemental Figure 12 online. M.P supervised all bioinformatic analysis. S.J.K. and C.E.B.H. corrected gene models and generated Figure 8A and Figure 5, respectively. J.A.L. and S.G.C. contributed new analytical tools and designed experiments. S.S.M., E.I.U., L.N.A., and S.I.H. analyzed the data. S.S.M., and E.I.U. prepared the article. All authors commented on the article.
Glossary
- PSI
photosystem I
- RPKM
reads per kilobase of exons in each model per million of aligned reads
- FDR
false discovery rate
- JGI
Joint Genome Initiative
- Col-4
Columbia-4
- FeRE
iron response element
- bHLH
to be defined
- TAP
Tris-acetate-phosphate
- NCBI
National Center for Biotechnology Information
- MSE
to be defined
References
Author notes
Current address: Department of Biology, University of Central Oklahoma, Edmond, OK 73034.
Address correspondence to [email protected].
The author responsible for distribution of materials integral to the findings presented in this article in accordance with the policy described in the Instructions for Authors (www.plantcell.org) is: Sabeeha S. Merchant ([email protected]).

Online version contains Web-only data.

Open Access articles can be viewed online without a subscription.
