


Abstract
There has been limited research on the abiotic and biotic factors affecting the prevalence of phago-mixotrophy (prevMixo) among nanophytoplankton across freshwater ecosystems. In recent years, large-scale sampling campaigns like the EPA-National Lakes Assessment and the NSERC LakePulse survey have generated surface water community composition data for hundreds of lakes across North America, covering large environmental gradients. We present results from our analyses of the nanophytoplankton community data from these two surveys, focusing on a taxonomic comparison of the mixoplankton communities across ecoregions and multivariate analyses of the environmental drivers of the prevMixo. We identified potentially phago-mixotrophic taxa in the majority of sites and across all ecozones sampled. Lake trophic state was identified as the main predictor of nanophytoplankton resource-acquisition strategy assemblages, with lower prevalence and diversity of mixoplankton communities in more eutrophic lakes. Lake trophic state also controlled the composition of the mixoplankton community and increased total phosphorus levels were associated with a loss of mixoplankton diversity. This study represents the most comprehensive assessment of the prevMixo in lake nanophytoplankton communities to date spanning hundreds of sites and a dozen ecozones.
INTRODUCTION
Many nanophytoplankton taxa have flexible feeding behavior. In particular, some taxa are phago-mixotrophic (mixoplankton), able to acquire energy and nutrients necessary for their growth through both photosynthesis (photo-autotrophy) and predation (phago-heterotrophy) (Flynn et al., 2019). Phago-mixotrophy is a widespread functional trait within nanophytoplankton communities, and is found in all aquatic ecosystems (Flynn et al., 2013; Faure et al., 2019). This generalist nutrition strategy likely allows mixoplankton to thrive in environments that would be otherwise unfavorable to pure autotrophs. In contrast, the supposed underlying investment trade-off between photosynthetic and phagotrophic physiological structures is thought to make phago-mixotrophy less advantageous under conditions of high resource availability (Raven, 1997; Ward et al., 2011), although the applicability of the notion of trait trade-off to mixoplankton is contested (Mitra et al., 2023b). Phago-mixotrophy should thus play a major role in the assemblage of nanophytoplankton communities along environmental gradients. Overall, the relative prevalence of phago-mixotrophy (prevMixo) is likely to have important consequences for ecosystem functions, and correctly assessing the prevalence of alternative nutrition strategies like phago-mixotrophy is crucial to accurately estimate primary production and carbon transfer to higher levels of the food chain (Leles et al., 2018).
The composition of nanophytoplankton assemblages in terms of their resource-acquisition strategies is potentially controlled by a variety of biotic and abiotic factors. Foremost, as an alternative strategy for resource acquisition, nutrient and light availability can be expected to be important drivers of mixoplankton prevalence in aquatic systems. Several observational studies show an increased prevMixo under nutrient-poor conditions (Arenovski et al., 1995; Saad et al., 2013; Schneider et al., 2020). Under such conditions, phagotrophy allows mixoplankton to complement their nutrient uptake and to outcompete purely autotrophic phytoplankton. The effect of light availability is less straightforward. Some mixotrophs can dominate the nanophytoplankton community under low-light conditions present under high colored dissolved organic carbon (DOC), as they can compensate reduced photosynthetic activity with grazing on bacteria (Bergström, 2009; Mitra and Flynn, 2023). Conversely, other studies have shown that some mixoplankton taxa need high levels of light to dominate the community, as they obtain the bulk of their carbon intake through photosynthesis and use phagotrophy mainly to complement their nutrient uptake (Calbet et al., 2012). Indeed, mixoplankton biomass appears to be greater in high-irradiance marine environments (Edwards, 2019). The effect of light on resource-acquisition strategy assemblages in lakes might thus depend on individual phago-mixotrophic physiology.
In lakes, nutrient and light gradients are affected by a variety of environmental factors, including climate, lake watershed usage and site morphometry. Mixotrophs could potentially benefit from clearly defined resource gradients that create local conditions of light and nutrient availability favorable to taxa that can complement their growth through phagotrophy. The distribution of some mixotrophs within thermally stratified lakes can be vertically structured (Bird and Kalff, 1987; Clegg et al., 2007). The physical structure of the environment can thus also affect mixotrophs, as the stratification status of the water column will determine how heterogeneous nutrient availability is with accumulation generally in deeper lake strata. Thus, deeper stratified lakes with a high-temperature differential between water column strata could potentially be more favorable surface water environments for mixotrophs. Moreover, water temperature itself could be relevant, although the literature currently offers contrasting assessments of its effect on mixoplankton activity, with higher water temperatures promoting photosynthesis overgrazing in short-term experiments (Ferreira et al., 2022), and on the other hand, Lepori-Bui et al. (2022) reporting that long-term adaptation to increased temperatures lead to more phagotrophic activity in phago-mixotrophic nanoflagellates.
Food web interactions may also modulate the trophic composition of nanophytoplankton communities. Hansson et al. (2019) showed that high biomass of selective zooplankton feeders, like copepods, was associated with an overall lower contribution of mixotrophs to nanophytoplankton communities in boreal lakes. They attributed this result to potential differences in stoichiometry between autotrophic and phago-mixotrophic prey with less variable composition expected for mixoplankton. They also noted that the abundance of bacteria could be a potential biotic driver of the prevalence of mixotrophs. It is worth noting that bacterial abundance is itself driven by environmental parameters such as DOC and inorganic nutrient abundance, implying potential indirect effects of those abiotic variables on mixoplankton abundance.
Large-scale biogeographical studies of mixotrophs have been conducted for the global ocean (Leles et al., 2017; Faure et al., 2019; Schneider et al., 2020), but there have been few equivalent efforts in freshwaters. Freshwater biogeographic analyses of alternative resource-acquisition strategies in relation to environmental gradients have been limited to relatively small geographical areas and limited to a relatively small lake set. In particular, Saad et al. (2016) highlighted to importance of trophic conditions for the success of mixotrophs in a study encompassing 24 oligotrophic to mesotrophic lakes in Patagonia combined with ingestion experiments. Hansson et al. (2019) examined the prevMixo in boreal lakes across 69 sites in eastern Canada. Thus, we lack a clear picture of the occurrence of plankton phago-mixotrophy at larger geographical scales and over extended environmental gradients. The recent completion of the large-scale 2017 EPA-National Lakes Assessment (NLA) survey in the USA (EPA NLA, 2009) and the NERSC-Lake Pulse (LakePulse, LP) survey in Canada (Huot et al., 2019) offers a possibility to address this knowledge gap. These surveys involved the measurement of many biotic and abiotic variables, including microscopic identification of nanophytoplankton communities and together cover more than 1700 lakes across the entire continental USA and over a sizable portion of Canada. The sampling methodology of the LP survey was chosen to match those of the NLA surveys, thus combining the results into a unique data set enabling the continental-scale study of nanophytoplankton assemblages of resource-acquisition strategies. Our main hypothesis is that these assemblages will respond to resource availability conditions (light, nutrient and bacterial abundance). We expect an effect of nutrient availability and a shift to higher phago-mixotrophic taxon prevalence in more oligotrophic sites. More broadly, the combined surveys allow us to assess the response of mixoplankton to a wide variety of biotic and abiotic predictors (e.g. zooplankton community, lake morphology and water physico-chemistry) to identify the most important environmental predictors of the prevalence of the phago-mixotrophic trait in lentic freshwater ecosystems.
METHODS
Combining the data from the NLA and LP surveys
A total of 664 lakes were sampled once across Canada during the NSERC Canadian Lake Pulse survey (abbreviated as LP) campaign during the height of summer (July–August) period in 2017, 2018 and 2019 (approximately one-third of lakes sampled per year). For the EPA-NLA survey, 1 113 distinct lakes were sampled across the continental USA (excluding Alaska). Some lakes (97 sites total) were sampled twice over the course of the NLA campaign: in those instances, both records were kept in the analyses when the time lag between them was ≥30 days (long enough to permit several generations of community turnover). When the time lag was < 30 days, the sampling event closest to 1 August (mid-point of the summer season in North America) was used in subsequent analyses. Overall, the lakes covered 12 ecoregions (Level I ecoregion as defined by the EPA) across North America (Fig. 1). Ecoregions define areas where ecosystems (terrestrial and aquatic) are broadly similar (Commission for Environmental Cooperation, 1997), and are thus a useful geographical unit in ecological studies. Data measured at each site in both surveys included water-chemistry parameters, climate variables, site morphometric characteristics, nanophytoplankton and zooplankton composition (Table I).
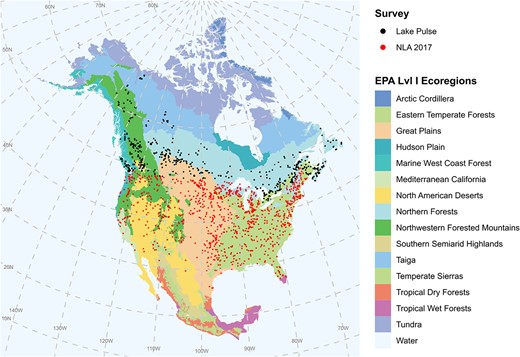
Map showing the locations of the lakes that were sampled during the NLA 2017 survey (1149 sites) and LP pan-Canadian lakes survey (640 sites) and for which nanophytoplankton community composition data were available. This map was created using the NAD83 spatial reference system.
Summary information on the environmental and biotic variables used as predictors in the statistical analyses
| Predictor | Abbreviation | Unit | Survey |
|---|---|---|---|
| Survey | NLA and LP | ||
| Ecoregion | NLA and LP | ||
| Elevation at lake coordinates. | Altitude | m | NLA and LP |
| Surface area of the lake. | Area | km2 | NLA and LP |
| Perimeter length of the lake. | Perimeter | m | NLA and LP |
| Depth of the lake at the sampling site. | Depth_site | m | NLA and LP |
| Water sodium concentration. | Sodium | mg.L−1 | NLA and LP |
| Water calcium concentration. | Calcium | mg.L−1 | NLA and LP |
| Water magnesium concentration. | Magnesium | mg.L−1 | NLA and LP |
| Water chloride concentration. | Chloride | mg.L−1 | NLA and LP |
| Water potassium concentration. | Potassium | mg.L−1 | NLA and LP |
| Water sulfate concentration. | Sulfate | mg.L−1 | NLA and LP |
| Mean temperature (sampling tube length) | Temperature_up | °C | NLA and LP |
| Mean temperature (bottom meter of the water column). | Temperature_bottom | °C | NLA and LP |
| Mean pH value (sampling tube length) | pH_up | pH unit | NLA and LP |
| Mean pH value (bottom meter of the water column). | pH_bottom | pH unit | NLA and LP |
| Mean concentration of DO (sampling tube length) | DO_up | mg.L−1 | NLA and LP |
| Water conductivity. | Conductivity | mS.cm−1 | NLA and LP |
| TP concentration in surface water sample. | TP | μg.L−1 | NLA and LP |
| Total nitrogen concentration in surface water sample. | TN | mg.L−1 | NLA and LP |
| DOC concentration. | DOC | mg.L−1 | NLA and LP |
| Water color. | Color | APHA PT-CO/PCU scale unit | NLA and LP |
| Mean wind speed over the 30 days prior to sampling. | Wind_30d | m.s−1 | NLA and LP |
| Mean temperature over the 30 days prior to sampling. | T2m_30d | °C | NLA and LP |
| Net mean Surface Solar Radiation over the 30 days prior to sampling. | SSR_30d | J.m−2.day−1 | NLA and LP |
| Total sum of precipitation over the 30 days prior to sampling. | TotPrec_30d | m | NLA and LP |
| Number of Degree days. | DegreeDay | °C | NLA and LP |
| Cladoceran biomass. | Biom_Cladocera | μg.L−1 | NLA and LP |
| Calanoid biomass. | Biom_CopCal | μg.L−1 | NLA and LP |
| Cyclopoid biomass. | Biom_CopCyc | μg.L−1 | NLA and LP |
| Zooplankton biomass (Cladocera + Copepoda). | Biom_Zoo | μg.L−1 | NLA and LP |
| Mean Relative Thermal resistance | meanRTR | No units (ratio) | NLA and LP |
| CO2 partial pressure in surface water. | pCO2 | Parts per million (ppm) | LP |
| CH4 partial pressure in surface water. | pCH4 | Parts per million (ppm) | LP |
| Averaged photon flux density. | PDP | μmol.photon.m−2.s−1 | LP |
| Spectral irradiance at 440 nm. | SI_440 | μmol.photon.m−2.s−1.nm−1 | LP |
| Spectral irradiance at 665 nm. | SI_665 | μmol.photon.m−2.s−1.nm−1 | LP |
| Fraction of natural landscape within the watershed. | NatLandscapes_frac | No units (percentage) | LP |
| Fraction of agricultural landscape within the watershed. | Agriculture_frac | No units (percentage) | LP |
| Fraction of urbanized lands surface within the watershed. | Urban_frac | No units (percentage) | LP |
| Bacterial abundance | Bacterial_ab | cell.mL−1 | LP |
| Shoreline development (ratio between shoreline length and the circumference of a circle with the same area). | ShoreDev | No units (ratio) | LP |
| Total lake volume. | Vol_total | Million of m3 | LP |
| Average depth over the entire lake. | Depth_avg | m | LP |
| Average long-term discharge. | Dis_avg | m3.s−1 | LP |
In addition to basic geographical information (latitude, longitude and altitude), information on site morphometry included lake perimeter and lake surface. Lake depth at the sampling point was also recorded. Sampling was at the deepest point of the lake for LP lakes. For NLA lakes, sampling was done at a point close to the lake’s center for which depth was not >50 m. In situ vertical depth profiles of key physico-chemical parameters were taken using multiparameter probes for estimating: mean temperature, pH and dissolved oxygen (DO) concentration of the upper surface layer (surface to the minimum between 2 m and the lower depth of the photic zone) and the bottom layer (maximum profile depth to 1 m above this depth for the mean temperature and pH; the mean DO concentration in the bottom layer was not included as a predictor because of an elevated number of missing values for this variable). Mean conductivity in the surface layer was also assessed from depth profiles for LP lakes. For NLA sites, conductivity was measured in the lab from an integrated surface water sample. Using aggregated profile temperature estimates (1 m averages), a measure of water mass stability, the mean Relative Temperature Resistance (meanRTR), was estimated by computing the salinity-corrected water densities differences of all adjacent 1-m layers of the profiles (Birge, 1910; Longhi and Beisner, 2009). Density (ρ) differences were then divided by the density difference of water at 4°C and 5°C and averaged, using the following formula:
where n is the number of temperature layer pairs. Sites with higher values of meanRTR have relatively steep temperature gradients from the top to the bottom of the water column and are thus more thermally stable sites (less susceptible to mixing).
Surface water samples were collected and processed in the lab to estimate nutrient [TN, total phosphorus (TP)], DOC, dissolved inorganic carbon (DIC) and ion concentrations. Water color (in Platinum-Cobalt unit) was measured for NLA lakes from surface water samples. In LP lakes, water color was instead estimated from light absorption coefficient values at 440 nm (Cuthbert and del Giorgio, 1992). Conductivity and the various ionic concentrations (Sodium, Calcium, Magnesium, Potassium, Sulfate and Chloride) were all highly correlated, thus needlessly inflating the dimensionality of the data set. A PCA was thus performed to summarize the shared variability (Fig. S1a), and the resulting first axis (chemPCA1) was used in subsequent analyses instead of the raw predictors.
Climate variables were obtained from the ERA-5 land hourly climate data set (Muñoz-Sabater et al., 2021), which provides a variety of climate land variables over a 0.1° × 0.1° latitude-longitude grid resolution, at hourly intervals. The raw data were obtained through the dedicated API request system of the Copernicus platform (https://cds.climate.copernicus.eu/cdsapp#!/home). Climate attribute values were extracted at the pixel of the grid corresponding to each lake’s geographical coordinates. Variables available at all sites included mean wind speed, mean temperature 2 m above ground, net mean surface solar radiation and total precipitation. These variables were all averaged over 30 days prior to the lake’s sampling date. The total number of degree days for each sampling year (with a temperature threshold of 0°C) was also computed.
The composition of the nanophytoplankton community (i.e. pigmented microorganisms with equivalent spherical diameter roughly between 2 and 20 μm) was assessed from integrated water samples taken in each lake from the surface to 2-m depth or down to the deepest limit of the photic zone (assessed using a Secchi disk), whichever was shallower, using a sampling tube. In each survey, nanophytoplankton taxa were identified by expert taxonomists and enumerated using the Ütermohl method on an inverted microscope (up to ×1000 magnification). Biovolumes (in mm3.m−3) were determined using geometric formulae corresponding to the shapes of the taxa using cell dimensions measured in each sample (Hillebrand et al., 1999). The composition of the crustacean zooplankton community was also assessed from vertical water samples collected from hauling meshed nets. Zooplankton community composition in NLA was assessed from two vertical samples collected using a fine mesh net (50 μm) and a coarse mesh net (150 μm), with a vertical cumulative 5-m tow for each net. In contrast, a single 100-μm mesh net hauled from 1 m above the sediments to the surface was taken in the LP survey. Zooplankton taxa were then identified and enumerated by expert taxonomists, using length-weight regressions to estimate taxon biomasses and to calculate total biomasses for aggregate groups: calanoid copepods, cyclopoid copepods and cladocerans.
All variables measured in both surveys were combined to create a unified data set, ensuring that measurement units were the same across the two surveys. Of the 1789 sites with nanophytoplankton community composition data, only 1162 sites had complete records for all environmental variables. To retain more than 1162 sites in subsequent analyses, a data imputation procedure was implemented using the missForest R package (Stekhoven and Bühlmann, 2012) after removing sites missing measurements > 4 environmental variables. Note that this imputation procedure was not applied to nanophytoplankton community data, only to the data set of environmental predictors. At the end of this process, 1652 sites (LP, 570; NLA, 1082) had complete records for both environmental variables and phytoplankton taxonomic assessments.
Data specific to the LP survey
The field and lab methods used during the LP and NLA campaigns in 2017 were identical for most environmental measurements, as both those surveys based their methodology on that used in the NLA 2012 campaign (Huot et al., 2019). The biggest obstacle in combining the data from the two surveys was the fact that potentially relevant environmental parameters, for example measurements relative to light availability conditions and bacterial abundances, were only available for the LP survey (Table I). This warranted additional analyses exclusively on LP lakes. Some LP sites had missing measurements for predictors exclusive to the LP survey and were consequently removed before analyses, resulting in a data set of 452 sites with complete records for predictors exclusive to LP.
Additional information on the morphometry of LP lakes (lake volume, average depth, average discharge and shoreline development) was retrieved from the HydroLAKES database (Messager et al., 2016). Because of the high level of collinearity between some of these morphometry variables (e.g. high area lakes tend also have high volumes), a PCA was performed to summarize the shared variability (Fig. S1b). The coordinates of the sites over the first two dimensions of this PCA plan were then used as predictors in subsequent statistical analyses instead of the raw HydroLAKES attributes. Information about the size of the watershed and the associated land-use types (i.e. the relative percentages of natural, agricultural and urbanized land within the watershed) was inferred using GIS (Huot et al., 2019). Light availability variables were estimated as the daily mean photon flux density over the mixed layer (averaged over the 2 weeks prior to the sampling date) and as the mixed layer averaged spectral irradiance at 440 and 665 nm. These were based on surface irradiance data obtained from the CERES CER_SYN1deg-MHour_Terra-Aqua-MODIS_Edition4A data set (NASA/LARC/SD/ASDC, 2017) and epilimnion light extinction coefficients (kd) measured with the spectral profilers Hyperpro (Satlantic, Canada, 43 lakes) or C-OPS (Biospherical Instruments, USA, 208 lakes), with the remaining lakes’ kd estimated following Lee et al. (2005) from absorption and backscattering measurements. The CO2 and CH4 partial pressures of surface water were determined using the headspace technique at the deepest point in each lake (UNESCO/IHA, 2010; Koschorreck et al., 2021) from sample taken on the field using a cavity ring down spectrometer equipped with a small sample isotopic module (Picarro G2201-I, Picarro Inc., CA, USA). Finally, bacterial abundance at each site was estimated from flow cytometry analyses using an Accuri C6 flow cytometer (BD Bioscience, San Jose, CA, USA).
Estimating the prevalence of phago-mixotrophy prevMixo
The assessment of nutrition strategies (pure phototroph, mixotroph or pure phagotroph) of all taxa identified was based primarily on published databases of nanophytoplankton functional traits, on journal publications or taxonomic inference. All diatoms and cyanobacteria were considered autotrophic, as no taxa from these two groups is physiologically able to perform phagotrophy. The following published databases of phytoplankton traits were used: Laplace-Treyture et al. (2021), Rimet and Druart (2018) and HELCOM (Olenina et al., 2006). However, the databases were sometimes inconsistent with one another, or simply did not include taxa from our surveys, as they covered different geographical areas or marine species. When the strategy of a given genus could not be established with certainty, a dedicated literature search was conducted for feeding behavior. Publications reporting results from ingestion experiments were of particular interest. If no information was found for a particular genus, its strategy was inferred from those of closely taxonomically related taxa. Overall, a database of nutrition strategies for over 270 genera present in North American lakes was produced. Using this database of nutrition strategies, the total biovolumes of the phago-mixotrophic and autotrophic portion of the nanophytoplankton assemblage were computed at each site. The prevMixo at a given site was then defined as the proportion of mixoplankton biomass within the overall nanophytoplankton community, i.e. the ratio between the total mixoplankton biomass and total (total autotrophic + total phago-mixotrophic) biomass. The biovolumes of purely phagotrophic (i.e. not phago-mixotrophic or phototrophic) taxa were excluded. The resulting index ranges from 0 (no mixotrophs detected in the community) to 1 (all taxa identified in the community are phago-mixotrophic).
Analyses of mixoplankton community composition and diversity
The effect of environmental variables on the composition of the phago-mixotrophic portion of the community was investigated using redundancy analyses (RDA). Predictors were log-transformed and standardized prior to analysis and a Hellinger transformation was applied to the mixotroph biomasses to limit the weight of rare taxa (Legendre and Gallagher, 2001). In addition, the list of predictors included in the analysis was refined by sequentially removing predictors with a Variance Inflation Factor (a measure of the collinearity of a variable with other predictors in a given data set) score superior to 10 to minimize collinearity in the analyses (Belsley et al., 1980). The diversity of the nanophytoplankton communities were estimated as the Richness (R) and the Shannon diversity index (H′) at the genus level using the vegan R package (Oksanen et al., 2020).
The environmental drivers of the prevMixo were identified using random forest (RF) analyses. RF algorithms seek to predict the values of a response variable by building multiple regression trees using several predictors. RF models and variable importance scores were estimated using the party R package (Hothorn et al., 2006). Predictors were log-transformed and standardized prior to the analysis and a logit transformation was applied to the response variable prevMixo. To visualize how the environmental variables affect the prevMixo, the partial dependence effects of the most important predictors identified by the RF were computed and used to produce partial dependence plots (PDPs). PDPs show the marginal effect of individual predictors on model predictions and are thus a convenient way to visualize how a predictor affects the value of a response variable (here prevmixo) while controlling for the effect of the other predictors present in the data set.
RESULTS
Distribution of mixotrophs across North American lakes
Across both surveys, 32 distinct mixoplankton genera were identified. No mixoplankton were identified in the samples from 46 of the 1789 sites (|${prev}_{mixo}=0$|). The proportion of mixoplankton biomass was < 1% in 143 sites. The distribution of phago-mixotrophy prevalence was heterogeneous across North America, varying by ecoregion (Fig. 2a) (nonparametric Kruskal–Wallis rank test, |$P<0.001$|). A post hoc Dunn’s Kruskal–Wallis multiple comparison test further revealed that lakes in the Great Plains ecoregions had significantly lower prevMixo than the Northern Forests, Marine West Coast Forest and Eastern Forests ecoregions (Fig. 2a).
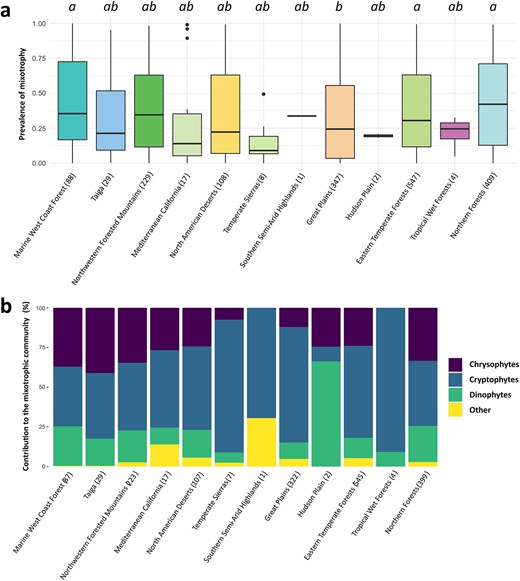
Boxplots of the prevMixo (a), and mean lake relative contributions (%) of classic nanophytoplankton taxonomic groups to the mixoplankton community (b), across the ecoregions (EPA level I) covered by the combined NLA and LP surveys. The number of sites sampled in each ecoregion is specified in the x-axis labels. The letters above the boxes in (a) indicate significant differences between ecoregions, according to the results of the post hoc Dunn’s Kruskal–Wallis multiple comparison test (at a P < 0.05 level).
Three main mixoplankton taxonomic groups were found in most communities across the two surveys: chrysophytes, cryptophytes and dinophytes with the relative contribution of each varying across ecoregions (Fig. 2b). Cryptophytes dominated mixoplankton assemblages in the Great Plains, with relatively low contribution of chrysophytes in this ecoregion. In contrast, chrysophytes and dinophytes appeared to be more prevalent in the Northern Forests ecoregion.
Environmental predictors of the prevMixo
The relative importance of each environmental predictor was estimated for sites from the combined surveys (Fig. S3a) and for the LP survey exclusively (Fig. S3b) using RF models. The estimated R2 computed from the Out-Of-Bag data (i.e. a cross-validated measure of model performance; Breiman, 2001) for those RF models were 0.287 and 0.278, respectively. In each case, TP was by far the most important predictor of prevMixo.
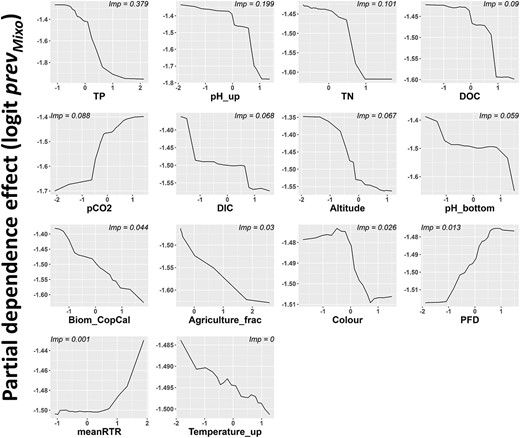
For each model, partial dependency plots were produced for the ten most important quantitative predictors (Figs 3 and 4). The partial dependence effects of other predictors that related to the initial hypotheses of this study were also assessed even if they were not in the top 10 identified in the RF model. These variables were: water color (Color), temperature of the upper layer of the water column (Temperature_up) and the index of thermal stability (meanRTR). The best zooplankton biomass predictors were also added (Biom_CopCal and Biom_Zoo for the combined survey model and the LP survey model, respectively). For the analyses on LP sites alone, the partial dependent effect of the photon flux density, i.e. the quantity of light in the mixed layer (PFD) was also included (Fig. 4).

PDPs showing the marginal effects of quantitative RF predictors on the logit transformed response variable, the prevMixo, for the combined surveys. The x-axes are gradients of predictor values that were log10-transformed and scaled prior to the analysis. The y-axes show the amplitude of the effect of each predictor on the model prediction of the response variable. For each predictor, the importance scores computed from the RF analysis are indicated on the upper part of individual plots.
PDPs showing the marginal effects of quantitative RF predictors on the logit transformed response variable, the prevMixo for only the LP survey. The x-axes are gradients of predictor values which were log10-transformed and scaled prior to the analysis. The y-axes show the amplitude of the effect of each predictor on the model prediction of the response variable. For each predictor, the importance scores computed from the RF analysis are indicated on the upper part of individual plots.
The model results did not differ greatly between the two analyses. TP [i.e. the concentration of all phosphorus forms (organic and inorganic) at a given site], and to a lesser degree TN, was the most important predictor in both RF models, being negatively related to prevMixo. The effect of the qualitative predictors Survey and Ecoregion was also important for the combined survey analysis. Several variables related to water chemistry (DO_up, pH_up and DOC) were also selected and negatively affected phago-mixotrophy prevalence. One lake morphology variable, lake area, was negatively related to the prevMixo across North America (Fig. 3). Ionic concentrations (chemPCA1, cf. Fig. S2a) were also associated to lower values of prevMixo. Air temperature (T2m_30d) and water temperature (Temperature_up) had negative effect on prevmixo, with low importance scores. Although their importance scores were low compared with TP and the magnitude of their partial effects was relatively limited, predictors relating to zooplankton biomass (Biom_zoo, Biom_CopCal) appear to be negatively related to prevMixo. Focusing on the LP analysis, and on the predictors exclusive to this survey, CO2 partial pressure and DIC concentrations had relatively elevated importance scores with positive and negative effects, respectively, on prevMixo (Fig. 4). The PDPs also revealed a mostly positive, though very low in magnitude effect of PFD on prevMixo.
Environmental drivers of mixoplankton community composition
The adjusted R2 score of the RDA on the combined surveys was relatively low (|${R}_{adj}^2=0.095$|), as was the variability explained by the first two axes (5.98% for the first axis and 2.01% for the second axis) (Fig. 5a). TP appears to be the most important factor for taxonomic composition. Most chrysophyte and dinophyte genera, and particularly the chrysophytes Dinobryon and Ochromonas were opposite the TP vector along the RDA1 axis, indicating greater contributions of these taxa in deep oligotrophic lakes. Cryptophytes Rhodomonas and Cryptomonas were associated with somewhat higher TP concentrations, although modulated by other factors such as temperature (T2m_30d) and DOC-associated color, respectively. A second discriminating dimension appeared to be the effect of light availability on community structure as determined by DOC and water color, in opposition to the mean surface solar radiation over 30 days (SSR_30d). Cryptomonas and Ceratium (a dinophyte genus) separated from the rest of the community over this dimension, and both were more prevalent in colored lakes with high DOC. In contrast, water chemistry predictors (DO_up, pH_up) and zooplankton biomasses were not well represented in the RDA and appear to have relatively weak relations with nanophytoplankton composition.
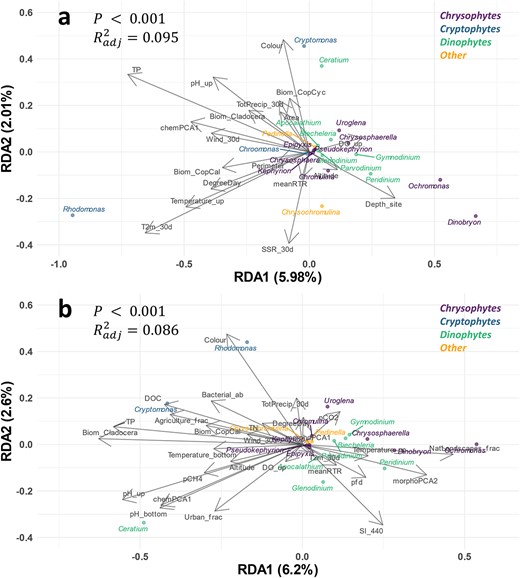
RDA triplots showing how environmental variables (arrows) constrained mixoplankton community composition in the combined NLA and LP surveys (a) and LP survey alone (b). To improve readability, individual site points were not plotted, and the taxon scores were plotted as dots rather than arrows. The taxon scores and labels were coloured to reflect their broad taxonomic classification.
The RDA for the LP survey alone (435 lakes) permitted inclusion of additional environmental predictors that were not collected at the NLA sites (Fig. 5b). The adjusted R2 was slightly lower than in the previous RDA (|${R}_{adj}^2=0.086$|), probably because of the larger number of predictors added to the model, and the first and second axis explained 6.2 and 2.6% of variation, respectively. TP once again clearly constrained community assemblage and clearly aligned with the cryptophyte Cryptomonas (more prevalent in high TP sites) and in opposition to the chrysophyte Ochromonas (more prevalent in oligotrophic lakes). Predictors related to light availability again secondarily contributed to structuring the community, with water color in opposition to photon flux density, spectral irradiance at 440 nm and lake depth (via the sites scores on the second PCA axis built from lake morphology). Compared with the results on the combined surveys, in Canadian lakes, Rhodomonas was the mixoplankton taxa most prevalent in more colored lakes with low light availability in the water column. Moreover, Ceratium prevalence was relatively higher in Canadian lakes having high zooplankton biomasses and high ion concentrations; patterns that were not visible in the previous analysis. Finally, temperature-related variables were not well represented in the RDA of Canadian lakes.
Because TP was the strongest predictor in the RDAs, the effect of lake trophic state on the composition and the diversity of the mixoplankton portion of the community was further investigated. To facilitate the visualization of potential community composition shift, sites were split into limnologically coherent categories of nutrient availability, i.e. each sites was grouped in one of four trophic state categories according to their TP values: oligotrophic (|$\mathrm{TP}<12\ \mathrm{\mu} \mathrm{g}.{\mathrm{L}}^{-1}$|; 348 sites), mesotrophic (|$12\le \mathrm{TP}<24\ \mathrm{\mu} \mathrm{g}.{\mathrm{L}}^{-1}$|; 421 sites), eutrophic (|$24\le \mathrm{TP}<48\ \mathrm{\mu} \mathrm{g}.{L}^{-1}$|; 312 sites) and hypereutrophic (|$\mathrm{TP}\ge 48\ \mathrm{\mu} \mathrm{g}.{\mathrm{L}}^{-1}$|; 528 sites) (Fig. 6). At the genus level, mixoplankton assemblages changed with lake trophy: cryptophytes Rhodomonas and Cryptomonas contributed most biomass to the mixoplankton communities in eutrophic and hypereutrophic lakes, whereas Dinobryon (chrysophytes) clearly decreased with lake trophy (Fig. 6a). There was a clear shift from chrysophyte dominance in oligotrophic lakes to cryptophyte dominance in eutrophic and hypereutrophic sites (Fig. 6b). The prevalence of dinophytes also appeared to decrease in more eutrophic lakes. There was also a change in the relative prevalence of the most dominant taxa: mixotroph assemblages were dominated by relatively few genera in hypereutrophic sites compared with oligotrophic ones. This warranted additional analyses of the diversity response to lake trophic state: genus-level Richness and Shannon diversity decreased from oligotrophic to hypereutrophic lakes (Fig. 6c and d). Group comparison tests (one-way Kruskal–Wallis analysis of variance for Richness and one-way ANOVA for Shannon diversity) revealed that the observed changes were significant between the different categories of lake trophic state (|$P<0.001$| for both tests). Post hoc multiple comparisons tests (Dunn’s test for genera Richness and Bartlett test for Shannon diversity) further showed that these changes in diversity were significant between each pair of lake trophic state categories (|$P<0.05$|).
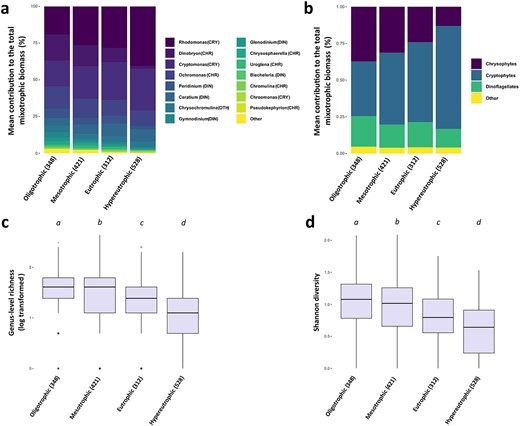
Mean contribution (percentage) of mixoplankton genera (a) and taxonomic groups (b) to the phago-mixotrophic portion of the total nanophytoplankton biomass for different categories of lake trophic state. Boxplots of the log-transformed genus-level Richness (c) and Shannon diversity (d) across the four lake trophic state categories. The letters above each box indicate significant differences (at a P < 0.05 level) between lake trophic categories according to relevant post hoc multiple comparisons tests (Dunn’s test for genera Richness and Bartlett test for Shannon diversity). In all panels, the number of sites in each category of trophic state is specified in in the x-axis labels.
DISCUSSION
Phago-mixotrophy is ubiquitous in North American lakes
Investigation of nanophytoplankton community records collected across the USA and Canada revealed that the vast majority of North American lakes harbor phago-mixotrophic taxa. Of all the sites investigated, only a small portion of lakes seemingly harbored no mixoplankton taxa at the time of sampling (46 out of 1789 lakes). While mixoplankton were found in the majority of lakes, their prevalence was not evenly distributed across the continent and varied across ecoregions. Among the ecoregions with the most lakes sampled, their prevalence was lowest in the Great Plains, and highest in more forested regions. These differences can most likely be attributed to alterations in land use and lake morphology that, in turn, control lake trophic state. Lakes in the Great Plains are notoriously more eutrophic than in other ecoregions (Hollister et al., 2016), mostly because these lakes are relatively shallow and because agricultural activities are very prevalent in their watersheds. Analyses on LP sites did not highlight watershed usage categories as particularly strong drivers of mixoplankton prevalence, but those same analyses did reveal an important negative effect of TP.
The taxonomic composition of the mixoplankton community was not itself uniform across the continent. The most striking variation in mixoplankton community composition was the shift from cryptophyte-dominated mixoplankton communities in the Great Plains ecoregion to a dominance of chrysophytes and dinophytes in lakes situated in less agricultural and human-impacted ecoregions like the Northern Forests and the Northwestern Forested Mountains. As observed in the RDAs, these assemblage differences likely stem from environmental preferences, in particular lake trophic state, that are tied to differences in land use in the watershed.
Lake trophic state is the main driver of phago-mixotrophy prevalence
Throughout the different analyses, lake trophic state appears to be the main driver of the prevMixo across North American lakes (Fig. S5). TP was identified as the most important predictor in the RF models, and it had a strong, mostly linear negative partial dependent effect on prevMixo with oligotrophic sites being more phago-mixotrophic than eutrophic lakes. Theory predicts this pattern. Simulation models (Crane and Grover, 2010; Ward et al., 2011) show that phago-mixotrophy is most advantageous in oligotrophic systems, where dissolved nutrients are scarce and grazing on bacteria constitutes an alternative source of phosphorus, thus making bacterivory particularly beneficial for growth (Mitra and Flynn, 2023). In more eutrophic environments, an alternative strategy of resource acquisition is not as favored and does not provide an advantage against pure phototrophs like cyanobacteria which thrive when nutrient availability is high (MacKeigan et al., 2023). Another important driver of the mixoplankton prevalence revealed by our study was DOC concentration. While we might expect prevMixo to respond positively to DOC, which favor bacterial production (Hessen, 1992) and could thus indirectly promote mixoplankton dominance, the negative effect of this variable should probably be interpreted as another indication that more oligotrophic lakes favor phago-mixotrophy. Indeed, there was a substantial positive correlation between TP and DOC concentrations in our data set (Fig. S2), which did not distinguish colored from noncolored DOC. These results support our initial hypotheses: phago-mixotrophy is an alternative strategy for nutrient and carbon acquisition, the success of mixoplankton taxa in natural systems is thus primarily tied to conditions of resource availability. One possible mechanism explaining mixoplankton success when nutrients are scarce is that bacterial growth is more efficient in oligotrophic lakes compared with more eutrophic sites (Smith and Prairie, 2004) rendering phago-heterotrophy a viable strategy for resource acquisition. In a recent modeling study, Mitra and Flynn (2023) showed that grazing on bacteria, even at low rates, could be a significant pathway for resource acquisition in oligotrophic environments, thus potentially providing a strong competitive advantage to mixoplankton. Confirming the role of bacterial grazing for mixoplankton success in North American lakes would require further investigation into the diet of freshwater mixoplankton data.
Phosphorus availability also controlled the composition and the diversity of the mixoplankton community. The RDA results indicated that more eutrophic sites tend to have higher relative prevalence of cryptophytes like Rhodomonas and Cryptomonas. Saad et al. (2016) also identified a shift in dominance from chrysophytes to cryptophytes over a lake trophic state gradient across Patagonian lakes. Using results from experiments on bacterivory activity, they attributed this shift to physiological differences between taxa with fitness impacts under different nutrient conditions. In particular, chrysophytes like Ochromonas had higher grazing impacts than cryptophytes (e.g. Rhodomonas or Cryptomonas) and were thus more reliant on phagotrophy for nutrient acquisition (Saad et al., 2016). Observed taxonomic shifts over the gradient of nutrient availability thus reflects the broad positions of mixoplankton taxa over the phototrophy-to-phagotrophy mixotrophic functional gradient. Our results show that this assembly rule previously identified at a regional scale (Hansson et al., 2019) is confirmed at a continental scale.
Increased lake trophic state not only led to a shift in composition, but also to a decrease in the taxonomic diversity of the mixoplankton community with dominance by a few cryptophyte taxa. This loss of diversity under eutrophic conditions could be attributed to the presence of contrasting mixotrophic strategies within the community. Given that phagotrophy is probably a marginal means of resource acquisition for cryptophytes, they are thus less likely to dominate when nutrients are limited and phagotrophy is favored. However, as phosphorus availability increases, bacterivory supplements cryptophyte autotrophy potentially enabling them to become more competitive against other mixotrophs, increasing their relative dominance and reducing overall diversity. Additionally, the watersheds of eutrophic and hypereutrophic lakes tend to be more human-impacted by agriculture and thus subject to pesticide pollution. Presence of pesticides reduces nanophytoplankton community diversity and leads to a loss of taxa, including within the mixoplankton (Fugère et al., 2020). A study of the entire protist community in LP lakes, identified using metabarcoding, also showed a pattern of decreasing diversity with lake trophic state (Garner et al., 2022).
Other factors related to phago-mixotrophy
In contrast to the clear effect of nutrient availability, we did not detect any strong effect of light availability on the prevMixo. Highly colored lakes supported a relatively lower prevMixo, but the importance of water color in the RF analyses was very low across both surveys. Interpreting the effect of water color is further complicated by the fact that it is probably related to DOC concentration, which can not only affect light availability, but can also promote bacterial growth (Hessen, 1992; Kroer, 1993), thus potentially affecting processes carried out by mixotrophs (autotrophy and bacterivory) in opposite ways. We lack detailed measurements of the different components of DOC (colored vs. non colored), and more generally of DOM at our sites. Measuring precisely DOC and DOM composition would have required additional extensive lab analyses, but could prove useful in future studies of mixoplankton to gain improved understanding of light conditions in freshwater systems and their effect on nutrition strategy assemblages, as shown in Hansson et al. (2019). Returning to the effect of light availability in our study, analyses including more detailed light condition assessment in LP sites alone indicated that greater light availability (PFD) was related to an increased prevMixo, as also reported by Edwards (2019) in marine environments. However, the amplitude of the partial dependence effect was low, as was the importance of this predictor. Many mixoplankton taxa are obligate phototrophs, for which bacterial ingestion is not sufficient to stave off carbon limitation under low light (Jones, 2000). Indeed, obligate mixotrophs may favor high irradiance environments as shown in microcosm experiments where an obligate phototrophic mixotroph (Ochromonas) outcompeted a pure autotroph under high irradiance growth conditions (Fischer et al., 2017). Thus, the positive effect of PFD on prevmixo, albeit weak, might indicate that the majority of the mixoplankton genera in the surface waters of Canadian lakes rely primarily on phototrophy for carbon acquisition and consequently for their growth; although in situ growth experiments would be required to confirm this.
Despite this discussion of the relation between light availability and the success of mixoplankton, the importance scores of light-associated variables were very low in the RF analyses relative to the importance of TP. This result could indicate that, at the scale of the entire community, phago-mixotrophy is more relevant for acquisition of phosphorus than for carbon. Another possible explanation for the lack of a strong effect of light conditions is that the nanophytoplankton community was sampled over the first 2 m of the water column, where light is least limiting in lakes. However, with respect to the mixoplankton assemblage composition, light conditions appear to have some effect (though still to a lesser degree than nutrient availability). The RDAs indicate that Cryptomonas and Ceratium (as well as Rhodomonas in Canadian lakes) were more prevalent in colored lakes where the amount of solar irradiance is low. Differences in prevalence across varying light availability conditions could reflect contrasting taxonomic strategies for carbon acquisition (photosynthesis vs. bacterivory) that would translate into different functional mixotrophic balances between phago-heterotrophy and photo-autotrophy for different species. Confirming whether these environmental patterns reflect actual physiological differences between taxa would require more detailed in situ growth and bacterial ingestion experiments.
Other components of lake water chemistry were related to the prevMixo in addition to TP. Increased pH and DO levels were associated with more autotrophic assemblages. In Canadian lakes, high CO2 concentrations were associated with greater mixoplankton prevalence. It is highly probable that CO2 concentration, DO concentration and to an extent pH are reflective of photo-autotrophic primary productivity rather than actual drivers of phago-heterotrophy, however. In contrast to our observations, Flynn and Mitra (2023) concluded that mixoplankton could potentially drive-up pH levels in the environment, although in their system it occurred through bloom events causing an increase in primary production (i.e. more phototrophic activity). Our analyses also revealed that the concentrations of ionic species (via the chemPCA1 predictor obtained after collapsing the shared variability of ionic variables in a single PCA axis) affect the prevMixo. Across North America, lakes with high ionic concentration tend to be eutrophic sites (Fig. S2), and there is some correlation between TP and ionic species concentrations (in particular potassium) in our data set. For example, sites in the Prairies ecoregion, which are generally eutrophic, also display the highest potassium concentration (Fig. S4). This could again reflect the effect of agricultural activity in the watersheds of eutrophic sites, as agricultural fertilizers contains both phosphorus and potassium. The association between ionic concentration and prevMixo should thus probably be seen as another proxy effect of lake tropic state on nanophytoplankton assemblages of resource-acquisition strategies.
Top-down interactions can also shape nanophytoplankton assemblages and we observed negative (albeit weak) effects of zooplankton community biomass on mixoplankton prevalence. This could indicate a zooplankton preference for mixoplankton taxa, as copepods are selective feeders. This negative effect of zooplankton abundance on the prevMixo had previously been identified in a similar study of mostly oligotrophic boreal lakes (Hansson et al., 2019). This relationship thus appears to hold at a continental scale, although it is worth noting that the marginal effects of zooplankton predictors were far lower than those of TP, indicating that top-down interactions are secondary drivers of the prevMixo in comparison to nutrient availability. While Hansson et al. (2019) attributed the large effect of zooplankton abundance on assemblages of resource-acquisition strategies to mixoplankton being a generally more valuable prey source than pure autotrophs for zooplankton, some mixoplankton taxa are apparently more preferred than others. For example, Vad et al. (2020) showed that for the cladoceran Daphnia longispina the nutritional value of Dinobryon was low compared with the nutritional value of Cryptomonas. Zooplankton could thus be expected to be relevant drivers of the mixoplankton community composition, and our results show that this is apparently the case, at least in Canadian lakes where the cladoceran and copepod biomasses were well represented in the LP RDA. Higher zooplankton biomasses were associated with greater prevalence of certain mixotrophs, in particular the cryptophytes Cryptomonas and Rhodomonas and the dinophytes Ceratium. It is tempting to attribute these patterns solely to zooplankton grazing preferences on other mixotrophs, reflecting the nutritional values of mixoplankton taxa with different mixotrophic strategies. However, it is important to keep in mind that the effect of zooplankton grazing on community assembly could also reflect other trait differences within the phytoplankton community like cell size, toxin production or coloniality (Colina et al., 2016).
The effects of water temperature and lake stratification on resource-acquisition strategy assemblage appear from our analyses to be marginal, with very low importance scores in the RF models. The relative biomass of mixoplankton taxa appears to be generally lower in warmer lakes. It is likely that warmer water temperatures favor autotrophic cyanobacteria, thus pushing nanophytoplankton communities toward greater contributions of purely phototrophic taxa, especially cyanobacteria (Paerl and Huisman, 2009). While we anticipated that more stratified lakes might display greater prevMixo, we did not observe such an effect. This may reflect a methodological limitation inherent to the community assessment data, as the water samples used for nanophytoplankton taxonomic identification were taken over the first 2 m of the photic zone rather than the entire water column. In stratified lakes, a significant portion of the nanophytoplankton community is concentrated within a deep chlorophyll maximum near the bottom of the euphotic zone, where taxa can optimally balance their light and nutrient requirements (Camacho, 2006; Leach et al., 2018) often well below our survey sampling depths, especially in deeper lakes. While phago-mixotrophs can be prevalent in epilimnetic waters because they can compensate for scarcity in inorganic nutrients through bacterivory (Tittel et al., 2003), some mixoplankton taxa can also persist in conditions where photosynthesis is limited and could thus potentially be found below the photic zone (Skovgaard, 1996; Roberts and Laybourn-Parry, 1999). If a strong stratification favors generalist nutrition strategists by promoting a vertical gradient of nutrient availability conditions, detecting an effect of stratification on the prevMixo would probably require community assessments integrated over the entire water column, not just in surface waters.
In contrast, variables related to temperature were relatively well represented in the RDA from the combined survey data set, indicating a role for mixoplankton assemblage composition. There is currently a lack of consensus on how temperature affect mixoplankton physiology. Lepori-Bui et al. (2022) reported that temperature promotes phago-mixotrophic metabolic functions, and that warmer temperature could favor taxa more reliant on phagotrophy for their growth, but it is unclear whether our results lend support to their findings. Indeed, the mixotrophic taxon that responded the most to temperature variables was Rhodomonas sp. (sometime incorrectly referred to as Plagioselmis nannoplanktica), a cryptophyte genus with greater relative biomass in warmer sites. The exact mixotrophic functional balance of Rhodomonas is unknown, although other cryptophytes like Cryptomonas are generally considered to be mainly phototrophic (Jones, 1997). If Rhodomonas indeed uses phototrophy as its primary mode of nutrition, it could signal that higher temperatures actually favor photo-autotrophic nutritional pathway, which would be in line with the finding of Ferreira et al. (2022). This result on the combined survey did not extend to the RDA results obtained from LP sites exclusively, probably because of the reduced latitudinal range of this data set that entailed a more restrained gradient of surface temperature values. Further research is needed to assess the exact physiology of freshwater mixoplankton taxa in situ and to see how mixoplankton community assembly change over a gradient of water temperatures when controlling for resource availability, especially in the context of a warming climate.
It is worth noting that our RDAs explained little overall variability in the taxonomic composition of the mixoplankton assemblage. This unexplained variability indicates that other assembly rules are at play and might reflect the omission in the analyses of potentially important environmental drivers for the success of mixotrophs. It is also important to keep in mind that local environmental filtering is just one among a variety of processes that determine community assembly (Borics et al., 2021).
Finally, we would like to stress the need for more systematic and detailed studies of the diets of nanoplankton taxa, notably through dedicated ingestion experiments. We believe our approach for identifying nutritional strategies at the genus level using the literature is sound, but there is still room for improvement. A recent database of marine mixoplankton strategy published by Mitra et al. (2023a) indicates that different nutritional strategies can be found within a single genus. Simply assessing the validity of published reports of phagotrophy can sometimes be difficult. For example, while we have considered Ceratium to be a potential phago-mixotroph, there has been debate about the nutrition strategy of freshwater species in this genus (Hansen and Calado, 1999; Stoecker, 1999). This issue is further complicated by the fact that there are numerous reports of phagotrophy for marine species previously classified as Ceratium that have since been reclassified as Tripos. As it is often the case, we lack a more recent assessment of the strategy of freshwater species of this genus. Indeed, published information on the potential for phagotrophy is still thoroughly lacking for many freshwater species. Precisely characterizing whether a species can ingest prey, and if so which kind, would provide us with invaluable information to understand of how the environment shapes nutritional strategies in mixoplankton.
CONCLUSIONS
We showed that phago-mixotrophy is ubiquitous across North American temperate and boreal lakes. Lakes without any phago-mixotrophic nanophytoplankton taxa are the exception rather than the rule. However, the biogeography of mixotrophs is variable, with lakes in less human-impacted ecoregions (i.e. more oligotrophic lakes) displaying a higher prevMixo primarily via contributions of chrysophytes and dinophytes. On the other hand, lakes in the more impacted Great Plains ecoregion were generally more dominated by autotrophic genera with cryptophytes being the dominant mixoplankton taxa in those sites. Indeed, we identified phosphorus availability (TP) as the main driver of phago-mixotrophy, with higher prevalence of mixotrophs in more oligotrophic sites. TP also constrained mixoplankton community assembly and taxonomic diversity. Other relevant environmental predictors of phago-mixotrophy included water chemistry and zooplankton biomass. In contrast, the availability of light, a factor usually considered key to predict the success of mixoplankton taxa, appears to have little effect on resource-acquisition strategy assemblages although it likely had some effect on the mixoplankton community composition itself. Future research should focus on measuring the actual contributions of phagotrophy to mixoplankton population growth rates to better understand differences in responses of mixoplankton species to environmental gradients, and especially light availability. Overall, this study is the most extensive investigation of lake phago-mixotrophy to date, covering more than 1700 lakes and a dozen ecozones, and demonstrates that large-scale surveys like the NLA and LP sampling campaigns are invaluable sources of empirical information and when well-coordinated, useful to uncover community assembly rules at previously unstudied continental scales.
ACKNOWLEDGEMENTS
We thank all members, technicians, students and research professionals who participated in the NSERC Lake Pulse Network and all organizations involved in the EPA-NLA for the collection and production of data.
FUNDING
This work was supported by a Discovery Grant from Natural Sciences and Engineering Research Council of Canada (NSERC, grant number 06844) to B.E.B., and by a stipend from the Université du Québec à Montréal to P.L.N. Funding of the LakePuse Network by NSERC (to Y.H., P.d.G. and B.E.B.) is also acknowledged. We thank the Fonds de recherche-nature et technologie (FRQNT, Québec) for funding to the Interuniversity Research Group in Limnology (Groupe de recherche interuniversitaire en limnologie; GRIL).
DATA AVAILABILITY
NLA data are publicly available online on the EPA website (https://www.epa.gov/national-aquatic-resource-surveys/data-national-aquatic-resource-surveys) and the LP data are to be released publicly in 2024. We plan to release the database of nanoplankton nutrition strategies in North American lakes as a separate data paper in the near future.
