


Abstract
The distribution of mineral systems is heterogeneous over space and time, reflecting transient element enrichment within Earth’s evolving crust. Australian Proterozoic rocks host some of the world’s largest ore deposits, including the Broken Hill Pb–Zn–Ag deposit within the Curnamona Province, and the Olympic Dam Cu–U–Au–Ag super-deposit, within the Gawler Craton, offering key insights into crustal preconditioning for mineralization. New feldspar and whole-rock Pb isotopic data, and complementary apatite geochronology, support a common source for Mesoproterozoic magmatism in the Curnamona Province and Gawler Craton and hence a genetic link between their world-class ore deposits. Exceptionally, radiogenic Pb isotope ratios in the Curnamona Province indicate extreme crustal fractionation, likely driven by a positive feedback scenario where crustal anatexis produced melts strongly enriched in heat-producing, incompatible elements, which in turn prolonged anatectic conditions through radiogenic heat production. The resulting granitic rocks may have acted as important metal sources for certain ore deposits while more generally fostering metal enrichment by providing a persistent heat source for hydrothermal systems. This chemical hotspot may have been triggered by the combination of insulating thickened crust and gravitational destabilization following the assembly of the Nuna supercontinent.
INTRODUCTION AND GEOLOGICAL CONTEXT
The spatial clustering and episodicity of mineral systems have long been recognized and interpreted to reflect favorable combinations of tectonics and environmental conditions (e.g. in the atmosphere, hydrosphere, and lithosphere) (Goldfarb et al., 2010; Cawood & Hawkesworth, 2015; Pehrsson et al., 2016). Understanding geodynamic controls on mineral systems can provide insights into the evolution of magmatic processes with important implications for crustal evolution, exploration targeting, reducing industry risk, and supporting the transition toward green technology—this linkage is commonly known as the mineral systems approach to ore genesis. Moreover, geodynamic and magmatic processes are important controls on the thermal evolution of the crust which directly influences fluid flow and metal transport (Neumann et al., 2000; Zappettini et al., 2017). Australian Proterozoic rocks host major mineral systems, some of which are amongst the largest known ore deposits on our planet (Pirajno & Bagas, 2008). The Curnamona Province, situated across the South Australian and New South Wales state border, and the Gawler Craton in South Australia (Fig. 1), are regions of economically significant mineral endowment and occupied important components of the Proterozoic supercontinent Nuna (Pirajno & Bagas, 2008; Betts et al., 2016). The Curnamona Province and Gawler Craton are located in a zone characterized by elevated surface heat flow (the ‘South Australian heat flow anomaly’) driven by a high concentration of radiogenic heat-producing elements (Neumann et al., 2000; Pollett et al., 2019). Hence, these cratonic blocks may offer important insights into the relationship between supercontinent cycles, crustal thermal state, fluid–rock interaction and metallogenesis over time (Pehrsson et al., 2016).
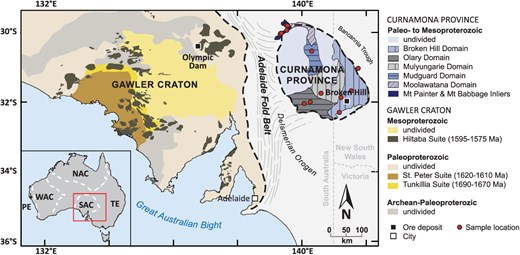
Simplified geological map of the Curnamona Province and the Gawler Craton after Hand et al. (2007); Fricke et al. (2010). WAC – West Australian Craton; NAC – North Australian Craton; SAC – South Australian Craton, TE – Tasman Element. A map indicating sample numbers is provided in Supplementary Information D.
Ore deposits in the Curnamona Province include the world’s largest Pb–Zn–Ag ore body, the 1685 Ma Broken Hill ore body hosted within the ~1720 Ma to 1640 Ma Willyama Supergroup, and multiple U deposits (e.g. Radium Hill and Mount Painter) (Conor & Preiss, 2008). Large areas of the province are covered by Neoproterozoic to Holocene sedimentary rocks, and exposure of Paleoproterozoic to Mesoproterozoic basement rocks is mostly limited to the southern and northern margins of the province (Fig. 1). The oldest rocks in the Curnamona Province are exposed in the Broken Hill and Olary Domains in the southern part of the province and belong to the ~1720 Ma to 1640 Ma metasedimentary Willyama Supergroup, which was intruded by 1610 Ma to 1550 Ma granitoids (Conor & Preiss, 2008; Fricke et al., 2010). In the Moolawatana Domain in the northwestern part of the province, 1575 Ma to 1555 Ma granitoids that intruded marginally older (~1590 Ma) metasedimentary rocks of the Radium Creek Metamorphics are exposed in the Mount Painter and Mount Babbage Inliers (Fricke et al., 2010; Elburg et al., 2012). The Curnamona Province was affected by a low grade tectonometamorphic event associated with mafic magmatism at ~1640 Ma (Bodorkos & Fitzherbert, 2022), followed by deformation and high-temperature, low-pressure metamorphism during the ~1620 Ma to 1590 Ma Olarian Orogeny and the ~520 Ma to 480 Ma Delamerian Orogeny (Conor & Preiss, 2008). The Archean to Proterozoic Gawler Craton is located ~100 km to the west of the Curnamona Province, separated by the Adelaide Fold Belt (Fig. 1), a Neoproterozoic rift complex, which was inverted during the Delamerian Orogeny (Conor & Preiss, 2008). Granites as old as 3150 Ma occur in the Gawler Craton; however, the bulk of its Archean nucleus is comprised of ~2560 Ma to 2520 Ma (meta)sedimentary and (meta)volcanic rocks (Hand et al., 2007; Betts et al., 2016). This Archean core is enclosed by Paleoproterozoic to Mesoproterozoic (meta)sedimentary and igneous rocks which make up the bulk of the current craton (Hand et al., 2007; Betts et al., 2016). Large-scale, predominantly silicic magmatism occurred in the Gawler Craton at 1.6 Ga, interpreted as a felsic large igneous province formed during supercontinent assembly (Allen et al., 2008). The Roxby Downs Granite, a member of the intrusive portion of this large igneous province, the Hiltaba Suite, hosts the world’s largest U resource, the 1590 Ma supergiant Olympic Dam iron-oxide copper-gold uranium (IOCG-U) deposit (Johnson & Cross, 1995) (Fig. 1). Shared geological aspects, such as coeval episodes of magmatism, sedimentation, and deformation, suggest that the eastern Gawler Craton and the Curnamona Province were contiguous during the Paleoproterozoic to Mesoproterozoic (Conor & Preiss, 2008; Betts et al., 2016).
To investigate the characteristics of the crust in this highly mineralized high-heat flow zone over time, here we use Pb isotopes, along with complementary geochronology and major/trace element analysis, to constrain primary magma sources and provide insights into the magnitude of subsequent tectonothermal events. Minerals that strongly favor Pb over U and Th in their crystal structure, such as K-feldspar, are especially suitable for source tracking studies, as their Pb isotopic composition does not change due to radiogenic ingrowth with time (Blichert-Toft et al., 2016; Halla, 2018; Liebmann et al., 2024). Thus, K-feldspar tends to retain the initial Pb isotope ratio of its parental magma at the time of crystallization. However, thermal events can re-equilibrate Pb isotopes in K-feldspar if temperatures exceed ~550°C to 700°C (Cherniak, 1995). Such isotopically re-equilibrated K-feldspar can be used to access information on the timing of mid- to high-temperature thermal events and, depending on the degree of geochemical exchange, may still retain information on the initial magma source composition (Kamber et al., 2003; McLaren et al., 2006; Halla, 2018).
We present new Pb isotope data from 13 igneous and metamorphic basement rock samples from the Curnamona Province, that are part of a Geoscience Australia sample collection. The published zircon U–Pb ages of these samples range from 1695 Ma to 506 Ma but are mostly Mesoproterozoic between 1586 Ma and 1541 Ma (Table 1). We utilize a rapid, high-resolution in situ Pb isotope analytical approach to obtain data of single K-feldspar grains, providing a robust record of initial, magmatic Pb isotope signatures inherited from the source and allowing to resolve any potential grain-scale processes affecting Pb isotope signatures. The in situ data are supplemented by high-precision solution Pb isotope data of whole rocks and K-feldspar. We interpret the newly generated data from the Curnamona Province in combination with existing whole-rock geochemical data, as well as existing geochronology and Pb isotope data from the Gawler Craton to constrain the source and geologic driver(s) of magmatism and crustal preconditioning for mineralization in both cratons. In addition, we use K-feldspar Pb isotope data and apatite U–Pb geochronology to identify post-crystallization mid-temperature thermal events in the Curnamona Province that are infrequently detected by more conventionally deployed geochronometers with higher closure temperatures, such as zircon U–Pb. We place these results into a wider Australian and global geologic context. These results allow us to infer constraints on geodynamic drivers creating favorable conditions for extreme crustal enrichment that served as the upgrading process for uranium and other metals.
Sample information, extracted from the Geoscience Australia portal (accessible via https://portal.ga.gov.au/)
| Sample ID (IGSN) | Region | Stratigraphic unit | Lithology | Latitude (WGS84) | Longitude (WGS84) | Age (Ma) | 95% confidence (Ma) | Age reference |
|---|---|---|---|---|---|---|---|---|
| AU1470099 | Broken Hill Domain | Hores Gneiss | gneiss | −31.665 | 141.536 | 1689 | 5 | Stevens et al. (2008) |
| AU1578027 | Broken Hill Domain | Georges Bore Granite Gneiss | gneiss | −32.284 | 141.163 | 1695 | 4 | Stevens et al. (2008) |
| AU1578043 | Broken Hill Domain | Umberumberka-type granite | granite | −31.854 | 141.215 | 1586 | 4 | Jagodzinski et al. (2023) |
| AU1578067 | Olary Domain | Bimbowrie Suite | granite | −31.983 | 140.265 | 1581 | 3 | Jagodzinski et al. (2023) |
| AU1578073 | Olary Domain | Lady Louise Suite | granite | −32.027 | 140.080 | 1687 | 4 | Jagodzinski et al. (2023) |
| AU1952106 | Mount Painter Inlier | Hot Springs Gneiss (informal) | gneiss | −30.169 | 139.442 | 1582 | 6 | Fraser & Neumann (2010) |
| AU1952109 | Mount Painter Inlier | Hot Springs Gneiss (informal) | gneiss | −30.142 | 139.473 | 1582 | 4 | Fraser & Neumann (2010) |
| AU1952113 | Mount Painter Inlier | Terrapinna Granite | granite | −29.918 | 139.665 | 1560 | 3 | Fraser & Neumann (2010) |
| AU1952115 | Mount Babbage Inlier | Yerila Granite | granite | −29.904 | 139.626 | 1558 | 4 | Fraser & Neumann (2010) |
| AU1952118 | Mount Painter Inlier | Mount Neill Granite | granite | −30.043 | 139.641 | 1585 | 3 | Fraser & Neumann (2010) |
| AU1999987 | Mudguard Domain | Unnamed granite | granite | −30.605 | 140.353 | 1590 | 5 | Fraser & Neumann (2010) |
| AU2003315 | Bancannia Trough | Mount Wright Volcanics | andesite | −31.090 | 141.818 | 506 | 3 | Bodorkos et al. (2013) |
| AU2005110 | Mulyungarie Domain | Honeymoon Granite | granite | −31.764 | 140.687 | 1541 | 59 | Jagodzinski & Fricke (2010) |
Links to digital resources with additional sample metadata are provided in Supplementary Information D. International Generic Sample Numbers (IGSN; https://www.igsn.org/) serve as Sample IDs.
METHODOLOGY
Sample preparation and imaging
The rock samples analyzed in this study are from the Geoscience Australia sample collection. Sample information is summarized in Table 1, and links to digital resources with additional sample metadata are provided in Supplementary Information D. The samples were cleaned in water and crushed. One aliquot of the crushed material per sample was used to prepare powders for solution whole-rock Pb isotope analysis. The other aliquot was sieved, and the light mineral fraction was extracted through standard mineral separation procedures, including magnetic separation and density separation using a shaking table and heavy liquids (diiodomethane). The light fraction (ρ < 3.3 g/cm3) was poured into a ‘dump’ 25 mm epoxy mount, which was polished down to a 1-μm finish for mineral phase mapping and in situ K-feldspar and apatite analyses. Mineral phase maps of the grain mounts were obtained using a Tescan Integrated Mineral Analyzer (TIMA) in the John De Laeter Centre (JdLC), Curtin University, with 1 μm resolution for back-scattered electron (BSE) imaging, and 9 μm resolution for energy dispersive X-ray spectroscopy (EDX) dot mapping.
K-feldspar Pb isotopes via LA-MC-ICP-MS
In situ K-feldspar Pb isotope analyses were conducted in the GeoHistory Facility, JdLC, Curtin University, using laser ablation multi-collector inductively coupled plasma mass spectrometry (LA-MC-ICP-MS) following the analytical procedures described by Liebmann et al. (2023). The analyses were conducted on a Nu Plasma II multi-collector mass spectrometer in conjunction with a Resonetics S-155-LR 193 nm excimer laser ablation system. K-feldspar grains were ablated using a beam diameter of 15 to 24 μm. The following masses were measured: 202Hg, 204(Pb + Hg), 206Pb, 207Pb, 208Pb, and 238U. All masses were measured on ion counters for 210 cycles with a 0.3 s integration time. The laser fluence as measured at the sample surface was 2.0 to 3.5 Jcm−2, and a pulse frequency of 5–6 Hz was used. Data acquisition consisted of two cleaning pulses, 20–40 s blank flush out, 15–30 s ablation time, and a total of 45 s of baseline acquisition. The sample cell was flushed with ultrahigh purity He (320 mL/min) and N2 (1.2 mL/min), and high purity Ar was employed as the plasma carrier gas.
Raw data were reduced in iolite 4 using an in-house data reduction scheme that performs a 204Hg correction based on the intensity of 202Hg as described by Delavault et al. (2018), with the exponential mass bias being determined from the 208Pb/206Pb ratio measured in standard glass NIST 612. The 204-interference corrected Pb isotope ratios were calibrated against reference K-feldspar Albany (Liebmann et al., 2023). Secondary standards included NIST 612 (Woodhead & Hergt, 2001) and Shap K-feldspar (Tyrrell et al., 2006; Souders & Sylvester, 2010). Standard glass NIST 612 when treated as an unknown yielded Pb isotope ratios of 206Pb/204Pb = 17.094 ± 0.290, 207Pb/204Pb = 15.500 ± 0.269, and 208Pb/204Pb = 37.111 ± 0.746 (2σ) within uncertainty of the previously reported values of 206Pb/204Pb = 17.099 ± 0.003, 207Pb/204Pb = 15.516 ± 0.002, and 208Pb/204Pb = 37.020 ± 0.007 (Woodhead & Hergt, 2001). Shap K-feldspar yielded Pb isotope ratios of 206Pb/204Pb = 18.217 ± 0.374, 207Pb/204Pb = 15.609 ± 0.335, and 208Pb/204Pb = 38.189 ± 0.976 (2σ) also within uncertainty of the previously reported values of 206Pb/204Pb = 18.253 ± 0.007, 207Pb/204Pb = 15.636 ± 0.010, and 208Pb/204Pb = 38.201 ± 0.029 (Liebmann et al., 2023). Standard glass NIST 612 was used as a concentration standard for U and Pb. Concentrations of U, Pb, and 204Hg/204total were monitored to identify analyses that may be impaired by radiogenic ingrowth of Pb, low Pb concentrations, and/or large isobaric interference corrections. Results were filtered to avoid analyses affected by radiogenic ingrowth and inaccurate 204-interference correction, namely, analyses with U > 0.3 μg/g, 204Hg/204total > 0.05 and Pb < 10 to 15 μg/g (for diameters of 24 and 15 μm, respectively) are excluded from further discussion (Liebmann et al., 2025).
Whole-rock and K-feldspar Pb isotopes via TIMS
The Pb isotope composition of one K-feldspar separate and seven partial digestions of whole-rock samples were analyzed via thermal ionization mass spectrometry (TIMS) at the JdLC following the analytical procedures described by Liebmann et al. (2023, 2024). The crystal chips of the K-feldspar sample were manually subsampled under a binocular microscope to avoid any obvious alteration, weathered surfaces, or inclusions. The selected K-feldspar chips and each whole-rock powder were weighed into a clean, labeled Savillex® PFA beaker. Prior to TIMS analysis, the K-feldspar separates and whole-rock powders were leached in 6 mol/L (M) HCl for 3 hours at 60°C, the leachate was then removed, and the residue rinsed three times with high purity H2O (Milli-Q). The samples were then leached in 6 M HNO3 for 3 hours at 60°C, again the leachate was removed, the residue was rinsed three times with Milli-Q H2O, and subsequently dried at 50°C overnight. This open beaker digestion and leaching approach is expected to result in differential digestion and variable removal of radiogenic Pb, and thus, for clarity we refer to the whole-rock aliquots prepared in the way described above as ‘partial whole-rock’ digestions. All sample material was digested for 72 hours in 3:1 concentrated HF (29 M) and concentrated 16 M HNO3, at a temperature of 140°C. Twice a day the beakers were placed in an ultrasonic bath for 30 minutes to disaggregate fluoride build up. Following dissolution, samples were dried, and redissolved in 2 mL of 6 M HCl. After fluxing for 24 hours at 140°C, the samples were again evaporated, then redissolved in 1.2 M HBr and centrifuged to separate solids prior to Pb separation chemistry. The Pb was purified from the matrix by an anion exchange chromatography procedure using AG1-X8 anion resin (100–200 mesh, Cl-form). Once eluted through columns in 6 M HCl, the Pb aliquots were placed to evaporate overnight at 60°C.
The purified Pb samples were redissolved in high purity water (Milli-Q) from which an aliquot of the sample solution was loaded directly onto the center of pre-outgassed single Re filaments with a Si-gel+H3PO4 emitter and dried. This is referred to as the ‘natural’ analysis. Another aliquot of the sample solution was loaded directly onto the center of another pre-outgassed single Re filaments with a Si-gel+H3PO4 emitter and immediately mixed with the appropriate amount of spike using a pipette and dried. This aliquot is referred to as the ‘sample-spike mixture’ analyses.
Isotopic ratios of Pb were determined by TIMS using a Thermo Fisher Triton™ mass spectrometer at the JdLC, Curtin University. The Pb isotopic ratios were acquired on multiple Faraday cups in static collection mode. Gain calibration errors and amplifier gains were determined at the start of each analytical session. Measurement of the Pb isotopes were conducted at a filament temperature between 1150°C and 1250°C after a slow heating and beam tuning protocol. Once a stable signal was acquired each filament was analyzed using a method consisting of 3 blocks of 20 scans. Mass fractionation was corrected through calculation of the double spike (sample-spike mixture) and natural ratios using an iterative exponential law correction adapted from the power law method of Woodhead et al. (1995). The Southampton-Brest lead 207Pb–204Pb (SBL74) double spike and protocol informed from Taylor et al. (2015) was utilized. For all sessions, the NIST 981 Pb standard was analyzed for quality verification purposes. The measured average isotope ratios of the NIST 981 standard were 16.9407 ± 0.0045 206Pb/204Pb, 15.4976 ± 0.0046 207Pb/204Pb, 36.7174 ± 0.0097 208Pb/204Pb (2 SD, n = 10) in excellent agreement with the reported SBL74 NIST 981 ratios of 16.9412 ± 0.0003 206Pb/204Pb, 15.4988 ± 0.0006 207Pb/204Pb, 36.7233 ± 0.0013 208Pb/204Pb (Taylor et al., 2015).
Whole-rock Pb isotopes via solution MC-ICP-MS
Twenty aliquots of 10 unique whole-rock samples were analyzed using the Nu Instruments Sapphire™ (CRC)-MC-ICP-MS within Melbourne Analytical Geochemistry at the University of Melbourne. Samples were analyzed in pairs, including one ~50 mg and one ~200 mg aliquot per sample, prepared using pressure vessel (‘bulk’) digestion. Sample powders were dissolved in Krogh-style PTFE-lined steel pressure vessels (1.6 mL HF- 0.8 mL HNO3 mix, 160°C, 48 hours; refluxing in 2 × 1 mL HNO3; second high-pressure stage with 2.5 mL 6 M HCl, 160°C, 24 hours). All samples yielded clear solutions as confirmation of complete digestion of solids, which were subsequently dried. Samples were then taken up in 1 mL 0.6 M HBr for Pb separation chemistry using small custom columns containing AG1-X8 (100–200 mesh, Cl-form) anion exchange resin (HBr–HCl technique). Samples were purified with this procedure twice to ensure quantitative separation of Pb from matrix elements. Lead blanks were 0.02–0.03 ng of Pb, and no blank corrections were necessary. All isotopic analyses were done on the Nu Instruments Sapphire™ in high energy mode (i.e. no collision cell use). For introduction to the instrument, final dilutions were done with 2% HNO3 doped with a few ppb of a high-purity Tl solution (High Purity Standards™) and aspirated to the ICP-MS via a low-uptake Teflon nebulizer and Cetac-Aridus3 desolvating nebulizer system (DNS). Following a 30-second ‘on-peak-zero’ analysis to record baselines, including detector noise and memory, data for Pb, Tl, and 202Hg were collected with total Pb signals in the range 8 to 18 V (Tl/Pb ~0.1, 204Hg/204Pb < 0.0005) (e.g. Maas et al., 2015). Instrumental mass bias was corrected by internal normalization to the measured 205Tl/203Tl (typically ~2.42, nominal ratio 2.3871, see Woodhead, 2002), with mass bias factors for each of the five Pb isotope ratios derived from Pb–Tl mass bias correlation lines based on analyses of NIST 981 Pb over a 10-year period. This produces corrected data with external precision of ≤0.06% (± 0.009–0.011 absolute) for 206, 207Pb/204Pb, and < 0.1% (≤0.039 absolute) for 208Pb/204Pb, supported by the results for eight analyses of NIST 981 acquired with the unknowns and by repeat analyses for two of the unknowns. The measured average values of the NIST 981 standard were 16.942 ± 0.005 206Pb/204Pb, 15.495 ± 0.005 207Pb/204Pb, 36.703 ± 0.022 208Pb/204Pb (2 SD, n = 7) in agreement with the reported NIST 981 ratios of 16.9412 ± 0.0003 206Pb/204Pb, 15.4988 ± 0.0006 207Pb/204Pb, 36.7233 ± 0.0013 208Pb/204Pb (Taylor et al., 2015). The results for USGS whole-rock reference materials BCR-2 (18.749 ± 0.006 206Pb/204Pb, 15.633 ± 0.005 207Pb/204Pb, 38.692 ± 0.023 208Pb/204Pb) and AGV-2 (18.884 ± 0.006 206Pb/204Pb, 15.624 ± 0.005 207Pb/204Pb, 38.555 ± 0.023 208Pb/204Pb) acquired with the unknowns are also consistent with published data (e.g. Woodhead & Hergt, 2000) .
Apatite U–Pb via LA-ICP-MS
Apatite from 10 samples were analyzed in the same ‘dump’ 25 mm epoxy mounts as K-feldspar. Apatite U–Pb analysis was undertaken at the GeoHistory facility, JdLC, Curtin University, using a Resonetics S-155-LR 193 nm excimer laser coupled to an Agilent 8900 triple quadrupole ICP-MS. The laser spot diameter was 38 μm, with 4.6 Jcm−2 on-sample laser fluence, a repetition rate of 7 Hz, and an ablation time of 30 s with 30 s of baseline acquisition. Measured masses included 202Hg, 204(Pb + Hg), 206Pb, 207Pb, 208Pb, 232Th, 235U, and 238U. McClure Mountain syenite apatite (523.51 ± 1.53 Ma, Schoene & Bowring, 2007; Thomson et al., 2012) was used as the primary reference. MAD apatite (486.58 ± 0.85 Ma and 474.25 ± 0.41 Ma, Thomson et al., 2012), Durango apatite (31.44 ± 0.18 Ma, McDowell et al., 2005), and Duluth Complex apatite (zircon U–Pb age = 1099.1 ± 0.2 Ma, apatite U–Pb age = 1112 ± 35, Schmitz et al., 2003; Kirkland et al., 2018) were analyzed as secondary reference materials, interspersed with unknowns. Intercept ages obtained by free regression were 452 ± 30 Ma (MSWD = 0.69, n = 23/24) for MAD apatite, 37 ± 7 Ma (MSWD = 1, n = 24) for Durango apatite and 1099 ± 22 Ma (MSWD = 0.76, n = 24) for Duluth Complex apatite, within uncertainty of the recommended ages. Raw data were reduced in iolite 4 (Paton et al., 2011), and ages were calculated using IsoplotR (Vermeesch, 2018). Common Pb corrected dates were determined based on the 207Pb correction method (Ludwig, 2001) for samples where the common Pb isotope composition is constrained by K-feldspar. Apatite ages for individual samples were determined as intercept ages based on either free or anchored regressions, as appropriate. The uncertainties of apatite ages determined from over dispersed populations (i.e. with MSWD > > 1) are quoted as the 95% confidence interval multiplied by a factor to account for overdispersion (for details, see Vermeesch, 2018).
RESULTS
K-feldspar and whole-rock Pb isotopes
Seven K-feldspar samples yield homogenous Pb isotope results defining unimodal populations. Lead isotope ratios in these seven samples follow a spatial trend, with the southeastern part of the Curnamona Province having uniform ratios relatively close to the crustal average, whereas Pb isotope ratios in the northwestern Curnamona Province range from close to the crustal average to extremely radiogenic (i.e. with 206Pb/204Pb up to ten times and 208Pb/204Pb up to four times the upper crustal average ratio at 1.6 Ga; Zartman & Doe, 1981; Figs 2 and 3, Table 2). K-feldspar Pb isotope ratios range from 206Pb/204Pb = 16.60 ± 0.14, 207Pb/204Pb = 15.43 ± 0.05, 208Pb/204Pb = 35.96 ± 0.19 in sample AU2005110 (Olary Domain) to 206Pb/204Pb = 167.32 ± 2.81, 207Pb/204Pb = 31.10 ± 0.44, 208Pb/204Pb = 130.15 ± 2.08 in sample AU1952106 (Mount Painter Inlier). Following the same SE-NW trend, Pb isotope ratios measured in the whole-rock range from less radiogenic in sample AU2003315 (Bancannia Trough) with 206Pb/204Pb = 19.612 ± 0.012, 207Pb/204Pb = 15.771 ± 0.009, and 208Pb/204Pb = 40.465 ± 0.040 to extremely radiogenic in sample AU1952109 (Mount Painter Inlier) with 206Pb/204Pb = 1018.415 ± 0.611, 207Pb/204Pb = 78.102 ± 0.047, and 208Pb/204Pb = 823.697 ± 0.824 (Figs 2 and 3, Table 2).
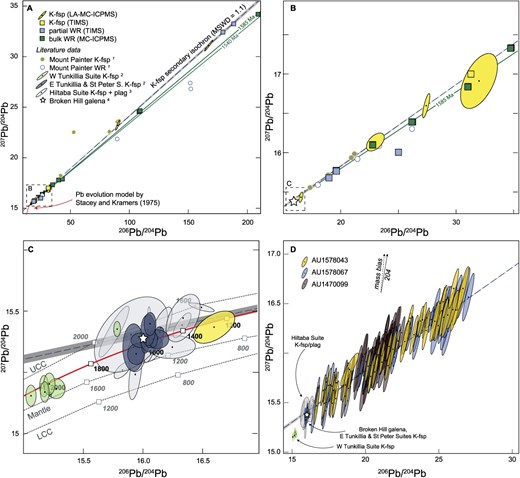
Uranogenic Pb isotope plot of K-feldspar and whole-rock data of this study and compiled from published sources. LA-MC-ICP-MS results are shown with 2SE error ellipses. Symbols for TIMS and solution MC-ICP-MS results are greater than the uncertainty. One sample (AU1952109) with whole-rock 206Pb/204Pb > 300 and 207Pb/204Pb > 40 is outside the limits of panel (A). (A-C) K-feldspar Pb isotope results of this study define a secondary isochron that intercepts with Pb isotope ratios of Broken Hill galena, and Hiltaba Suite & eastern Tunkillia Suite feldspar, implying a common source. The majority of samples studied here have crystallization ages between 1585 Ma and 1540 Ma, corresponding to isochrons (shown as green solid lines) with slopes clearly distinct from the K-feldspar isochron. (D) Single spot K-feldspar Pb isotope results of samples AU1578043, AU1578067, and AU1470099. The dashed line is the same K-feldspar secondary isochron shown in panels (A–C). The dashed and solid arrow, respectively, indicate the vectors predicted for uncorrected instrumental mass bias (~1.35) and the 204 uncertainty (~0.9) (Gagnevin et al., 2005; Taylor et al., 2015; Albarede et al., 2020). Both these vectors have slopes that are significantly steeper than the regression defined by the individual spot data, and thus, analytical error can be ruled out as the source of the scatter in the single spot data. The legend shown in panel (A) applies to all parts of the figure. Literature data are from 1 McLaren et al. (2006), 2 Chapman et al. (2021), 3 Chapman et al. (2019), and 4 Cooper et al. (1969). The solid red curve in (A) and (C) shows the evolution of terrestrial Pb after Stacey & Kramers (1975). The dashed gray curves in (C) show the evolution of Pb isotopes in the upper continental crust (UCC), the mantle, and the lower continental crust (LCC) after Zartman & Doe (1981).
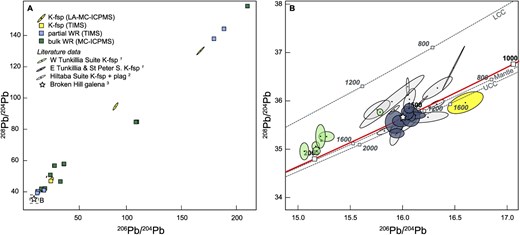
Thorogenic Pb isotope plot of K-feldspar and whole-rock data of this study and compiled from published sources. LA-MC-ICP-MS results are shown with 2SE error ellipses. Symbols for TIMS and solution MC-ICP-MS results are greater than the uncertainty. One sample (AU1952109) with whole-rock 206Pb/204Pb > 300 and 208Pb/204Pb of >150 is outside the limits of panel (A). Literature data are from 1 Chapman et al. (2021), 2 Chapman et al. (2019), and 3 Cooper et al. (1969). The solid red curve (B) shows the evolution of terrestrial Pb after Stacey & Kramers (1975). The dashed gray curves in (B) show the evolution of Pb isotopes in the upper continental crust (UCC), the mantle, and the lower continental crust (LCC) after Zartman & Doe (1981).
Summary of Pb isotope results.
| Sample ID | 206Pb/204Pb | 2SE | 207Pb/204Pb | 2SE | 208Pb/204Pb | 2SE | ρ6–7 | ρ6–8 | N | Type | Method |
|---|---|---|---|---|---|---|---|---|---|---|---|
| (IGSN) | |||||||||||
| AU1578027 | 27.42 | 0.25 | 16.60 | 0.12 | 49.60 | 0.44 | 0.79 | 0.89 | 25 | K-fsp | LA-MC-ICP-MS |
| AU1952106 | 167.32 | 2.81 | 31.10 | 0.44 | 130.15 | 2.08 | 0.98 | 1 | 31 | K-fsp | LA-MC-ICP-MS |
| AU1952113 | 23.03 | 0.62 | 16.14 | 0.09 | 40.29 | 0.33 | 0.52 | 0.75 | 20 | K-fsp | LA-MC-ICP-MS |
| AU1952115 | 90.08 | 1.87 | 23.25 | 0.49 | 94.61 | 1.94 | 0.91 | 0.99 | 13 | K-fsp | LA-MC-ICP-MS |
| AU1952118 | 31.99 | 1.28 | 16.91 | 0.28 | 47.61 | 1.51 | 0.53 | 0.94 | 5 | K-fsp | LA-MC-ICP-MS |
| AU1952118 | 31.283 | 0.0006 | 17.0005 | 0.0004 | 46.922 | 0.001 | 0.99 | 0.99 | 1 | K-fsp | TIMS |
| AU2005110 | 16.60 | 0.14 | 15.43 | 0.05 | 35.96 | 0.19 | 0.54 | 0.18 | 30 | K-fsp | LA-MC-ICP-MS |
| AU1470099 | Ca. 17–22* | Ca. 15–16* | Ca. 37–42* | n/a | n/a | 44 | K-fsp | LA-MC-ICP-MS | |||
| AU1578043 | Ca. 17–27* | Ca. 15–17* | Ca. 36–43* | n/a | n/a | 48 | K-fsp | LA-MC-ICP-MS | |||
| AU1578067 | Ca. 17–29* | Ca. 15–17* | Ca. 36–45* | n/a | n/a | 47 | K-fsp | LA-MC-ICP-MS | |||
| AU1952106 | 188.704 | 0.0125 | 33.243 | 0.0033 | 144.248 | 0.019 | 0.99 | 0.99 | 1 | PD | TIMS |
| AU1952106 | 179.56 | 0.0018 | 32.428 | 0.0004 | 137.912 | 0.002 | 0.99 | 0.99 | 1 | PD | TIMS |
| AU1952109 | 272.359 | 0.0293 | 37.831 | 0.0061 | 153.445 | 0.007 | 0.99 | 0.99 | 1 | PD | TIMS |
| AU1952109 | 494.612 | 0.0067 | 47.422 | 0.0007 | 312.223 | 0.006 | 0.99 | 0.99 | 1 | PD | TIMS |
| AU1999987 | 25.028 | 0.0004 | 16.006 | 0.0003 | 41.027 | 0.001 | 0.99 | 0.99 | 1 | PD | TIMS |
| AU2003315 | 19.565 | 0.0002 | 15.764 | 0.0001 | 40.294 | 0.0005 | 0.99 | 0.99 | 1 | PD | TIMS |
| AU2003315 | 19.017 | 0.0003 | 15.68 | 0.0003 | 39.227 | 0.001 | 0.99 | 0.99 | 1 | PD | TIMS |
| AU1578027 | 34.796 | 0.021 | 17.334 | 0.010 | 56.750 | 0.057 | 0.85 | 0.82 | 1 | WR | MC-ICP-MS |
| AU1578027 | 34.735 | 0.021 | 17.327 | 0.010 | 56.836 | 0.057 | 0.85 | 0.82 | 1 | WR | MC-ICP-MS |
| AU1578043 | 40.051 | 0.024 | 17.792 | 0.011 | 46.621 | 0.047 | 0.85 | 0.82 | 1 | WR | MC-ICP-MS |
| AU1578043 | 40.025 | 0.024 | 17.794 | 0.011 | 46.616 | 0.047 | 0.85 | 0.82 | 1 | WR | MC-ICP-MS |
| AU1578067 | 31.043 | 0.019 | 16.840 | 0.010 | 50.920 | 0.051 | 0.85 | 0.82 | 1 | WR | MC-ICP-MS |
| AU1578067 | 31.039 | 0.019 | 16.834 | 0.010 | 50.880 | 0.051 | 0.85 | 0.82 | 1 | WR | MC-ICP-MS |
| AU1578073 | 108.308 | 0.065 | 24.532 | 0.015 | 84.515 | 0.085 | 0.85 | 0.82 | 1 | WR | MC-ICP-MS |
| AU1578073 | 109.186 | 0.066 | 24.622 | 0.015 | 84.766 | 0.085 | 0.85 | 0.82 | 1 | WR | MC-ICP-MS |
| AU1952106 | 209.290 | 0.126 | 34.173 | 0.021 | 158.387 | 0.158 | 0.85 | 0.82 | 1 | WR | MC-ICP-MS |
| AU1952106 | 209.848 | 0.126 | 34.233 | 0.021 | 159.858 | 0.160 | 0.85 | 0.82 | 1 | WR | MC-ICP-MS |
| AU1952109 | 998.213 | 0.599 | 76.654 | 0.046 | 806.376 | 0.806 | 0.85 | 0.82 | 1 | WR | MC-ICP-MS |
| AU1952109 | 1018.415 | 0.611 | 78.102 | 0.047 | 823.697 | 0.824 | 0.85 | 0.82 | 1 | WR | MC-ICP-MS |
| AU1952113 | 26.242 | 0.016 | 16.390 | 0.010 | 42.332 | 0.042 | 0.85 | 0.82 | 1 | WR | MC-ICP-MS |
| AU1952113 | 26.181 | 0.016 | 16.388 | 0.010 | 42.361 | 0.042 | 0.85 | 0.82 | 1 | WR | MC-ICP-MS |
| AU1952118 | 43.327 | 0.026 | 17.891 | 0.011 | 57.942 | 0.058 | 0.85 | 0.82 | 1 | WR | MC-ICP-MS |
| AU1952118 | 43.246 | 0.026 | 17.886 | 0.011 | 57.789 | 0.058 | 0.85 | 0.82 | 1 | WR | MC-ICP-MS |
| AU1999987 | 22.786 | 0.014 | 16.100 | 0.010 | 42.069 | 0.042 | 0.85 | 0.82 | 1 | WR | MC-ICP-MS |
| AU1999987 | 22.781 | 0.014 | 16.094 | 0.010 | 42.056 | 0.042 | 0.85 | 0.82 | 1 | WR | MC-ICP-MS |
| AU2003315 | 19.621 | 0.012 | 15.771 | 0.009 | 40.465 | 0.040 | 0.85 | 0.82 | 1 | WR | MC-ICP-MS |
| AU2003315 | 19.621 | 0.012 | 15.772 | 0.009 | 40.459 | 0.040 | 0.85 | 0.82 | 1 | WR | MC-ICP-MS |
ρ is the correlation coefficient of the errors of 206Pb/204Pb versus 207Pb/204Pb (ρ6 − 7) and 206Pb/204Pb versus 208Pb/204Pb (ρ6 − 8). N is the number of analyses. In situ LA-MC-ICP-MS results are reported as weighted means for unimodal population K-feldspar and ranges for partially re-equilibrated K-feldspar. Solution-mode TIMS and MC-ICP-MS results are single analysis results. PD: leached, partial digests of whole-rock; WR: unleached, bulk whole-rock digests.
*Partially re-equilibrated K-feldspar.
In 206Pb/204Pb versus 207Pb/204Pb space, the Pb isotopes measured in K-feldspar form a well-defined linear trend with a slope of 0.1040 ± 0.0008 (Fig. 2). In addition to the seven K-feldspar samples yielding homogenous Pb isotope results (hereafter termed ‘unimodal-population K-feldspar’), three samples from the Broken Hill and Olary Domains yield K-feldspar Pb isotope data that spread along a linear array with scatter greater than can be accounted for by analytical uncertainty alone (Fig. 2d), indicating inter-crystal Pb isotopic variability with 206Pb/204Pb = ~17 to 29, 207Pb/204Pb = ~16 to 17, and 208Pb/204Pb = 36 to 42 (hereafter termed ‘scattered K-feldspar’). The individual spot results obtained on several different K-feldspar crystals in these three scattered K-feldspar samples plot along the same trend defined by the unimodal-population K-feldspar in uranogenic Pb space. With the exception of the most radiogenic sample (AU1952109), Pb isotope ratios measured on the leached, partial whole-rock digestions broadly align with the trend defined by K-feldspar but slightly deviate toward the right of the K-feldspar regression (Fig. 2), as would be expected for U-bearing systems that are subject to some degree of radiogenic ingrowth (Halla, 2018). Different leached aliquots of the same partial whole-rock digestions yield distinct Pb isotope ratios, as a function of differential leaching and digestion efficiency associated with open beaker digestion, thus, reflecting variable U/Pb ratio between different sample aliquots (i.e. controlled by the proportion of high-U/Pb to low-U/Pb mineral phases in the respective digest). Bulk, unleached whole-rock Pb isotope ratios are higher than their leached counterparts and deviate more strongly from the trend defined by K-feldspar. The bulk, unleached whole-rock duplicates produce internally consistent Pb isotope ratios within each sample. With the exception of the most radiogenic sample (AU1952109), the bulk whole-rock Pb isotope ratios broadly align with isochrons expected from the crystallization ages of these samples (Fig. 2). Single spot results of K-feldspar Pb isotope analysis, as well as whole-rock and K-feldspar TIMS results, and whole-rock MC-ICP-MS results are provided in Supplementary Table A.
Apatite U–Pb
Combined apatite U–Pb data of all samples define broad mixing arrays between a common Pb component and radiogenic components at ~1600 Ma and ~ 450 Ma (Fig. 4). The common Pb composition in apatite appears to closely match that constrained by K-feldspar 207Pb/206Pb. Using the K-feldspar constrained common Pb composition to calculate common Pb corrected ages yields probability density peaks at ~1.6–1.4 Ga and 500–300 Ma, supporting the two radiogenic age components apparent in the mixing arrays in Tera-Wasserburg space. Furthermore, three of the analyzed apatite samples yielded apparent intercept ages of 1591 ± 62 Ma (MSWD = 3.3, n = 10, sample AU1578073), 466 ± 54 Ma (MSWD = 13, n = 10, sample AU1952113), and 452 ± 28 Ma (MSWD = 2.7, n = 15, sample AU1578027), supporting Paleoproterozoic/Mesoproterozoic and Ordovician age components. The intercept ages of these three samples are interpreted as the best estimate of the average timing of cooling below 375°C to 600°C, which is conventionally considered to be the closure temperature of Pb diffusion in apatite (Schoene & Bowring, 2007; Cochrane et al., 2014). The overdispersion of these ages, as indicated by MSWDs > > 1, implies protracted thermally activated volume diffusion of Pb and/or a fluid-mediated recrystallization process (see Supplementary Information D for a detailed discussion).
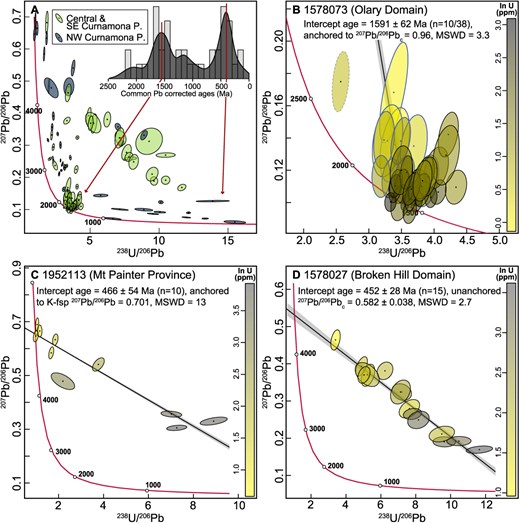
Tera-Wasserburg diagrams showing apatite U–Pb data. (A) Two broad mixing trends are defined by the analyzed 10 samples (number of analyses = 107) between a common Pb component and a U/Pb component at ca. 1.6 Ga and 450 Ma, respectively. The inset shows a kernel density estimate of common Pb corrected ages of samples with a common Pb composition constrained by K-feldspar 207Pb/206Pb (number of analyses = 38), showing two peaks at ca. 1.6 Ga and 400 Ma, in agreement with the Tera-Wasserburg diagram. (B-D) Tera-Wasserburg diagrams of individual samples that define intercept ages color coded by U concentration. The quoted age uncertainty is 95% confidence multiplied by a factor to account for overdispersion (for details see Vermeesch, 2018). The uncertainty of 207Pb/206Pbc for unanchored regressions is quoted at the 95% confidence level. The intercept age of sample 1 578 037 (B) was calculated considering only analyses relatively unaffected by Pb-loss (ellipses with blue borders); see Supplementary Information D for details. Ellipse with dashed outline indicates one omitted analysis that overlapped with the epoxy. The reader is referred to the web version of this paper for the color representation of this figure.
The apatite age of 1591 ± 62 Ma in sample AU1578073 (Olary Domain), despite its large uncertainty, nonetheless clearly implies a cooling age that post-dates the magmatic zircon U–Pb age (1687 ± 4 Ma, Table 1) of this sample by several 10s of Ma, demanding a post-crystallization re-heating event and/or slow cooling. A re-heating event followed by slow cooling is in accord with previous thermochronological data from the Broken Hill Domain supporting long-lived high thermal gradient metamorphism and anatexis (from ~1630 Ma to ~1550 Ma) during the Olarian Orogeny (De Vries Van Leeuwen et al., 2022).
The apatite ages of 466 ± 54 Ma in sample AU1952113 (Mount Painter Inlier) and 452 ± 28 Ma in sample AU1578027 (Broken Hill Domain) post-date the magmatic zircon U–Pb ages of these samples (1560 ± 3 Ma and 1695 ± 4 Ma, Table 1) by >1 Ga, indicating a Paleozoic thermal event that is not recorded by zircon in these samples. However, in a previous study U–Pb ages of ~455 Ma were obtained from zircon rims in the Mount Painter and Mount Babbage Inliers (Elburg et al., 2012). In addition, the apatite ages coincide with the intrusion of a number of granite bodies in the Mount Painter Inlier, including amongst others, the ~450–440 Ma British Empire granite (Elburg et al., 2003; McLaren et al., 2006) whose origin was previously linked to mid-crustal anatexis related to the burial of the high heat-producing Mount Painter basement rocks (McLaren et al., 2006). Furthermore, the apatite ages coincide with a ~ 525 Ma to 490 Ma metamorphic event that has been previously identified in the southern Curnamona Province based on monazite U–Pb and garnet Sm–Nd data (Clark et al., 2006; Rutherford et al., 2006).
Apatite U–Pb single-spot data are provided in Supplementary Table B. A detailed description of the apatite U–Pb results is provided in Supplementary information D.
DISCUSSION
The magmatic source of extreme crust
Extremely radiogenic Pb isotope ratios measured in K-feldspar and whole-rock samples from the northwestern Curnamona Province indicate an unusual U and Th enrichment (resulting in rocks with high U/Pb and Th/Pb ratios), which is consistent with the whole-rock trace element geochemistry of these samples (Fig. 5). Due to their strong incompatibility, U and Th tend to be concentrated in the most felsic melts (Cuney, 2014). Consequently, these elements have been continuously transferred from the mantle into the crust over geologic time (Cuney, 2014), with the upper crust being the most enriched in these elements, with an average U concentration of ~3 μg/g and average Th concentration of ~11 μg/g (Rudnick et al., 2003) (Fig. 5). Lead isotope ratios measured in K-feldspar and whole-rock samples reported here are up to an order of magnitude higher than the estimated average ratios for normal upper continental crust (Zartman & Doe, 1981), requiring an extreme fractionation process to have occurred. To understand the underlying geodynamic driver of this process, we first need to constrain the source of these fractionated magmas.
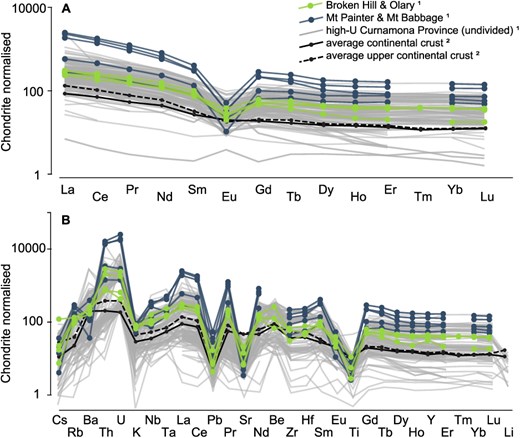
Whole-rock rare earth element (A) and trace element (B) pattern normalized to chondrite (McDonough & Sun, 1995). The samples studied here are shown in green (Broken Hill and Olary Domains) and blue (Mount Painter and Mount Babbage Inliers), respectively. Average continental crust (black lines) and high-U (>10 μg/g) igneous rocks from the Curnamona Province are shown for comparison. 1Whole-rock geochemical data are extracted from the Geoscience Australia portal (accessible via https://portal.ga.gov.au/); literature data for the samples studied here is summarized in Supplementary Table C. 2Average crust elemental concentrations are from Rudnick et al. (2003).
The slope of the regression through K-feldspar Pb isotope ratios in uranogenic space, if treated as an isochron, yields an apparent age of 1698 ± 19 Ma. However, this apparent age predates the crystallization ages of ten out of 13 of the rocks studied here (Table 1), and therefore, cannot reflect the age of a geological process affecting these granitoids. As K-feldspar does not incorporate U or Th, the Pb isotope ratios recorded by K-feldspar do not change with time due to radiogenic ingrowth (Halla, 2018). Thus, in rocks that remain sufficiently cool after crystallization, K-feldspar should preserve the initial Pb isotope ratio of its parental magma at the time of crystallization. Specifically, K-feldspar with crystal diameters of 100 μm to 1 mm, as analyzed in this study, has an expected closure temperature for Pb diffusion of ~550°C to 700°C (Cherniak, 1995). If the closure temperature of Pb diffusion in K-feldspar is exceeded (e.g. during metamorphic events), Pb isotopes in K-feldspar can re-equilibrate with their matrix (Kamber et al., 2003; McLaren et al., 2006; Halla & Heilimo, 2009). Hence, Pb isotope ratios of such isotopically re-equilibrated K-feldspar would define secondary isochrons (i.e. paleo-isochrons) whose slope is controlled by the age of initial closure of the whole-rock system to Pb diffusion (t1) and the age of Pb isotope re-equilibration in K-feldspar (t2) (Halla, 2018; Liebmann et al., 2025). The concept of secondary isochrons is well established, and K-feldspar secondary isochrons have been documented in many locations worldwide (Kamber et al., 2003; McLaren et al., 2006; Halla & Heilimo, 2009). The linear trend defined by the 206Pb/204Pb and 207Pb/204Pb ratios in K-feldspar is thus better interpreted as a secondary isochron, where the unimodal-population K-feldspar samples reflect complete isotopic re-equilibration, and the scattered K-feldspar samples reflect partial isotopic re-equilibration. This interpretation is strongly supported by the apatite U–Pb data from these samples: substituting t1 and t2 in a standard isochron slope calculation (using the equation provided in Supplementary Information D) with the two main age components recorded by apatite (so that t1 = ~1.5–1.4 Ga and t2 = ~500–300 Ma) reproduces the slope of the secondary K-feldspar isochron (Fig. 6). Despite Pb isotopic re-equilibration in K-feldspar, the secondary isochron nonetheless provides constraints on the primary magma source, as secondary isochrons intersect at the system’s initial Pb isotope composition (Halla, 2018; Liebmann et al., 2025). The bulk whole-rock Pb ratios broadly define an errorchron (an over-dispersed isochron) with a slope expected for the crystallization age of these samples, indicating that the whole-rock U–Pb isotopic system remained largely undisturbed during the thermal event that led to re-equilibration of K-feldspar with only minor degrees of open system behavior. Thus, the extreme U and Th enrichment recorded by these rocks is a primary feature that was present by the time of emplacement (i.e. the extreme enrichment is not a function of secondary fluid alteration or other open system behavior). Placing our results into a context of existing Pb isotope data allows us to constrain the spatial and temporal extent of the magmatic source.
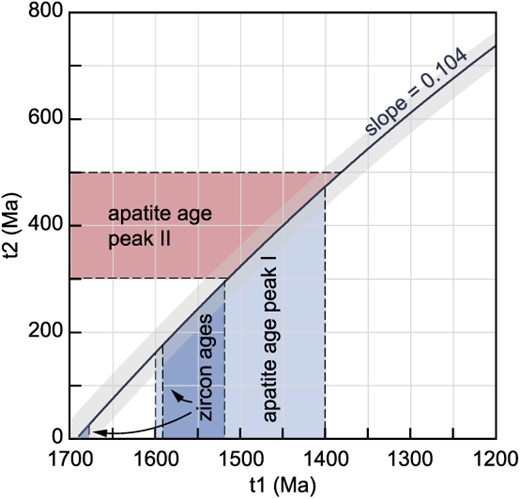
Curved line indicating the combination of ages t1 (initial closure of the whole-rock system) and t2 (K-feldspar re-equilibration) that yield a secondary isochron slope of 0.1040 ± 0.0008 (as defined by K-feldspar Pb ratios, see Fig. 2). Zircon and apatite U–Pb ages are shown for comparison. Initial closure of the system at ca. 1500–1400 Ma and a thermal event leading to re-equilibration at ca. 500–300 Ma (as supported by apatite U–Pb ages) reproduce the slope of the secondary K-feldspar isochron.
Extreme U enrichment is also evident in the eastern Gawler Craton, which hosts the world's largest U resource, the supergiant Olympic Dam IOCG-U deposit (Johnson & Cross, 1995). The ~1590 Ma Olympic Dam ore deposit is hosted within the coeval Roxby Downs Granite, a member of the 1595 Ma to 1575 Ma Hiltaba Suite (Johnson & Cross, 1995). The Hiltaba Suite and their extrusive equivalents, the Gawler Range Volcanics, constitute voluminous and widespread magmatism in the Gawler Craton and are considered to form part of a silicic large igneous province (Allen et al., 2008; McPhie et al., 2008). Our results support a genetic link between the Gawler silicic large igneous province and magmatism in the Curnamona Province. Namely, the secondary Pb–Pb isochron defined by K-feldspar from the Curnamona Province intersects with Pb isotope ratios of Hiltaba Suite feldspar (Chapman et al., 2019) (Fig. 2), providing evidence for a common source. Beyond that, our results suggest that the same source was tapped during magmatism that formed the ~1690 Ma to 1670 Ma eastern Tunkillia Suite and the ~1620 Ma to 1610 Ma St Peter Suite in the Gawler Craton (Chapman et al., 2021), as well as the mineralization event that formed the ~1685 Ma Broken Hill orebody (Cooper et al., 1969) (Fig. 2). This interpretation of a common source is supported by seismic tomography data indicating a coherent, lithospheric mantle domain underlying the Gawler Craton and the Curnamona Province (Skirrow et al., 2018).
Previously suggested models for the genesis of the Gawler silicic large igneous province and correlative units in the Curnamona Province include a mantle plume, crustal extension, and delamination (Wade et al., 2006; Betts et al., 2009; Skirrow et al., 2018). Mantle plume related magmatism commonly includes a source component from the asthenosphere (Ernst, 2014). Both the Broken Hill orebody and the Gawler silicic large igneous province have previously been interpreted to derive from moderately enriched mantle sources, such as a subduction-modified subcontinental lithospheric mantle (Plimer, 1985; Crawford, 2006; Chapman et al., 2019), and thus, do not directly support the involvement of an uncontaminated plume. Furthermore, it has been argued that the relative absence of tholeiitic basalts in the Gawler silicic large igneous province is inconsistent with a mantle-plume origin (Skirrow et al., 2018). Alternatively, crustal extension or post-orogenic lithospheric delamination may have driven the ascent of asthenospheric material, serving as a heat source for the partial melting of the subcontinental lithospheric mantle (Wade et al., 2006; McLaren & Powell, 2014; Gorczyk & Vogt, 2015; Skirrow et al., 2018). The initial extraction of lithospheric mantle material must have occurred at ~1.7 Ga, as this source was tapped during the mineralization of the Broken Hill orebody (1685 Ma) and during magmatism that formed the Paleoproterozoic Curnamona Province granitoids (1695–1687 Ma) and the eastern Tunkillia Suite (1690–1670 Ma). This initial mantle extraction episode was followed by a second major pulse of melt generation from the same source at ~1.6 Ga resulting in the emplacement of the St Peter Suite (1620–1610 Ma), the Gawler silicic large igneous province (1595–1575 Ma) and the Mesoproterozoic Curnamona Province granitoids (1586–1541 Ma). The second pulse of melt generation at ~1.6 Ga occurred during periods of crustal shortening in both the Curnamona Province and the Gawler Craton (Hand et al., 2007; Conor & Preiss, 2008), and temporally correlates with uplift in the Curnamona Province at ~1580 Ma (Conor & Preiss, 2008), consistent with delamination, which may be induced by compressional episodes and commonly results in uplift (Krystopowicz & Currie, 2013; Gorczyk et al., 2015). The first pulse of melt generation at 1.7 Ga coincides with crustal thinning in the Curnamona Province (Conor & Preiss, 2008), and the Tunkillia Suite in the Gawler Craton is interpreted to be late- to post-orogenic, associated with the waning stages of the 1730 Ma to 1690 Ma Kimban Orogeny (Hand et al., 2007). Thus, the first pulse may reflect crustal extension (e.g. in a back arc basin, Wade et al., 2006) pre-dating delamination. Alternatively, the 1.7 Ga pulse could mark the initiation of the delamination process which continued until 1.6 Ga, in accord with numerical models suggesting that mantle and crustal melt generation in response to delamination may occur in multiple pulses over 10s to 100 of millions of years (Gorczyk et al., 2015; Laurent et al., 2017).
The magnitude of U–Th–Pb fractionation
The magnitude of U and Th enrichment (i.e. expressed as the approximate 238U/204Pb and 232Th/204Pb of the whole-rock at the time of crystallization) in the samples studied here can be quantified based on the changes in Pb isotope ratios between t1 and t2 (as constrained by apatite and the secondary K-feldspar isochron) using the equations provided in Supplementary Information D. To evolve the Pb isotope ratios from the initial ratio (i.e. the Broken Hill Pb isotope composition) to the Pb isotope ratios measured in K-feldspar requires 238U/204Pb between ~40 and 770, and 232Th/204Pb between ~80 and 1660, and consequently an average 232Th/238U of ~2, which is significantly lower than the crustal average of ~4 (Stacey & Kramers, 1975). Hence, U was enriched to a higher degree than Th, and both U and Th were enriched to a higher degree than Pb, an enrichment process supported by the currently observed whole-rock U, Th, and Pb concentrations in these samples: Namely, U, Th, and Pb concentrations are up to 100, 80, and 14 times as high as the crustal average in the northwestern part of the Curnamona Province, and up to 13 (U), 14 (Th), and 4 (Pb) times as high as the crustal average in the southeastern part (Fig. 5, Supplementary Table C). The fractionation between U and Th in crustal rocks, with decreasing Th/U in the most fractionated rocks is a common observation, and is best explained through the influence of Th- and U-sequestering accessory minerals (Rudnick et al., 2003; Kirkland et al., 2015), whereas preferential enrichment in U and Th over Pb requires a Pb-sequestering mineral phase (e.g. plagioclase) (Rudnick, 1992).
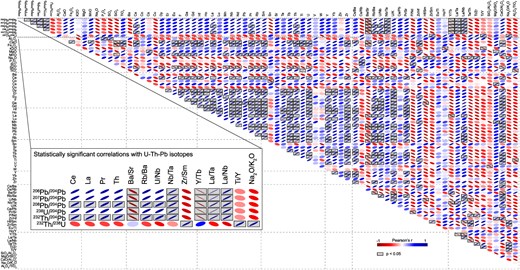
Correlations between measured K-feldspar Pb isotope ratios, calculated whole-rock U–Th–Pb ratios, and major and trace element concentrations and ratios. The correlation matrix shows Pearson’s correlation coefficient (r), where r = 1 indicates perfect positive linear correlations and r = −1 perfect negative linear correlations. The gray boxes highlight statistically significant correlations (P < 0.05). Statistically significant correlations with K-feldspar Pb isotope ratios, and whole-rock U–Th–Pb ratios are shown enlarged in the inset.
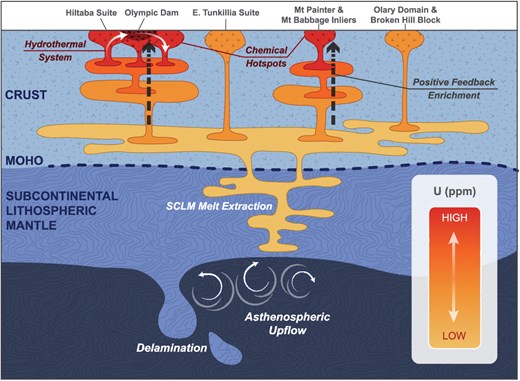
Schematic diagram illustrating the development of a chemical hotspot within the basement rocks of the Curnamona Province and the Gawler Craton. Asthenospheric upflow at ca. 1.7 Ga and 1.6 Ga (potentially related to delamination following the model of Skirrow et al. (2018) leads to partial melting of the subcontinental lithospheric mantle beneath the Curnamona Province and the Gawler Craton. This source is tapped during 1.7 Ga to 1.6 Ga magmatism in the Curnamona Province (producing normal to extremely radiogenic rocks) and Gawler Craton, as well as during 1.7 Ga mineralization of the Broken Hill ore body. At ca. 1.6 Ga the emplacement of large volumes of melt into the thickened post-orogenic crust drives prolonged crustal anatexis and multiple steps of partial melting, initiating a positive feedback loop which ultimately results in the formation of a chemical hotspot through strong concentration of incompatible, heat producing elements (i.e. U, Th, K). In our proposed model, the degree of melt enrichment is a function of insulation controlled by crustal thickness and heat-supply from asthenospheric upwelling and radiogenic heat production.
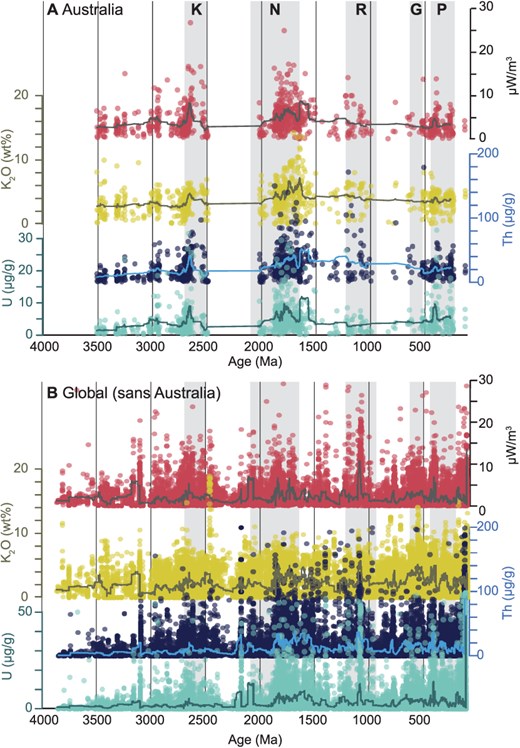
Heat production (time-corrected), and Th, U, and K concentrations igneous rocks through time. Solid lines indicate moving averages. (A) Australia (n = 896) (extracted from the Geoscience Australia portal, accessible via https://portal.ga.gov.au/), (B) global compilation; sans Australia (n = 43 910) (Gard et al., 2019). Radiogenic heat production was calculated after Rybach (1976) based on time corrected U, Th, and K concentrations, assuming an average crustal density of 2.7 g/cm3. Vertical gray bars show the approximate timings of supercontinents after Condie & Aster (2013). K, Kenorland; N, Nuna; R, Rodinia; G, Gondwana; P, Pangea.
While both U- and Th-enrichment, as well as Th/U fractionation are expected to occur during crustal differentiation, the magnitude of fractionation observed in our samples is unusual when compared to the average crust, which is also evident from whole-rock trace element pattern: All samples are enriched in rare earth elements (except Eu) and depleted in Sr compared to the average upper crust and exhibit large negative Eu anomalies (Eu/Eu* = 0.1 to 0.6) (Fig. 5). These features are most strongly pronounced in the most U- and Th-enriched rocks of the northwestern Curnamona Province supporting that the U- and Th-enrichment in our samples is the results of intracrustal differentiation in the presence of plagioclase (e.g. Taylor & McLennan, 1995; Rudnick et al., 2003). This is further supported by statistically significant (P < 0.05) positive correlations observed between K-feldspar 20XPb/204Pb ratios, as well as whole-rock 238U/204Pb and 232Th/204Pb and trace element ratios that typically track intracrustal differentiation (e.g. Nb/Ta, La/Ta, La/Nb, Rb/Ba, U/Nb) (Fig. 7). Further, statistically significant negative correlations are observed between 20XPb/204Pb, 238U/204Pb, 232Th/204Pb, and Ba/Sr (Fig. 7). The segregation of Ba-bearing minerals, such as K-feldspar, can result in decreasing Ba/Sr ratios in highly fractionated melts (El Bouseily & El Sokkary, 1975). The most strongly fractionated rocks from the northwestern part of the Curnamona Province have the strongest negative K anomaly (Fig. 5) along with the highest Ba/Sr ratios, which supports the segregation of K-feldspar. In addition, accessory minerals such as zircon, monazite, and Ti-oxides may have influenced the U-Th-Pb fractionation in the samples studied here: The negative correlation of 20XPb/204Pb, 238U/204Pb, and 232Th/204Pb with Y/Tb ratios may be controlled by zircon, which preferentially incorporates Y over Tb (Rubatto, 2002). Furthermore, the Th-controlled ratios (i.e. 208Pb/204Pb and 232Th/204Pb) show statistically significant correlations with the light rare earth elements (LREE) La, Ce, and Pr, as well as Th, strongly supporting the influence of monazite, a LREE-Th-phosphate, on the sequestering of Th in these samples. The 232Th/238U ratio shows no statistically significant correlations with any of the element ratios discussed above, however, it is notable that the trends observed in 232Th/238U in relation to these ratios are contrary to the trends observed in 20XPb/204Pb, 238U/204Pb, and 232Th/204Pb ratios (Fig. 7), implying that in a general sense, the processes that controlled U- and Th- enrichement in these samples tend to enrich U more strongly than Th, which is most notable in the most fractionated melts. This is supported by the negative correlation of 232Th/238U and Na2O/K2O, which generally decreases during crustal differentiation (e.g. Taylor & McLennan, 1995; Rudnick et al., 2003). The stronger enrichment of U over Th shown in our samples is consistent with trends typically associated with intracrustal differentiation, e.g. in the average upper crust U is enriched by a factor of ca. 14, whereas Th is enriched by a factor of ca. 9, as compared to the lower crust (Rudnick et al., 2003). The 232Th/238U ratios show statistically significant positive correlations with Zr/Sm and Ti/Y indicating that accessory mineral phases such as zircon and Ti oxides (e.g. rutile or ilmenite) may have influenced differential enrichement of Th and U in these samples. The influence of Ti-bearing accessory minerals is further supported by the strong Ti-depletion in all samples compared to the average crust, which is most pronounced in the most fractionated samples of the northwestern Curnamona Province (Fig. 5).
Tectono-chemical drivers of extreme fractionation
The extreme degree of intracrustal fractionation indicated by our samples requires a mechanism that enables processes driving crustal differentiation (e.g. partial melting and fractional crystallization) at a high rate or over a protracted period of time (Cuney, 2014). Incompatible, heat producing elements, such as U, Th, and K are expected to be concentrated in partial melts, especially, where the degree of that partial melting is low (Cuney, 2014). The concentration of heat producing elements has a profound influence on the thermochemical evolution of the continental crust (Bea, 2012; Yakymchuk & Brown, 2019). Numerical modeling has demonstrated that thickened crust (e.g. 65–70 km) that is moderately enriched in heat producing elements—with a heat production of 1.2 μWm−3 or higher—can produce extensive volumes of crustal melts within 10s of Myr (Bea, 2012). Similarly, a combination of moderately thick crust (i.e. ≥30–35 km) and a relatively high heat production of 1.4 μWm−3 would also be capable of producing extensive volumes of crustal melts within 10s of Myr without requiring (but not excluding) heat or material input (Bea, 2012). The heat production in the Gawler Craton is ~3 to 5 μWm−3 and up to 65 μWm−3 in the northwestern Curnamona Province (Neumann et al., 2000), placing the heat-production of these cratons well above the threshold required to cause crustal melting from within-crustal radiogenic heat production alone. The present-day crustal thickness of the Gawler Craton and the Curnamona Province is estimated to be 40 to 45 km (Kennett et al., 2011). While the margins of both cratons were reworked during the 520 Ma to 480 Ma Delamerian Orogeny both appear to have largely remained stable since the early Mesoproterozoic (Hand et al., 2007; Conor & Preiss, 2008). Therefore, the present-day crustal thickness may broadly approximate that at 1.6 Ga, implying a relatively thick, insulating crust that further facilitated the sustained occurrence of anatectic conditions over a prolonged period. We suggest that the ~1.6-Ga mantle extraction event that ultimately led to the formation of the Gawler silicic large igneous province and the Mesoproterozoic Curnamona Province granitoids of this study, initiated a positive feedback scenario driving prolonged anatectic conditions through the generation of partial melts enriched in heat producing elements. A prolonged (~1630–1550 Ma) high thermal gradient style of metamorphism in the Curnamona Province has also been linked to radiogenic heating (De Vries Van Leeuwen et al., 2022). Such protracted anatectic conditions would have resulted in multiple partial melting events following initial mantle extraction, each one further concentrating U, Th, and K in the resulting melts, increasing the potential of radiogenic heating and over time creating a ‘chemical hotspot’ (De Vries Van Leeuwen et al., 2021) (Fig. 8). The insulating effect of thick, post-orogenic crust following the final assembly of Nuna (i.e. manifested by the Olarian Orogeny in the Curnamona Province and the syn-Hiltaba Suite compressional deformation in the Gawler Craton; Hand et al., 2007; Conor & Preiss, 2008; Betts et al., 2016) may have further facilitated this process.
A link between the episodicity of mineral systems and the supercontinent cycle has been previously inferred (Goldfarb et al., 2010; Cawood & Hawkesworth, 2015; Pehrsson et al., 2016). Pehrsson et al. (2016) observed a peak in uranium deposits associated with the final assembly of Nuna and the onset of attempted break-up periods. Orogenic thickening and associated gravitational destabilization is a commonly invoked driving mechanism for lithospheric delamination (Bird, 1984; Levander et al., 2011; Skirrow et al., 2018). Therefore, the final stages of supercontinent assembly (i.e. associated with large-scale mantle extraction triggered by delamination and the emplacement of magmas enriched in heat-producing elements into thick crust) may provide favorable conditions for extreme fractionation events and ultimately positive feedback chemical hotspots. The resulting strongly U (and Th) enriched rocks, serve as the source for economically important ore deposits such as Olympic Dam. In addition, the elevated radiogenic heat production in the crust has the potential to drive hydrothermal systems, which are commonly involved in the formation and upgrading of uranium (and other) deposits (Cuney, 2014; Zappettini et al., 2017). The average concentration of heat producing elements in igneous rocks in Australia and accordingly, the crustal heat production, show peaks at ~2.7 Ga, 1.7 Ga and 1.6 Ga, as well as a minor peak at ~300 Ma, temporally overlapping with Kenorland, Nuna, and Pangea, respectively (Fig. 9), providing support for our model. The average time-corrected heat production during these peak periods is between ~5 and 10 μWm−3 and thus, significantly higher than the heat production of average continental crust (~1–1.2 μWm−3) (Bea, 2012). The global igneous rock record of heat production (excluding Australia) is more scattered, nonetheless, it also reveals a broad peak in heat-producing element concentrations between 1.7 Ga and 1.5 Ga (temporally associated with Nuna), and a less pronounced peak between ~3 Ga and 2.5 Ga (Kenorland) (Fig. 9).
The influence of a chemical hotspot on the thermal evolution of crust
The secondary isochron defined by K-feldspar Pb isotope ratios necessitates a thermal event post-dating initial crystallization by >1 Ga that re-equilibrated Pb isotopes in K-feldspar with the host rock. This later thermal event is supported by two dominant age components identified in the apatite U–Pb age spectra; an older one at ~1600 Ma to 1400 Ma, interpreted to reflect cooling after crystallization, and a younger one at ~500 Ma to 300 Ma interpreted as the timing of a thermal event that resulted in Pb isotopic re-equilibration of K-feldspar. Both age components are supported by apatite U–Pb data obtained from samples from both the southeastern and the northwestern parts of the Curnamona Province. However, partially re-equilibrated K-feldspar in three samples from the Broken Hill and Olary Domains indicate that the thermal event may have been less pronounced in the southeastern part of the Curnamona Province. For completely re-equilibrated K-feldspar samples, the thermal event likely reached temperatures of at least ~550°C to 700°C (Cherniak, 1995). Two apatite intercept ages obtained from the Curnamona Province granitoids (466 ± 54 Ma and 452 ± 28 Ma) imply that this thermal event was associated with the waning stages of the 520 Ma to 480 Ma Delamerian Orogeny (Conor & Preiss, 2008) or post-dated it. These apatite ages are in accord with a previous study, suggesting K-feldspar Pb isotopic re-equilibration in the Mount Painter Inlier related to a ~ 430 Ma thermal event (McLaren et al., 2006). The Arkaroola region, Mount Painter Inlier, was subject to high-temperature low-pressure metamorphism at ~580 Ma to 430 Ma and has been described as an archetypal example of radiogenic heat powered metamorphism (De Vries Van Leeuwen et al., 2021). The southern Curnamona Province also records protracted high-temperature low-pressure at ~520 Ma to 480 Ma (De Vries Van Leeuwen et al., 2023). In summary, our results provide additional evidence of a Mesoproterozoic fractionation event leading to the formation of a chemical hotspot in the Curnamona Province, which likely drove radiogenic heat powered metamorphism in the region >1 Ga later (McLaren et al., 2006; De Vries Van Leeuwen et al., 2021). We posit this crustal heat source supported fluid circulation associated with a second stage of uranium mineralization in the Olympic Dam orebody at 700 Ma to 500 Ma (Ehrig et al., 2021).
CONCLUDING REMARKS
Our data support a common subcontinental lithospheric mantle source for the Curnamona Province basement rocks, the Broken Hill orebody, as well as the Gawler silicic large igneous province hosting the Olympic Dam ore deposit. Based on these results, we are able to propose a coherent model, linking some of theglobally rare features that have been observed in the Curnamona Province and the Gawler Craton, namely, exceptionally high heat-producing crust associated with extreme U and Th enrichment (Neumann et al., 2000; De Vries Van Leeuwen et al., 2022, 2023), silicic large igneous province magmatism and the temporally associated spike in mineral systems (Hand et al., 2007; Allen et al., 2008; Skirrow et al., 2018). Partial melting of the lithospheric mantle beneath the Curnamona Province and the Gawler Craton was likely triggered by lithospheric delamination following the final stages of Nuna assembly. The extreme enrichment in U and Th in the basement rocks of the northwestern Curnamona Province was achieved through prolonged crustal anatexis and multiple steps of partial melting, ultimately resulting in the formation of a chemical hotspot through strong concentration of incompatible, heat producing elements (i.e. U, Th, K). This chemical hotspot facilitated a Paleozoic thermal event that led to re-equilibration of Pb isotopes in K-feldspar and apatite across the Curnamona Province. The Australian and global igneous rock records suggest that high concentrations of heat-producing elements tend to be temporally associated with supercontinents with a particularly strong correlation with Nuna. Thus, supercontinents (especially, during or following the late assembly stages) may provide favorable conditions for the formation of chemical hotspots, through the combination of insulating thickened crust and gravitational destabilization triggering delamination and partial melting episodes. The resulting granitic rocks, enriched in incompatible elements, may serve as important metal sources for certain ore deposits, but more generally providing a heat source to power hydrothermal systems involved in metal concentration.
ACKNOWLEDGEMENTS
We thank Julian Menuge, Alexander De Vries van Leeuwen, and two anonymous reviewers for their constructive comments. Georg Zellmer and Tod Waight are thanked for editorial handling. Kathryn Waltenberg is thanked for facilitating access to samples and geochronological information curated by Geoscience Australia. Lead isotopic data were generated as part of the ‘Lead isotopic map of Australia’ project funded by the Australian Government’s Exploring for the Future program led by Geoscience Australia. Research in the John de Laeter Centre GeoHistory Facility was enabled by AuScope (auscope.org.au) and the Australian Government via the National Collaborative Research Infrastructure Strategy (NCRIS). The NPII multi-collector was obtained via funding from the Australian Research Council LIEF programme (LE150100013). D. Mole and G. Fraser publish with the permission of the CEO, Geoscience Australia.
DATA AVAILABILITY
The data that support the findings of this study are provided in the Supplementary Materials of this article and can also be accessed from the EarthChem (https://doi.org/10.60520/IEDA/113684) and AusGeochem platforms (https://www.doi.org/10.58024/AGCU9CB45313#/).
