


Abstract
Understanding dendritic crystallization is key to obtaining petrological information about rapid crystallization events. Clinopyroxene dendrites from a basaltic rock fulgurite from Nagpur, India, exhibit curved branches with corresponding lattice rotation that exceeds 180° for some branches. This paper combines crystallographic orientation mapping with microstructural observations and compositional information to determine the dendrites’ 3-D morphology and their bending mechanism. Dendrites exhibit a network of branches in the (010) plane, following either {001}* (normal to {001} planes, strong lattice curvature) or < 10–1 > (weak lattice curvature). Three or more orders of branches are observed in the (010) plane, alternating between {001}* and < 10–1>. Side branches with weak lattice curvature extend sub-perpendicular to the (010) plane, following either {021}* (sprouting from {001}* branches) or < 12–1 > (from <10–1 > branches) and defining curved ‘ribbons’ containing their respective central branch. All branches rotate about [010], with a consistent rotation sense regardless of elongation direction in sample or crystal coordinates. Bending must therefore be caused by local asymmetric thermal and compositional fields in the melt, generated by dendritic growth itself, not by sample-scale compositional, thermal or mechanical gradients. The most likely cause of bending is asymmetric distribution of melt supersaturation around branch tips, related to unequal growth rates perpendicular to different facets. Lattice rotation is inferred to occur via preferential incorporation of high densities of [001] (100) edge dislocations of one sign. High inferred dislocation densities imply that the preservation of bent dendrites requires rapid quenching. Higher inferred degree of undercooling (based on microstructural observations) correlates with greater lattice curvature. Bent dendrites can thus potentially be used to deliver information about spatial variations in degree of undercooling and place limits on the history of a sample after dendritic crystallization. Finally, finding lattice rotation exclusively about [010] is a new criterion to identify cryptic dendritic growth stages in euhedral crystals.
INTRODUCTION
Dendritic crystals form via diffusion-controlled growth from a supersaturated liquid, due to the interplay between thermal/chemical diffusion and surface tension (Mullins & Sekerka, 1964; Langer, 1980; Kessler et al., 1988). Dendritic crystals are characteristic of fast crystallization and are observed in many natural contexts, including in volcanic (Fowler et al., 2002; Faure & Schiano, 2004) and plutonic (O’Driscoll et al., 2007; Xing et al., 2017; Barbey et al., 2019) rocks from ultrabasic to silicic compositions, metamorphic aureoles (Beno et al., 2020), frictional melts from shear zones (Camacho et al., 1995; Austrheim & Andersen, 2004), ice (Knight, 1962; Brownscombe & Hallett, 1967), thermal spring carbonates (Jones & Kahle, 1993; Jones, 2017), impactites (Byerly & Lowe, 1994; Dressler & Reimold, 2001), and finally meteorites, including in fusion crusts (Genge & Grady, 1999), impact melt pockets (Scott, 1982; Walton & Spray, 2003), and chondrules (Lofgren & Lanier, 1990; Krot & Rubin, 1994).
Crystals that exhibit ‘growth-induced bending and twisting of the crystal lattice’ are surprisingly common (Shtukenberg et al., 2014). Bent and twisted crystals should not be confused with crystals exhibiting curved morphology without any lattice rotation, which are not the subject of this study. Several mechanisms can lead to dendrite bending, including morphology-induced asymmetric thermal or compositional fields around the dendrite branch (Goto et al., 2016) or tip (Knight, 1962, 1971), orientation perturbations due to impurities (Gránásy et al., 2003), plastic deformation due to high fluid velocity (Dragnevski et al., 2002), perturbation of thermal or compositional fields in a fluid flow (Mullis, 1999; Das et al., 2002), and thermal contraction in a temperature gradient (Aveson et al., 2019). Bent dendrites therefore have the potential to deliver even more information about the circumstances of their formation than regular dendrites, but only if the origin of the bending can be determined.
Clinopyroxene (Cpx) is one of the few minerals so far known to form bent dendrites (Fleet, 1975; Hammer et al., 2010). Cpx is also one of the most abundant minerals in the lithosphere (Prewitt, 1980) and in extraterrestrial rocks (Papike, 1998), and one of the main minerals used for petrogenetic reconstructions (e.g. Ubide & Kamber, 2018; Mollo et al., 2020). Cpx forming from rapidly cooling silicate melts often shows dendritic morphology, alongside compositions that differ from those expected for equilibrium mineral-melt element partitioning (Hammer, 2006; Mollo et al., 2010, 2013b; Pontesilli et al., 2019; Masotta et al., 2020). Deviations from equilibrium render some petrological tools less effective but simultaneously open up new possibilities to understand complex natural systems (Mollo et al., 2011, 2013a; Masotta et al., 2020). Chemical zoning that indicates dendritic growth patterns has been observed in non-dendritic Cpx (Welsch et al., 2016; Pontesilli et al., 2019; Zhou et al., 2021) and olivine (Welsch et al., 2013, 2014; Shea et al., 2015; Xing et al., 2017), showing that crystallization in the dendritic growth regime can be followed by re-equilibration and/or infilling of dendrites. Therefore, understanding the dendritic growth stage could be relevant for a wide variety of igneous rocks. If lattice rotation is preserved during the process of re-equilibration and infilling, bent dendritic precursors could explain some non-dendritic bent crystals reported in the geological literature (Arndt & Fleet, 1979; Welsch et al., 2013; Wieser et al., 2019).
Here, we report on our study of bent Cpx dendrites occurring in a basaltic rock fulgurite (sensuPasek et al., 2012). Natural fulgurites are formed when a lightning strike impacts rocks or unconsolidated soils (Pasek et al., 2012). Artificial (accidental) fulgurites are formed by artificial high current or high voltage electrical discharges from a power line. In all fulgurites, the high-energy input leads to plasma formation and heating to several thousand K. After the discharge ceases, cooling is on the order of 10s to 100 s of K per minute. Whether melting and vaporization of the target material occurs is primarily a function of the total energy deposited over the duration of the discharge, but the energy transfer rate determines the morphology of the fulgurite and the microstructures within it (Pasek et al., 2012; Pasek & Pasek, 2018). The focus of this study was to determine the 3-D morphology of the Cpx dendrites and the origin of the observed lattice rotation. Regardless of whether they are natural or artificial, the temperatures, heating/cooling rates, and thermal gradients prevailing during fulgurite-forming events are comparable to other high energy natural events where dendrites are produced. Studying the morphology and origins of bent Cpx dendrites in a fulgurite promises to provide new petrological information about crystallization at high degrees of undercooling and high cooling rates and also represents a key step toward identifying cryptic phases of bent dendritic growth in skeletal or euhedral Cpx.
METHODS
Sample preparation
The sample was embedded in resin and cut into two pieces. One was prepared as a thin section for transmitted light microscopy, while the counterpart was prepared for reflected light microscopy and electron beam-microanalytical methods. Both samples were mechanically polished using diamond paste. For electron backscatter diffraction (EBSD) analysis, the sample was subsequently chemo-mechanically polished using colloidal silica for 3 hours. Carbon-coating was used to establish electrical conductivity.
Secondary electron imaging and EBSD measurements
Secondary electron (SE) imaging was carried out using an FEI Quanta 3-D field emission gun scanning electron microscope (FE-SEM) at the University of Vienna (see Acknowledgements). Imaging was carried out in standard mode at 15 kV accelerating voltage using a spot size of 4.5 (~50 pA probe current), a 30-μm aperture, and working distances of 11 and 14 mm. The instrument is equipped with an Apollo XV Silicon Drift Detector for energy dispersive x-ray spectrometry (EDS) analysis, which was used for qualitative phase identification during SE imaging, both with the settings described above and also at 10 kV accelerating voltage.
The same SEM was used to determine crystallographic orientations via EBSD analysis, using 15 kV accelerating voltage in analytic mode, with a spot size of 1.0 (~4 nA probe current), 1-mm aperture, and 14-mm working distance. The sample was tilted to give a beam incidence angle of 20°. EBSD scans were acquired using an EDAX Digiview 5 EBSD camera (elevation angle 5°) and the OIM DC v7.3.1 software. An EBSD camera binning of 8 × 8 pixels, a Hough θ step size of 1° and a 9 × 9 convolution mask was used for all scans. Binned pattern size for Hough transforms was at 120 or 140 pixels. Scans used a hexagonal grid with step sizes ranging from 90 to 100 nm. Cpx was indexed as monoclinic (b-setting), using the lattice parameters: a = 9.585 Å, b = 8.776 Å, c = 5.26 Å, and β = 106.85°.
EBSD scans were processed and analyzed using the MATLAB toolbox MTEX (Bachmann et al., 2010). Pixels with fit values above 1.5 and/or confidence index values below 0.05 were reclassified as not indexed. Grains were calculated using a misorientation angle threshold of 15°. EBSD pixels belonging to grains less than 2 pixels in size were removed before recalculating grains with the same misorientation angle threshold to obtain the final datasets used for analysis.
The lattice curvature of dendrite branches was determined by manually selecting between three and 20 points along the length of branches in the EBSD image quality map. Lattice curvature was calculated by (1) dividing the misorientation angle between neighboring profile points by the straight-line distance between them and taking the mean of these values and (2) summing the total length and total misorientation angle of the entire profile and calculating the ratio of these values. The measurement was accepted if the two results lay within ±0.5°/μm, in which case their mean was taken, as neither method is a priori more accurate, precise, or unbiased, and thus both values equally preferable.
Electron probe microanalyzer point measurements and maps
Point measurements of the chemical composition of glass and Cpx and an x-ray element distribution map were acquired using a Cameca SXFiveFE electron probe microanalyzer (EPMA) equipped with a FEG Schottky emitter, located at the Department of Lithospheric Research, University of Vienna. All point analyses were carried out using 20 nA probe current, 15 kV accelerating voltage, and a spot size of 5 μm. The map was acquired in beam scan mode, with 40 nA beam current and 20 kV accelerating voltage. Map size was 380 × 380 pixels with step size of 422 nm, corresponding to ~160 × 160 μm2. Dwell time per pixel was 45 ms. Relative Mg, Fe, Ca, Na, and K concentrations were mapped using five wavelength dispersive spectrometers set to the corresponding Kα emission wavelengths for each element. Simultaneously, relative concentrations of Al, Si, and Ti were recorded using a Bruker XFlash EDS detector.
Terminology
Throughout this paper, we follow Lofgren (1974) by defining a dendritic crystal as a single crystal exhibiting branching, typically with a tree-like appearance. We use the terms dendrite and dendritic crystal interchangeably. Specific terms used to refer to parts of complex dendritic structures are defined in Table 1 and visualized in Fig. 1. Crystallographic directions are denoted as [uvw] for a specific direction or < uvw> for all symmetric equivalents. Likewise, crystallographic planes are denoted as (hkl) for specific planes and {hkl} for all symmetric equivalents. The pole to a given plane or set of planes is indicated by a trailing * symbol.
Definitions of terms used to describe dendrite branches in this work
| Nth order branch | A first-order branch does not appear to sprout from any another branch. A branch sprouting from a first order branch is a second-order branch, and so on. For 2-D images, specific values of hierarchical order always refer only to that 2-D view. |
| Branch type | All branches with the same elongation direction with respect to the crystal structure are examples of a single type of branch. |
| Side branch | All the branches directly sprouting from a particular branch are side branches of that branch. |
| Main branch | A branch is referred to as a main branch if it sprouts branches that they have side branches, i.e. it is the source of two or more higher orders of branches. |
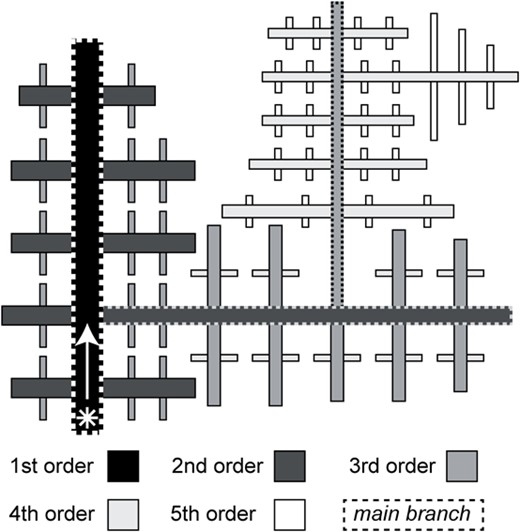
Sketch of a dendritic crystal, illustrating terminology used in this work (see Table 1 for details). The asterisk indicates the start of the dendrite. The hierarchical order of branches is indicated by shades of gray.
Inference of dendrite branch growth directions
For dendrites with side branches with mirror symmetry about a central branch, where branches on both sides were inclined relative to the central branch to create a fern-like geometry, the side branches were assumed to tilt ‘forwards’ into the growth direction, based on analogy with experiments and models of dendritic growth (e.g. Langer, 1980). For radially arranged Cpx crystals, growth was assumed to proceed outward from the center of the radiating crystal cluster. Finally, branches tapering away from lower order branches were assumed to grow toward the tapered end of the branch. These methods agreed whenever multiple criteria were fulfilled by one dendrite.
RESULTS
Sample description
The sample KR454x is a 2.4 × 1.5 × 0.5-cm piece of a fulgurite, part of a larger sample KR454, originally collected from the Dabha district, city of Nagpur, Maharashtra State, India (Supplementary Fig. S1). The target material is a basalt from the Deccan traps, and the sample is therefore a basaltic rock fulgurite (Pasek et al., 2012). Based on the circumstances of its discovery, it is not possible to say for certain if the fulgurite is natural or artificial. Further information about the provenance of KR454, along with a macroscopic description, can be found in Supplementary Text part A. A scanned image of a petrographic thin section of KR454x is shown in Fig. 2a. The most abundant phase is a glass, greenish brown in transmitted light. On the right in Fig. 2a, the sample shows a dark-colored spongy crust with convex surface, ~1 mm thick, corresponding to the dull convex layer of sample KR454 (Supplementary Fig. S1a and b). In the remainder of KR454x, the glass matrix contains vesicles with nearly circular cross section and ranging from tens of micrometers up to several millimeters in size. The volume fraction occupied by the vesicles increases from 5 to 10 vol.% close to the spongy crust to about 50 vol.% at the opposite edge of the sample, along with an increase in number density. The crystal content is generally <5 vol.%. The glass matrix has a typical basaltic composition and is quite homogeneous throughout the sample (Supplementary Table S1).
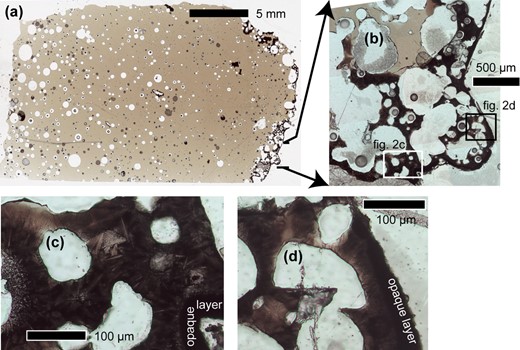
Transmitted plane-polarized light photomicrographs of the fulgurite sample in thin section. (a) Thin section scan showing decreasing size and abundance of voids from left to right and the dark, spongy crust at the edge of the sample. (b) Mosaic of photomicrographs showing a region of the spongy crust. Arrows indicate the location of the area within (a). The locations of (c) and (d) are marked. (c) and (d) Photomicrographs showing the spongy crust and opaque layer in detail. Domains with faceted dendritic morphology are visible as colorless branching crystals. Dendritic domains are darker and reddish-brown in color. Crystal-free glass is lighter and greenish-brown.
Location and microstructure of bent dendritic Cpx aggregates
In low magnification thin section transmitted light images of the spongy crust, the material between the vesicles is almost opaque (Fig. 2b). At higher magnification (Fig. 2c and d), a truly opaque layer up to 30 μm thick is distinguishable, forming the outermost edge of the crust. Within the crust, dark brown fine-grained aggregates of dendritic crystals are visible. The thickest branches appear colorless, suggesting that the dark brown color originates from the matrix between the branches. The branching crystals were confirmed as Cpx by subsequent EDS and EBSD analysis. The spatial distribution and microstructural variation of Cpx within the spongy crust was assessed by combining transmitted and reflected light microscopy with SE imaging. A continuous aggregate of branching Cpx crystals occurs in a band along the outside edge of the spongy crust, occupying the thin bridges separating vesicles (Figs 2 and 3). This band varies in width from 300 μm to 1 mm. Toward the inner edge of the crust there are also clusters of Cpx ranging from ca. 250 μm to 1 mm across that are separated from neighboring Cpx aggregates by small areas of crystal-free glass.
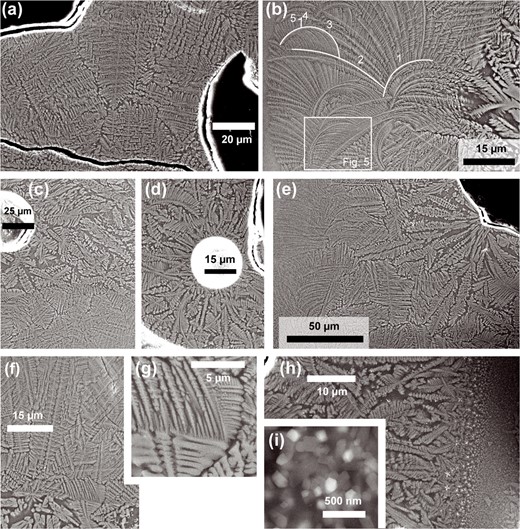
SE images of branching Cpx aggregates in the spongy crust. (a) Typical microstructure of high aspect ratio dendritic domains, showing no relationship to vesicles (black). (b) Cpx aggregate showing a transition from faceted to high aspect ratio dendritic morphology (right to left), including within single crystals. One set of connected branches is highlighted, with the hierarchical order of each branch also indicated. The location of Fig. 5 is marked. (c) Dendritic Cpx with no preferred orientation. An abrupt transition from faceted to high aspect ratio dendritic Cpx morphology occurs in the lower half of the image. (d) Cpx dendrites radiate from a small vesicle. (e) A rosette of dendritic Cpx originating from a point on a large vesicle. Both Cpx morphologies are visible. (f) Another abrupt transition between dendritic morphologies. (g) An enlargement of (f), showing the continuation of faceted dendritic crystals into the high aspect ratio domain. (h) SE image including the opaque layer (on the right). Dendrites show a shape-preferred orientation sub-perpendicular to the opaque layer. (i) High magnification SE image within the opaque layer, showing faceted nanocrystals of two phases in a dark matrix.
Figure 3 shows SE images of the Cpx aggregates. Branching Cpx crystals are embedded in glass. In most cases, vesicles simply truncate the microstructure of Cpx aggregates (Figs 2a–d and3a). The crystals all exhibit a dendritic habit. However, branch width and morphology vary throughout the aggregates, including within single crystals (Fig. 3b–h). The regions with the thickest main branches, ca. 1–3 μm wide, show clear external facets up to two generations of short side branches, of similar width to the main branch (Fig. 3b–h) and with lengths typically less than five times their width. In regions with branch widths below ~1 μm, external facets are no longer visible, there are always at least three orders of dendrite branches and higher-order branches are longer and more frequent, with higher aspect ratios (Fig. 3a–h). Branch width generally decreases gradually along single crystals and across whole aggregates, with the thinnest branches (<300 nm wide) located adjacent to crystal-free glass at aggregate rims (Fig. 3b and e). The gradual change in branch width and morphology makes it difficult to draw a sharp boundary between the faceted and the high aspect ratio dendrite morphology, but most domains approximate one of these two end-members.
Broadly speaking, faceted dendritic Cpx occurs at the outer edge of the spongy crust, with a transition to high aspect ratio dendritic Cpx occurring in the direction of the glassy bulk of the sample. In detail, the distribution of faceted dendritic Cpx is irregular (Fig. 2c and d), sometimes forming protrusions extending up to 750 μm into the glassy area and sometimes forming islands completely surrounded by high aspect ratio dendritic Cpx. Faceted dendritic crystal domains are never in direct contact with the crystal free glass. Rarely, instead of a gradual transition, an abrupt change in branch thickness is observed (Fig. 3c, f, and g). Where this occurs, a sharp curved border is visible between the two microstructurally distinct domains, but still, individual crystals extend across the border, their morphology changing abruptly (Fig. 3f and g).
In most domains of either morphology, there is no obvious shape-preferred orientation (e.g. Fig. 3a). However, some radiating rosettes of Cpx crystals do occur (Fig. 3d and e). Near to their common origin, radially arranged crystals have a faceted dendritic morphology, transitioning to high aspect ratio dendritic along their length. In two cases, faceted dendritic crystals radiate from a single point at the surface of a large vesicle. There is also one domain where crystals radiate from small, circular vesicles (Fig. 3d). In all cases, the radial arrangement of crystals extends only a few hundred micrometers from the origin.
Skeletal to dendritic oxide crystals 0.2–2 μm in size occur within the dendritic Cpx aggregates (e.g. Fig. 4b). The majority of oxide crystals are in contact with the tips of dendrite Cpx branches. They are located only in thin zones of glass between different Cpx crystals. The opaque layer at the outermost edge of the spongy crust comprises faceted nanocrystals of two phases in a darker matrix (Fig. 3i), assumed to be glass. Based on EDS analyses on the nanocrystalline areas, one of the remaining phases is likely Cpx and the brighter phase is assumed to be an oxide. At the inner boundary of the opaque layer, there is a rapid increase in grain size. The subsequent disappearance of skeletal oxide crystals marks the transition from the opaque layer to the spongy crust. Adjacent to the opaque layer, faceted dendritic Cpx crystals show a shape-preferred orientation perpendicular to the layer (Fig. 3h).
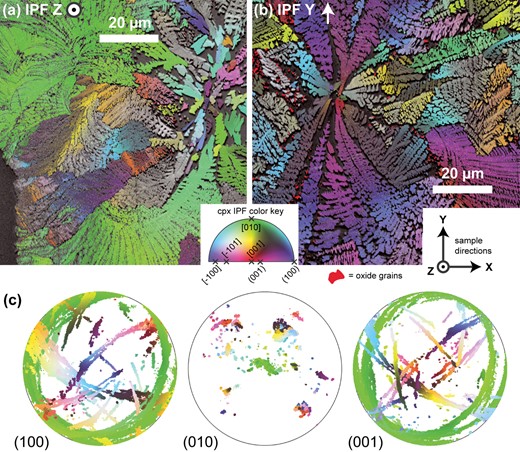
IPF color-coded EBSD maps of the orientation of branching Cpx, overlain (80% opacity) on grayscale image quality (IQ) maps. IPF color coding indicates for each pixel the crystal direction that is parallel to a fixed reference direction in sample coordinates, according to the IPF color key shown. The reference direction for (a) is the sample Z direction and for (b) the sample Y direction. The orientation of the sample directions is shown in the bottom right of (b). Oxide grains are plotted in bright red regardless of orientation. (c) Equal angle, antipodal, upper hemisphere (100), (010), and (001) pole figures of all Cpx points in map (a) (labeled). Points in all pole figures are color coded according to the IPF color of the corresponding EBSD pixel in (a).
Distribution and axis of lattice rotation of bent Cpx
Both curved and straight Cpx morphologies are visible throughout the spongy crust, regardless of microstructural type. Figure 4 shows two inverse pole figure (IPF) color-coded maps and one IPF color-coded pole figure. All Cpx crystals exhibit significant lattice rotation, in some cases more than 180° (Fig. 4c). Cpx crystals with [010] sub-parallel to the IPF reference direction show a single color in the IPF map, indicating that the axis of lattice rotation is the Cpx b-axis, confirmed by the absence of arcs in the (010) pole figure (Fig. 4c). This rotation axis is the same for all branches investigated in detail in Figs 5–10. As the microstructure of the scanned areas is representative of all aggregates in the spongy crust, it is inferred that all Cpx dendrites in the crust are bent, not just those that appear curved in the 2-D section.
![The two types of branches observed in dendrites viewed parallel to the [010] direction (location marked in Fig. 3). (a) SE image of part of the curved dendrite shown in Figs 3c and 4a. A mean filter of 1 pixel radius was applied to enhance visibility of the branches. The projection of the {001}* directions (dashed red lines) and < 10–1 > directions (solid blue lines) in the sample plane (obtained from EBSD crystal orientation mapping) is indicated for two profiles along separate branches. The inferred growth directions (G.D.) of the two branches are also indicated. (b) and (c) Equal angle, upper hemisphere pole figure plots of Cpx <010>, {001}*, and < 10–1 > directions for the profiles in (a). Each pole figure shows the profile for a separate branch. The first and last points of each profile are indicated by a triangle and a square respectively in all plots. The resulting sense of rotation is noted on the pole figures. The lattice curvature calculated from each profile is given above each pole figure.](https://oup.silverchair-cdn.com/oup/backfile/Content_public/Journal/petrology/64/1/10.1093_petrology_egac125/4/m_egac125f5.jpeg?Expires=1748260827&Signature=jMvuqbMbgCmQh4OqWrzZSZiqw53jg7yTlxC8Z~YEJcF21HmbsVXFQ4VjgnIYzrZpAZD7UF4WNqXO~ydRI8cJXrqTwoY9IbYi-QcGltWE~YSAJjv1luUPppDgJ7mqcJkl8xhCNMfuJ6~a~v~I5KxTgpnLBS8NlXLZiANJNLMzLb7o0M9ur-~OhhxRZs316xHypj3jJPRDWCl-7euDF579PvDEO4ZQ0zjoOn150JCAt03w7YFOYCAAJOdGhN5Rc5QYKcsbUn1GtnAO1I1bxKjDBDJX-CzrXBEQhNsOyJ~t85dDCwm18x7Fooi-6fWSIYOiOTlCVikWnzGHYkWu4irGJQ__&Key-Pair-Id=APKAIE5G5CRDK6RD3PGA)
The two types of branches observed in dendrites viewed parallel to the [010] direction (location marked in Fig. 3). (a) SE image of part of the curved dendrite shown in Figs 3c and4a. A mean filter of 1 pixel radius was applied to enhance visibility of the branches. The projection of the {001}* directions (dashed red lines) and < 10–1 > directions (solid blue lines) in the sample plane (obtained from EBSD crystal orientation mapping) is indicated for two profiles along separate branches. The inferred growth directions (G.D.) of the two branches are also indicated. (b) and (c) Equal angle, upper hemisphere pole figure plots of Cpx <010>, {001}*, and < 10–1 > directions for the profiles in (a). Each pole figure shows the profile for a separate branch. The first and last points of each profile are indicated by a triangle and a square respectively in all plots. The resulting sense of rotation is noted on the pole figures. The lattice curvature calculated from each profile is given above each pole figure.
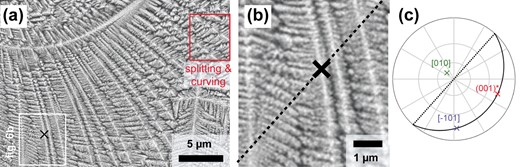
Example of a typical fringe. (a) SE image of a curved dendrite viewed sub-parallel to the b-axis, exhibiting a straight fringe of increased SE intensity. The red box labelled “splitting & curving” highlights part of the dendrite where the splitting and curving of branches originating from <10–1 > branches and initially growing out of the (010) plane is observed (see section ‘Viewing directions in the (010) plane’). (b) Enlarged section of (a) with a 1 pixel radius mean filter applied to enhance visibility of branches, showing that branches are only continuous within the fringe. The trace of the b-plane of Cpx based on the orientation measured at the point marked with an X is indicated with a dashed line. (c) Equal angle upper hemisphere pole figure plot of the orientation of Cpx at the point marked with an X in (b). The b-plane is marked with a continuous line, and the trace of the b-plane is marked with a dashed line.
![A Cpx dendrite viewed perpendicular to the b-axis. The growth direction is from bottom right to top left. (a) SE image. The locations where {001}* and < 10–1 > branches intersect the sample surface are marked by circles (labeled alphabetically). Solid orange lines indicate the projection of branch-parallel {021}* directions in the plane of the sample, for the points marked by triangles and squares. Dashed purple lines indicate the projection of Cpx <12–1 > directions in the plane of the sample for point H. (b) Cpx IPF color-coded EBSD map of the dendrite in (a), overlain (100% opacity) on an image quality (IQ) map. (c) Grayscale IQ EBSD map of the dendrite in (a). The traces of the (101) plane and the plane normal to [100] are marked with blue (upper two) and black (lower two) dashed lines, respectively. The orientation of traces is obtained from EBSD measurements at points A, B, C, and H and indicated in the relevant pole figures. (d) Sketch (not to scale) of the 3-D arrangement of the branches for this dendrite. For clarity, not all <10–1 > ribbons are shown. Points corresponding to the labeled circles in (a) are indicated. (e–k) Upper hemisphere, equal angle pole figures showing the orientation of Cpx at the selected locations indicated in (a). Cpx directions are labeled the first time they appear in each row of plots. Indexing of directions is consistent with the orientation variant used to index point A. The sense of rotation of the dendrite is shown in (i). In (i–k), the first and last points of profiles are indicated by triangles and squares, respectively. The measured lattice curvature of the {021}* branches is listed above the corresponding pole figures (j) and (k).](https://oup.silverchair-cdn.com/oup/backfile/Content_public/Journal/petrology/64/1/10.1093_petrology_egac125/4/m_egac125f7.jpeg?Expires=1748260827&Signature=qfsWyXCIc72ajZNj88eWE9aURW0G~W3Hx4tFMP-cT1G7-tgzFPWsK2bjVwPnOTxBWK0lOxlzQGLwUt1sa4OpN2xaUlCrxIsIZRi5jkURKcg8tJv70dpMnUkbgNtva2337kp5o3ijY0gO5BfLJ24BSesGrI5WAEQl85ZxFMozAY9IUfjG3NK7i03ZvOxBE1mG0W-HaV6GMKpGAAoVtpTaB~Yiru1Fbb19WPyh767fgZc6qvk0JG3de3OZM8zon7f6pgvUREss85g8iHSs05F-XfK9bzDxptOuisqWse99w5668SadilP7rYcgc~06YW0nQMk3wY1GCav~2VpMBh94cg__&Key-Pair-Id=APKAIE5G5CRDK6RD3PGA)
A Cpx dendrite viewed perpendicular to the b-axis. The growth direction is from bottom right to top left. (a) SE image. The locations where {001}* and < 10–1 > branches intersect the sample surface are marked by circles (labeled alphabetically). Solid orange lines indicate the projection of branch-parallel {021}* directions in the plane of the sample, for the points marked by triangles and squares. Dashed purple lines indicate the projection of Cpx <12–1 > directions in the plane of the sample for point H. (b) Cpx IPF color-coded EBSD map of the dendrite in (a), overlain (100% opacity) on an image quality (IQ) map. (c) Grayscale IQ EBSD map of the dendrite in (a). The traces of the (101) plane and the plane normal to [100] are marked with blue (upper two) and black (lower two) dashed lines, respectively. The orientation of traces is obtained from EBSD measurements at points A, B, C, and H and indicated in the relevant pole figures. (d) Sketch (not to scale) of the 3-D arrangement of the branches for this dendrite. For clarity, not all <10–1 > ribbons are shown. Points corresponding to the labeled circles in (a) are indicated. (e–k) Upper hemisphere, equal angle pole figures showing the orientation of Cpx at the selected locations indicated in (a). Cpx directions are labeled the first time they appear in each row of plots. Indexing of directions is consistent with the orientation variant used to index point A. The sense of rotation of the dendrite is shown in (i). In (i–k), the first and last points of profiles are indicated by triangles and squares, respectively. The measured lattice curvature of the {021}* branches is listed above the corresponding pole figures (j) and (k).
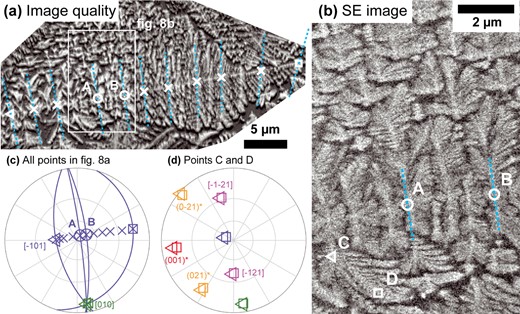
A Cpx dendrite viewed perpendicular to the b-axis. (a) Image quality EBSD map showing dendrite microstructure and numerous fringes. Locations where Cpx orientations are plotted in (c) are indicated by symbols. Two points where the <10–1 > direction is almost perpendicular to the sample surface are labeled A and B. Light blue dashed lines indicate the trace of the Cpx (101) plane according to the orientation measured at the point they intersect. (b) SE image of the area indicated by a white rectangle in (a). Points A and B and the traces of the (101) planes at those points are shown again. Above and below these traces, split curving branches are visible. Points C and D indicate the two locations on one curved branch for which orientations are plotted in (d). (c) Equal angle, upper hemisphere pole figure plot of the orientation of the Cpx dendrite at all points indicated by symbols in (a). The start and end of the profile are indicated by a triangle and square symbol, respectively. For the start and end points and points A and B, the (101) planes are plotted as curved blue lines. (d) Equal angle, upper hemisphere pole figure plot of the orientation of the Cpx dendrite at points C and D (locations indicated in (b), triangle and square symbols consistently indicate the same point in both figures). Crystallographic directions are indexed consistently in (c) and (d) and labeled the first time they appear.
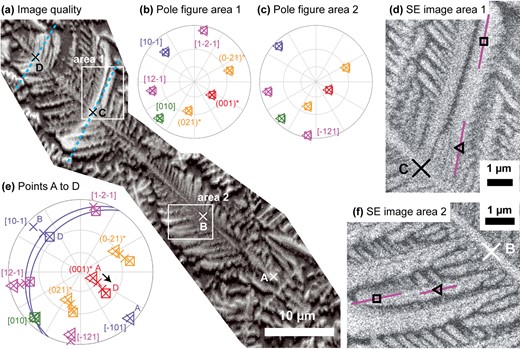
A Cpx dendrite viewed perpendicular to the b-axis. The growth direction is from bottom right to top left. (a) Image quality EBSD map showing dendrite microstructure and numerous fringes. Locations where Cpx orientations are plotted in (e) are indicated by X symbols and labeled alphabetically. For points C and D, the trace of the Cpx (101) plane according to the orientations measured at each point is indicated with light blue dashed lines. Two areas shown as enlarged SE images in (d) and (f) are indicated by white boxes. (b) and (c) Equal angle, upper hemisphere pole figures showing the orientation of Cpx at specific locations along <12–1 > branches in areas 1 and 2, respectively. The locations of each point are indicated in figures (d) and (f), the triangle and square symbols in the pole figures correspond to the symbols on the relevant SE image. Crystallographic directions are indexed consistently in (b) and (c) and labeled the first time they appear. The projections of branch-parallel <12–1 > directions for selected points are shown as solid purple lines overlain on SE images in (d) and (f). (e) Equal angle, upper hemisphere pole figure showing the orientation of Cpx at points A to D (shown in (a)). Key crystallographic directions are plotted and labeled for all points. For points C and D only, (101) planes are plotted as blue great circles.
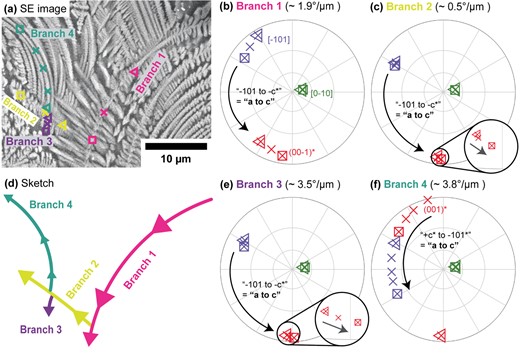
The sense of rotation in a single Cpx dendrite viewed sub-parallel to the b-axis. (a) SE image of the dendrite, showing curved branches. Four branches are labeled numerically. Markers indicate the locations of four profiles (one per branch) for which orientations are plotted in (b), (c), (e), and (f). The first and last points in each profile are indicated with triangle and square symbols, respectively. (b), (c), (e), and (f) Equal angle, upper hemisphere pole figures showing the orientations of the Cpx dendrite at the points indicated in (a) for each of the four branches. Crystallographic directions are indexed consistently across all four pole figures and labeled the first time they appear. The measured lattice curvature of each branch is given above its pole figure, and the sense of rotation determined is indicated on each pole figure by labeled arrows. (d) Sketch (to scale) of the four branches in (a), indicating the growth direction of each branch.
Dendrite morphology viewed sub-parallel to specific crystal directions
The 2-D morphology of dendritic Cpx crystals varies depending on their crystallographic orientation with respect to the specimen surface. By comparing crystals fortuitously sectioned perpendicular to different viewing directions, a 3-D model of the dendrite morphology can be developed.
Viewing direction sub-parallel to [010]
Dendritic crystals viewed sub-parallel to [010] cover larger areas and have low aspect ratios. They show curved branches, correlating with corresponding lattice rotation. Lattice rotation exceeds 180° for whole crystals and sometimes even for individual branches. Two different types of branch are distinguishable based on their degree of curvature and growth direction in crystal coordinates. The growth direction of strongly curved branches is parallel to the normal to Cpx {001} planes, denoted as {001}*, whereas the growth direction of weakly curved branches is parallel to Cpx <10–1 > directions (Fig. 5). All symmetrical equivalents are included in the designation of growth directions, to emphasize that growth follows both positive and negative directions within the same dendrites, e.g. parallel to both (001)* and (00–1)* (Figs 5, 6, and10). A minimum of three orders of branches are visible when viewing sub-parallel to [010]. The observed first-order branch can be of either {001}* (highly curved) or < 10–1 > (weakly curved) type. The higher-order branches follow an alternating sequence: branches sprouting from {001}* branches follow <10–1 > and vice versa. Dendrites extending from faceted to high aspect ratio dendritic regions of Cpx aggregates exhibit at least five orders of branches, alternating between types (Fig. 3b).
Diffuse linear regions of increased brightness are frequently observed in SE images and EBSD image quality maps of the dendritic aggregates (Figs 6–9). These features will be referred to as fringes. Linear fringes indicate the intersection of planar arrays of dendrite branches with the sample surface. Normally, the traces of main dendrite branches are only visible due to the intermittent intersection of higher-order branches with the sample surface. If the main branch itself intersects the surface, it appears as a continuous strip of Cpx either side of the point of intersection, the length and width of which depend on the branch’s inclination and width, respectively. The continuous and wider strip of Cpx around the intersection point generates a local increase in average electron signal and EBSD kikuchi pattern contrast. If a planar array of branches intersects the sample surface, the points of intersection of the branches reveal the trace of the planar array. The increased signal/contrast around each intersection point gives rise to the diffuse linear fringe following this trace. Figure 6 shows an SE image of a dendrite where the [010] direction is inclined 17° to the viewing direction. A fringe is observed parallel to the trace of the (010) plane of the crystal. The fringe occurs because the <10–1 > and {001}* branches form a network lying in a single plane that dips shallowly to the upper left, parallel to the (010) plane. We denote this structure as the ‘main b-plane’ from now on. The {001}* and < 10–1 > branches appear continuous for a short distance either side of the line of intersection between the main b-plane and the sample surface. With increasing distance perpendicular to the fringe, the sample surface intersects parts of the dendrite that are progressively further from the main b-plane.
Viewing directions in the (010) plane
Dendritic crystals viewed perpendicular to [010] cover smaller areas than those viewed parallel to [010] and show a higher aspect ratio, with elongation parallel to the trace of the main b-plane (Fig. 4). This viewing direction reveals that numerous higher order branches sprout above and below the main b-plane. Most dendrites viewed in this orientation show a bright fringe representing the intersection of the main b-plane with the sample surface. When viewing perpendicular to [010], the crystallographic direction perpendicular to the sample surface varies within individual crystals according to the lattice rotation about [010].
The lower part of Fig. 7a shows a {001}* dendrite branch viewed perpendicular to [010]. The growth direction is assumed to be from bottom to top in the image, based on the inclination of the side branches (see Methods section). Traveling in the growth direction, the curved main {001}* branch intersects the plane of the sample from below at point A and re-intersects it from above at point B (Fig. 7e and f). Two diffuse fringes run through points A and B, sub-perpendicular to the trace of (010). The fringes show that the {001}* branch and the second order branches projecting from it lie in a plane, which intersects the sample surface at the locations of the fringes. As the {001}* branch is curved, the planar structure must in fact form a curved ribbon shape in 3-D, shown schematically in Fig. 7d. Within each fringe, the second-order branches are visible as continuous branches. Their elongation direction is approximately normal to the symmetrically equivalent (021) and (02-1) planes of Cpx. The {021}* directions and the {001}* direction lie in a plane normal to the Cpx [100] direction. The fringes are parallel to the trace of this plane, although their exact trace is difficult to determine due to the shallow dip of the ribbon. Away from the fringes, the trace of both the main {001}* and second-order {021}* branches is defined by intermittent areas of Cpx, representing side branches projecting below (between points A and B) or above (below point A and above point B) the ribbon structure to intersect the sample surface.
Above point C in Fig. 7, the 2-D morphology of the dendrite changes. The remainder is made up of repeated segments of similar morphology, centered on fringes sub-perpendicular to the trace of (010). The apparent main branch of the dendrite is discontinuous apart from at the intersection of the main b-plane trace with the perpendicular fringes. The {001}* and < 10–1 > directions of neighboring segments plunge in the same direction (Fig. 7g and h), so each segment must correspond to a different planar structure intersecting the sample surface. At the tip of the dendrite (point H), the {001}* direction is almost exactly perpendicular to the sample surface. The intersection of a {001}* ribbon with the sample surface would be a straight line in this viewing orientation. However, at point H a wide, diffuse fringe and side branches with an oblique angle to the main b-plane trace are observed, indicating that it instead marks the intersection with the sample surface of a ribbon centered on a < 10–1 > branch. The increasing distance between segments from point C to point H supports this interpretation, as the inclination of the <10–1 > direction becomes shallower toward point H. The fringes confirm that <10–1 > branches must also lie within a ribbon structure, defined by side branches extending out of the (010) plane (Fig. 7d).
Determining more details about <10–1 > ribbons requires other viewing directions. Figure 8 shows a dendrite where an array of ribbons centered around <10–1 > branches radiate sub-perpendicular to the sample surface. Each fringe indicates the intersection of a < 10–1 > ribbon with the sample surface. At points A and B in Fig. 8, the <10–1 > ribbons are viewed exactly end-on. Near to the main b-plane, the plane defined by the <10–1 > branch and associated side branches is the (101) plane. Far from the main b-plane (e.g. points C and D in Fig. 8), the morphology of the ribbons viewed end-on changes. The branches parallel to the (101) trace split, curving both left and right until they become parallel to the trace of the main b-plane. Unlike all previously discussed branches, the lattice of these branches does not explain their curvature (Fig. 8d). Instead, they exhibit a change in elongation direction from a direction in the (101) plane toward a direction in the (010) plane. The area highlighted by the red box in Fig. 6a provides a top-down view on these split curved branches, determining that they turn to follow the {001}* direction.
One more viewing direction is needed to fully characterize the <10–1 > ribbons. Figure 9 shows several <10–1 > branches viewed sub-perpendicular to <10–1 > and [010], showing the side branches within the (101) plane. The growth direction is from bottom right to top left, based on the inclination of the side branches (see Methods section). Points A and B lie on a single ribbon entering the sample at A and curving out again at B. As <10–1 > is so shallowly inclined, no fringe is visible around A or B. Points C and D indicate the intersection of two further <10–1 > ribbons with the sample surface, curving up from below. Note the curvature (without lattice rotation) of the ends of the side branches, corresponding to the split branches observed in Fig. 8. Close to the main b-plane, the elongation direction of the side branches is approximated by the symmetrically equivalent [−121] and [12–1] directions (Fig. 9d and f). An exact determination is difficult given their short length and changing thickness. However, confirmation is provided by the fact that the trace of the <−121> directions also fits the side branches at point H in Fig. 7 (purple lines in Fig. 7a), and by Supplementary Fig. S2, which shows <10–1 > ribbons oriented so that one <−121> direction is in the sample plane. Fully continuous branches parallel to the trace of <−121> are visible close to the main b-plane.
Curvature of Cpx lattice with respect to branch elongation direction and microstructure
Branches with growth directions in the b-plane (i.e. <10–1 > and {001}*) intersect the sample surface for long distances when viewed sub-parallel to [010], allowing assessment of curvature variations across dendritic aggregates. Overall, curvatures of {001}* branches range from 1.9° to 7°/μm and curvatures of <10–1 > branches range from 0.3° to 2°/μm (Supplementary Fig. S3). The {001}* branches in a given area always have curvatures at least twice that of associated <10–1 > branches but often considerably higher (Fig. 10; Supplementary Fig. S3). The lowest curvatures occur in the faceted dendritic domains. The closer a branch is to the rim of the aggregate, the greater its curvature compared with others of the same type (Fig. 10; Supplementary Fig. S3).
The {021}* and < −121 > branches cannot be followed for long distances in any viewing direction. They follow helical paths, as their rotation axes and growth directions are neither perpendicular nor parallel to each other. Lattice curvatures for these branches could thus only be obtained for a very small number of dendrites with just the right orientations (Supplementary Table S2). The lattice curvature of {021}* branches was measured in four dendrites (for multiple branches per dendrite) and ranged from 0.6 to 1.5°/μm in the dendrites analyzed. This was about half the curvature of {001}* branches in the same dendrite in the three grains where both branch types could be analyzed (range 0.4 to 0.7). The lattice curvature of <−121> branches was also measured in a separate set of five dendrites and ranged from 0.4 to 1.2°/μm. The curvature of <−121> branches ranged from 0.4 to 1.2 times the curvature of associated <10–1 > branches in the three cases it was possible to measure both types together.
Sense of dendrite rotation with respect to growth direction and crystal structure
If the growth direction is known, it is possible to distinguish two non-equivalent senses of rotation for Cpx dendrites rotating around [010], despite conventional EBSD’s inability to distinguish symmetrically equivalent orientations (Supplementary Text part B and Supplementary Fig. S4). The rotation sense can be determined by examining any pair of directions in the (010) plane (Supplementary Table S3), but in the following, they are labeled by whether the a-axis of Cpx rotates toward (the ‘a-to-c’ sense) or away from (the ‘c-to-a’ sense) the initial position of the c-axis with continuing growth. All Cpx branches where growth direction could be determined rotate in the a-to-c sense, regardless of their type (Figs 5, 7, 9, and10). The sense of rotation is independent of growth direction in sample or crystal coordinates (Figs 5 and 10).
Composition of Cpx and compositional variations in glass surrounding dendrites
Table 2 gives the mean quantitative composition of six faceted dendritic Cpx crystals from the spongy crust in atoms per formula unit (a.p.f.u.), with Fe3+ content calculated according to Andersen & Lindsley (1982). The original EPMA data and the end members are given in Supplementary Table S4. The crystals are classified as aluminian subsilicic augite (Morimoto, 1988), with small amounts of Ti and Fe3+ and a Si deficit of ~0.25 a.p.f.u. The Al concentration slightly exceeds the amount required to fill the deficit on tetrahedral sites. The enstatite, ferrosilite, and wollastonite end members consistently describe 80% of the Cpx composition. Quantitative measurements of dendritic Cpx were not carried out, due to their small width. An element distribution map of part of a Cpx aggregate is shown in Fig. 11. The Cpx is enriched in Ca and Mg compared with both interstitial glass and glass far from the aggregate and enriched in Fe compared with interstitial glass only. K, Na, Al, and Si are depleted in Cpx compared with both interstitial glass and glass far from the aggregate. Compared with the glass far from the aggregate, interstitial glass in faceted dendritic domains is enriched in K, Na, Al, and Si, and depleted in Ca, Fe, and Mg. Interstitial glass in dendritic domains is either not as enriched/depleted or the compositional difference cannot be resolved due to the small size of the melt channels between the branches. Outside the border between the dendrites and the crystal-free glass matrix, there is a zone of glass ~5 μm wide where Fe and Na are enriched and K, Ca, and Mg are depleted. In the domain with dendritic habit, Fe is also enriched at the contact zone between two different Cpx crystals.
Mean of six EPMA measurements of the skeletal Cpx in the spongy crust, given as cations in atoms per formula unit to 2 significant figures (Fe3+ calculated based on site occupancy according to Lindsley & Andersen, 1983)
| Si | Ti | Cr | Al | Fe3+ | Fe2+ | Mn | Mg | Ca | Na | K | Sum | |
|---|---|---|---|---|---|---|---|---|---|---|---|---|
| Mean | 1.73 | 0.08 | 0.00 | 0.37 | 0.06 | 0.40 | 0.01 | 0.59 | 0.78 | 0.03 | 0.00 | 4.03 |
| 2 s.d. | 0.03 | 0.01 | 0.00 | 0.05 | 0.08 | 0.13 | 0.00 | 0.09 | 0.06 | 0.01 | 0.00 | 0.04 |
2.s.d = Two standard deviations.
BSE image and x-ray element distribution map of a branching Cpx aggregate surrounded by glass. Insets give the scaling of detector counts per pixel to grayscale values in each image.
DISCUSSION
3-D morphology of the Cpx dendrites
Based on the overall 2-D shapes of dendritic Cpx crystals viewed parallel and perpendicular to [010], the Cpx dendrites occupy squat cylindrical to tabular volumes in 3-D, with their shortest axis parallel to [010]. The dendrites possess a single central planar structure parallel to the (010) plane of Cpx, as crystals viewed sub-perpendicular to [010] only ever show a single main b-plane trace. Numerous branches radiate either side of the main b-plane, resulting in a 3-D morphology reminiscent of a double-sided brush. Error in identifying crystallographic elongation directions is at most a few degrees (Supplementary Text part C), allowing reconstruction of the 3-D structure of the bent dendrites by combining information from different viewing directions.
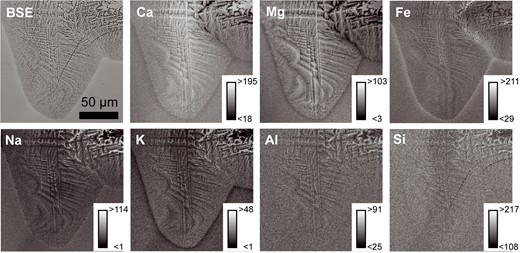
Figure 12 and Supplementary Fig. S5 present different views of a schematic model of the reconstructed dendrite morphology in 3-D. The model increases in complexity from left to right in both figures. We begin by describing the planar structures that define the overall dendrite shape. The main b-plane comprises a network of curving branches following the rotating {001}* and < 10–1 > directions. The elongation direction of the out-of-b-plane branches depends on the type of main b-plane branch they sprout from, giving rise to two types of curving ribbons in 3-D. The {001}* and {021}* directions lie in the plane normal to the [100] direction, and the <10–1 > and < 12–1 > directions lie in the (101) plane. The main b-plane is divided into areas containing closely spaced {001}* branches and domains containing closely spaced <10–1 > branches (Fig. 3b). Therefore, in 3-D, the dendrites exhibit two different types of domain, defined by whether {001}* ribbons or < 10–1 > ribbons are dominant.
Single view of a 3-D sketch of the reconstructed dendrite morphology. Other views are shown in Supplementary Fig. S5. One (001)* ribbon and four <10–1 > ribbons are shown. Arrows indicate growth directions of the different branch types. The crystallographic elongation directions of branches are color coded according to the key in the upper right. For clarity, the spacing between branches in the model is exaggerated. The level of detail in the sketch increases from left to right, but this does not imply spatial or temporal variation of dendrite morphology. Relative curvatures are representative of the real dendrites. Due to their weak curvature, all <12–1 > and {021}* branches and short <10–1 > branches are drawn as straight.
Perfect ribbons, as indicated by gray surfaces in Fig. 12 and Supplementary Fig. S5, require {021}* and < 12–1 > branches to follow a helical path, with a radius r equal to the radius of curvature of the main branch. The true curvature of a helix is |$\frac{\cos^2(\theta )}{r}$|, where θ is the pitch angle. For perfect ribbons, inputting the angles between main and side branches into the equation determines that the true curvatures of the side branches must be 0.43 and 0.32 times lower than the curvature of their associated main branch for {021}* and < 12–1 > branches, respectively. The curvature of sections of {021}* branches measured using EBSD in the map plane was between 0.4 and 0.7 times that of associated {001}* branches, while the curvature of <12–1 > branches measured in the same way is between 0.4 and 1.2 times that of the corresponding <10–1 > branch (Supplementary Table S2). However, curvature measurements of side branches are based on very few measurements on short planar sections of helical branches. In addition, the low curvatures of <10–1 > and < 12–1 > branches magnify the cumulative effects of small orientation errors on apparent curvature. Therefore, it is only possible to say based on the EBSD curvature measurements that any deviation from perfect ribbon morphology is small, consistent with the observation of linear fringes where ribbons intersect the sample surface.
All the first- and second-order branches are surrounded by shorter, higher-order side branches. Observations sub-parallel to [010] show that the only elongation directions in the main b-plane are {001}* and < 10–1>, regardless of the size of branches involved. Junctions between <10–1 > branches and short {001}* branches are clearly visible in bright fringes where the main b-plane intersects the sample surface (bottom left of Fig. 6b, top right of Fig. 10a), indicating that short {001}* branches can directly sprout from <10–1 > branches and do not only originate from splitting of <12–1 > branches. The {021}* branches must also exhibit short side branches; otherwise, it would be impossible to follow their traces when they lie out of the sample surface plane. In Fig. 7a, the Cpx islands representing the intersection of these side branches with the sample surface are elongated parallel to the trace of the (010) plane and are directly connected to {021}* branches within bright fringes, suggesting that they are small {001}* branches. The <10–1 > branches can seemingly also sprout from {021}* branches, as indicated in the lower part of Fig. 10a. Here, discontinuous Cpx islands trace the path of the {001}* branch, representing the intersection of {021}* branches with the sample surface. The <10–1 > branches directly sprout from these bright islands. The right-hand side of the model in Fig. 12 and Supplementary Fig. S5 schematically shows a section of {001}* and < 10–1 > ribbon with the inferred directions of higher-order branches added, including the splitting of <12–1 > branches far from the main b-plane. There is at least one further order of side branches growing on these short branches (e.g. Fig. 6b). However, the resolution of SE images and EBSD scans is insufficient to investigate further hierarchical orders.
Explanations for the crystallographic elongation directions of Cpx dendrite branches
Fleet (1975) reported elongation directions of [001] and [100] for some natural bent Cpx dendrites, but otherwise, there is little information about Cpx dendrite elongation directions available (Welsch et al., 2016). Cpx dendrite elongation directions in the current study are definitely different: {001}* is ~17° from [001] and < 10–1 > ~24° from [100]. Despite the variation in morphology and branch curvature across Cpx aggregates, no deviation of crystallographic elongation direction was observed for a given branch type, with the single exception of <12–1 > branches. Therefore, the Cpx aggregates exhibit almost exclusively crystallographic branching, i.e. branching following consistent directions with respect to the crystal structure (Keith & Padden, 1963). Even if one or more true elongation directions are in fact irrational (which cannot be excluded given the precision of growth direction determination), this term is still correct because the elongation directions remain fixed with respect to the Cpx lattice.
Explanations based on skeletal crystal habits
Olivine dendrites show similarities to the observed Cpx dendrites, exhibiting a latticework of two types of branches in the (010) plane, inclined to the base vectors of the unit cell (Faure et al., 2003a, b). Faure et al. (2003a) interpret the elongation directions of olivine dendrite branches as resulting from the accumulation of overgrowths of a particular hopper (hollow skeletal) morphology (Fig. 13a), occurring at the tips of previous hopper units. In this model, the fixed <101> crystallographic elongation directions are controlled by the morphology of the hopper unit (Fig. 13b). Analogously, the expected morphology of Cpx hopper crystals may provide insights into the observed crystallographic elongation directions of the Cpx dendrites and vice versa. Cpx hopper crystals were observed in the experiments of Ni et al. (2014), but the identity of the hollow face was not determined. Recently, two hypothetical Cpx hopper shapes have been described. Both are assumed to have developed from infilling of an initially dendritic structure. Zhou et al. (2021) infer skeletal crystals where the (h0l) facets are planar (i.e. these sectors were infilled first) and the {−111} facets are hollow, whereas Welsch et al. (2016) infer hollow (h0l) facets and planar (infilled) {−111} facets. In both cases, the interior of the hopper follows the boundary between {100} and {−111} sectors. Both authors hypothesize that the initial dendrite elongation directions in the (010) plane were parallel to these sector boundaries (Fig. 13c).
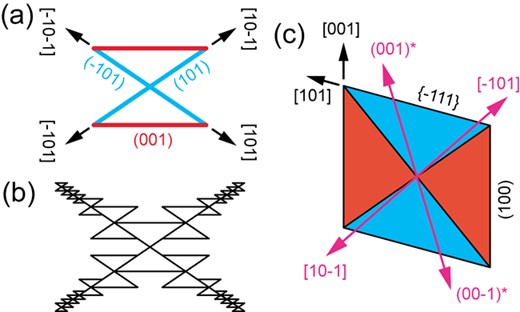
(a) The olivine hopper unit proposed by Faure et al. (2003a, b). (b) Olivine hoppers aggregate together to produce a dendritic structure with branches parallel to the hopper diagonals. (c) A schematic cross section parallel to (010) through the center of a euhedral sector-zoned Cpx crystal, after Welsch et al. (2016). The crystal aspect ratio a: c is 1.08: 1. The diagonals of the parallelogram represent the traces of the sector boundary between (001) and {−111} in the (010) plane. The orientations of the {001}* and < 10–1 > directions are also indicated.
Unlike for olivine, this suggested hopper morphology (and thus the predicted crystallographic elongation direction) is variable. For euhedral Cpx viewed along [010], the relevant sector boundary orientations in the (010) plane can be calculated for any aspect ratio (Supplementary Text part D and Supplementary Fig. S6). Using the aspect ratio of Welsch et al. (2016), the elongation directions found for Cpx in this study diverge from the theoretical sector boundary orientations by 22° for {001}* and 6° for <10–1 > (Fig. 13c). Furthermore, although aspect ratios can be found where either {001}* or < 10–1 > are aligned with a sector boundary or the deviation angle for both directions is equal (ratio of ~3:2, 11° deviation), no aspect ratio exists for which both sector boundaries are aligned perfectly with {001}* and < 10–1>. The absence of an exact relationship between the theoretical sector boundary traces and the observed dendrite elongation directions in the (010) plane, combined with the consistency of crystallographic elongation directions throughout the Cpx aggregates, suggests that the proposed aspect ratio-dependent hopper unit does not determine the elongation direction of the Cpx dendrites. In contrast, a crystallographically defined Cpx hopper unit (as hypothesized for olivine) would always have a constant shape. However, to explain the specific elongation directions determined in the (010) plane, the internal facets of the crystallographically controlled Cpx hopper units would have to be the plane normal to [100] and the (101) plane, i.e. the two ribbon planes in the dendritic aggregates. As the plane normal to [100] does not correspond to a low-indexed Cpx facet plane, the existence of hopper units exhibiting this plane is difficult to explain, implying that the hopper unit model is not applicable to the current system.
Explanations based on crystal structure
Viewing the Cpx structure along <10–1 > reveals ring-like arrangements of Mg and Si polyhedra with columns of Ca running down their centers, whereas viewing down <12–1 > reveals columns of O, Ca, Si, and Mg atoms parallel to the growth direction. In contrast, the {001}* and {021}* directions are irrational when expressed in [uvw] indices and thus do not align with the atomic structure of Cpx. The existence of {001}* branches suggests that linear features of the crystal structure are not the main factor determining elongation direction; otherwise, branches would grow parallel to the chains of SiO4 tetrahedra along the nearby [001] direction instead. An alternative explanation for the {001}* elongation direction is that growth perpendicular to {001} facets is expected to be fast compared with {h0l} (prism) facets (Fleet, 1975). However, this principle does not explain all observed elongation directions. Growth normal to {10–1} is expected by Fleet (1975) to be even easier, but no {10–1}* branches were found. The clearest unifying feature of the elongation directions observed in the (010) plane is their relationship to the Cpx unit cell. {001}* is the shortest direction across the cell in (010) and < 10–1 > the longest.
The cause of bending
The sense of lattice rotation of the Cpx dendrites is independent of the orientation of the growth direction in sample coordinates. This excludes any explanation for dendrite bending which relies on sample-scale thermal, compositional, or mechanical gradients, whether imposed by fluid flow (Mullis, 1999; Das et al., 2002; Dragnevski et al., 2002) or other external factors (Aveson et al., 2019). In any such scenario, the sense of each branch’s rotation would depend on the inclination of its growth direction with respect to the externally imposed flow direction and/or sample-scale gradient. A consistent rotation sense also excludes any process where rotation direction is randomly determined, such as the interaction of dendrite tips with impurity particles (Gránásy et al., 2003). Although Gránásy et al. (2003) did reproduce consistent rotation sense numerically, this required pre-imposing a field of impurities with tailored orientation effects concentrically around the dendrite. Such a configuration has no analogue in a natural system.
The observed consistent sense of Cpx lattice rotation requires a bending mechanism controlled by the morphology and crystallography of the dendrites themselves. Three proposed mechanisms fit this criterion (Knight, 1962, 1971; Goto et al., 2016). All rely on the principle that bending is driven by the mismatch between two directions: the crystallographic direction in which the fastest growth rate is possible, and the local ideal growth direction into the melt, determined for each dendrite branch by the compositional and/or thermal field(s) around it (Supplementary Fig. S7). The mechanisms differ only in the way that the directional mismatch arises, as elaborated below. In all three, dendrites bend in order to bring the fastest crystal growth direction toward the ideal local growth direction, thus maximizing their growth rate. As reorientation of the branch immediately leads to reorientation of the fields around the dendrite, bending continues indefinitely. Note that whether the ideal growth direction is determined by thermal or compositional fields (or both) does not affect this basic principle.
Goto et al. (2016) studied NaCl dendrites growing in a thin layer of gel (gelatin + dilute NaCl solution) on a glass plate. The thin layer geometry leads to <111> main dendrite branches with asymmetric first order <111> side branches, inclined at 70° and 110° to the positive growth direction on respective sides of the main branch. This generates an asymmetric compositional field around advancing dendrites, which Goto et al. observed in situ. The steeper gradient occurs on the side where branches are inclined forwards at 70° to the positive growth direction. At high degrees of supersaturation, the NaCl crystal lattice bends, forming curved dendrites with a constant <111> elongation direction, which always bend toward the side of the branch with the steeper concentration gradient (Supplementary Fig. S7a).
Goto et al. (2016) confirm that dendrite morphology-induced asymmetric fields can cause bending, but does this mechanism explain the bent Cpx dendrites? Compositional fields were certainly present during growth, confirmed by the direct observation of compositional gradients within the glass surrounding dendritic aggregates (Fig. 11). The rotation sense of the {001}* branches is also exactly as predicted by their asymmetric branching morphology: {001}* branches sprout <10–1 > side branches inclined obliquely to {001}* and bending always occurs toward the side with branches at an acute angle to the positive growth direction (Supplementary Fig. S5d). In contrast, <10–1 > branches sprout {001}* side branches inclined obliquely to the growth direction, but the acute angle between side branches and the <10–1 > growth direction is located on the opposite side compared with {001}* branches (Supplementary Fig. S5d). The mechanism of Goto et al. (2016) thus predicts opposite rotation senses of {001}* and < 10–1 > branches, contrary to our observations.
There are no other sources of overall morphological asymmetry that could explain the unexpected rotation sense of <10–1 > branches. Although {021}* and < 12–1 > side branches sprout from {001}* and < 10–1 > branches, respectively, both types are symmetrically arranged about their main branch. A final potential source of asymmetry is if {021}* and < 12–1 > side branches curve more or less than required to lie within ribbons. In this case, side branch tips would consistently lie above or below ribbon planes. Indeed, a slight mismatch between curvatures required for perfect ribbons and the measured curvatures of branches was observed. However, 2-D measurements of ribbon side branch curvatures are of rather low precision and accuracy due to their helical shape. The asymmetry implied is also considerably weaker than that existing simultaneously within the main b-plane. Overall, it appears unlikely that the opposite curvature of <10–1 > branches compared with theoretical predictions can be explained by this small potential asymmetry. Therefore, we exclude asymmetric dendrite branch morphology as the bending mechanism in this system.
Two studies by Knight (1962, 1971) provide alternative mechanisms for dendrite bending, driven by processes at branch tips. Knight (1971) studied bent dendrites of a number of phases crystallizing in liquid films and proposed that bent dendrites had elongation directions that would allow the development of asymmetrically faceted dendrite tips, comprising faster and slower growing facets. The asymmetry in growth rates implies an asymmetry in the thermal and/or compositional fields around the dendrite tip, with higher supersaturation occurring in the melt adjacent to the slower growing facet. Knight hypothesized that the ideal growth direction deviates from the fastest growth direction (approximated by the elongation direction) toward the slower growing facet, resulting in bending in the direction of greater supersaturation (Supplementary Fig. S7b). Earlier work by Knight (1962) examined the formation of bent ice dendrites in a water film. In this case, a similar mechanism was proposed, with the difference that the deviation of the ideal growth direction from the elongation direction was hypothesized to be due to a purely morphological asymmetry of the ice dendrite tips, resulting in an asymmetric thermal field and leading to bending in the direction of the steeper thermal gradient (Supplementary Fig. S7c).
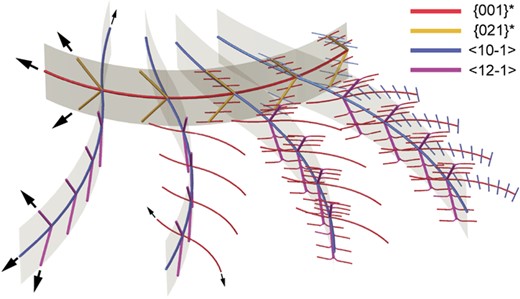
Evaluating the mechanisms of Knight requires predicting potential Cpx dendrite tip morphologies. Elongated prismatic Cpx crystals are typically terminated by {001}, {−101}, {−111}, {111}, and {−221} facets (Fleet, 1975). The {−111} facets are particularly common in Ti-bearing augite, which approximately corresponds to the measured composition of Cpx in this study. We first examine the predicted rotation sense of Cpx dendrites based on purely morphological asymmetry of dendrite tips. Figure 14 shows the orientation of the potential prism facets with respect to {001}* and < 10–1 > elongation directions, viewed parallel to [010] (normal to the growth direction). For the {001}* elongation direction, the (001) facet contributes no asymmetry, as it is normal to the growth direction. However, an {001}* dendrite terminating in any or all of the remaining facets would be asymmetric. The plane normal of most facets lies clockwise of {001}*, with the exception of {111} (Fig. 14b). For the <10–1 > elongation direction, {111} facets can be ignored, as their normal is perpendicular to the growth direction. The morphology of a < 10–1 > branch terminated by any or all of the remaining facets is also asymmetric, but the plane normal of all four facet types lies anticlockwise of <10–1 > when viewed parallel to [010] (Fig. 14c). Therefore, faceted {001}* and < 10–1 > branch tips are predicted to have opposite morphological asymmetry in almost every case. The single exception requires {111} facets to dominate for {001}* branch tips only, which is unlikely for a Ti-bearing augitic composition, based on macroscopic crystal morphologies. For this reason, we argue that asymmetry of tip morphology alone poorly explains the identical rotation senses of {001}* and < 10–1 > branches. Nonetheless, further studies of the nanoscale faceting of Cpx dendrites are required to confirm this assumption, given that olivine dendrites show some additional facets not typically present for euhedral macroscopic olivine (Faure et al., 2003b).
![(a) Equal angle, upper hemisphere, antipodal pole figure showing the common prism-terminating facets of Cpx and their orientation relative to (001)* (red arrow) and < 10–1 > (dark blue arrow) directions. Both the normal to each non-prism facet (circles) and the plane itself (lines) is shown. The vertical direction in the pole figure is [010] (black square). (b) and (c) Sketch of the tip of (001)* (b) and [10–1] (c) dendrite branches viewed normal to (010). The traces of all possible prism-terminating facets intersecting with (010) are depicted around both tips and labeled accordingly.](https://oup.silverchair-cdn.com/oup/backfile/Content_public/Journal/petrology/64/1/10.1093_petrology_egac125/4/m_egac125f14.jpeg?Expires=1748260827&Signature=ggonejek2bUeOl-JfOTPmPqdfaQcPNLZ5RcsO0NyMyOFx5hJHnkw9OwRqdw~tTA~Ik3T8c-o73gYUj924Y1fabV-QdnzQWoB6jxa~UAG0cq8AAO8nDl9XoEZLvjmymy8K8tOPNSm82JPohhA5F33cQ3KQwk~2ieq3j3OvW2H~mh98YWQFbpQFXTt-Mh8CjuOApNKDbLsVPBAnGbWrB0tVk1YuFptAM1ssGcf~eUf5gxfqI9kBbFdPYe8xq1ekSy3QeI6JhKvcBNaI9raKm9NS4vRwZH6PrXWVzEBHasY5bqNWLvhjvx-ypasi8SZz09xQNL9lK8tHQW1x2OW2FZpyw__&Key-Pair-Id=APKAIE5G5CRDK6RD3PGA)
(a) Equal angle, upper hemisphere, antipodal pole figure showing the common prism-terminating facets of Cpx and their orientation relative to (001)* (red arrow) and < 10–1 > (dark blue arrow) directions. Both the normal to each non-prism facet (circles) and the plane itself (lines) is shown. The vertical direction in the pole figure is [010] (black square). (b) and (c) Sketch of the tip of (001)* (b) and [10–1] (c) dendrite branches viewed normal to (010). The traces of all possible prism-terminating facets intersecting with (010) are depicted around both tips and labeled accordingly.
The mechanism of Knight (1971) relies on differing relative growth rates (sub)perpendicular to different facets, and the resulting asymmetry of supersaturation in the adjacent melt. A full analysis of this proposition requires knowing the growth rates and supersaturation adjacent to each possible facet type under the conditions of growth. However, whether this mechanism can explain identical senses of rotation for {001}* and < 10–1 > branches can still be evaluated without having this information. When viewed perpendicular to the growth direction, the relative arrangement of any given set of facets from left to right is identical for {001}* and < 10–1 > branches (Fig. 14). Thus, the sense of asymmetry of melt supersaturation at tips is unchanged between {001}* and < 10–1 > branches, as long as the same facets dominate at both branch tips. Even if different facets develop at the tips of different branch types, the supersaturation-based explanation still allows equal senses of rotation as long as the relative position of the facet with the higher degree of supersaturation is the same for both branches. This is far less restrictive than the tip-morphology based model.
The asymmetric supersaturation model is harder to assess for the helical side branches defining ribbons. Because the {021}* and < 12–1 > directions do not lie in the (010) plane, the relative positioning of a given set of tip facets with respect to either elongation direction is not necessarily exactly identical to the relative positioning of the same facets around {001}* and < 10–1 > branch tips. Furthermore, multiple symmetrically equivalent examples of the same facet could exist at a given {021}* or < 12–1 > branch tip. This means that it is not possible to infer an expected rotation sense of {021}* or < 12–1 > branches to compare with that of {001}* and < 10–1 > branches without further information. However, the observed identical rotation senses of all four branch types are certainly not excluded by the asymmetric supersaturation model, as can be seen by looking at the consistent relative distribution of certain {−111} and {−211} facets for all four elongation directions (Fig. 14; Supplementary Fig. S8).
In conclusion, the mechanism of Cpx dendrite bending is definitely not related to the developing dendritic morphology around growing branches. Thus, bending can only be due to a mechanism active at the tip of dendrite branches. Asymmetric tip morphology alone can only explain the identical rotation sense of all branches if the facets present are radically different to those expected based on euhedral Cpx. The best explanation for bending relies on the differing relative growth rates perpendicular to different tip facets, leading to an asymmetric distribution of melt supersaturation at the dendrite tip. Such a mechanism is so far the only one able to generate the same sense of asymmetry at the tips of all four branch types observed in the Cpx dendrites, whereby a completely fixed restriction exists only for the branches in the (010) plane.
Type and abundance of lattice defects responsible for bending
As the observed bending occurs in 3-D dendrites that grew freely in a relatively homogeneous melt, it must be the result of lattice defects, not preserved elastic strain. The consistent [010] rotation axis for all branch types, even those outside the (010) plane, where there is no restriction on the rotation axis by Cpx symmetry, indicates that the defects responsible for bending must be dislocations. Point defects would exert no crystallographic control on the rotation axis. The high angle between elongation direction and rotation axis suggests the presence of edge dislocations. The dislocation line for an edge dislocation is always parallel to the axis of lattice rotation, here [010]. Edge dislocations would thus be parallel to and could easily form on any {h0l} facets developed at Cpx dendrite tips, for example by incomplete growth of facet-parallel layers. Furthermore, to accomplish rotation using screw dislocations is more complex and requires higher dislocation densities, as two Burgers vectors are always needed. Literature data provide some support for the presence of edge dislocations. Knight (1962), observing bent ice dendrites, found only tilt subgrain boundaries, and Savytskii et al. (2016) and Musterman et al. (2021) found only edge dislocations in artificially fabricated rotating lattice single crystals where rotation axis is perpendicular to elongation direction.
Of the slip systems known from plastic deformation of diopside (e.g. Amiguet et al., 2010), only [001](100) results in edge dislocations with an [010] misorientation axis. For a single edge dislocation type, the radius of lattice curvature r is related to dislocation density ρ by the equation ρ = 1/br (Cottrell, 1953), where b is the Burgers vector. Assuming only [001](100) edge dislocations, the highest observed curvatures for {001}* branches of ca. 7°/μm correspond to dislocation densities of ~2*1014 m−2. This value is high, slightly above values measured in shock deformation experiments (Leroux et al., 1994). However, the calculated mean separation distance (|$1/2\sqrt{\rho\ }$|, Jerram et al., 1996) for randomly distributed dislocations at this density is ~30 nm, suggesting that it is still physically plausible, as dislocation cores would not overlap. Curvatures of 2°/μm, corresponding to the maximum observed for <10–1 > branches and close to the minimum for {001}* branches, still imply high dislocation densities of ~6*1013 m−2. Calculated densities are minimum total dislocation densities, as they record only the excess of edge dislocations of one sign, responsible for lattice rotation. The origin of this strong preference for dislocations of one sign is assumed to be the asymmetry at dendrite tips. Rapid growth should favor the incorporation of defects in general, and incorporating dislocations of the correct sign in order to rotate the Cpx lattice to bring the fast growth direction toward the ideal growth direction should be favored, as this increases the growth rate of the branch.
A key feature of the Cpx dendrites in the investigated fulgurite is the difference in curvature between different branch types. Part of this difference can be explained geometrically, as detailed in Supplementary Text part E and Supplementary Fig. S9. The geometric model predicts a curvature ratio of 2.4 between {001}* and < 10–1 > branches for equal rates of dislocation incorporation at both branch tips. As predicted, all {001}* branches measured are at least twice as curved as associated <10–1 > branches. However, the majority are considerably more curved, with the difference generally increasing toward the rims of aggregates (Fig. 5; Supplementary Fig. S3). This implies that the dislocation incorporation rate at {001}* branch tips was higher than at <10–1 > tips for all but the faceted dendritic parts of the Cpx aggregates and that the difference in incorporation rates increased during growth.
According to the geometric model, constant dislocation incorporation rates for central and side branches on the same ribbon would result in {021}* branches lying in perfect ribbons around {001}* branches, whereas <12–1 > branches would be slightly too curved to form perfect ribbons (Supplementary Fig. S9). This agrees with the slightly higher than expected curvature recorded for some <12–1 > branches, although the precision and accuracy of the very few curvature measurements is not high enough to confirm that the measured discrepancy is real. In any case, the greater predicted deviation from ribbon geometry for <12–1 > branches, increasing with increasing branch length, is a potential explanation for the unique non-crystallographic curving of <12–1 > branches extending far from <10–1 > .
Fulgurite morphology and origin, conditions of bent dendrite formation
Rock fulgurites exhibit several morphologies, including tubes with central voids, but also surficial glass veneers (Castro et al., 2020). Natural and experimental rock fulgurites of both morphologies in basaltic andesite show large ellipsoid vesicles concentrated near the interface between the glass and the parent rock (Castro et al., 2020). We therefore suggest that the increase in size and abundance of near-circular vesicles into the glassy bulk of the investigated sample indicates the direction of the unsampled rock-melt interface. The morphology of the edge of the spongy layer, which forms a thin uninterrupted, convex-outwards layer over large vesicles (Fig. 2; Supplementary Fig. S1 a and b), implies that vesicles and melt were expanding into free space (or at least loose sediment), inconsistent with a layer formed at the interface between melt and rock. If so, the spongy crust indicates either the center of a hollow tube formed by vaporization or the interface between a melt layer and the atmosphere/soil.
We suggest that dendritic crystallization most likely occurred in a surface layer of vesiculated melt rapidly cooled on contact with the air or damp soil. Firstly, the microstructure of Cpx aggregates, progressing from faceted toward high aspect ratio dendrites, suggests a progressive increase in degree of undercooling during growth (Pontesilli et al., 2019; Masotta et al., 2020). Secondly, the faceted dendritic crystals generally occur toward the outer edge of the spongy crust, suggesting initial nucleation in regions close to the edge of the sample, supported by the observation of sub-perpendicularly elongated Cpx dendrites that grow inward from the edge of the opaque layer (Fig. 3h). Thirdly, the nanocrystalline opaque layer (Fig. 3i) implies extremely rapid surface cooling. Finally, the irregular convex outer morphology of the spongy crust, including pahoehoe-like (flow?) structures observed macroscopically (Supplementary Fig. S1a and b), is very different to the smooth concave boundary expected at a central void. However, even if our estimate of the true fulgurite morphology is incorrect, the inferences that cooling and crystallization progressed inwards from the outer edge of the spongy layer and that increasing undercooling correlated with changing Cpx morphology and increasing curvature, remain valid.
CONCLUSIONS
Based on the presence of crystallographic branching, and the consistent rotation axis and sense of bending across all branches, we conclude that bending of dendritic Cpx is the result of asymmetric compositional and/or thermal fields generated at dendrite branch tips. The bending mechanism that best fits all observations is one where asymmetry in the relative growth rates of tip facets leads to an asymmetric distribution of melt supersaturation around the branch tip, driving the branch to bend in the direction of higher melt supersaturation via preferential incorporation of dislocations of one sign. Higher inferred degrees of undercooling (based on microstructural observations) correlate with greater overall Cpx lattice curvature and greater mismatch between the curvature of Cpx branches growing parallel to {001}* and < 10–1>. These conclusions have several important implications for future studies of natural and experimentally grown dendrites of Cpx and are also relevant for other phases.
Where they are present, comparing the curvature of {001}* and < 10–1 > Cpx dendrite branches offers a new potential indicator of relative degree of undercooling.
High inferred dislocation densities in bent dendrites suggest that they should be very susceptible to recovery, recrystallization, compositional re-equilibration, and alteration. The preservation of bent dendrites in natural samples likely requires rapid quenching and the absence of hydrothermal fluids or later metamorphic events.
Bent dendrite formation in Cpx overwhelmingly leads to misorientations around [010]. Any subgrain boundaries formed during recovery will thus also inherit [010] misorientation axes. Intragrain misorientation around misorientation axes other than [010] should not be used as evidence for a bent dendritic growth stage during the development of a Cpx crystal.
Numerical models of Cpx dendrite bending should concentrate on examining the effect of branch tip morphology and the nature and relative growth rates of facets at branch tips, instead of overall dendrite morphology. In parallel, further experimental and analytical work is required to determine prevalent facets at tips and study their growth rates.
The proposed bending mechanism does not rely on any unique properties of Cpx and could occur in any mineral where tip facets are inclined to the elongation direction and have asymmetric growth rates. Phases with 2/m point group symmetry are strong candidates to exhibit bending with a consistent sense of rotation around [010]. Examining whether other phases exhibit similar behavior to Cpx would greatly aid understanding of the bending mechanism.
FUNDING
This work was supported by the Austrian Science fund [P 33227-N to T.G. and I 4580-N to R.A.].
DATA AVAILABILITY STATEMENT
All EBSD datasets featured in figures in this work, along with annotated MTEX scripts to reproduce all figures featuring EBSD data, are provided in a zipped archive (~400 MB), which is archived at the University of Vienna Phaidra online repository under the permanent identifier and link https://phaidra.univie.ac.at/view/o:1622305. Data beyond those included in the article or the supplementary material will be shared on reasonable request to the corresponding author.
SUPPLEMENTARY DATA
Supplementary data are available at Journal of Petrology online.
ACKNOWLEDGEMENTS
We thank K. Randive for providing the sample used in this study. FEG-EMPA measurements were carried out at the Department of Lithospheric Research, University of Vienna with the assistance of operator F. Kiraly. Secondary and backscatter electron imaging, as well as EBSD measurements, were carried out at the laboratory for field-emission scanning electron microscopy and focused ion beam applications at the Faculty of Geosciences, Geography and Astronomy at the University of Vienna (Austria).
