


Although gene regulation in specific organs, developmental stages or conditions has been under intense investigation in the last several decades, the full extent of the molecular mechanisms involved still remains to be elucidated in plants. In general, vigorous screening and validation of physical interactions between transcription factors (TFs) and promoters has been proven to be necessary to uncover gene regulatory networks, as shown in a recent study on gene regulation during plant regeneration (Ikeuchi et al. 2018). However, to predict TF binding sites (TFBSs) at a high resolution and on a genome-wide scale, approaches that integrate experimental data with computational modeling are becoming essential. Recently, some indications about gene regulation in plants have been obtained through approaches that integrate a vast number of experimental results, such as the multi-omics approach employed by Zander et al. (2020). Since most of the recently published biological datasets are now freely available, further use of such datasets on gene regulation is expected in plant science (Lai et al. 2019).
The simplest and most widely used method for TFBS prediction is based on motif searches by pattern-matching using a position weight matrix (PWM), which is computed from a set of conserved TFBS sequences (Stormo and Zhao 2010; Fig. 1A). Because a standard PWM that considers the independent contribution of each position to the TF binding is too simplistic, some approaches that integrate inter-base dependencies between adjacent (and/or distal) positions have also been proposed. In addition to sequence-based TFBS prediction, other important components (e.g. DNA shape features and 3D structural data) have been recently used to improve in silico TFBS modeling (reviewed by Lai et al. 2019). The variety of datasets available for TFBS prediction will likely increase in the future, and the question will then be how to utilize them comprehensively.
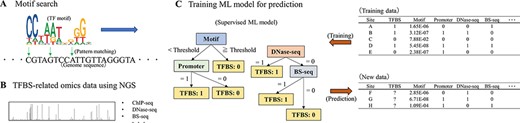
The procedure for TFBS prediction. (A) Candidate TFBSs can be obtained by motif searches using known PWMs. (B) Prior to the advent of NGS, known TFBSs were very limited, but methods such as ChIP-seq have made it possible to comprehensively examine regions involved in transcriptional regulation, including TFBSs. Novel PWMs can also be derived from ChIP-seq data. (C) Using the growing amount of TFBS-related data, it is possible to predict unknown TFBS by training with ML models. Some supervised ML models can calculate the importance of explanatory variables (e.g. results of motif searches or whether they are located on promoters) based on decision trees. Note that the data and models presented here are conceptual only. In practice, how to use the data and what models to apply are difficult issues. Training data for supervised ML models require labeled data (i.e. response variables); Rivière et al. (2022) used ChIP-seq data as labeled data for TFBS. How to integrate the increasing amount of TFBS-related omics data remains a significant future challenge.
As mentioned previously, because gene regulation is affected by various factors (e.g. organs, developmental stages and surrounding environments), not only genetic information (DNA sequence) but also epigenetic status, such as histone marks and DNA methylation (i.e. chromatin state), need to be considered for more reliable TFBS predictions. Although several alternatives for elucidating genome-wide epigenetic features are available, chromatin immunoprecipitation sequencing (ChIP-seq), which can be used to detect histone marks or the binding of specific TFs, is the most popular technique (Fig. 1B). Many datasets of ChIP-seq in plants are already available in public databases. For example, in PlantPAN 3.0, which is constructed from 421 ChIP-seq datasets, 2,449 PWMs were computed from 4,574,337 putative TFBSs in seven plant species including Arabidopsis thaliana and Oryza sativa (Chow et al. 2019). Although PlantPAN 3.0 can be accessed via a web interface and provides downloadable peak signal datasets based on ChIP-seq experiments, for many plant scientists it may not be clear how one can make use of these ChIP-seq data for TFBS prediction.
It is important to verify the multiple data obtained and work out how best to analyze them most effectively to predict TFBS rather than obtain data on TFBS (e.g. BiSulfite-seq and DNAseI-seq in addition to ChIP-seq) itself. Machine learning (ML) has been recently applied for dissecting various biological phenomena and has also been introduced to predict TFBS (Li et al. 2015; Fig. 1C). Generally, ML may have some merits over conventional statistical-based approaches even for the construction of predictive models based on larger scales and various types of biological datasets (e.g. multiple features from different data types can be used as the input). With supervised learning methods for detecting known TFBSs, one limitation was the small size of the dataset used to train the predictive model. This limitation is being resolved with omics data related to TFBS using next-generation sequencing (NGS), which is now becoming readily available (Li et al. 2015). Genome-wide TFBS candidate regions detected by ChIP-seq using NGS can be characterized by some input data (explanatory variables) such as genomic location and open chromatin status. Therefore, epigenomic analyses through ChIP-seq have facilitated ML-based modeling for TFBS prediction. Moreover, some ML models are capable of feature selection, which is used to evaluate the contribution of explanatory variables. Although only important explanatory variables should be selected before training a predictive model, some ML models may be useful when one wants to examine the importance of specific genomic features and the relationships among variables.
How to incorporate the many data associated with TFBS into a prediction model depends on the objective, but this is actually the most difficult task. In this issue, Rivière et al. (2022) describe Wimtrap—a pioneering bioinformatics tool that succeeds in integrating multiple genomic information from various plant biological databases. With Wimtrap, TFBS candidates are extracted through traditional motif search and assessment of genomic coordinates and DNA sequence conservation (i.e. whether it is present in a promoter region and conserved elements). Its predictive model is then trained by supervised learning with ML using ChIP/chip-seq as the labeled data. Interestingly, Rivière et al. (2022) showed that the epigenetic marks (or chromatin features) contributed most to the accuracy of improvement of the TFBS prediction model. Furthermore, they demonstrate how Wimtrap is a user-friendly analysis package that can help more plant biologists to analyze TFBS.
Prior to the advent of NGS, the amount of data on TFBS in plants was extremely limited. Fifteen years later, with the development of ChIP-seq using NGS (Johnson et al. 2007), TFBS analysis may now be said to have moved to ‘the Battle Against Big Data’. Some alternatives for analyzing TFBS with NGS have also been developed, such as ChIP-exo/ChIP-nexus and ATAC-seq, and databases integrating many data produced from these methods are also being developed (Kolmykov et al. 2021). However, with the exception of some model plants, the accumulation of TFBS-related data remains insufficient. If TFBS-related data were further gathered to achieve an accurate and detailed genome-wide map of TFBS, the still crude engineering of cis-regulatory regions could be performed in a more systematic manner (Li et al. 2020). Although the analysis of various data obtained by NGS has become a complex task involving a degree of trial and error, the method employed in Wimtrap has the advantage of being applicable to a wide variety of data (Rivière et al. 2022). Thus, the discoveries that are often buried in big data are now becoming accessible using a sophisticated analytical tool in biology.
Disclosures
The author has no conflicts of interest to declare.
