


Abstract
Long-chain bases (LCBs), also termed sphingobases, are building blocks of sphingolipids, which make up a significant proportion of the cellular membrane system. They are also bioactive molecules regulating intracellular processes. Elevated levels of LCBs like phytosphingosine and dihydrosphingosine can induce cell death in plants and correlate with programmed cell death (PCD) reactions after pathogen recognition. We investigated the previously hypothesized antagonism between phosphorylated and nonphosphorylated LCBs with respect to cell death in Arabidopsis thaliana. Using HPLC-MS/MS, we determined levels of phosphorylated and nonphosphorylated LCBs after cell death induction by LCB application or by Fumonisin B1 (FB1) treatment. We show that previously reported antagonistic effects of phosphorylated LCBs after simultaneous application with nonphosphorylated LCBs are linked to reduced uptake of nonphosphorylated LCBs into the tissue. Furthermore, phosphorylated LCBs did not antagonize PCD induced by avirulence protein recognition. In a functional approach, we used Arabidopsis lines with perturbed levels of phosphorylated LCBs. In these plants, the degree of FB1-induced cell death did not consistently correlate negatively with levels of phosphorylated LCBs, but positively with levels of major nonphosphorylated LCBs phytosphingosine and dihydrosphingosine. As treatment with phosphorylated LCBs did not antagonize cell death, and elevated in vivo levels of these LCB species did not reduce FB1-induced cell death, we conclude that the hypothesized general cell death-antagonizing effect of phosphorylated LCBs in plant cell death reactions should be rejected. Instead, our time-course analysis of LCB levels during cell death reactions showed a positive correlation between levels of nonphosphorylated LCBs and cell death.
Introduction
Long-chain bases (LCBs) are building blocks of sphingolipids, which are essential components of the eukaryotic membrane system. Both sphingolipids and LCBs are involved in important functions including developmental processes and responses to abiotic and biotic stress [reviewed in (Markham et al. 2013, Michaelson et al. 2016)]. LCBs, and their phosphorylated forms (LCB-Ps) have been characterized as bioactive molecules which regulate processes such as stomatal closure (Ng and Hetherington 2001, Coursol et al. 2003, Coursol et al. 2005, Worrall et al. 2008) and programmed cell death (PCD) (Shi et al. 2007, Wang et al. 2008, Lachaud et al. 2010, Alden et al. 2011, Peer et al. 2011, Berkey et al. 2012). Several lines of evidence link LCB levels with plant cell death: (i) Mutations in Arabidopsis thaliana disrupting specific steps of sphingolipid metabolism show cell death-related phenotypes, e.g. accelerated cell death 11 (acd11) and acd5, or fumonisin B1 resistant 11–1 (fbr11-1; Brodersen et al. 2002, Liang et al. 2003, Shi et al. 2007); (ii) PCD induced by recognition of avirulence proteins of Pseudomonas syringae correlates with elevated levels of LCBs in Arabidopsis leaves (Peer et al. 2010); (iii) Necrotrophic fungal pathogens utilize toxins interfering with sphingolipid metabolism of the host plant to cause cell death, e.g. Fusarium moniliforme producing Fumonisin B1 (FB1). FB1 competitively binds to the ceramide synthase LOH1 (LAG One Homolog 1; Abbas et al. 1994, Ternes et al. 2011, Luttgeharm et al. 2015), leading to perturbations in sphingolipid levels and increased synthesis of the LCBs sphinganine (d18:0) and phytosphingosine (t18:0), and this synthesis is required for FB1-induced cell death (Shi et al. 2007, Saucedo-Garcia et al. 2011). Finally, (iv) treatment with d18:0 or t18:0, but not with d18:0-P or t18:0-P induces cell death in Arabidopsis leaves (Shi et al. 2007, Takahashi et al. 2009, Saucedo-Garcia et al. 2011).
The body of evidence linking LCB levels with plant cell death triggered several studies investigating the signal transduction elements connected to LCBs (Berkey et al. 2012). It remains unclear how LCB levels are perceived by the plant and if LCB receptors exist, as in mammalian systems (Lee et al. 1998, Spiegel and Milstien 2011). MITOGEN-ASSOCIATED PROTEIN KINASE 6 (MPK6) and plant hormones such as jasmonates, salicylic acid and ethylene are linked to LCB levels and subsequent cell death reactions (Saucedo-Garcia et al. 2011, Magnin-Robert et al. 2015), but the detailed signal transduction network still remains unclear. In mammalian cells, LCBs have important roles in signal transduction. For example, Sphingosine-1-phosphate (d18:1-P; S1P) is a signaling molecule which interacts with the human S1P receptors which play important roles in regulating inflammation, growth, and other cellular processes (Obeid et al. 1993, Cuvillier et al. 1996, Brinkmann 2007, Li et al. 2014, Newton et al. 2015). In these systems, an antagonism between d18:1 and d18:1-P has been shown, with d18:1-P having anti-apoptotic effects (Maceyka et al. 2002). In plants, application of phosphorylated LCBs did not induce cell death (Shi et al. 2007, Saucedo-Garcia et al. 2011), and treatment of Arabidopsis cell culture with d18:1-P inhibited cell death processes (Alden et al. 2011). Shi et al. (2007) as well as our own studies (compare Fig. 1) provided evidence for an antagonism of phosphorylated LCB species, when simultaneously applied with nonphosphorylated LCBs.
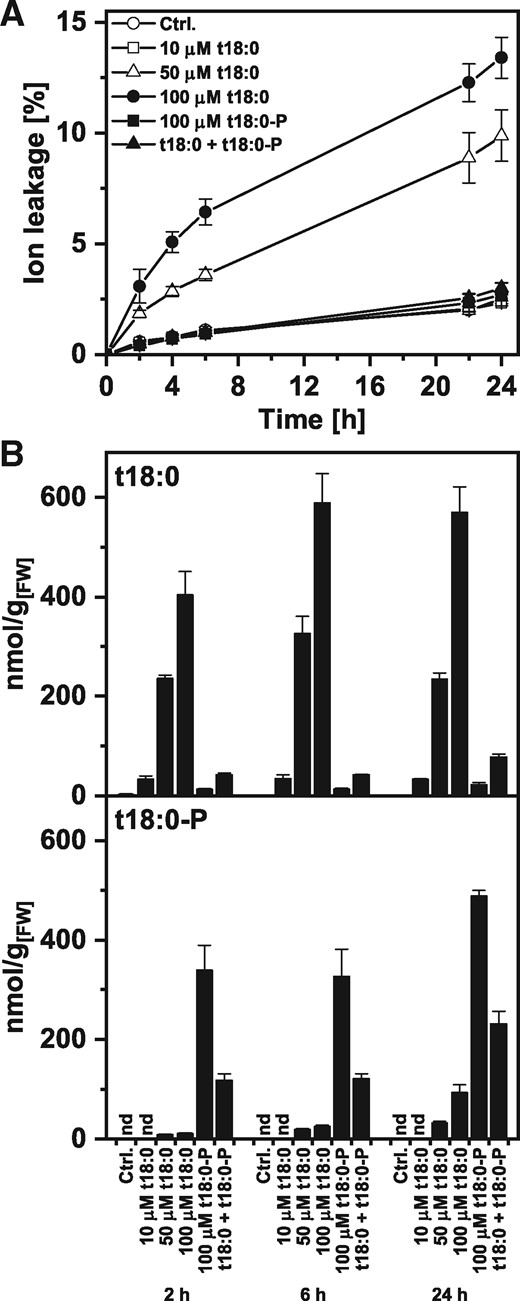
Cell death induction and LCB levels after Arabidopsis leaf disc treatment with phytosphingosine (t18:0) and phytosphingosine-phosphate (t18:0-P). (A) Time-course analysis of cell death induction after LCB treatment. Leaf discs were immersed in control solution (2% methanol in water) or the indicated concentrations of LCBs t18:0 or t18:0-P. The combined treatment of t18:0 and t18:0-P contained 100 μM of each of the two compounds. Cell death was measured as the conductivity of the solution at respective time points relative to the conductivity of the boiled sample at the end of the experiment which was set to 100%. (B) Levels of t18:0 and t18:0-P in leaf discs were measured at the indicated time points using HPLC-MS/MS. Prior to LCB extraction, leaf discs were washed to reduce carry-over of LCBs from the treatment solution. Values in (A) and (B) are means of four independent samples, each consisting of five leaf discs with error bars indicating standard deviation.
In a critical assessment of this hypothesized antagonism, we monitored LCB levels at different time points during cell death-inducing treatments of Arabidopsis leaves using High performance liquid chromatography-tandem mass spectrometry (HPLC-MS/MS). We also tested if phosphorylated LCBs can reduce or stop PCD reactions induced by recognition of an avirulence protein. We analyzed Arabidopsis mutants with disturbed levels of phosphorylated and nonphosphorylated free LCBs to determine the contribution of in vivo levels of nonphosphorylated LCB species to cell death induction in the plant.
Our results indicate that previously reported antagonistic effects of phosphorylated LCBs after simultaneous application can be explained by lower levels of nonphosphorylated LCBs in the leaf. Application of phosphorylated LCBs could also not antagonize PCD induced by the recognition of an avirulence protein. Finally, differences in cell death of Arabidopsis lines with perturbed levels of phosphorylated LCBs did not consistently depend on levels of phosphorylated, but rather to those of nonphosphorylated LCBs, leading us to reject the ‘antagonism hypothesis’.
Results
Determination of cell death and LCB levels in the leaf tissue after separate and simultaneous feeding of phosphorylated and nonphosphorylated LCBs
Leaf discs transferred to a solution containing 50 or 100 μM phytosphingosine (t18:0) exhibited cell death, as measured in the ion leakage assay (Fig. 1A), while 10 μM t18:0, or the combined application of 100 μM t18:0 and 100 μM t18:0-P did not induce cell death. Quantification of the two LCB species in the leaf discs after 2, 6 and 24 h of inoculation revealed that increasing t18:0 concentrations of the treatment solution lead to increased t18:0 levels in the leaf discs (Fig. 1B). Preceding quantification, leaf discs were surface-washed with methanol to reduce carry-over from the treatment solution. Treatment with 100 μM t18:0 led to concentrations between 400 (2 h) and 570 nmol/g (24 h). Combined t18:0/t18:0-P treatment led to six to nine times lower levels of t18:0 in the leaf discs. These levels were comparable with those after 10 μM t18:0 treatment, which were not sufficient to induce a detectable amount of cell death.
Quantification of LCBs in the treatment solution confirmed that levels of t18:0 decreased over time, negatively correlating with the levels measured in the leaf discs (see Supplementary Fig. S1A). Consequently, in case of the combined treatment with t18:0 and t18:0-P, levels of t18:0 in the solution remained high for 24 h (see Supplementary Fig. S1A), indicating that lower t18:0 levels in the leaf discs under these conditions could be due to reduced uptake of t18:0 from the treatment solution.
Levels of t18:0-P in the tissue increased by t18:0-P treatment (Fig. 1B) and reached levels of 320–480 nmol/g, while the combined treatment led to 240 nmol/g after 24 h. In both cases, levels of t18:0-P remained high in the treatment solution, which is different from t18:0. Treatment with t18:0 alone also increased t18:0-P tissue levels to up to 90 nmol/g at 24 h, presumably due to the activity of a sphingosine kinase. Measurements of major sphingolipids in t18:0-treated leaf discs showed increasing levels of t18:0-c16:0 and t18:1-c16:0 over the course of the experiment, indicating that t18:0 is available in the cell for incorporation into sphingolipids (see Supplementary Fig. S1B).
Similar to results with leaf discs (Fig. 1A), we could also induce cell death in Arabidopsis leaves by infiltration of solutions containing t18:0, but not t18:0-P or a combination of the two using a syringe (see Supplementary Fig. S1C). These results resemble those reported by Shi et al. (2007).
Partitioning of t18:0 into lipophilic organic phases is reduced by t18:0-P
The major barrier for LCB uptake into the cytoplasm is the cell membrane. We reasoned that passive diffusion of t18:0 through the plasma membrane, a lipophilic phase, could be decreased upon combined application of t18:0 and t18:0-P (Fig. 1B). To test this hypothesis, we performed an in vitro test in which either t18:0 alone, or a mixture of t18:0 and t18:0-P was dissolved in water (as in leaf disc experiments), and the same amount of chloroform was added. After mixing for 15 min and centrifugation, the two phases were separated and the amount of LCBs quantified using HPLC-MS/MS (see Materials and Methods section for details). We calculated the percentage of t18:0 in the water phase compared with the lipophilic organic phase in three independent samples. Treatment with t18:0 alone resulted in 99.6% [±0.1 (SD)] of the t18:0 partitioned into the organic phase, which was expected, as the calculated logD value of t18:0 is around 3 at neutral pH. The combined treatment of t18:0 with t18:0-P, however, resulted in about 53.6% [±15.1 (SD)] of t18:0 partitioned into the organic phase. Presence of t18:0-P therefore significantly reduced partitioning of t18:0 into the organic phase, suggesting that diffusion of t18:0 through biological membranes is also reduced in the presence of t18:0-P.
Cell death induction after preinoculation with t18:0-P
To overcome the problem of reduced uptake of t18:0 during combined treatment with t18:0-P (Fig. 1), we preincubated leaf discs with t18:0-P for 3 h and then changed the incubation solution to t18:0 and measured cell death and LCB levels. We compared the subsequent incubation directly with a combined treatment of t18:0 and t18:0-P. Different to the combined (simultaneous) treatment, the preinoculation with t18:0-P and subsequent t18:0 inoculation led to high levels of both t18:0-P and t18:0 in the leaf discs (Fig. 2B). This result was in line with a higher level of both LCBs being retained in the treatment solution upon combined treatment (see Supplementary Fig. S2). Using the subsequent incubation regime, cell death levels were indistinguishable from treatment with t18:0 alone (Fig. 2A). Therefore, high t18:0-P levels in the tissue were unable to reduce cell death induced by t18:0.
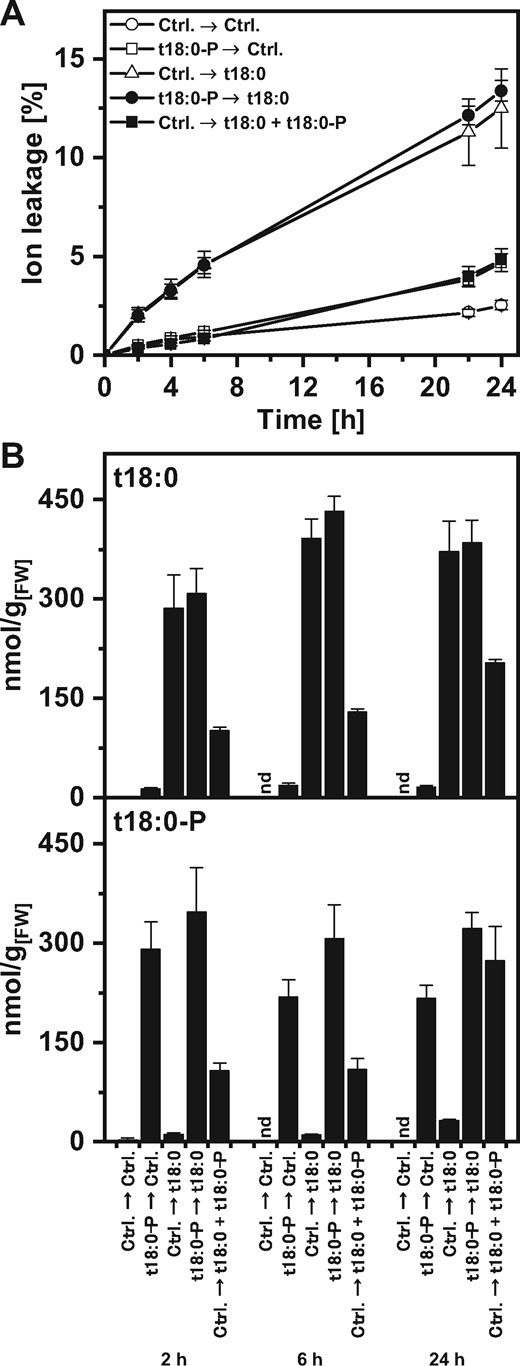
Cell death induction and LCB levels of leaf discs after different phytosphingosine (t18:0) and phytosphingosine-phosphate (t18:0-P) treatment regimes. (A) Time-course analysis of cell death after two subsequent treatments: leaf discs were incubated in the first treatment solution. After 3 h, discs were washed to reduce carry-over and incubated in the second treatment solution for the time indicated on the x-axis. Treatment solutions contained 100 μM of the indicated compounds, or the respective amount of solvent (control). Cell death was measured as the conductivity of the solution at respective time points relative to the conductivity of the boiled sample at the end of the experiment which was set to 100%. The time points indicated represent the time after immersion of leaf discs in the second treatment solution. (B) Levels of t18:0 and t18:0-P in leaf discs were measured at the indicated time points using HPLC-MS/MS. Prior to LCB extraction, leaf discs were washed to reduce carry-over of LCBs from the treatment solution. Values in (A) and (B) are means of four independent samples, each consisting of five leaf discs with error bars indicating standard deviation.
Influence of t18:0-P on AVRRPM1-induced PCD
Arabidopsis leaves react with a hypersensitive response to inoculation with an avirulent strain of the bacterial pathogen P. syringae. During this PCD reaction, levels of the free sphingobase t18:0 are elevated (Peer et al. 2010). A transgenic Arabidopsis line expressing the bacterial AvrRpm1 gene under the control of a dexamethasone-inducible promoter (Geng and Mackey 2011) was used to induce PCD. Using these controlled conditions, we wanted to test if simultaneous application with t18:0-P would be able to inhibit or reduce PCD. Using high dexamethasone concentrations (50 μM) for a saturating induction of the promoter, 65% ion leakage was induced within 6 h (see Supplementary Fig. S3A). We subsequently used lower amounts of dexamethasone (50 nM) for a moderate, linear progressing cell death reaction more suitable for observing effects of t18:0-P. Fig. 3 shows that simultaneous treatment of leaf discs with t18:0-P and dexamethasone was not able to reduce or inhibit AVRRPM1-induced PCD. In addition, infiltration of t18:0-P into the leaves 2 h before dexamethasone induction was also not able to inhibit AVRRPM1-induced PCD (see Supplementary Fig. S3B).
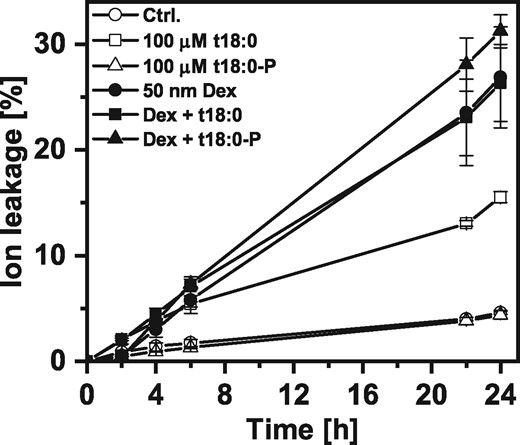
Effect of phytosphingosine (t18:0) and phytosphingosine-phosphate (t18:0-P) on AVRRPM1-induced PCD of Arabidopsis leaf discs. Time-course analysis of cell death induction in transgenic Dex:AvrRpm1-HA plants after LCB treatment or simultaneous treatment with LCBs and Dexamethasone to induce expression of AVRRPM1. For the combined treatments, the same concentrations were used as indicated for the single treatments. Cell death was measured as the conductivity of the solution at respective time points relative to the conductivity of the boiled sample at the end of the experiment which was set to 100%. Values are means of four independent samples, each consisting of five leaf discs, with error bars indicating standard deviation.
Determination of LCB levels and FB1-induced growth retardation in LCB metabolism mutants
In order to test without external application of LCBs how levels of phosphorylated LCBs influence cell death in the plant, we employed transgenic Arabidopsis lines with shifted amounts of free LCBs and LCB-Ps upon FB1 treatment (depicted in Supplementary Fig. S8). These plants are knockdown or overexpressor lines of the Sphingosine kinase 1 and Sphingobase phosphatase 1, which affect the balance between free LCBs and LCB-Ps, and the dihydrosphingosine-1-phosphate lyase (dpl1) mutant, defective in a key degradation step of LCB-Ps. We used the fungal toxin FB1 to trigger cell death. If levels of phosphorylated LCBs have an antagonistic effect preventing LCB-induced cell death, we would expect that sensitivity to FB1 negatively correlates with the amount of LCB-Ps or the ratio of phosphorylated to nonphosphorylated LCBs. Sensitivity to FB1 can be detected as reduced growth of Arabidopsis seedlings on FB1-containing medium. We used this method as a first test to detect a correlation between FB1 sensitivity and levels of phosphorylated and nonphosphorylated LCBs.
Fig. 4A shows a shift of seedling sizes in response to FB1-containing medium toward smaller plant size. This shift to smaller plant size was strongest in the dpl1-1 mutant line and in SPHK1-OE. In addition, dpl1-1 appeared chlorotic, further indicating its elevated sensitivity toward FB1 (seedling images are provided in Supplementary Fig. S4A). SPHK1-KD and SPP1-OE showed a higher sensitivity compared with Col-0 plants, while spp1-1 was similar to the wild type.

Effect of FB1 on growth and on LCB levels of Arabidopsis seedlings. (A) Growth of different Arabidopsis genotypes on control medium (left) and medium containing 0.5 μM FB1 (right). Seedlings were grown on the medium for 12 d after sawing and were grouped into three categories: Large-, medium- and small-sized seedlings. The percentage values for the number of plants falling into these three categories were calculated from plates containing 55 seedlings of each genotype. Mean values were calculated from four independent plates, with error bars indicating standard deviation. (B) Levels of d18:0 and d18:0-P (left) and t18:0 and t18:0-P (right) of seedlings of the indicated genotypes grown on FB1 medium for 12 d were measured using HPLC-MS/MS. Values are means of four independent samples, each consisting of 25–50 seedlings from one plate. Error bars indicate standard deviation. Asterisks indicate significance levels <0.05, which were calculated for each genotype for the interaction of the factors ‘genotype’ and ‘FB1 treatment’ for each of the four LCBs in a GLM.
Levels of LCBs were determined for seedlings of all genotypes after growing on FB1-containing medium for 12 d (Fig. 4B). Compared with Col-0, SPHK1-OE exhibited 2- to 2.7-fold higher levels of t18:0-P and d18:0-P, similar to dpl1-1. Kinase knockdown line SPHK1-KD and the sphingobase phosphatase overexpressing line SPP1-OE showed about 10-fold lower levels of d18:0-P and t18:0-P, while both had 2- to 3-fold higher levels of d18:0 and t18:0 compared with Col-0. SPHK1-OE and dpl1-1 had d18:0 and t18:0 levels similar to Col-0. Ratios of LCB-Ps to LCBs are provided in Supplementary Table S3. Levels of major sphingolipids are provided in Supplementary Fig. S4C for FB1-treated seedlings. For control treatments, levels of sphingolipids, together with levels of LCBs, are provided in Supplementary Fig. S4D.
Determination of LCB levels in LCB metabolism mutants with altered sensitivity to FB1-induced cell death
To analyze correlations between cell death and levels of LCBs in more detail, we utilized Arabidopsis lines with disturbed levels of LCBs in leaf disc assays and quantified LCB levels at several time points during cell death induction by FB1. Two lines showed cell death levels two to three times higher than Col-0 plants on day 2 and 3: SPHK1-KD and SPP1-OE. SPHK1-OE showed more cell death than Col-0 only at 3 d, while spp1-1 was similar to Col-0 (Fig. 5A). For SPHK1-KD and SPP1-OE, the highest d18:0 and t18:0 levels were detected 1 to 3 d after FB1 incubation: After 50 h, d18:0 levels were about 10–12 times higher than wild-type plants in these two lines, while a 3-fold increase was detected for t18:0 (Fig. 5B). At the same time these two lines had lower levels of the respective LCB-Ps. Different to SPP1-OE and SPHK1-KD, SPHK1-OE exhibited wild-type levels of d18:0-P and t18:0-P between 1 and 3 d after FB1 treatment, while also showing significantly increased levels of the nonphosphorylated d18:0 and t18:0. LCB levels of control treatment are provided in Supplementary Fig. S5.
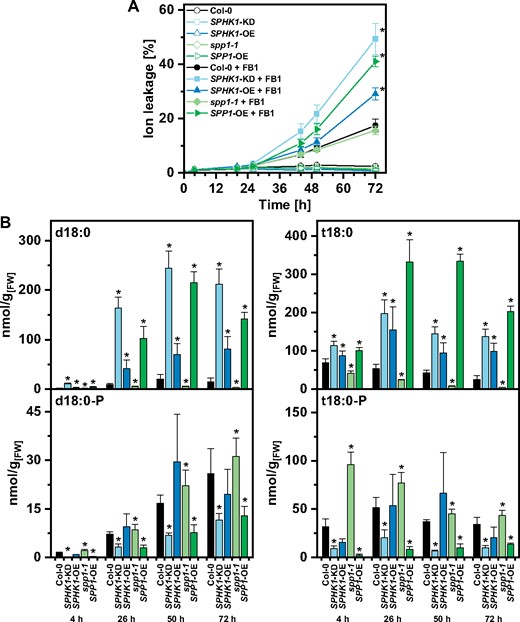
Effect of FB1 on cell death and on LCB levels in leaf discs of different Arabidopsis LCB metabolism mutants. (A) Time-course analysis of cell death induction after FB1 treatment. Leaf discs of the indicated genotypes were immersed in control solution (open symbols) or 50 μM FB1 (closed symbols). Cell death was measured as the conductivity of the solution at respective time points relative to the conductivity of the boiled sample at the end of the experiment which was set to 100%. (B) Levels of d18:0 and d18:0-P (left) and t18:0 and t18:0-P (right) of leaf discs of the indicated genotypes immersed in FB1 solution were measured using HPLC-MS/MS at the time points indicated. Values in (A) and (B) are means of four independent samples, each consisting of five leaf discs. Error bars indicate standard deviation. Asterisks indicate significance levels <0.05 for a given genotype. For cell death measurements, these levels were calculated by ANOVA for the interaction of the factors ‘genotype’ and ‘FB1 treatment’, with genotype and FB1 treatment as fixed factors and the factor ‘time’ as a covariate. For LCB concentrations, significance levels were calculated for each of the four LCBs in a GLM for the factor ‘genotype’, with the factor ‘time’ as a covariate.
Kinetics of FB1-induced cell death and LCB levels in the dpl1 mutant
Of the investigated mutants with perturbations in LCB metabolism, dpl1 showed the highest sensitivity to FB1 in growth assays (Fig. 4). We therefore determined the development of cell death and LCB levels in a time-course experiment. The dpl1 mutants showed higher FB1-induced cell death from 44 h after inoculation with 10 μM FB1 (Fig. 6A). Quantification of d18:0, t18:0, d18:0-P and t18:0-P levels revealed that all four LCB species were highly elevated in the two dpl1 mutant lines, as compared with wild-type plants, starting from 26 h. At all time points, the dpl1 mutants had a higher ratio of phosphorylated to nonphosphorylated d18:0 and t18:0 species. Stronger cell death induction in dpl1 was accompanied by levels of phosphorylated LCBs about 20 times higher than in Col-0 plants 50 or 72 h after induction (Fig. 6B). LCB levels of control treatment are provided in Supplementary Fig. S6.
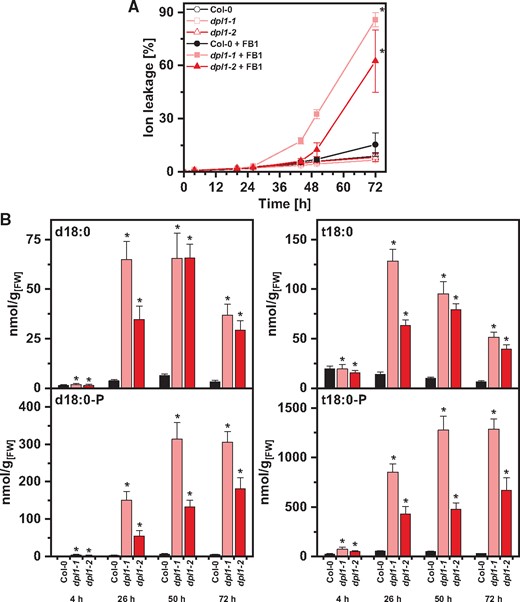
Effect of FB1 on cell death and on LCB levels in leaf discs of Arabidopsis Col-0 and dpl1 mutants. (A) Time-course analysis of cell death induction after FB1 treatment. Leaf discs of Col-0, dpl1-1 and dpl1-2 were immersed in control solution (open symbols) or 10 μM FB1 (closed symbols). Cell death was measured as the conductivity of the solution at respective time points relative to the conductivity of the boiled sample at the end of the experiment which was set to 100%. (B) Levels of d18:0 and d18:0-P (left) and t18:0 and t18:0-P (right) of leaf discs of the three genotypes immersed in FB1 solution were measured using HPLC-MS/MS at the time points indicated. Values in (A) and (B) are means of four independent samples, each consisting of five leaf discs. Error bars indicate standard deviation. Asterisks indicate significance levels <0.05 for a given genotype. For cell death measurements, these levels were calculated by ANOVA for the interaction of the factors ‘genotype’ and ‘FB1 treatment’, with genotype and FB1 treatment as fixed factors and the factor ‘time’ as a covariate. For LCB concentrations, significance levels were calculated for each of the four LCBs in a GLM for the factor ‘genotype’, with the factor ‘time’ as a covariate.
Discussion
Lack of cell death induction during simultaneous application of LCBs and LCB-Ps is due to lower LCB levels in the leaf, and not due to an antagonistic effect of LCB-P
The antagonistic signaling function of the LCBs sphingosine and sphingosine-1-phosphate is well established in mammalian cells, e.g. in controlling growth and apoptosis via specific receptors (Maceyka et al. 2002). In plants, LCBs like d18:0 and t18:0 trigger cell death, while the respective phosphorylated LCBs do not (Shi et al. 2007, Wang et al. 2008, Lachaud et al. 2010). We observed that treatment of Arabidopsis leaf discs with the sphingobase t18:0 induced cell death, while the combined treatment of t18:0 and t18:0-P did not (Fig. 1A). This being in line with results of infiltrated leaves by (Shi et al. 2007) seemed to confirm the hypothesized antagonism of phosphorylated and nonphosphorylated LCBs for cell death induction in Arabidopsis. The determination of LCB levels, however, revealed that leaf discs treated with a mixture of t18:0 and t18:0-P contained five times lower amounts of t18:0, an amount not sufficient to trigger cell death (Fig. 1A).
Low levels of t18:0 in the leaf discs during the combined treatment with t18:0/t18:0-P were probably due to a reduced uptake of t18:0 into the leaf discs from the treatment solution, as the solution retained higher amounts of this compound during the experiment (Supplementary Fig. S1A). In an in vitro test, we observed that presence of t18:0-P significantly reduced partitioning of t18:0 into the organic phase, suggesting that diffusion of t18:0 through biological membranes is also reduced in the presence of t18:0-P. The reduced availability of t18:0 in the cytoplasm or at the intracellular site of action may also explain the lack of cell death induction when using a different method of LCB application, infiltration into the apoplastic space of the leaf (Supplementary Fig. S1C), as shown by Shi et al. (2007).
To experimentally circumvent this lack of sufficiently high t18:0 levels in the leaf discs, we preinoculated the discs with t18:0-P and confirmed high levels of this compound in the leaf discs. Under these conditions, we could observe cell death induction by t18:0 despite high levels of t18:0-P (Fig. 2). This result contradicted the proposed antagonism of t18:0-P. Instead, the degree of cell death induction correlated closely with the levels of nonphosphorylated t18:0 in the leaf.
AVR-induced cell death by inducible expression of AVRRPM1 cannot be stopped by the LCB-P t18:0-P
To further elucidate if levels of phosphorylated LCBs influence the induction of cell death, we analyzed a different trigger of PCD: Recognition of the bacterial avirulence protein AVRRPM1. A transgenic line expressing AVRRPM1 under control of an inducible promoter (Geng and Mackey 2011) enabled us to induce PCD in Arabidopsis leaf discs upon simultaneous inoculation in t18:0-P solution, or after a pretreatment with t18:0-P. In both cases, the degree of cell death induced by AVRRPM1 was not significantly influenced by t18:0-P (Fig. 3; Supplementary Fig. S3). Therefore, t18:0-P was not able to antagonize or reduce PCD induction by AVRRPM1, at least when using plants expressing this protein under the control of a dexamethasone-inducible promotor that resulted in a relatively fast PCD response.
Elevated in vivo levels of t18:0-P are not able to reduce FB1-induced growth retardation
To test the influence of different in planta levels of LCB and LCB-P on cell death, we utilized a set of Arabidopsis lines which have enhanced or reduced capacities to convert LCBs and LCB-Ps, or which are unable to degrade LCB-Ps (see Supplementary Fig. S8). Several of these mutant lines were shown to differ from wild-type plants with respect to their sensitivity to the fungal toxin FB1, which induces cell death by competitively blocking ceramide synthase (Tsegaye et al. 2007, Nakagawa et al. 2012, Qin et al. 2017, Yanagawa et al. 2017). Sensitivity to FB1 was detected as reduced seedling growth on FB1-containing medium. We measured this sensitivity and correlated it with levels of phosphorylated and nonphosphorylated LCBs. FB1-induced growth retardation was strongest in dpl1 plants, which also exhibited a chlorotic phenotype, and in SPHK1-OE. Compared with Col-0, SPHK1-KD and SPP1-OE were also more sensitive. Levels of d18:0 and t18:0 were induced by FB1 about 100 times compared with control medium (see Supplementary Fig. S4D). Interestingly, the most sensitive lines, dpl1 and SPHK1-OE, showed minor differences in d18:0 and t18:0 levels compared with Col-0, while they had two to three times higher levels of the respective phosphorylated forms (Fig. 4B). Two lines with elevated sensitivity, SPHK1-KD and SPP1-OE, showed elevated d18:0 and t18:0 levels compared with Col-0, while levels of d18:0-P and t18:0-P were about 10 times lower than Col-0. As a matter of fact, it cannot be decided for these two lines if lower LCB-Ps or higher LCBs are responsible for this difference in FB1 sensitivity. For dpl1 and SPHK1-OE, however, higher sensitivity was accompanied by higher LCB-P levels, clearly not supporting a protective or antagonistic role of these LCBs against FB1-induced cell damage/growth retardation.
Endogenous LCB-P levels in LCB metabolism mutant lines do not negatively correlate with FB1-induced cell death
To be able to closely monitor the correlation of LCB levels during the development of cell death, we quantified FB1-induced cell death in leaf disc assays over time and measured LCB levels at different time points. Consistent with the seedling growth retardation assay, those two lines with the highest d18:0 and t18:0 levels (SPHK1-KD and SPP1-OE) 1–3 d after FB1 incubation showed the highest cell death induction (Fig. 5). On day 2 (50 h), d18:0 levels were about 10- to 12-fold, and those of t18:0 3- to 10-fold higher as in Col-0 (Fig. 5B). At the same time, these two lines had lower levels of LCB-Ps. As this correlated with higher cell death, it would be in line with a cell death-antagonizing activity of LCB-P. However, a line overexpressing SPHK1, which exhibited wild-type levels of LCB-P between 1 and 3 d after FB1 treatment, also exhibited stronger cell death induction. All three lines with higher cell death induction, SPP1-OE, SPHK1-KD and SPHK1-OE, exhibited a 5- to 10-fold increase in LCBs compared with Col-0, indicating a clear positive correlation with the higher cell death levels recorded (Fig. 5A). In fact, an increase of LCB levels of this magnitude is sufficient to drive higher cell death, as can be seen in t18:0 treated leaf discs (Fig. 2). Such higher cell death induction is even present when t18:0-P levels were elevated more than 10 times, e.g. by a t18:0-P pretreatment (Fig. 2B).
Qin et al. (2017) show that pressure-infiltration of 10 μM FB1 induces more lesions, and more cell death in SPHK1-OE, which is in line with our results. In contrast to our results, they observed less cell death for SPHK1-KD, which might be attributable to different experimental conditions. Indeed, FB1 concentrations can be crucial for the observed effects, as shown for Arabidopsis LONG-CHAIN BASE KINASE 1 (LCBK1) lines (Yanagawa et al. 2017). To see if our observed sensitivities of the Arabidopsis lines to 50 μM FB1 are also present at 10 μM, we repeated a leaf disc assay with this concentration and observed—as in experiments with 50 μM—that SPHK1-KD was most sensitive, followed by SPP1-OE (Supplementary Fig. S7). For SPHK1-OE, 10 μM FB1 was not enough to trigger more cell death than Col-0, consistent with the weaker difference in sensitivity for 50 μM treatments (e.g. Fig. 5A). In addition to different intracellular FB1 concentrations, FB1 responses might be influenced by different signaling pathways, e.g. mutant-specific higher jasmonate levels during FB1 treatment (Qin et al. 2017) and by differences in gene expression upon exposure to FB1, as well as altered expression and activity of enzymes in the LCB catabolism due to overexpression of SPHK1.
High endogenous LCB-P levels in the dpl1 mutant do not prevent increased FB1-induced cell death
The dpl1 (long-chain base phosphate lyase 1) mutant is defective for the breakdown of phosphorylated LCBs. LCB levels of dpl1 leaves in the absence of cell death-inducing treatments are similar to wild-type plants, with the exception of t18:1-P levels, which are five times higher (Tsegaye et al. 2007, Magnin-Robert et al. 2015, Yanagawa et al. 2017). FB1 treatment leads to a much stronger induction of cell death in the mutant (Tsegaye et al. 2007), and we observed a higher sensitivity to FB1 in seedling growth tests (Fig. 4A). In the FB1 leaf disc assay, the dpl1 mutant lines had strongly induced levels of both phosphorylated and nonphosphorylated d18:0 and t18:0 already before differences in cell death became detectable, at 26 h, and during enhanced cell death at 50 and 72 h (Fig. 6B). Therefore, even during early phases of FB1-induced cell death, high d18:0 and t18:0 levels were accompanied by high d18:0-P and t18:0-P levels. This result confirms that high intracellular levels of d18:0-P and t18:0-P are not able to reduce or inhibit FB1-induced cell death. The results are speaking against phosphorylated LCBs antagonizing FB1-induced cell death and are in line with results for dpl1 in FB1 growth inhibition experiments (Fig. 4) which were difficult to reconcile with a general negative effect of phosphorylated LCBs on cell death induction by FB1. It has been noted by Yanagawa et al. (2017) that in case of dpl1, elevated cell death induced by FB1 cannot be explained by a change in the ratio of phosphorylated to nonphosphorylated LCBs, but is accompanied by a simultaneous increase of d18:0 and t18:0 and d18:0-P. This is in line with our results for dpl1 presented here. We also calculated the ratios of phosphorylated to nonphosphorylated LCBs (Supplementary Table S3) and could not observe a clear correlation of this ratio to the degree of cell death exhibited in the different Arabidopsis lines.
While we show that elevated levels of d18:0-P or t18:0-P were not able to antagonize cell death, our results do not exclude that specific phosphorylated LCB species or sphingolipids can influence cell death under specific conditions. For example, Alden et al. (2011) show that cell death in Arabidopsis cell suspension cultures induced by either a 55°C heat treatment or subthreshold dilution of the cell culture can be attenuated by preinoculation with 1–10 μM d18:1-P. In addition, (Dutilleul et al. 2012) show that t18:0-P treatment enhances the activity of MPK6, an important signal transduction element involved in pathogen responses. Furthermore, t18:0-P influences the outcome of plant–pathogen interactions, e.g. by increasing Botrytis cinerea-induced reactive oxygen species (ROS) generation (Magnin-Robert et al. 2015).
From our studies in which we monitored levels of the major free LCBs d18:0, t18:0, d18:0-P and t18:0-P during LCB-induced cell death and FB1-induced cell death, we conclude that elevated levels of phosphorylated LCBs were not able to negatively influence cell death. Both, treatment with t18:0-P, and analysis of Arabidopsis lines with elevated t18:0-P levels did not support an antagonistic role of this LCB for cell death induction. At least for the major LCB-Ps t18:0-P and d18:0-P tested under the different cell death-inducing conditions, we can reject a cell death-antagonizing function in Arabidopsis.
Materials and Methods
Plant material and growth conditions
All mutants of A. thaliana were in the Col-0 background. The T-DNA insertion mutants dpl1-1 and dpl1-2 (SALK_020151 and SALK_093662; Tsegaye et al. 2007), spp1-1 (SALK_035202; Nakagawa et al. 2012), SPP1-OE (GK-126D07), SPHK1-KD and SPHK1-OE (SAIL_794_B01 and GK-288D07; Worrall et al. 2008) were created by SALK (Alonso et al. 2003), SAIL (McElver et al. 2001) and GABI-Kat (Kleinboelting et al. 2012), respectively, and obtained from the Nottingham Arabidopsis Stock Centre [NASC, University of Nottingham, Loughborough, UK (Scholl et al. 2000)]. The Line Dex:AvrRpm1-HA for the dexamethasone inducible expression of the effector protein AVRRPM1 was kindly provided by Geng and Mackey (2011). For experiments, plants were grown on soil in a growth chamber under a 9/15 h short day cycle at 22/20°C (70% humidity).
Plant treatment with LCBs
LCBs were purchased from Avanti Polar Lipids (Alabaster, USA) and stored in stocks of 1 mg/ml in methanol (0.5% v/v diethylamine) at -20°C. Solutions for the treatment of plants were prepared by evaporating the appropriate amount of LCB stock solution, dissolving it in methanol by ultrasonication and diluting it for the required concentration in H2O. Solutions did not exceed 2% (v/v) of methanol, and a 2% (v/v) methanol solution was used as control treatment. The solutions were infiltrated into leaves of A. thaliana from the abaxial side or were used for floating leaf discs in cell death assays. For cell death assays, leaf discs (5 mm diameter) were detached from leaves of 6-week-old plants and floated on ultrapure H2O overnight. Subsequently, five leaf discs per sample were equilibrated in 0.3 ml of ultrapure H2O for 1 h prior to changing the water with the same amount of treatment solution. Conductivity of the solution was determined using a LAQUAtwin EC-11 conductivity meter (Horiba, Kyoto, Japan). The samples were kept in darkness between the measurements. After the last measurement, the leaf discs were heated in the treatment solution in closed vials for 1 h at 100°C and the conductivity representing 100% of cell death was determined after cooling the samples to room temperature.
For induction of cell death in Dex:AvrRpm1-HA plants, dexamethasone (Sigma-Aldrich, Munich, Germany) was added using a methanol stock solution, as described for the LCB treatment above. Dexamethasone treatment does not have observable effects on wild-type plants (Aoyama and Chua 1997), and we confirmed in our own tests that treatment of leaf discs from Col-0 plants with dexamethasone at all indicated concentrations did not significantly affect levels of cell death.
Trypan blue staining of leaves
LCB infiltrated leaves were stained with trypan blue for visualization of cell death. Forty-eight hours after the treatment leaves were detached, boiled in a 0.2 mg/ml trypan blue solution in glycerol:H2O:lactic acid:phenol:ethanol (1:2:1:1:8, v/v/v/w/v) for 1 min and incubated in the staining solution at room temperature overnight. The leaves were destained in 1 g/ml chloralhydrate with several changes of the solution and kept in water.
Plant treatment with FB1
FB1 was purchased from Cayman Chemical (Ann Arbor, USA) and stored in stocks of 1 mg/ml in methanol at -20°C. For plate experiments, seeds were surface-sterilized with 70% ethanol, following sodium hypochloride (2.5% v/v) and water washing steps, and then sown on half-strength Murashige and Skoog medium (Murashige and Skoog 1962) supplemented with FB1 (0.5 μM) or 0.04% methanol as a control. Plates were incubated for 3 d at 4°C in the dark and then transferred to growth conditions as described for plants grown on soil. Leaf disc experiments with FB1 were performed as described above for treatment with LCBs, except that treatment solutions of FB1 were prepared with 1% methanol as final concentration.
Analysis of sphingolipids
Sphingolipids were extracted from plant tissues essentially as described by Scherer et al. (2009) with modifications: Plant material was collected in liquid nitrogen. In the case of leaf disc experiments, one sample consisted of five leaf disks (15 mg fresh weight) which were surface-washed once with methanol and several times with water in order to reduce carry-over of LCBs from the treatment solution. Seedlings grown on MS medium were pooled, amounting to 25 mg per sample. Frozen plant tissue was crushed and 30 µl of a citrate-phosphate buffer (pH 4.0) was added along with 30 ng of internal standards d17:1, d17:1-P, d18:1-c10:0 (Avanti Polar Lipids, Alabaster, USA). Subsequently, extraction was performed using 0.5 ml 1-butanol and 0.25 ml of water-saturated 1-butanol. The recovered butanol phase was evaporated at 60°C under reduced pressure. The residue was dissolved in 70 µl methanol [1% (v/v) formic acid] for subsequent analysis using HPLC-MS/MS. For measurement of treatment solutions we used a 70 µl aliquot and added 3.5 μl of methanol containing 30 ng of each of the internal standards. Prior to HPLC-MS/MS measurement, vials with the solution were transferred into an ultrasonic bath for 5 min in order to avoid precipitation. Detection of sphingolipids was performed essentially as described in Peer et al. (2010): Reversed-phase column chromatography (2.1 × 50 mm BEH C18 1.7 µm with guard column; Waters, Eschborn, Germany) was achieved using a Waters ACQUITY UPLC coupled to a Waters Quattro Premier XE tandem quadrupole mass spectrometer equipped with an electrospray ion source, operated in multiple reaction monitoring (MRM) mode after positive ionization. Sphingolipids were eluted with a binary gradient consisting of solvent A [methanol/H2O/HCOOH; 58:41:1 (v/v/v); 5 mM HCOONH4] and solvent B [methanol/HCOOH; 99:1 (v/v); 5 mM HCOONH4] at a flow rate of 350 µl min-1 (see Supplementary Table S1). Ionizing parameters were set to a capillary voltage of 3.0 kV with a desolvation temperature of 450°C. Ionization and fragmentation parameters were optimized for the individual sphingolipids (see Supplementary Table S2) based on their retention time with each function having a dwell time of 25 ms. Data were processed using the Waters MassLynx software.
Statistical analysis
Statistical tests were performed using the software package IBM SPSS Statistics (Ver. 24). The effect of FB1 treatment on cell death levels of the different genotypes was analyzed using a univariate analysis of variance (ANOVA). The effect of FB1 treatment on levels of the LCBs d18:0, t18:0, d18:0-P and t18:0-P of the different genotypes was analyzed using a multivariate test [general linear model (GLM)]. Variance of the levels of cell death was calculated by defining as fixed factors the respective genotype and FB1 treatment with the factor ‘time’ as a covariate, and those genotypes exhibiting significance levels lower 0.05 for the interaction of the respective genotype with the factor FB1 treatment were marked with asterisks in Figs. 5, 6. Variance of the levels of the four LCBs d18:0, t18:0, d18:0-P and t18:0-P was calculated by defining as fixed factors the respective genotype and FB1 treatment (in case of Fig. 4), and in case of Figs. 5, 6, ‘time’ as a covariate. Mean values of each of the four LCBs displayed in Figs. 4–6 are marked with an asterisk if the respective genotype exhibited a significance level lower 0.05 for the factor ‘genotype’ (Figs. 5, 6) or for the interaction between the factor ‘genotype’ and ‘FB1 treatment’ (Fig. 4). Exact significance values for all factors and in-between-subject effects are provided in Supplementary Tables S4–S6.
Calculation of logD values
LogD values for t18:0 were calculated by C. Sotriffer and J. Kehrein, Faculty of Chemistry and Pharmacy, Wuerzburg University, using the MoKa software (Ver. 3.1.3; Molecular Discovery Ltd.; Milletti et al. 2007, Milletti et al. 2009).
Funding
This work was supported by a grant from the Deutsche Forschungsgemeinschaft [DFG; WA 2478/4–1 to F.W.].
Acknowledgments
We thank the Salk Institute Genomic Analysis Laboratory for providing the sequence-indexed Arabidopsis T-DNA insertion mutants, and the SAIL consortium and GABI-Kat for providing seeds of respective Arabidopsis T-DNA insertions mutants. We thank Dave Mackey for providing us seeds of the Arabidopsis Dex:AvrRpm1-HA line. We thank C. Sotriffer and J. Kehrein, Faculty of Chemistry and Pharmacy, Wuerzburg University, for providing logD calculations and valuable discussions, and we are grateful for advice on statistical tests by Jörn Pons, Justus-Liebig University Giessen. We thank Agnes Fekete and Gabriele Gresser of the Metabolomics Core Unit, Biozentrum Wuerzburg University, for valuable discussions and support in method development.
Disclosures
The authors have no conflicts of interest to declare.
