


Abstract
Under phosphorus (P)-deficient conditions, organic acid secretion from roots plays an important role in P mobilization from insoluble P in the soil. In this study, we characterized AtALMT3, a homolog of the Arabidopsis thaliana aluminum-activated malate transporter family gene. Among the 14 AtALMT family genes, only AtALMT3 was significantly up-regulated in P-deficient roots. AtALMT3 promoter::β-glucuronidase is expressed in the epidermis in roots, especially in root hair cells. AtALMT3 protein was localized in the plasma membrane and in small vesicles. Fluorescence of AtALMT3::GFP was not observed on the vacuole membrane of protoplast after lysis, indicating that AtALMT3 localizes mainly in the plasma membrane. Compared with the wild-type (WT) line, malate exudation in the AtALMT3-knockdown line (atalmt3-1) and overexpression line (atalmt3-2) under P deficiency were, respectively, 37% and 126%. In contrast, no significant difference was found in citrate exudation among these lines. The complementation of the atalmt3-1 line with AtALMT3 recovered the malate exudation to the level of the WT. Taken together, these results suggest that AtALMT3 localized in root hair membranes is involved in malate efflux in response to P deficiency.
Introduction
Phosphorus (P) is an essential macronutrient for plants because it is a component of nucleic acids, phospholipids and ATP. Plants take up P from the soil in the form of inorganic phosphate, but P exists mainly adsorbed with Ca, Fe or Al salts, or as organic molecules in the soil. For plants, accessing soil P directly is not easy. Therefore, crop productivity on >40% of the world’s arable lands is constrained by P deficiency (Raghothama and Karthikeyan 2005).
Plants secrete organic acids, mainly citrate and malate, and acid phosphatase from roots into the rhizosphere to mobilize sparingly available P under low-P conditions (Vance et al. 2003, Lopez-Arredondo et al. 2014). Many studies have been undertaken to engineer plants with improved mobilization of organic P from soils by introduction of phosphatase or phytase genes to plants (George et al. 2004, Ma et al. 2009, Maruyama et al. 2012). However, phosphatase and phytase can hydrolyze organic P only after solubilization with organic acids. Therefore, secretion of organic acids is regarded as the bottleneck for efficient use not only of inorganic P but also of organic P in soil (George et al. 2004, Maruyama et al. 2012). Consequently, elucidation of the mechanisms underlying organic acid secretion by plants under a P-deficient condition can provide breakthroughs in the breeding and engineering of plants having efficient P acquisition characteristics.
Organic acid secretion from plant roots into the rhizosphere also plays an important role in Al detoxification to chelate toxic Al ions (Ma et al. 2001, Ryan et al. 2001, Kochian et al. 2004, Chen and Liao 2016). The mechanism of Al detoxification by organic acid secretion has been well investigated. Those studies have isolated some important genes: Al-activated malate transporter (ALMT) from Triticum aestivum (TaALMT1; Sasaki et al. 2004) and from Hordeum vulgare (HvALMT1; Gruber et al. 2010), and Al-inducible multidrug and toxin extrusion (MATE) family citrate transporter from H. vulgare (HvAACT1; Furukawa et al. 2007) and from Sorghum bicolor (SbMATE; Magalhaes et al. 2007). These genes are regarded as playing a key role for adapting Al toxicity by secreting malate or citrate to the rhizosphere. In nature, especially in acidic soil, low P availability is coincident with Al toxicity (Kochian et al. 2004, Chen and Liao 2016).
Organic acid exudation from roots is regarded as an important strategy for efficient phosphate acquisition (Narang et al. 2000). It is therefore reasonable to infer that functionally unidentified ALMTs or MATEs or other organic acid transporters contribute to carboxylate exudates induced by P deficiency. However, there is a lack of information regarding the potential molecular mechanism mediating malate transport in response to P-deficiency.
In Arabidopsis, ALMT-like genes constitute a small family of 14 members (Hoekenga et al. 2006). Some reports have characterized AtALMTs as follows: AtALMT1 is the only isolated malate transporter involved in Al tolerance (Hoekenga et al. 2006); AtALMT9 is the vacuolar malate and chloride channel (Kovermann et al. 2007, De Angeli et al. 2013); AtALMT12 is the anion efflux channel involved in stomatal closure (Meyer et al. 2010, Sasaki et al. 2010); and AtALMT6 is the malate influx or efflux channel depending on the tonoplast potential (Meyer et al. 2011). These reports described multiple functions of AtALMT family genes in Arabidopsis, including malate transport.
For this study, we obtained several lines of evidence suggesting that AtALMT3 is involved in malate exudation under P-deficient conditions. Results show that AtALMT3 was found to be up-regulated by P deficiency and that it is expressed in epidermal and root hair cells. The knockdown (KD) and overexpression lines of AtALMT3, respectively, showed a decrease and an increase in malate exudation under P-deficient conditions.
Results
Profiling of AtALMT gene expression in response to P deficiency
Expression of AtALMT genes in P-sufficient (+P) and P-deficient (–P) conditions in shoots and roots of Arabidopsis was compared (Fig. 1A) . The mRNAs for AtALMT1, 2, 3 and 10 were found to accumulate only in roots. The results show that mRNA accumulation of AtALMT2 and 3 is specific in roots and higher in –P than in +P. The mRNAs for AtALMT5 and 6 showed shoot-specific expression. Data for AtALMT7, 8, 11 and 14 are not presented because we were unable to obtain specific fragments in this study. The results show that AtIPS1, a P deficiency-responsive non-coding RNA belonging to the TPSI1/Mt4 family, is up-regulated by P deficiency (Fig. 1A).
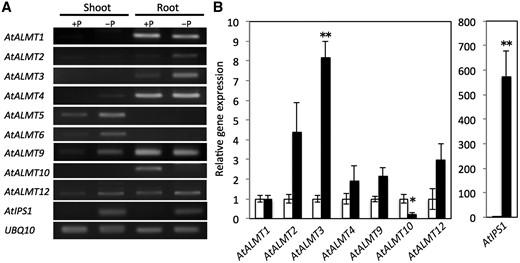
Relative mRNA accumulation of AtALMT family genes, AtIPS1 and UBQ10 analyzed using RT–PCR. (A) RT–PCR was performed for cDNAs of Arabidopsis shoot and root cultivated under hydroponic phosphorus-sufficient (+P) and phosphorus-deficient conditions (–P) for 8 d. AtIPS1 is a P deficiency-responsive non-coding RNA. Expression of the UBQ10 gene served as a control. (B) Quantitative RT–PCR was used for cDNAs from roots of Arabidopsis grown under hydroponic phosphorus-sufficient (open bars) or phosphorus-deficient (filled bars) conditions for 8 d. The UBQ10 gene was used as an internal control; mRNA accumulation in the P-sufficient condition was set to 1. Means and SE are shown in each treatment (n = 3). Significant differences from phosphorus-sufficient conditions are denoted with an asterisk (*P < 0.05, **P < 0.01).
Quantitative real-time reverse transcription–PCR (RT–PCR) revealed that only the mRNA of AtALMT3 is significantly more up-regulated in the –P than in the +P condition, although that of AtALMT10 was significantly down-regulated (Fig. 1B). AtALMT2, the most similar to AtALMT1 (77% in deduced amino acid sequence), was up-regulated in the –P condition, but the mRNA accumulation rate is lower compared with that of AtALMT3 (Fig. 1A). Actually, mRNA of AtALMT1 was found to accumulate in roots irrespective of the P condition (Fig. 1B). Additionally, AtALMT4, AtALMT9 and AtALMT12 transcripts were found in roots, but no significant difference was found for these levels based on results obtained without P (Fig. 1B). Remarkably, AtIPS1 is up-regulated 575-fold by P deficiency (Fig. 1B).
Histochemical localization of AtALMT3 expression
To investigate the histochemical localization of AtALMT3 expression, we generated transgenic Arabidopsis plants harboring a reporter gene, β-glucuronidase (GUS), under the control of the putative AtALMT3 promoter (2,049 bp upstream from the start codon). AtALMT3 promoter::GUS lines showed strong expression in the region adjacent to the meristem of roots (Fig. 2A). A root cross-section showed strong GUS activities in epidermal cells and root hairs (Fig. 2C). In particular, the root hairs, which were more developed under the –P condition than under the +P condition, were stained (Fig. 2B, C). In fact, GUS staining was not observed in shoot tissues, indicating that AtALMT3 is not expressed in shoots (Fig. 2A), thereby confirming the results obtained using RT–PCR (Fig. 1A).
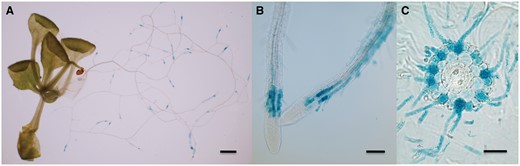
Tissue-specific expression of AtALMT3 in roots. Transgenic plants carrying an AtALMT3 promoter::GUS construct were used for GUS staining after cultivated P-deficient conditions for 20 d: (A) whole plant; (B) region behind the root tip; (C) cross-sectional view of the root. Scale bar = 1 mm (A), 100 µm (B) and 50 µm (C).
Subcellular localization of AtALMT3 protein
Fluorescence in plants with transformed AtALMT3 driven by the native AtALMT3 promoter::GFP (green fluorescent protein) was observed in the plasma membrane and small vesicles in root hair cells in the region adjacent to the meristem of roots (Supplementary Fig. S1). Green fluorescence in root hairs of the AtALMT3::GFP construct was consistent with red fluorescence from brief incubation with FM4-64, indicating involvement of the plasma membrane (Fig. 3).
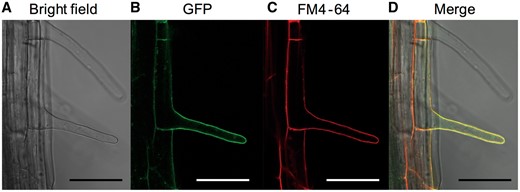
Localization of the AtALMT3 promoter::AtALMT3::GFP protein in transgenic seedlings. Transgenic plants grown under P-deficient conditions for 10 d were used: bright field image (A), fluorescence image (B), plasma membranes stained red with FM4-64 (C) and a merged image (D). Scale bars = 50 µm in all images.
In the leaf protoplasts transiently expressing AtALMT3::GFP, fluorescence was observed at the cell periphery, whereas free GFP appeared around the Chl (Fig. 4A). In contrast, in GFP-transformed protoplasts, fluorescence associated with the soluble GFP was observed throughout the cytosol (Fig. 4A). Fluorescence from AtALMT3::GFP and the GFP control was not observed on the vacuole membrane of protoplasts after osmotic lysis of the plasma membrane (Fig. 4B). However, AtALMT3::GFP fluorescence was found in Hechtian strands attaching the plasma membrane to the cell wall in plasmolyzed onion cells (Supplementary Fig. S2).
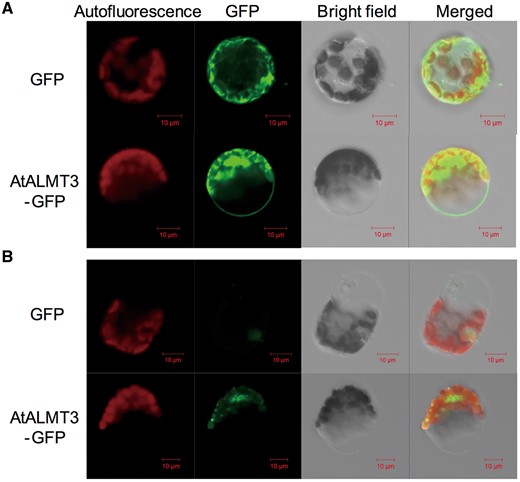
Fluorescence microscopy analysis of Arabidopsis protoplasts transiently expressing GFP control or AtALMT3::GFP. Chloroplast autofluorescence, GFP fluorescence, bright field images and merged images are shown: (A) images of a protoplast under normal conditions with the cell membrane; (B) images of a tonoplast from a protoplast after osmotic lysis of the plasma membrane.
Functional analysis of AtALMT3
We obtained two AtALMT3 mutant lines (atalmt3-1 and atalmt3-2, provided as Salk_013699 and CS841593, respectively, by the Salk Institute). T-DNA was inserted at six bases upstream of the stop codon and at 248 bases upstream of the start codon in atalmt3-1 and atalmt3-2, respectively (Fig. 5A). The T-DNA insertion deleted only the last amino acid (R to stop codon) in atalmt3-1 (Fig. 5A). However, the 3'-untranslated region (UTR) sequence was changed: it became 168 bases shorter than that of the wild type (WT) (Supplementary Fig. S3). No gene expression induced by P deficiency was observed in atalmt3-1, although the transcripts did not disappear completely (Fig. 5B). In contrast, the gene was expressed constitutively, irrespective of the P condition, in atalmt3-2 (Fig. 5B). Consequently, we inferred that atalmt3-1 and atalmt3-2 are, respectively, KD (knockdown) and overexpression mutants. Growth of atalmt3-1 cultivated under +P and –P conditions closely resembled that of the WT. However the root fresh weight of atalmt3-2 was significantly lower than that of the WT under both conditions (Supplementary Fig. S4).
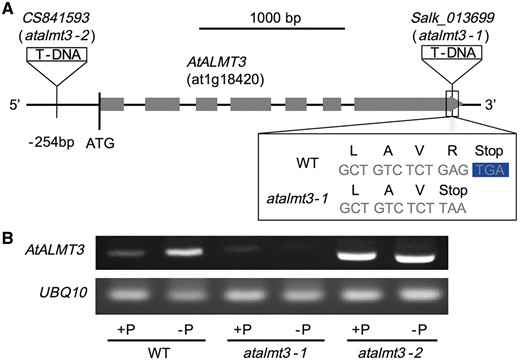
(A) Schematic of the T-DNA insertion sites of Salk_013699 (atalmt3-1) and CS841593 (atalmt3-2) on the AtALMT3 locus (at1g18420) and amino acid substitution in atalmt3-1. (B) mRNA accumulation of AtALMT3 and UBQ10 of Arabidopsis thaliana (WT, atalmt3-1 and atalmt3-2) roots cultivated under phosphorus-sufficient or phosphorus-deficient conditions for 20 d was analyzed using RT–PCR.
The exudation of both malate and citrate from –P plants was higher than that of +P plants in all lines (Fig. 6). Malate exudation in atalmt3-1 was significantly lower (by 64%) than that observed in the WT. In contrast, no significant difference in malate exudation was observed between the other overexpression line (atalmt3-2) and the WT (Fig. 6). No difference in citrate exudation was found in any of the three lines (Fig. 6). Malate concentrations in roots of –P plants were higher than in those of +P plants in all lines. No significant difference was found among the three lines (Supplementary Fig. S5). However, that of atalmt3-2 in +P was significantly lower than that of the WT (Supplementary Fig. S5). To ascertain whether the T-DNA insertion was related to the phenotype, we transformed the AtALMT3 coding sequence with the upstream sequence in atalmt3-1. Malate exudation was restored under P-deficient conditions in three AtALMT3-complement lines (Fig. 7). Gene expression of AtALMT3-complement lines was 1.4–8.1 times higher than in the WT, although two of the three lines showed no induction by P deficiency (Supplementary Fig. S6). No significant difference was found in shoot and root growth among the WT, the atalmt3-1 KD line and the same KD line complemented with AtALMT3 under conditions with soluble P (Supplementary Fig. S7).
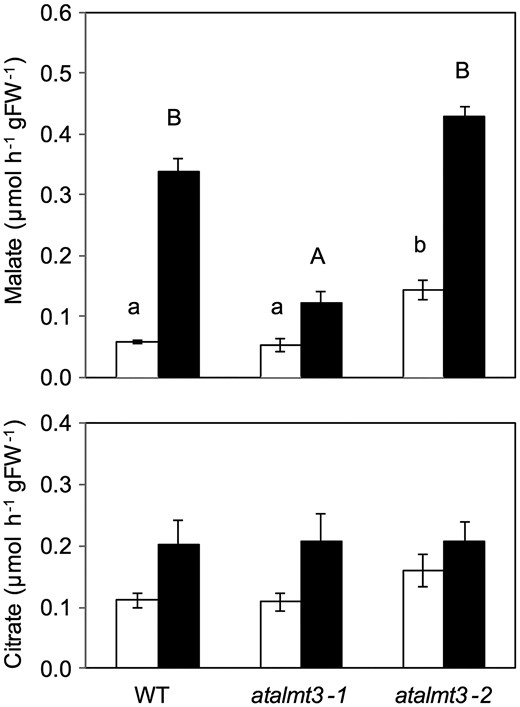
Malate and citrate exudation from roots of the WT, atalmt3-1 and atalmt3-2. Root exudates of plants cultivated in phosphorus-sufficient (open bars) and phosphorus-deficient (filled bars) conditions for 20 d were collected for 3 h. Means and SE values from samples are shown (n = 10 in the WT, n = 3 in mutants). Values not followed by a common letter are not significantly different (P < 0.05).
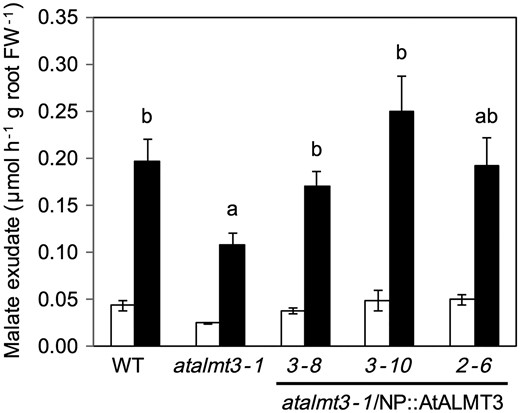
Malate exudation from roots of the WT, atalmt3-1 and transgenic atalmt3-1 carrying the native promoter::AtALMT3. Root exudates of plants cultivated in phosphorus-sufficient (open bars) and phosphorus-deficient (filled bars) conditions for 20 d were collected for 3 h. Means and SE values from samples are shown (n = 3). Values not followed by a common letter are not significantly different (P < 0.05).
To assess the potential contribution of AtALMT3 to P acquisition in soil, WT, atalmt3-1 and atalmt3-2 plants were cultivated in soil conditions with three doses of P application: P0, P100 and P300. Total P in the P0, P100 and P300 treatments was, respectively, 67.9, 106.4 and 181.9 mg 100 g–1 soil. Also, Truog-P in the P0, P100 and P300 treatments was, respectively, 2.2, 4.2 and 24.3 mg 100 g–1 soil, which indicates that the soils contained an abundant amount of unavailable P. The pH of the used soil was 5.5. No significant difference was found among the average growth data of the three lines, except for atalmt3-2 under the P0 condition (Table 1). P uptake of atalmt3-1 was significantly lower than in the WT under the P0 condition. However, no significant difference in either growth or P content was found among lines under the P100 or P300 conditions (Table 1).
Effect of phosphate availability on plant growth and P accumulation
| Dry weight (mg per plant) | P content (µg of P per plant) | |||||
|---|---|---|---|---|---|---|
| P0 | P100 | P300 | P0 | P100 | P300 | |
| WT | 0.73 ± 0.04a | 2.99 ± 0.19a | 5.32 ± 0.32a | 0.38 ± 0.04a | 2.74 ± 0.22a | 8.61 ± 0.65a |
| atalmt3-1 | 0.68 ± 0.03a | 2.75 ± 0.09a | 5.58 ± 0.45a | 0.23 ± 0.01b | 2.95 ± 0.11a | 8.00 ± 0.89a |
| atalmt3-2 | 0.39 ± 0.03b | 2.60 ± 0.26a | 5.08 ± 0.59a | 0.33 ± 0.02a | 2.44 ± 0.22a | 8.31 ± 0.97a |
The WT, atalmt3-1 and atalmt3-2 were grown for 25 d on soil culture with three levels of P aapplication [0 (P0), 100 (P100) and 300 (P300) mg P kg soil–1 of Ca (H2PO4)2·H2O]. Means and SE are shown (n = 6). Significant differences within plants (P < 0.05) are indicated by different characters.
Discussion
Under P-deficient conditions, plants secrete organic anions such as malate and citrate into the rhizosphere to mobilize insoluble P, which is bound to metal ions such as Ca, Fe and Al (Raghothama 1999, Vance et al. 2003). The organic acids are regarded as playing extremely important roles in the utilization of insoluble P in soils, although P deficiency-responsive organic acid transporter genes have not yet been isolated. Delhaize et al. (2009) reported that transgenic barley (Hordeum vulgare L.) constitutively expressing TaALMT1 enhanced the ability to acquire P from an acid soil. Therefore, malate secretion by ALMT protein also can mobilize insoluble P under P-deficient conditions.
The results show that AtALMT3 expression is specific in roots. Only one gene among those of the ALMT family was up-regulated significantly by P deficiency (Fig. 1). It has been demonstrated that AtALMT3 expression is root specific and also that it responds to drought stress (Rasheed et al. 2016), indicating that AtALMT3 is involved in responses to abiotic stress in Arabidopsis roots. Among all Arabidopsis members, AtALMT3 has the highest sequence similarity (i.e. 56%) to the tonoplast-localized AtALMT9 in mesophyll cells (Kovermann et al. 2007, De Angeli et al. 2013). Expression of AtALMT9 in this study was also observed in roots, with expression slightly, not statistically significantly, increased in P-deficient roots (Fig. 1). Expression of AtALMT1, the Al-activated malate transporter localized in roots (Hoekenga et al. 2006, Kobayashi et al. 2007), was not changed by the P status (Fig. 1B). In light of these findings, we targeted AtALMT3 as a candidate gene for the malate transporter involved in P uptake in P-deficient Arabidopsis thaliana, although details of functions of other AtALMT genes under P-deficient conditions remain unclear.
As described earlier, AtALMT3 has the highest similarity to AtALMT9 among AtALMTs, which was reported as localized in the tonoplast (Kovermann et al. 2007). The AtALMT proteins are grouped into four distinct clades (Barbier-Brygoo et al. 2011), of which AtALMT3 is a member of clade 2, as are AtALMT6 and AtALMT9, which have been characterized as tonoplast transporters (Kovermann et al. 2007, Meyer et al. 2011). In contrast, plasma membrane staining with FM4-64, which is a specific marker of this membrane during short incubations (Hosy et al. 2005), revealed that the AtALMT3::GFP fluorescence co-localized at the plasma membrane (Fig. 3). In addition, the Hechtian strands attaching the plasma membrane to the cell wall are labeled in onion cells transiently expressing AtALMT3 (Supplementary Fig. S2). Fluorescence from AtALMT3::GFP was observed in the plasma membrane and granules in the mesophyll protoplast, with transient expression of AtALMT3. Although high levels of expression occasionally cause partial mislocalization, GFP florescence was not observed on the vacuolar membrane of protoplasts (Fig. 4B). These observations, which are consistent with plasma membrane, rather than vacuolar, localization of AtALMT3, suggest that AtALMT3 is localized in the plasma membrane. The GFP florescence was observed not only in the plasma membrane but also in small vesicles in Arabidopsis plants stably expressing AtALMT3::GFP (Supplementary Fig. S1). This result suggests that AtALMT3 can localize at both the plasma membrane and the endomembrane, similarly to AtALMT12 and HvALMT1 (Gruber et al. 2010, Sasaki et al. 2010).
Skene (2003) reported that exudation of low molecular weight compounds and phosphate uptake exhibit peaks at a region immediately behind the root tip. That phenomenon is demonstrated clearly by promoter::GUS analysis results that reveal that AtALMT3 expression occurs in a region immediately behind the root tip, as expected (Fig. 2A, B). Expression of AtALMT3 was specific to the root hairs (Fig. 2C). The root hairs are inferred to have an extremely important role in the uptake of several mineral nutrients, including P, from soil (Gahoonia and Nielsen 1998, Gilroy and Jones 2000, Tanaka et al. 2014). To take up phosphate, the phosphate transporter genes of Arabidopsis (Pht1;2) or barley (HvPht1;1) are also up-regulated in root hairs under P-deficient conditions (Karthikeyan et al. 2002, Mudge et al. 2002, Schunmann et al. 2004). The spatial and tissue localization is indeed consistent with a function that could in principle be related to the enhanced P uptake, indicating that AtALMT3 is related to P nutrition.
To ascertain the physiological role of AtALMT3, we obtained two T-DNA insertion mutant lines for AtALMT3. The T-DNA insertion deleted only the last amino acid in atalmt3-1. However, the 3'-UTR sequence was changed. It became shorter than that of the WT (Supplementary Fig. S3). The 3'-UTR sequences might have a role in mRNA stabilization (Green 1993). The short 3'-UTR with a sequence different from that of the native 3'-UTR possibly affected reduction of the expression level of AtALMT3. The T-DNA insertion in the 254 bp upstream region might act as an enhancer of AtALMT3 expression in the atalmt3-2 line. Our results demonstrate that malate exudation was lower in the AtALMT3 KD mutant atalmt3-1 and higher in the overexpression line atalmt3-2 (Fig. 6).
The amount of malate exudation in atalmt3-2 plants was only 1.4 times greater than that in the WT, although the mRNA accumulation of AtALMT3 was greater (Figs. 5, 6). Furthermore, the amount of malate exudation was not synchronous with mRNA accumulation of AtALMT3 (Fig. 7; Supplementary Fig. S6). Malate concentrations in roots under P-deficient conditions were not different among the three lines, although the concentration was higher under P-deficient conditions than under P-sufficient conditions (Supplementary Fig. S5). These results suggest that an imbalance between malate synthesis and exudation causes a low rate of malate exudation in atalmt3-2 plants. Although P contents and concentrations of the atalmt3-2 line were not different from those of the WT under 1/2 MS medium conditions, the atalmt3-2 line exhibited less growth than the WT (Supplementary Fig. S4; Table S1).
In Arabidopsis, the transcription factor phosphate starvation response 1 (PHR1) is central to adaptation to P deficiency (Nilsson et al. 2012). The T-DNA insertion region in atalmt3-2 was downstream of four potential PHR1-binding sites (Supplementary Fig. S3) in the 2 kb promoter region of AtALMT3 from the PlantPAN database (Chow et al. 2016). That fact implies that the PHR-dependent regulation of AtALMT3 is lost by the insertion in the atlamt3-2 line. Therefore, the inducibility of AtALMT3 under low P is necessary not only for tolerance for P limitation but also for normal plant growth. Reportedly, AtALMT1 is involved in the signaling pathway of low P availability at the root chip. It exudes malate as an inhibitor of root cell wall expansion (Balzergue et al. 2017, Mora-Macias et al. 2017). Although the tissues in which AtALMT1 and AtALMT3 are expressed differ (Fig. 2; Kobayashi et al. 2007), the excess amount of AtALMT3-mediated malate inhibits root growth in the atlamt3-2 line.
Unfortunately, expression of AtALMT3 in Xenopus oocytes did not result in measureable malate transport activity. However, transformation of the atalmt3-1 KD line with AtALMT3 complements the malate exudation phenotype under low P conditions (Fig. 7). This fact strongly supports that AtALMT3 is involved in malate exudation from roots. An inconsistency between the malate efflux (Fig. 7) and mRNA accumulation of AtALMT3 (Supplementary Fig. S6) in complemented lines might indicate other factors regulating malate exudation via AtALMT3. Moreover, P uptake of atalmt3-1 was found to be significantly lower than in the WT under the P-limited soil condition (Table 1), suggesting that the AtALMT3-mediated organic acid efflux plays a role in the mobilization of insoluble P in soils. However, in Arabidopsis, the amount of malate in root exudates was found to be much lower than that in low-P-tolerant plants, such as white lupin (Ryan et al. 2001). Therefore, the AtALMT3-mediated malate exudation was insufficient to cause increased plant growth under the conditions used for this study (Table 1).
In conclusion, we demonstrated the potential involvement of AtALMT3 in low-P-inducible malate exudation in Arabidopsis roots. Considering that the transport of organic acids is a key mechanism for efficient P acquisition in plants, our findings highlight potential physiological and molecular mechanisms necessary to mobilize sparingly available P in soil.
Materials and Methods
Arabidopsis accessions
Arabidopsis thaliana (Col-0) was used for all control experiments. The T-DNA insertion mutants of AtALMT3, atalmt3-1 (Salk_013699) and atalmt3-2 (CS841593) were obtained from the Arabidopsis Biological Resource Center (ABRC). Homozygous plants were identified using PCR with appropriate primer sets (Supplementary Table S2).
Growth conditions and gene expression analysis
Arabidopsis thaliana (Col-0) was grown for 3 weeks in a culture solution containing P. At 21 d, seedlings were transferred to culture solutions with or without P. The culture solution composition used for the study comprised the following: 0 mM (–P solution) or 0.32 mM (+P solution) NaH2PO4, 2.1 mM NH4NO3, 0.19 mM K2SO4, 0.39 mM KCl, 1.2 mM CaCl2, 0.82 mM MgSO4, 36 µM Fe (III)-EDTA, 9.1 µM MnSO4, 46 µM H3BO3, 3.1 µM ZnSO4, 0.16 µM CuSO4 and 0.052 µM (NH4)6Mo7O24 made up with deionized water and with pH of 5.2 adjusted using 0.1 M NaOH. The culture solution was aerated continuously and was changed every other day. Shoots and roots of plants were harvested after 8 d; they were then used for gene expression. Plants were grown in a growth chamber under a 16 h light period with temperatures of 25°C during the daytime and 20°C at night. Total RNA was extracted using a kit (Agilent Plant RNA Isolation Mini Kit; Agilent Technologies Inc.) as recommended by the manufacturer. Total RNA (300 ng) was reverse-transcribed into cDNA in a 10 µl reaction using a cDNA synthesis kit (SuperScript® VILO™; Invitrogen Corp.). The cDNAs and specific primer sets (Supplementary Table S3) were used for RT–PCR and qRT–PCR. RT–PCR was conducted at 94°C for 1 min, followed by 30–35 cycles of 94°C for 30 s, 55°C for 30 s and 72°C for 1 min using Ex taq (TAKARA BIO INC.). The PCR products were separated on a 2% agarose gel and stained with SYBR Green I, detected with Lumivision (Aisin Seiki Co. Ltd.). Quantitative real-time RT–PCR was performed using a real-time PCR system (ABI StepOne; Applied Biosystems) and SYBR Green kit (TAKARA BIO INC.). The real-time PCR process included initial denaturation at 95°C for 10 min, followed by 40 cycles of 95°C for 15 s and 60°C for 1 min, and a final dissociation stage of 95°C for 15 s, 60°C for 1 min and 95°C for 15 s. Data were analyzed using software (ABI StepOne system; Applied Biosystems). Transcripts were quantified using actin transcripts as a control.
Collection of root exudates and measurement
Surface-sterilized seeds of each Arabidopsis line were germinated for 4 d in 10 × 10 cm plastic dishes containing sterile 1/2 Murashige and Skoog (MS) medium and 0.5% (w/v) gellan gum (pH 5.6). Seedlings were transferred to the same sized dishes containing 1/2 MS medium with or without 0.625 mM phosphate. After 20 d, cultivated plants were transferred to inclined square dishes containing 2 ml of distilled water in a corner of the dishes after washing with distilled water. They were kept for 3 h to collect root exudates. Citrate and malate contents in the exudates were found using enzyme assay kits (E-kit; Roche Diagnostics Corp.). Also, fresh weights of roots and shoots were found. Then the roots and shoots were frozen immediately in liquid N2 for use in RNA isolation. Total RNA extraction and cDNA synthesis were conducted using methods described earlier. The primer sets used for RT–PCR are shown in Supplementary Table S3.
Soil culture and phosphorus analysis
A commercial loamy soil was sieved through 2 mm holes. From it, three levels of P application were prepared: 0, 100 and 300 mg P kg soil–1 as Ca(H2PO4)2·H2O (P0, P100 and P300, respectively). As nitrogen and potassium sources, 150 mg N kg soil–1 as (NH4)2SO4 and 150 mg K kg soil–1 as K2SO4 were applied to all treatments. Seeds of A. thaliana were sown directly in 4.5 × 4.5 × 4.5 cm3 plastic pots (10–20 seeds per pot) containing 50 g of soil prepared as described above. After incubation at 4°C for 4 d for vernalization, plants were grown in a growth chamber under a 16 h/ 8 h light period at 23°C with 75 µmol cm–2 s–1. After an additional 25 d cultivation, plants were harvested; their shoots were harvested and oven-dried at 70°C for 3 d. The dry matter of shoots was determined; then they were ground to a fine powder. After grinding, samples were digested using H2SO4–H2O2. The soil pH was measured in a water suspension (soil water ratio of 1:2.5) after shaking for 1 h. Total P of soil was found after digestion of the sample with H2SO4–H2O2. Plant-available P was extracted using 1 mM H2SO4 buffered with (NH4)2SO4 for 30 min at room temperature with shaking (Truog 1930). The P concentration in the solution was quantified using the vanado-molybdate blue method (Dissanayaka et al. 2015).
Construction of binary plasmids and transformation of plants
For construction of plasmids, PCR was performed using a high-fidelity enzyme Prime STAR GXL DNA polymerase (TAKARA BIO INC.). To amplify the 2,049 bp genomic sequence upstream of the longest open reading frame (ORF) for AtALMT3, the following primers were used. Forward primer: 5'-ccgtcgacGAAACACTTGATAAAGCCACAAGTC-3' and reverse primer: 5'-gcgccggctctagaTTCTGGTTCTTGATTCCGATGATTGC-3' (upper case letters denote the native sequence of AtALMT3; lower case letters denote the adaptor sequences). These primers, which include restriction endonuclease site sequences (underlined), are designed for cloning to pENTR 3 C entry plasmid (Invitrogen Corp.). Construction of the AtALMT3 promoter::GUS reporter gene was performed using the pGWB3 plasmid (Nakagawa et al. 2007) with a cloning system (Gateway; Invitrogen Corp.). The AtALMT3 ORF (coding sequence) of 1,743 bp (except for the stop codon), was amplified using primers 5'-ccgtcgactctagaATGGCGGCACCAAAGCTGGAATC-3' and 5'-ccgcggccgcaaaggatcctccgccaccCTCAGAGACAGCTTCTTTG-3', which include restriction sites (underlined) and additional linkers (double underlined) for the fusion of C-terminal GFP derived from the plasmid pTH2 (Chiu et al. 1996). Binary plasmids of the AtALMT3 promoter fused to the coding sequence::GFP were modified from the AtALMT3 promoter::GUS reporter gene plasmid using pGWB3 by replacing the GUS gene with the AtALMT3::GFP fragments. Binary plasmids were introduced into Agrobacterium tumefaciens strain EHA101 (Hood et al. 1986) or LBA4404. Transformations were performed using the floral dipping method (Clough and Bent 1998). Transgenic plants (T1) were selected on MS medium containing 20 µg ml–1 kanamycin and 100 µg ml–1 carbenicillin; then they were grown in soil. The self-pollinated progeny (T2) were selected by kanamycin resistance and were analyzed for gene expression, GUS staining and GFP fluorescence. For complementation analysis, the binary plasmid of the AtALMT3 promoter fused to the coding sequence was modified from the AtALMT3 promoter::GUS reporter gene plasmid using pGWB3 by replacing the GUS gene with the AtALMT3 fragments and was transformed to the atalmt3-1 line using the floral dipping method, as described earlier.
GUS assay and detection of GFP fluorescence
GUS staining was conducted using a method described in a previous report (Weigel and Glazebrook 2002) and was observed using microscopy (SZ61 and CX31; Olympus Corp.). Subcellular localization was ascertained via the transient expression of translational fusions with GFP in Arabidopsis leaf protoplasts and onion cells driven by the 35S promoter in the pTH2 vector (Chiu et al. 1996). Arabidopsis protoplasts were prepared from 3-week-old Col-0 plants grown on soil as described by Wolfenstetter et al. (2012). Transformed Arabidopsis protoplasts were incubated for 24 to 72 h in the dark at 22°C prior to confocal analysis. Osmotic lysis of protoplasts was performed as described by Schneider et al. (2012). Fluorescence was observed using a laser scanning microscope (LSM700; Carl Zeiss Inc.) with excitation at 488 nm and emission at <595 nm for GFP, and with excitation at 555 nm and emission at >585 nm for chloroplast autofluorescence. Images were processed using ZEN software (Carl Zeiss Inc.). Fluorescence was observed in plants using a microscope (All-in-One Fluorescence Microscope BZ9000; Keyence Co.) with 488 nm excitation and 505–530 nm emissions for GFP. For staining of the plasma membrane, plants were incubated with 20 mM FM4-64 (Invitrogen Corp.) for 5 min. Then they were washed three times in water. Plates were scanned with excitation at 473 nm and were detected with a 495–545 nm filter (green; GFP fluorescence) and a >560 nm filter (red; FM4-64) using a confocal laser scanning microscope (FLUOVIEW1000-D BX-61; Olympus Corp.).
Statistical analysis
All cultivations were replicated three or more times. Student t-tests and Tukey tests were applied using software (SPSS version 16J; SPSS Inc.). Significance was inferred for P < 0.01 and P < 0.05.
Funding
This research was supported by the Ministry of Education, Culture, Sports, Science and Technology (MEXT) by grants in aid: Nos. 20053015, 18208008, and 17H03783 to J.W. and No. 17078007 to T.S.
Acknowledgments
We are grateful to several benefactors for providing plasmids: T. Nakagawa (pGWB3), Y. Niwa (pTH2 plasmids), and H. Sano and K. Nakamura (Agrobacterium EHA101). We also thank M. Ariyoshi and Y. Tsuchiya for assistance with experiments. This research was supported by MEXT as part of Joint Research Program implemented at the Institute of Plant Science and Resources, Okayama University in Japan. We acknowledge support for observations made using laser scanning microscopy at the Research Center of Research Facilities and the Natural Science Center for Basic Research and Development at Hiroshima University and the Japan Advanced Plant Science Research Network.
Disclosures
The authors have no conflict of interest to declare.
