


Abstract
Enzymatic side reactions can give rise to the formation of wasteful and toxic products that are removed by metabolite repair pathways. In this work, we identify and characterize a mitochondrial metabolic repair mechanism in Arabidopsis thaliana involving malate dehydrogenase (mMDH) and l-2-hydroxyglutarate dehydrogenase (l-2HGDH). We analyze the kinetic properties of both A. thaliana mMDH isoforms, and show that they produce l-2-hydroxyglutarate (l-2HG) from 2-ketoglutarate (2-KG) at low rates in side reactions. We identify A. thalianal-2HGDH as a mitochondrial FAD-containing oxidase that converts l-2HG back to 2-KG. Using loss-of-function mutants, we show that the electrons produced in the l-2HGDH reaction are transferred to the mitochondrial electron transport chain through the electron transfer protein (ETF). Thus, plants possess the biochemical components of an l-2HG metabolic repair system identical to that found in mammals. While deficiencies in the metabolism of l-2HG result in fatal disorders in mammals, accumulation of l-2HG in plants does not adversely affect their development under a range of tested conditions. However, orthologs of l-2HGDH are found in all examined genomes of viridiplantae, indicating that the repair reaction we identified makes an essential contribution to plant fitness in as yet unidentified conditions in the wild.
Introduction
Enzymatic side reactions of promiscuous enzymes can give rise to the build up of wasteful and toxic products that must be reverted by metabolite repair reactions or pathways (Linster et al. 2013). In plants, the best studied examples of metabolic errors and their control systems include the oxygenase side activity of the CO2 fixation enzyme ribulose bisphosphate carboxylase (Rubisco) and the photorespiratory salvage pathway (Andersson 2008, Maurino and Peterhansel 2010), the methylglyoxal-forming elimination reaction catalyzed by triose phosphate isomerase and the glyoxalase repair pathway (Richard 1991, Engqvist et al. 2009), as well as the formation of non-functional hydrates of NADH and NADPH and the NAD(P)H repair pathway comprising a stereospecific dehydratase and an epimerase (Colinas et al. 2014, Niehaus et al. 2014). In mammals, an important metabolic error is the formation of l-2-hydroxyglutarate (l-2HG) by NAD-dependent malate dehydrogenase (MDH) (Rzem et al. 2007). The main activity of MDH (EC 1.1.1.37) is the interconversion of malate to oxaloacetate (OAA). In a side reaction, the mammalian mitochondrial MDH (mMDH) also catalyzes the NADH-dependent reduction of 2-ketoglutarate (2-KG) to l-2HG (Rzem et al. 2007). l-2HG is metabolized back to 2-KG by a mitochondrial l-2HG dehydrogenase (l-2HGDH; EC 1.1.99.2) (Rzem et al. 2004, Topcu et al. 2004). l-2HGDH thus prevents the loss of carbon moieties from the tricarboxylic acid (TCA) cycle and protects from the accumulation of toxic levels of l-2HG, acting as a metabolite repair enzyme (Rzem et al. 2004, Topcu et al. 2004).
In humans, mutations in l-2HGDH causes the rare inherited autosomal recessive disease l-2-hydroxyglutaric aciduria, which is characterized by elevated levels of l-2HG (Duran et al. 1980, Rzem et al. 2004). Affected individuals develop neurological disorders including mild to moderate psychomotor retardation, cerebellar ataxia, variable macrocephaly, and epilepsy. In this disease, l-2HG also contributes to the formation and malignant progression of brain tumors, probably through inhibition of histone lysine demethylases (Moroni et al. 2004, Aghili et al. 2009, Chowdhury et al. 2011). It is still unclear whether l-2HG has a function in mammalian cells or is simply a metabolic by-product of mMDH from 2-KG. However, there is evidence that l-2HG might play a role in regulating the activity of mitochondrial creatine kinase (da Silva et al. 2003); due to its structural analogy with l-glutamate, it may also interfere with glutamatergic neurotransmission (Rzem et al. 2004).
l-2HG detoxification is thus of paramount importance in humans. However, despite extensive knowledge about l-2HG metabolism in mammals, nothing is known about its metabolism in plants, except that it is present at low quantities in plant extracts (Engqvist et al. 2011). In plants, several MDH isoforms, encoded by different genes, catalyze the reversible oxidation of malate to OAA in different subcellular compartments. In mitochondria, mMDH fulfills at least three distinct physiological roles depending on the metabolic state of the cells (Gietl 1992, Tomaz et al. 2010). First, it oxidizes malate to OAA to supply the substrate for the citrate synthase reaction (Journet et al. 1981). Secondly, it reduces OAA to malate, providing NAD for the glycine decarboxylase reaction (Journet et al. 1981). Thirdly, it reduces OAA to malate, which is used as a transient store of CO2 in plants performing C4 and CAM photosynthesis (Hatch 1976). Whether plant mMDH isoforms are promiscuous and catalyze the formation of l-2HG, whether any repair enzyme catalyzes the reverse reaction (l-2HG detoxification) in plants and whether l-2HG is toxic to plants is currently unclear.
In the present work, we interrogate these unknowns by investigating the source of l-2HG in plants, how it is metabolized and whether the metabolite is toxic in a range of growth conditions. We show that the two mMDHs of Arabidopsis thaliana, mMDH1 and mMDH2, do indeed use 2-KG as substrate in a side reaction, which forms l-2HG. We identify the A. thaliana gene encoding the homolog of the mammalian repair enzyme l-2HGDH, and demonstrate that the encoded enzyme catalyzes the conversion of l-2HG to 2-KG. Thus, A. thaliana possesses the biochemical components of an l-2HG metabolic repair system identical to that found in mammals. Metabolic analysis showed that loss-of-function mutants in l-2HGDH have elevated l-2HG levels, whereas no other measured metabolite was affected. However, the mutants showed no obvious phenotype under a range of tested growth conditions; even growth on synthetic media supplemented with high concentrations of l-2HG did not result in any obvious phenotype. The lack of a dramatic phenotype in plants despite elevated cellular l-2HG levels marks a significant difference between plants and animals. However, we found orthologs of l-2HGDH in all examined genomes of viridiplantae (Engqvist et al. 2014), indicating that this enzyme makes an essential contribution to fitness in the wild.
Results and Discussion
Properties of A. thaliana recombinant mitochondrial MDH1 and MDH2
To start studying l-2HG metabolism in plants, we first determined the source of l-2HG in A. thaliana. We generated the recombinant A. thaliana mMDHs and investigated their biochemical properties. The cDNAs of the two mitochondrial isoforms, mMDH1 (At1g53240) and mMDH2 (At3g15020), were cloned into an expression vector without the predicted N-terminal mitochondrial targeting sequences, and were expressed in Escherichia coli. As shown in Fig. 1A and B, the recombinant enzymes were successfully expressed and purified: both proteins were visible as single bands of approximately 38 kDa on SDS–PAGE, matching the predicted molecular weights. The identities of these bands were confirmed by Western blot analysis using an anti-His antibody, which targets the His-tag carried by the recombinant proteins (Fig. 1A, B). In-gel activity assays after native electrophoresis of mMDH1 and mMDH2 using malate and NAD as substrates indicated that both isoforms are highly active, as a single band appeared rapidly in the gel in each case (Fig. 1C).
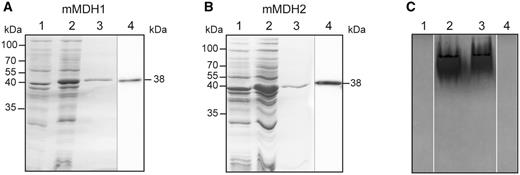
A. thaliana recombinant mMDH1 and mMDH2 analyzed by gel electrophoresis. Coomassie-stained SDS–PAGE and Western blot analysis of recombinant mMDH1 (A) and mMDH2 (B). Lane 1, 10 µg of non-induced cell culture lysate. Lane 2, 10 µg of cell culture lysate after 4 h of induction with IPTG. Lane 3, 5 µg of purified recombinant protein. Lane 4, 1 µg of purified mMDH protein analyzed by Western blot using anti-His antibodies. Molecular weight markers are indicated on the left. The molecular weight of the recombinant proteins is indicated on the right. (C) In-gel activity assay of mMDH1 (lane 2) and mMDH2 (lane 3) after native PAGE using malate and NAD as substrates. Lanes 1 and 4, assays of mMDH1 and mMDH2 activity without malate.
The enzymatic activity of the purified proteins was assayed in both directions of the reaction at pH 7.4 (Tomaz et al. 2010) by measuring the oxidation or reduction of NADH and NAD, respectively. Both mMDH1 and mMDH2 showed the highest activities with OAA. Comparison of the activities of the enzymes in both directions of the reaction indicates that the maximal activity of mMDH2 is only 28% of that of mMDH1 when acting on OAA, while the mMDH2 activity is 67% of that of mMDH1 when acting on malate (Table 1). When taking into account the absolute values, mMDH1 and mMDH2 have 80- and 34-fold higher activities when using OAA than when using malate as substrate (Table 1). In this regard, while the mMDH reaction is reversible, the enzyme from all plant species favors the synthesis of malate in vitro (Hameister et al. 2007).
Maximal enzymatic activities (mmol min−1 mg−1) of A. thaliana recombinant mMDH1 and mMDH2 using different substrates and measured at pH 7.4
| mMDH1 | mMDH2 | |
|---|---|---|
| OAA + NADH | 2.39 ± 0.30 | 0.67 ± 0.23 |
| Malate + NAD | 0.03 ± 0.01 | 0.02 ± 0.01 |
| 2-KG + NADH | 0.38 ± 0.07 | 0.08 ± 0.01 |
| mMDH1 | mMDH2 | |
|---|---|---|
| OAA + NADH | 2.39 ± 0.30 | 0.67 ± 0.23 |
| Malate + NAD | 0.03 ± 0.01 | 0.02 ± 0.01 |
| 2-KG + NADH | 0.38 ± 0.07 | 0.08 ± 0.01 |
The values represent the mean ± SE of three independent enzyme preparations.
OAA, oxaloacetate; 2-KG, 2-ketoglutarate.
As mammalian mMDH reduces 2-KG to l-2HG using NADH as cofactor in a side reaction (Rzem et al. 2007), we also analyzed whether the recombinant A. thaliana mMDH1 and mMDH2 act on 2-KG. As in the case of the mammalian mMDH, the plant isoforms also showed activity with 2-KG. These activities were 16% and 12% of the activity measured with OAA as substrate in the case of mMDH1 and mMDH2, respectively.
We then determined the kinetic parameters of the purified mMDH1 and mMDH2 for the competitive reductions of OAA into malate and of 2-KG into l-2HG using NADH as cofactor. Both isoforms showed normal hyperbolic saturation kinetics when using OAA as substrate. The determination of the kinetic constants of the reduction of OAA indicated that mMDH1 has a 4.7-fold higher overall catalytic rate (Kcat) than mMDH2 (Table 2). Both isoforms possess low KmOAA values (Table 2), indicating high affinities for this substrate. We found that mMDH1 needs lower OAA concentrations than mMDH2 to achieve the maximum reaction velocity (KmOAA of 0.27 and 1.0 mM for mMDH1 and mMDH2, respectively; Table 2). The mMDH1 KmOAA value obtained is in the same range as those reported for other plant MDHs. For example, the mitochondrial and glyoxysomal isoforms of MDH from watermelon have KmOAA values of 0.15 and 0.18 mM, respectively, while the cytosolic MDH of alfalfa has a KmOAA value of 0.40 mM (Gietl 1992, Miller et al. 1998, Yao et al. 2011). The kinetic properties we found for mMDH1 and mMDH2, together with the fact that mMDH1 is the dominant protein isoform observed in mitochondrial extracts (Millar et al. 2001, Lee et al. 2008), explain why an A. thaliana mMDH1 loss-of-function mutant exhibited a much higher decrease in total MDH activity than an mMDH2 loss-of-function mutant (Tomaz et al. 2010).
Kinetic parameters of A. thaliana recombinant mMDH1 and mMDH2 in the reductive direction of the reaction using oxaloacetate (OAA) or 2-ketoglutarate (2-KG) as substrates
| mMDH1 | mMDH2 | |||
|---|---|---|---|---|
| OAA | 2-KG | OAA | 2-KG | |
| Km (mM) | 0.27 ± 0.09 | 40.91 ± 3.77 | 1.02 ± 0.31 | 6.97 ± 2.98 |
| Kcat (s−1) | 788.6 ± 48.2 | 223.3 ± 41.4 | 166.7 ± 22.1 | 47.3 ± 6.7 |
| Kcat/Km (s−1 mM−1) | 2,921 | 5.5 | 163 | 6.8 |
| mMDH1 | mMDH2 | |||
|---|---|---|---|---|
| OAA | 2-KG | OAA | 2-KG | |
| Km (mM) | 0.27 ± 0.09 | 40.91 ± 3.77 | 1.02 ± 0.31 | 6.97 ± 2.98 |
| Kcat (s−1) | 788.6 ± 48.2 | 223.3 ± 41.4 | 166.7 ± 22.1 | 47.3 ± 6.7 |
| Kcat/Km (s−1 mM−1) | 2,921 | 5.5 | 163 | 6.8 |
Kinetic data were best fit by non-linear regression analysis.
The values represent the mean ± SE of three independent enzyme preparations.
When using 2-KG as substrate, mMDH2 presented normal hyperbolic saturation kinetics. In contrast to this, mMDH1 showed an ‘S-shaped’ sigmoidal curve indicating co-operative binding of 2-KG. We determined a Hill coefficient (n) of 0.26, which indicates negative co-operativity. Thus, the reduction of 2-KG by mMDH1 will not saturate until the concentration of 2-KG is very high. The kinetic constants of the reduction of 2-KG indicated that mMDH1 has a 4.7-fold higher overall catalytic rate (Kcat) than mMDH2 (Table 2). Both isoforms possess lower affinities for 2-KG than for OAA (Km of 40.9 and 6.97 mM for mMDH1 and mMDH2, respectively; Table 2). Although the Km values for 2-KG are rather high, mitochondrial concentrations of the TCA cycle intermediate 2-KG may enable both mMDHs to produce l-2HG in vivo. Moreover, these Km2-KG values are in the same range as KmMalate values measured for MDHs of different plant species (3–64 mM) (Appels and Haaker 1988).
The comparison of the specificity constants (Kcat/Km) of both mMDH isoforms acting on the alternative, competing substrates, OAA and 2-KG, indicates that both isoforms have a higher catalytic competence when using OAA as substrate than when using 2-KG (Table 2). This is very pronounced in the case of mMDH1, most probably due to the different catalytic mechanisms used by this isoform when acting on the alternative substrates (see above).
A. thaliana mMDH1 and mMDH2 convert 2-KG to l-2HG
As shown above, mMDH1 and mMDH2 can indeed use 2-KG as substrate. The maximal activity rates displayed by the A. thaliana mMDH isoforms were 1.6-fold higher (mMDH1) to 3-fold lower (mMDH2) than that of the mammalian (pig heart) enzyme, for which we determined an activity of 0.24 ± 0.03 mmol min−1 mg−1. To confirm that l-2HG (and not some other product) is produced in these reactions, we carried out an enzymatic assay using recombinant mMDH1 and mMDH2 in the presence of 2-KG and NADH with subsequent analysis of the reaction product by stable isotope dilution liquid chromatography–tandem mass spectrometry (LC-MS/MS). As shown in Table 3, both isoforms were able to produce l-2HG but not d-2HG. mMDH1 produced a 10-fold higher amount of l-2HG than mMDH2 under the conditions tested. These results confirm that A. thaliana mMDH1 and mMDH2 produce l-2HG by reduction of 2-KG in vitro.
mMDH1 and mMDH2 convert 2-KG to l-2HG in vitro
| l-2HG (µmol l−1) | d-2HG (µmol l−1) | |
|---|---|---|
| mMDH1 | 119.70 ± 0.03 | 1.80 ± 0.01 |
| mMDH2 | 16.60 ± 0.13 | 0.10 ± 0.05 |
| w/o protein | 0.60 ± 0.39 | 0.10 ± 0.07 |
| mMDH1 w/o substrate | ND | ND. |
| mMDH2 w/o substrate | ND | ND |
| l-2HG (µmol l−1) | d-2HG (µmol l−1) | |
|---|---|---|
| mMDH1 | 119.70 ± 0.03 | 1.80 ± 0.01 |
| mMDH2 | 16.60 ± 0.13 | 0.10 ± 0.05 |
| w/o protein | 0.60 ± 0.39 | 0.10 ± 0.07 |
| mMDH1 w/o substrate | ND | ND. |
| mMDH2 w/o substrate | ND | ND |
mMDH1 or mMDH2 (13 µg each) were incubated with 30 mM 2-KG and 0.8 mM NADH during 2 h at 30°C. Samples were analyzed by stable isotope dilution LC-MS/MS. Extracts without substrate and without protein served as controls.
Values represent the mean ± SE of three independent enzyme preparations.
ND, not detected.
Identification of A. thalianal-2HGDH
In previous work, we showed that l-2HG is present in plant tissues, indicating its involvement in plant metabolism (Engqvist et al. 2011). As we showed above that l-2HG is produced in a side reaction of A. thaliana mMDH, we hypothesized that A. thaliana should possess a metabolic repair enzyme similar to mammalian l-2HGDH. Performing a homology search for the human l-2HGDH (AAV52330; EC 1.1.99.2) using BLAST, we identified the gene At3g56840 in the A. thaliana genome as a candidate to encode a plant l-2HGDH (Engqvist et al. 2014). We could not amplify a full-length cDNA using the in silico predicted starting codon. Through sequence comparisons, we identified a start codon in At3g56840 at a similar position to that in the human l-2HGDH sequence (Fig. 2). Using this alternative start codon, we were able to amplify a full-length cDNA. After cloning and sequencing the cDNA obtained, we further found a sequence deletion compared with the in silico predicted sequence (Fig. 2). This sequence region predicted in silico for A. thaliana is also absent in the human l-2HGDH (Fig. 2). The experimentally obtained amino acid sequence of A. thalianal-2HGDH shows 27.5% identity to the human l-2HGDH in a pairwise alignment. Analogous to the human homolog, the plant protein contains a predicted mitochondrial targeting sequence (Schwacke et al. 2003) as well as a predicted oxidoreductase domain (Fig. 2).
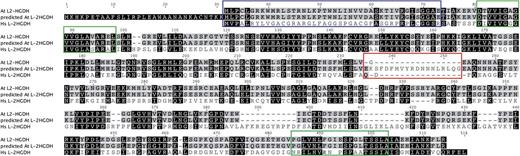
Amino acid sequence alignment of A. thalianal-2HGDH (At3g56840) and human l-2HGDH (HsL-2HGDH; AAV52330). The amino acid sequence of AtL-2HGDH was obtained by cloning of the cDNA. The predicted amino acid sequence of Arabidopsis l-2HGDH obtained from the TAIR database is included for comparison. The experimentally obtained sequence lacks amino acid residues 235 and 253 of the in silico predicted sequence (red box). The mitochondrial targeting sequence is highlightened in blue. Sequence similarities between the proteins are boxed in black, as is the N-terminal predicted sequence of the in silico predicted protein. Sequence similarities between the A. thaliana predicted l-2HGDH and our experimentally obtained sequence are boxed in gray. Putative oxidoreductase domains are boxed in green.
Enzymatic properties of recombinant A. thalianal-2HGDH
In order to determine the enzymatic properties of the identified l-2HGDH, the protein, without the predicted mitochondrial targeting sequence was cloned and expressed as a recombinant protein in E. coli. Analysis of the purified His-tagged fusion protein by SDS–PAGE indicated a single protein band of approximately 46 kDa (Fig. 3A). The purified protein was identified as a His-tagged fusion protein by immunoblot analysis using anti-His-tag antibodies (Fig. 3A). Moreover, the isolated protein showed in gel l-2HGDH activity using an artificial electron acceptor after native electrophoresis (Fig. 3B).
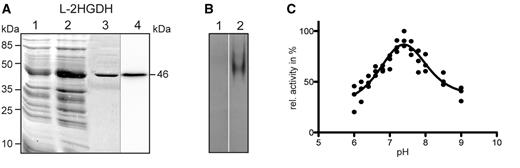
A. thaliana recombinant l-2HGDH analyzed by gel electrophoresis. Coomassie-stained SDS–PAGE and Western blot analysis of recombinant l-2HGDH (A). Lane 1, 10 µg of non-induced cell culture lysate. Lane 2, 10 µg of cell culture lysate after 4 h of induction with IPTG. Lane 3, 5 µg of purified recombinant protein. Lane 4, 1 µg of purified l-2HGDH protein analyzed by Western blot using anti-His antibodies. Molecular weight markers are indicated on the left. The molecular weight of the recombinant protein is indicated on the right. (B) In-gel activity assay of l-2HGDH after native PAGE using l-2HG as substrate (lane 2). Lane 1, assays of l-2HGDH activity without substrate. (C) Determination of the pH optimum of the recombinant l-2HGDH. The analysis was conducted with three independent enzyme preparations.
The enzymatic activity of the recombinant l-2HGDH was further characterized spectrophotometrically by following the reduction of different electron acceptor molecules. l-2HGDH was not active in the presence of NAD, NADP, Cyt c or O2, but it showed activity using the artificial electron acceptor 2,6-dichlorophenolindophenol (DCIP), which was used for further enzymatic characterization. l-2HGDH has a pH optimum of 7.4 (Fig. 3C), which corresponds to the pH of the mitochondrial matrix. l-2HGDH exhibited a catalytic rate of 0.52 ± 0.10 mmol min−1 mg−1 using l-2HG as substrate. l-2HGDH acts poorly on d-2HG, with a catalytic rate of only 3.7% of that with l-2HG. This underlines a high stereospecificity of l-2HGDH for the l-enantiomer of 2-HG, a property similar to human l-2HGDH (Rzem et al. 2004). Determination of the kinetic parameters of A. thalianal-2HGDH indicated a turnover rate (Kcat) of 613 s−1 and an affinity constant (KmL-2HG) of 0.24 ± 0.08 mM. This result shows that the affinity of the plant enzyme for l-2HG is in the same range as that of the mammalian homologs, which have affinity constants of 0.15–0.8 mM (Rzem et al. 2006). In contrast to this, the E. coli homolog, with a KmL-2HG of 0.095 mM, has a higher affinity for the substrate than the plant and mammalian homologs, but it has a very slow catalytic rate (Kcat = 0.08 s−1; Kalliri et al. 2008)). We further screened the substrate specificity of l-2HGDH using a number of related 2-hydroxy acids. No activity was detected using glycolate, l-lactate or d-lactate as substrates.
Mammalian and bacterial l-2HGDH uses FAD as a cofactor (Rzem et al. 2004). In line with this, we observed stimulation of the enzymatic activity of A. thalianal-2HGDH by adding FAD to the reaction medium. The addition of 2.5 mM FAD resulted in a 31% increase of the activity measured without FAD. These results indicate that the plant enzyme also uses FAD and that the recombinant enzyme may lose some FAD during purification.
Isolation of A. thaliana loss-of-function mutants of l-2HGDH
We next investigated whether the lack of l-2HGDH induces any effects in A. thaliana. Seeds of putative T-DNA insertion lines in l-2HGDH (SAIL_552_B09, l-2hgdh1; SAIL_331_B08, l-2hgdh2; and l-2hgdh3 SAIL_283_H04) were obtained from the Nottingham Arabidopsis Stock Centre (NASC). The lines l-2hgdh2 and l-2hgdh3 did not contain the predicted insertion, as only wild-type plants were identified by PCR. Homozygous plants of line SAIL_552_B09 (l-2hgdh1), containing a T-DNA insertion in the second intron (Fig. 4A), were isolated (Fig. 4B). These plants lacked the full-length transcript of l-2HGDH and were used for further analysis (Fig. 4C). Phenotypic analysis of homozygous mutants grown in solid medium or soil at different photoperiods and light intensities revealed no differences in growth or development in comparison with the wild type (Fig. 5A).
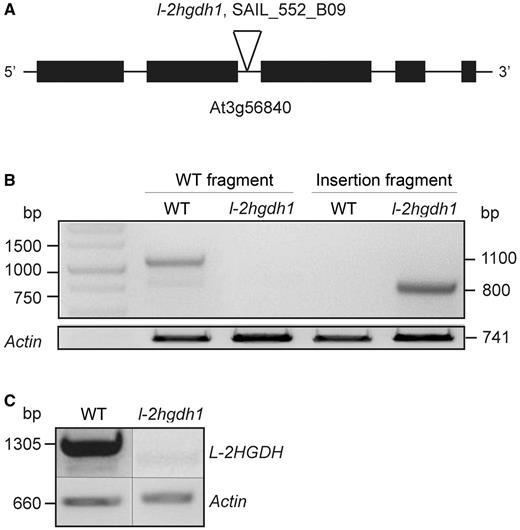
Analysis of the A. thaliana T-DNA insertion line SAIL_552_B09 (l-2hgdh1). (A) Intron/exon structure of At3g56840 (as experimentally obtained) showing the T-DNA insertion in the second intron. (B) Genotyping PCR of the wild type and l-2hgdh1. Lane 1, 1 kb DNA Ladder. Lanes 2 and 3, amplification of a wild-type fragment spanning the T-DNA insertion in the wild type and l-2hgdh1, respectively. Lanes 3 and 4, amplification of a T-DNA insertion fragment in the wild type and l-2hgdh1, respectively. The amplification of an actin fragment served as loading control. The correct size of the PCR products is indicated on the right. (C) Analysis of the full-length l-2HGDH transcript (1,305 bp) using wild-type and l-2hgdh1 cDNA. The amplification of an actin fragment (660 bp) served as a loading control.
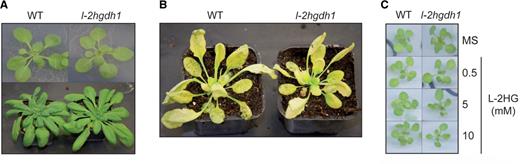
A. thaliana development is not affected by l-2HG. (A) Two-week-old wild-type (WT) and l-2hgdh1 plants grown under long-day conditions on half-strength solid MS medium (upper panel) and 4-week-old plants grown under long-day conditions in pots (lower panel). (B) Three-week-old plants grown under long-day conditions were transferred to complete darkness during 4 d. (D) Growth of the WT or l-2hgdh1 on half-strength MS solid media supplemented with 0.5, 5 and 10 mM l-2HG.
In order to analyze whether the lack of l-2HGDH in l-2hgdh1 can cause any defect under stress conditions, we exposed the plants to high light, salt and osmotic stress. In all cases, l-2hgdh1 showed the same phenotype as the wild type (not shown). We also analyzed the behavior of the plants during a long period of darkness. Again, l-2hgdh1 showed a similar progression of dark-induced senescence to the wild type (Fig. 5B).
Metabolic profiling of l-2HGDH loss-of-function mutants
While we did not observe any phenotypic differences between l-2hgdh1 mutants and wild-type plants, a metabolic footprint analysis by gas chromatography—mass spectrometry (GC-MS) of leaves of these plants indicated elevated relative amounts of 2HG in l-2hgdh1; the amounts of all other assayed metabolites were similar between both lines (Table 4). Since 2HG accumulates in l-2hgdh1 mutants in normal conditions of growth without affecting the development of the plants (Fig. 5A), we challenged l-2hghd1 and wild-type plants by growth on solid medium supplemented with different concentration of l-2HG. We observed no differential effects on the phenotype of both lines even with 10 mM l-2HG (Fig. 5C). As this lack of effects could be ascribed to a deficient uptake of the metabolite by the plants, we infiltrated adult leaves of l-2hghd1 and the wild type with a solution containing 50 mM l-2HG. Also in this case, no visible differences in plant health were observed between l-2hgdh1 and the wild type, even 1 week after infiltration (data not shown). To investigate if l-2HG may impact cellular homeostasis without inducing visible effects, we measured the Fv/Fm ratio as a quantification of cellular stress. The Fv/Fm ratio of leaves was constant across different time points and was identical between l-2hgdh1 and the wild type (Fv/Fm ∼0.85).
Relative metabolite levels in wild-type and l-2hgdh1 leaf material
| Compound | Wild type | l-2hgdh1 | Student’s t-test |
|---|---|---|---|
| α-Alanine | 1 ± 0.22 | 0.92 ± 0.28 | 0.669 |
| α-Ketoglutarate | 1 ± 0.36 | 0.65 ± 0.21 | 0.158 |
| Asparagine | 1 ± 0.44 | 1.07 ± 0.48 | 0.568 |
| Aspartic acid | 1 ± 0.10 | 1.31 ± 0.54 | 0.865 |
| β-Alanine | 1 ± 0.38 | 0.97 ± 1.00 | 0.959 |
| Citric acid | 1 ± 0.32 | 0.77 ± 0.33 | 0.348 |
| Cysteine | 1 ± 0.25 | 0.73 ± 0.21 | 0.141 |
| Fructose | 1 ± 0.33 | 0.71 ± 0.15 | 0.179 |
| Fumaric acid | 1 ± 0.17 | 1.26 ± 0.56 | 0.935 |
| GABA | 1 ± 0.64 | 0.47 ± 0.29 | 0.203 |
| Gluconic Acid | 1 ± 0.42 | 0.68 ± 0.14 | 0.222 |
| Glucose | 1 ± 0.36 | 1.10 ± 0.52 | 0.349 |
| Glutamic acid | 1 ± 0.22 | 1.25 ± 0.57 | 0.836 |
| Glyceric acid | 1 ± 0.87 | 0.29 ± 0.20 | 0.199 |
| Glycerol | 1 ± 0.16 | 0.75 ± 0.27 | 0.175 |
| Glycine | 1 ± 0.22 | 0.84 ± 0.67 | 0.677 |
| Glycolic acid | 1 ± 0.27 | 0.91 ± 0.22 | 0.633 |
| Hydroxyglutarate | 1 ± 0.35 | 2.21 ± 0.39 | 0.008** |
| Isoleucine | 1 ± 0.52 | 0.95 ± 0.14 | 0.867 |
| Lactate | 1 ± 0.28 | 0.72 ± 0.30 | 0.216 |
| Lactose | 1 ± 0.27 | 0.86 ± 0.47 | 0.636 |
| Leucine | 1 ± 0.54 | 0.92 ± 0.12 | 0.783 |
| Lysine | 1 ± 0.32 | 0.54 ± 0.40 | 0.127 |
| Maleic acid | 1 ± 0.29 | 1.11 ± 0.48 | 0.701 |
| Malic acid | 1 ± 0.23 | 1.16 ± 0.45 | 0.258 |
| Malonic acid | 1 ± 0.27 | 0.76 ± 0.24 | 0.234 |
| Maltose | 1 ± 0.41 | 0.73 ± 0.33 | 0.347 |
| Mannitol | 1 ± 0.26 | 0.77 ± 0.39 | 0.365 |
| Mannose | 1 ± 0.23 | 0.86 ± 0.06 | 0.310 |
| Methionine | 1 ± 0.30 | 0.88 ± 0.29 | 0.599 |
| Myoinositol | 1 ± 0.21 | 0.88 ± 0.56 | 0.707 |
| Ornithine | 1 ± 0.07 | 0.51 ± 0.39 | 0.084 |
| Phenylalanine | 1 ± 0.28 | 0.90 ± 0.20 | 0.588 |
| Proline | 1 ± 0.60 | 1.25 ± 0.36 | 0.514 |
| Raffinose | 1 ± 0.16 | 0.87 ± 0.60 | 0.688 |
| Serine | 1 ± 0.15 | 1.28 ± 0.43 | 0.625 |
| Shikimate | 1 ± 0.20 | 0.80 ± 0.21 | 0.215 |
| Sorbitol | 1 ± 0.59 | 0.77 ± 0.48 | 0.164 |
| Succinic acid | 1 ± 0.29 | 0.61 ± 0.18 | 0.075 |
| Sucrose | 1 ± 0.15 | 1.23 ± 0.36 | 0.161 |
| Threonine | 1 ± 0.26 | 0.95 ± 0.34 | 0.827 |
| Tryptophan | 1 ± 0.17 | 1.17 ± 0.56 | 0.593 |
| Valine | 1 ± 0.27 | 0.85 ± 0.20 | 0.400 |
| Xylose | 1 ± 0.51 | 0.59 ± 0.18 | 0.211 |
Soluble, polar metabolites were extracted and analyzed by GC-MS as described in the Materials and Methods. Peak areas were normalized to the corresponding fresh weights and an internal standard. After normalization, the peak areas were expressed relative to the average of the wild-type levels
n = 4 ± SD; **P-value < 0.01).
In summary, our results suggest a non-toxic effect of l-2HG on plant cells. This is a very surprising finding, as mutations in the gene encoding l-2HGDH in humans cause severe neurometabolic disorders due to high accumulation of l-2HG (Rzem et al. 2004). As the plant and mammalian l-2HGDH homologs exhibit very similar kinetic behaviors (see above), the differences in toxicity of l-2HG may be due to the existence of different cellular components targeted by l-2HG in mammals, or the presence of alternative pathways for l-2HG detoxification in plant cells.
The electron transfer protein transfers electrons from l-2HG to the respiratory chain
As l-2HGDH is not active in the presence of NAD, NADP, Cyt c or O2 as electron acceptors, but it is active in the presence of an artificial electron acceptor such as DCIP, we assume that in vivo the enzyme would donate electrons to the electron transport chain (ETC) through proteins other than Cyt c. The electron transfer protein (ETF) localized in the mitochondrial matrix accepts electrons from many soluble mitochondrial flavoprotein-containing dehydrogenases and transfers them to the ETF-ubiquinone oxidoreductase (ETFQO), which in turn donates electrons through ubiquinone to the ETC (Ruzicka and Beinert 1977, Rasmusson et al. 2008, Schertl and Braun 2014). Recent work showed that electrons from d-2HG are transported via the ETF–ETFQO complex to the ETC (Ishizaki et al. 2005, Araujo et al. 2010, Engqvist et al. 2011). In Arabidopsis, ETF is active as a heteromer of α- and β-subunits (the corresponding genes are At1g50940 and At5g43430, respectively). Thus, we hypothesized that if the ETF collects electrons from the l-2HGDH reaction in vivo, a loss-of-function mutant of this protein should accumulate l-2HG as well as d-2HG. Thus, we determined the amounts of l- and d-2HG in leaves of plants that carry a loss-of-function mutation in the ETF β-subunit (etfb-2) (Ishizaki et al. 2006). As shown in Table 5, l-2HG accumulates in l-2hgdh1 and etfb-2, whereas, as expected, d-2HG only accumulates in etfb-2. Conversely, we have previously shown that d-2HG accumulates when d-2HGDH—the enzyme that oxidizes d-2HG in A. thaliana—is non-functional, whereas l-2HG does not accumulate in that case (Engqvist et al. 2011). These results clearly indicate that ETF is an in vivo electron acceptor during the oxidation of l-2HG through the action of l-2HGDH as well as oxidation of d-2HG through d-2HGDH (Engqvist et al. 2011). It should be noted, however, that higher levels of l-2HG accumulate in the l-2hgdh1 mutant as compared with the etfb-2 mutant. This suggests that other electron acceptor(s) may be involved in l-2HG metabolism.
l-2HG accumulates in leaves of l-2hgdh1 and etfb-2
| l-2HG | d-2HG | |
|---|---|---|
| Col-0 | ND | 2.0 ± 0.6 |
| l-2hgdh1 | 27.0 ± 3.0 | 1.0 ± 0.2 |
| etfb-2 | 9.8 ± 4.0 | 174 ± 5.9 |
| l-2HG | d-2HG | |
|---|---|---|
| Col-0 | ND | 2.0 ± 0.6 |
| l-2hgdh1 | 27.0 ± 3.0 | 1.0 ± 0.2 |
| etfb-2 | 9.8 ± 4.0 | 174 ± 5.9 |
Concentrations of l- and d-2HG are given in pmol mg−1 FW.
The values represent the mean ± SE of three independent samples.
ND, not detected.
Tissue expression profiles
The transcript levels of mMDH1, mMDH2 and l-2HGDH were analyzed using published data of gene expression in A. thaliana (Schmid et al. 2005, Hruz et al. 2008).
The analysis indicated that l-2HGDH is expressed at moderate comparable levels in all plant organs (Supplementary Fig. S1) and developmental stages (Supplementary Fig. S2). In all analyzed samples, the expressed transcript has a signal intensity level between 1,000 and 4,000, with the only exception of three samples of embryo tissue, where a signal intensity of only approximately 470 was detected. The levels of transcription of l-2HGDH are comparable with those of mMDH2 in most organs of the plant (Supplementary Figs. S1, Supplementary Data). The transcription level of mMDH2 was higher than that of l-2HGDH only in root tissue and inflorescence. The transcription level of mMDH1 was higher compared with those of mMDH2 and l-2HGDH in all developmental stages and every tissue, except in pollen and stamen (Supplementary Figs. S1, Supplementary Data).
Transcript levels of all three enzymes respond significantly (P < 0.001) to a small fraction of the 646 applied biotic and abiotic stresses (Supplementary Fig. S3): mMDH1, responded to 53 (8%), mMDH2 responded to 46 (7%) and l-2HGDH responded to 27 (4%) of the stresses. While perturbations in light (quality, quantity and length) comprise one-third of the significant changes in the expression of mMDH1 and mMDH2, modification in the expression of l-2HGDH shows no clear pattern.
In summary, the analysis of the transcript levels revealed an almost constitutive low expression of l-2HGDH in all plant organs and tissues and during all developmental stages. In addition, in rapidly growing tissue (inflorescence, flower and shoot apex) and roots, the expression levels of mMDH1 and mMDH2 match that of l-2HGDH, providing an indication of the co-expression of the repair enzyme and the most probable generators of l-2HG in vivo.
Conclusion: a metabolic repair cycle involving mMDH and l-2HGDH is conserved in plant and mammalian mitochondria
We found that A. thaliana possesses a cyclic mitochondrial metabolic pathway involving mMDH and l-2HGDH similar to that known in mammals (Fig. 6). In this work we show the involvement of MDH1, MDH2, l-2HGDH and ETF in this repair system. However, we cannot rule out that other enzymes may additionally be involved in the formation and degradation of l-2HG in plants. The concordances in the repair systems between plants and mammals are extensive. In both, l-2HG is generated from 2-KG by a side reaction of mMDH. In both types of organisms, l-2HG is re-oxidized to 2-KG by a flavin-containing l-2HGDH enzyme, and the electrons are passed on to an ETF protein. Furthermore, mutations of l-2HGDH or ETF lead to the accumulation of l-2HG in both plants and mammals. The major difference lies in the physiological effect of l-2HG. In mammals, l-2HG accumulation is toxic and leads to severe detrimental effects in the form of a neurodegenerative disease known as l-2HG aciduria. In plants, no phenotypic changes were observed over a wide range of tested conditions.
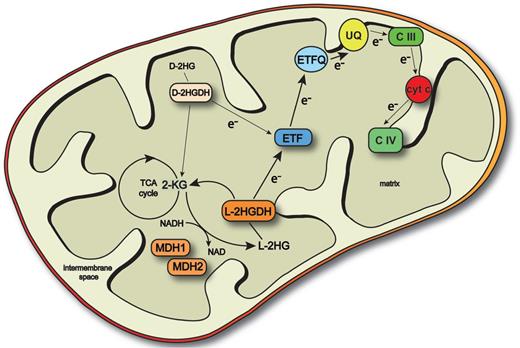
Scheme showing plant l-2HG metabolism. l-2HG is formed in a side reaction of mMDH1 and mMDH2 by reduction of 2KG. l-2HG is oxidized back to 2-KG by l-2HGDH. The electrons originated in the reactions are transferred to the ETC through the ETF–ETFQO system. 2-KG, 2-ketoglutarate; CIII, complex III; CIV, complex IV; e−, electron; ETF, electron transfer protein; ETFQO, ETF-ubiquinone oxidoreductase; TCA cycle, tricarboxylic acid cycle; UQ, ubiquinone.
Orthologs of l-2HGDH are found in all examined genomes of viridiplantae (Engqvist et al. 2014), indicating that this enzyme makes an essential contribution to fitness in the wild. Whether this fitness contribution is small and therefore easily overlooked in A. thaliana, or whether it is large but only present under certain conditions in this model plant, should be the subject of further studies.
Materials and Methods
Cloning of mature A. thaliana mMDH1, mMDH2 and l-2HGDH cDNA in an expression vector
To clone mMDH1 (At1g53240), mMDH2 (At3g15020) and l-2HGDH (At3g56840) cDNAs, specific primers were generated to amplify the cDNAs without the predicted mitochondrial targeting sequences. The cDNA started at amino acid residues 32, 30 and 42 of mMDH1, mMDH2 and l-2HGDH, respectively. Total RNA was isolated from 100 mg of leaves of 4-week-old plants using TRizol reagent (Life Technologies). A 1 µg aliquot of total RNA was reversed transcribed into first-strand cDNA using SuperScriptII reverse transcriptase (Life Technologies) and used for PCR amplification. The oligonucleotide primers used for amplification were as follow: MDH_At1g_CDS_FW (5′-GGATCCGAAAGTCGCCATCCTTGG-3′) and MDH_AT1g_CDS_RV (5′-GGATCCTCACTGGTTGGCAAACTTG-3′); MDH_At3g_CDS_FW (5′-GGATCCGCGCAAAGTCGTCATCCTC-3′) and MDH_At3g_CDS_RV (5′-GGATCCTCATTGGTTGGCAAATTTG-3′); and L2-HG_FW (5′-GGATCCGATAGCTAAAGAGAGAG-3′) and L-2HG_KO_RV (5′-GGATCCTCATCTCAAGAATTTG-3′). The cDNAs amplified were cloned into pCR-Blunt II-TOPO (Life Technologies). The inserts were cut out of the plasmid using BamHI and ligated into the dephosphorylated pET16b vector (Novagen). The generated plasmids were sequenced.
Heterologous expression of A. thaliana mMDH1, mMDH2 and l-2HGDH
All generated pET16b constructs were transformed into BL21 (DE3) cells (Life Techologies). Transformed cells were grown in LB medium at 37°C and agitation at 120 r.p.m. in the presence of 50 µg ml−1 carbenicillin until an OD600 of 0.6 was reached. To induce protein expression, 1 mM isopropyl-β-d-thiogalactopyranoside (IPTG) was added to the culture and cells were grown for an additional 3 h. Cells were harvested by centrifugation at 4,000 × g for 15 min, resuspended in 20 mM Tris–HCl (pH 8.0) containing 1 mg −1 ml phenylmethylsulfonyl fluoride (PMSF), sonicated and centrifuged at 10,000 × g for 10 min at 4°C to remove debris. The supernatant was used for protein purification using immobilized metal ion chromatography on Ni2+ nitriloacetic acid agarose (Ni2+-NTA agarose, Qiagen). The column was equilibrated with 20 mM Tris–HCl buffer containing 0.5 mg ml−1 PMSF.
To isolate l-2HGDH, the column was washed in three steps with 20 mM K2PO4 (pH 7.4) and 200 mM NaCl containing increasing concentrations of imidazole (10, 20 and 60 mM). l-2HGDH was eluted using four times 500 µl of 100 mM K2PO4 (pH 7.4), 150 mM NaCl and 500 mM imidazole. The eluted protein was desalted in 20 mM K2HPO4 (pH 7.4) and 20% glycerol using Sephadex G-25 columns (GE Healthcare) and immediately used for kinetic measurements.
To purify mMDH1 and mMDH2, two washing steps were performed using 20 mM Tris–HCl (pH 8.0), 300 mM NaCl and 20 or 60 mM imidazole, respectively. Elution was performed using 20 mM Tris–HCl (pH 8.0), 300 mM NaCl and 500 mM imidazole. The eluted proteins were desalted in 50 mM MOPS-NaOH (pH 7.4) and 20% glycerol.
Protein quantification and immunoblot analysis
Protein concentrations were determined according to the method of Bradford (1976). Fractions from the recombinant protein expression and purification assays were analyzed by denaturing SDS–PAGE using 12.5% (w/v) polyacrylamide gels according to Laemmli (1970). Proteins were visualized with Coomassie Blue or blotted onto polyvinylidene difluoride (PVDF) membranes for immunoblot analysis. After transfer, membranes were blocked with 3% milk powder and incubated with an antibody against the His epitope (1 : 7,500; Mylteni Biotec) with subsequent visualization on an LAS-4000 Mini bioimager (GE-Healthcare Life Sciences formerly Fuji).
In-gel enzymatic assays after native electrophoresis
Purified enzymes were analyzed on a non-denaturing 10% (w/v) polyacrylamide gel. The gels were assayed for the specific activities by incubation in 5 ml of reaction buffer in the dark at 30°C. The l-2HGDH reaction buffer contained 50 mM K2PO4 (pH 7.4), 5 mM l-2HG, 0.05% (w/v) nitro blue tetrazolium (NBT) and 10 µM phenazine methosulfate (PMS). The MDH reaction buffer contained 50 mM K2PO4 (pH 7.4), 5 mM malate, 0.2 mM NAD, 0.05% (w/v) NBT and 10 µM PMS.
Enzymatic activity
The activity of purified l-2HGDH (2–10 µg of protein) was analyzed over time in a reaction medium containing 25 mM K2HPO4 (pH 7.4), 5 mM FAD, 3 mM PMS and 200 µM 2,6- DCIP. l-2HG, s-2HG, glycolate, d-lactate and l-lactate (5 mM) were tested as possible substrates. The activities of purified mMDH1 and mMDH2 (0.5–1 µg of protein) were analyzed in a reaction medium containing 50 mM MOPS-NaOH (pH 7.4) and 10 mM MgCl2. Depending on the substrate tested, the assay contained: (i) 7 mM OAA and 0.2 mM NADH; (ii) different amount of 2-KG and 0.5 mM NADH; or (iii) 5 mM malate and 0.2 mM NAD. The reactions were started by the addition of the substrate, and the activities were measured in a Synergy HT Biotek® Plate Reader system at 25°C by recording the reduction of DCIP at 600 nm (ε, 22 cm−1 mM−1), or the reduction of NAD or the oxidation of NADH at 340 nm (ε, 6.2 cm−1 mM−1). Background activity without addition of the substrate was determined by monitoring the reaction mixture without substrate for at least 4 min and was subtracted from the activity measured with substrate.
The kinetic parameters of l-2HGDH, mMDH1 and mMDH2 were determined at pH 7.4. PMS, DCIP, NAD and NADH concentrations were kept constant while varying the concentration of the substrates. The kinetic constants were calculated with three different enzyme batches each containing at least triplicate determinations and adjusted to non-linear regression (Prism, Graph Pad).
The generation of l-2HG from 2-KG by mMDH1 and mMDH2 was determined in 400 µl using 13 µg of the recombinant protein. The reaction mixture contained 25 mM MOPS (pH 7.4), 10 mM MgCl2, 0.8 mM NADH and 30 mM 2-KG. The samples were incubated for 2 h at 30°C, frozen in liquid nitrogen and analyzed by LC-MS/MS.
Screening of T-DNA insertion lines and genotyping
Seeds of line SAIL_552_B09 (l-2hgdh1), SAIL_331_B08 (l-2hgdh2) and SAIL_283_H04 (l-2hgdh3), containing putative T-DNA insertions in l-2HGDH, were obtained from the NASCr. Genotyping of the lines was performed by two sets of PCRs using genomic DNA as template. The first PCR was performed using the primers L-2HGDH_FW1 (5′-GAGAATGGAGCCACAGCTTC-3′) and L-2HGDH_RV1 (5′-GGATCCTCATCTCAAGAATTTG-3′) in the case of l-2hgdh1; L-2HGDH_FW2 (5′-ATACCACGATTAGGCATTCCC-3′) and L-2HGDH_RV2 (5′-CTGTGGCTCCATTCTCATAGC-3′) in the case of l-2hgdh2; and L-2HGDH_FW3 (5′-TAAATGTTGGTCTTCCGACCC-3′) and L-2HGDH_RV3 (5′-CTGTGGCTCCATTCTCATAGC-3′) in the case of l-2hgdh3.
To identify the T-DNA insertions, the second PCR was carried out with the T-DNA left border primer SAIL-LB3 (5′-TAGCATCTGAATTTCATAACCAATCTCGATACAC-3′) and L-2HGDH_FW4 (5′-GGATCCGATAGCTAAAGAGAGAG-3′) in the case of l-2hgdh1; SAIL-LB3 and L-2HGDH_FW2 in the case of l-2hgdh2; and SAIL-LB3 and L-2HGDH_FW3 in the case of l-2hgdh3. Plants homozygous for the T-DNA insertion were only identified for the line l-2hgdh1. Lines l-2hgdh2 and l-2hgdh3 did not contain a T-DNA insertion, as only wild-type plants were identified. The transcript abundance of l-2HGDH was determined by isolation of total RNA from 100 mg of leaves using TRIzol reagent (Life Technologies). RNA was transcribed to cDNA using SuperScript II reverse transcriptase (Life Technologies). The expression of the full-length transcript of l-2HGDH was analyzed with the primers L2HGDH-cDNA-FW (5′-GGAGTCGTAGGTTTAGCGGT-3′) and L2HGDH-cDNA-RV (5′-GTTTTGGCCCGGAAAGCTTA-3′). As a control, the Actin2 gene was amplified using the primers Actin2-F (5′-TAACTCTCCCGCTATGTATGTCGC-3′) and Actin2-R (5′-CCACTGAGCACAATGTTACCGTAC-3′).
Plant growth and stress conditions
Arabidopsis thaliana wild type (Columbia-0) and the knock-out mutant l-2hgdh1 were grown in pots or alternatively on solid half-strength Murashige and Skoog (MS) medium in a growth cabinet in a 16/8 h light/dark cycle at 21°C and a photosynthetically active photon flux density of 100 µmol quanta m−2 s−1. For GC-MS analysis, whole rosettes were sampled after 2 weeks of growth in solid MS medium. For the determination of d- and l-2HG amounts by LC-MS/MS, whole plantlets of the wild type, l-2hgdh1 and etfb-2 (Ishizaki et al. 2006) grown on solid MS medium were harvested after 15 d. Growth of plants in the presence of 0, 0.5, 1, 5 or 10 mM l-2HG was conducted on solid half-strength MS medium. To expose the seedlings to salt and osmotic stress, plants were grown in solid half-strength MS medium in the presence of 150 mM sodium chloride or 300 mM mannitol, respectively. The same stress conditions were applied to adult plants after 25 d of growth in pots. In this case, the plants were watered every 4 d with increasing concentrations of sodium chloride or mannitol (50, 150 and 300 mM). Artificial senescence was induced in 25-day-old plants growing in pots by exposing plants to complete darkness.
Chl fluorescence measurements
Three-week-old wild-type and l-2hgdh1 plants were infiltrated with 0.2 ml of 50 mM l-2HG dissolved in water. Control plants were infiltrated with 0.2 ml of water. Fluorescence measurements were conducted on infiltrated and non-infiltrated plants using a FluorCam FC 800-C controlled by FluorCam 6 software (Photon Systems Instruments). Modulated weak red light was used to measure the basal fluorescence (F0) of rosettes of dark-adapted leaves (dark adaptation for 15 min). The maximal fluorescence in the dark-adapted state (Fm) and during illumination (Fm′) was measured after the induction with a saturating white light pulse (5,000 µmol m−2 s−2 for 0.8 s) to allow the calculation of Fv/Fm = (Fm – F0)/Fm.
LC-MS/MS determination of d- and l-2HG levels and metabolite profiling
The amounts of d- and l-2HG enantiomers were measured by stable isotope dilution LC-MS/MS after derivatization with diacetyl-l-tartaric anhydride as described before (Struys et al. 2004, Engqvist et al. 2011).
For metabolite measurement, 50 mg FW of 2-week-old whole rosette leaves were extracted and analyzed by GC-MS according to Fiehn (2007) using a 7200 GC-QTOF (Agilent Technologies). Peak integration was done using the Mass Hunter Software (Agilent Technologies). For relative quantification, all metabolite peak areas were normalized to the corresponding fresh weight used for extraction and the peak area of the internal standard ribitol that was added prior to extraction.
Analysis of the tissue expression profiles
The transcript levels of mMDH1, mMDH2 and l-2HGDH were analyzed using published data that are available in the Genevestigator database (Hruz et al. 2008). From the 10,629 samples available under the platform ATH1: Affymetrix Arabidopsis ATH1 Genome Array, we chose 3,943 samples, corresponding to the Col-0 background. Samples that had fewer than three replicates were excluded. The samples include 646 pertubations (e.g. biotic stress, temperature, light, chemicals, elicitors and hormones), 57 anatomical parts of A. thaliana and 10 developmental stages (ranging from germinated seed to bolting plants, from young flowers to desiccated seeds).
Supplementary data
Supplementary data are available at PCP online.
Funding
This work was supported by the Deutsche Forschungsgemeinschaft [FOR 1186, and EXC 1028 to V.G.M.].
Disclosures
The authors have no conflicts of interest to declare.
Abbreviations
- DCIP
2,6-dichlorophenolindophenol
- ETC
electron transport chain
- ETF
electron transfer protein
- ETFQO
ETF-ubiquinone oxidoreductase
- GC-MS
gas chromatography–mass spectrometry
- l-2HG
l-2-hydroxyglutarate
- l-2HGDH
l-2HG dehydrogenase
- 2-KG
2-ketoglutarate
- LC-MS/MS
liquid chromatography–tandem mass spectrometry
- MDH
malate dehydrogenase
- mMDH
mitochondrial malate dehydrogenase
- MS
Murashige and Skoog
- OAA
oxaloacetate
- PMS
phenazine methosulfate
References
Author notes
5These authors contributed equally to this work.
