


Abstract
The Rice Annotation Project Database (RAP-DB, http://rapdb.dna.affrc.go.jp/) has been providing a comprehensive set of gene annotations for the genome sequence of rice, Oryza sativa (japonica group) cv. Nipponbare. Since the first release in 2005, RAP-DB has been updated several times along with the genome assembly updates. Here, we present our newest RAP-DB based on the latest genome assembly, Os-Nipponbare-Reference-IRGSP-1.0 (IRGSP-1.0), which was released in 2011. We detected 37,869 loci by mapping transcript and protein sequences of 150 monocot species. To provide plant researchers with highly reliable and up to date rice gene annotations, we have been incorporating literature-based manually curated data, and 1,626 loci currently incorporate literature-based annotation data, including commonly used gene names or gene symbols. Transcriptional activities are shown at the nucleotide level by mapping RNA-Seq reads derived from 27 samples. We also mapped the Illumina reads of a Japanese leading japonica cultivar, Koshihikari, and a Chinese indica cultivar, Guangluai-4, to the genome and show alignments together with the single nucleotide polymorphisms (SNPs) and gene functional annotations through a newly developed browser, Short-Read Assembly Browser (S-RAB). We have developed two satellite databases, Plant Gene Family Database (PGFD) and Integrative Database of Cereal Gene Phylogeny (IDCGP), which display gene family and homologous gene relationships among diverse plant species. RAP-DB and the satellite databases offer simple and user-friendly web interfaces, enabling plant and genome researchers to access the data easily and facilitating a broad range of plant research topics.
Database contents
Updated genome assembly
Since the release of the International Rice Genome Sequencing Project (IRGSP) build 4 assembly (Tanaka et al. 2008), the rice genome assembly has been updated twice. The first update included seven new telomere or telomere-associated sequences, a revised sequence of the chromosome 5 centromere and the sequence filling of one physical gap on chromosome 11; the updated genome assembly was released as IRGSP build 5 at the end of 2008. The second update was performed as a joint collaboration of the Rice Annotation Project (RAP) and the Michigan State University Rice Genome Annotation Project (Ouyang et al. 2007); this latest genome assembly, Os-Nipponbare-Reference-IRGSP-1.0 (IRGSP-1.0), was released at the end of October 2011 (http://rapdb.dna.affrc.go.jp/ and http://rice.plantbiology.msu.edu/). In the second update, sequence errors were comprehensively corrected by making use of next-generation sequencing data. The observed error rate was 0.15 per 10,000 bp (Y. Kawahara et al. personal communication), which was approximately 10 times as accurate as the initial genome assembly (International Rice Genome Sequencing Project 2005); therefore, the annotation of this new assembly will be useful for precise comparative studies of rice cultivars.
Gene annotation
In our previous studies, the gene loci were primarily determined by mapping rice full-length cDNAs (FLcDNAs) to the genome sequence (Itoh et al. 2007, Tanaka et al. 2008). However, it was revealed that rice FLcDNAs covered only ∼25,000 loci, far less than the total number of predicted loci (Itoh et al. 2007, Tanaka et al. 2008). Therefore, we made use of transcript sequences of other Oryza and non-rice monocot species. In total, we downloaded 154,579 transcript sequences of 149 species from DDBJ release 84 (Kaminuma et al. 2010) and 16,807 wheat FLcDNAs from TriFLDB (Mochida et al. 2009). The 154,579 mRNA sequences contained 81,110 maize and 29,223 barley sequences (Jia et al. 2006, Alexandrov et al. 2009, Sato et al. 2009, Soderlund et al. 2009, Matsumoto et al. 2011). We also downloaded 6,700,357 expressed sequence tag (EST) sequences from DDBJ to evaluate the expression of ab initio predicted genes. In addition to the transcript sequences, we obtained 1,433,269 protein sequences deposited in the plant division of UniProt release 2011_06 (UniProt Consortium 2012) and RefSeq release 47 (Pruitt et al. 2012). In order to remove transposon-related genes from the annotation data set, we masked repetitive sequences in the transcript sequences using CENSOR (Kohany et al. 2006) with the MIPS Repeat Element Database (Spannagl et al. 2007) and the Plant Repeat Databases version 3 of Michigan State University (Ouyang and Buell 2004). Next we discarded the transcript sequences in which only <30 bp remained unmasked. After filtering out the repetitive sequences, loci were defined by a previously described method (Itoh et al. 2007); we mapped the rice FLcDNAs and other transcripts of Oryza species by combining BLASTN (Altschul et al. 1990) with ‘-evalue 0.01’ option and est2genome (Mott 1997) with ‘-gappenalty 8 -mismatch 6 -minscore 10’ options. Only hits with nucleotide identity of ≥95% and sequence coverage of ≥90% were selected. For the mRNAs of non-Oryza species, we employed the method described in Amano et al. (2010) in which est2genome was conducted with relatively relaxed criteria with ‘-gappenalty -1 -mismatch -1 -minscore -1’ options. The EST sequences were mapped using BLASTN with ‘-evalue 0.1’ option, and the protein sequences were mapped using Prosplign (http://www.ncbi.nlm.nih.gov/sutils/static/prosplign/prosplign.html). The ab initio gene prediction was conducted by combining the results of three programs, GeneMark.hmm (Lukashin and Borodovsky 1998), GeneZilla (Majoros et al. 2005) and GlimmerHMM (Majoros et al. 2004), using JIGSAW (Allen and Salzberg 2005). In total, we detected 37,869 representative loci with transcript evidence; of these, 35,679 were protein-coding loci, including 2,400 ab initio predicted genes with overlapping EST sequences (Table 1). In addition to the representative loci, we predicted 8,121 ab initio predicted genes without any transcript evidence. The exon–intron structures along the chromosomes are shown in the gene map view (Fig. 1).
Statistics of rice genes
| Loci with expression evidence | 37,869 |
| Protein-coding loci | 33,279 |
| Non-protein coding loci | 2,190 |
| Ab initio predictions with expression evidence | 2,400 |
| Alternative variants | 6,667 |
| Ab initio predictions without any expression evidence | 8,121 |
| Loci with expression evidence | 37,869 |
| Protein-coding loci | 33,279 |
| Non-protein coding loci | 2,190 |
| Ab initio predictions with expression evidence | 2,400 |
| Alternative variants | 6,667 |
| Ab initio predictions without any expression evidence | 8,121 |
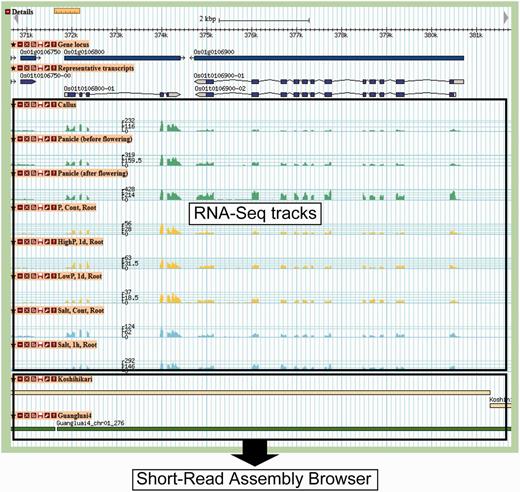
Gene map view. In RNA-Seq tracks, gene expression levels are shown as a histogram generated from the depth of mapped reads. At the bottom, two tracks, ‘Koshihikari’ and ‘Guangluai-4’, are linked to the Short-Read Assembly Browser.
In the latest annotation, we assigned transcript identifiers for each transcript to represent isoforms. On the basis of the gene nomenclature system for rice (McCouch and CGSNL 2008), the identifier was designated as ‘OsXXtXXXXXXX-XX’, which consists of the species name in two characters, two digits of a number for the chromosome, the type of identifier (‘t’ for a transcript), seven digits of a number for the transcript, a hyphen and two digits of a number for the isoform. Of the 24,596 loci supported by rice FLcDNAs, 5,243 contained two or more transcripts. For these loci, we determined the alternative variants as follows. First of all, overlapping FLcDNAs with identical exon–intron boundaries and ≤20 bp difference between their transcription start sites (Tanaka et al. 2009) were clustered. Then, for each cluster, an FLcDNA with the longest first exon was selected as an isoform. We assigned sequential isoform numbers starting with ‘-01’, which resulted into the detection of 6,667 alternative variants (Table 1). For the loci without rice FLcDNAs, if two or more transcripts were mapped, we selected one transcript with the longest protein-coding sequence as a representative structure and assigned an isoform number of ‘-00’. Detailed information of each transcript is shown in the gene details view (Fig. 2).
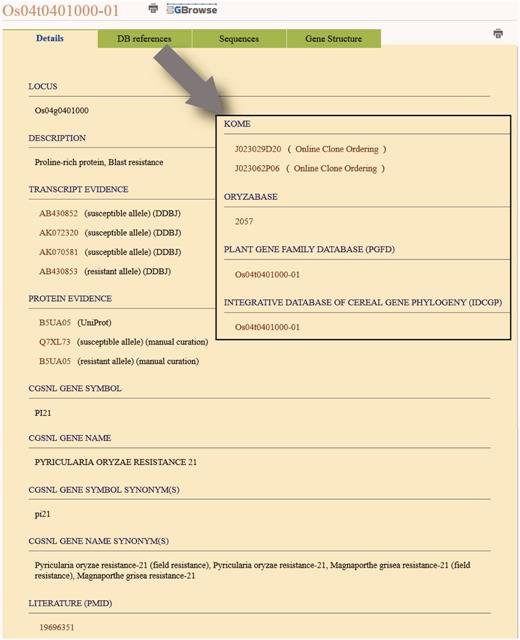
Gene details view. The ‘Details’ tab shows the detailed annotation information including the literature-based manual curation data. The ‘DB references’ tab provides hyperlinks to the external databases including the two satellite databases, Plant Gene Family Database and Integrative Database of Cereal Gene Phylogeny.
We detected 11 rDNA regions and 724 tRNA genes in the IRGSP-1.0 assembly. The rDNA regions were predicted by first mapping known rRNA sequences (DQ355266, M11585, M18170 and X00755) to the genome sequence using BLASTN. For 5S rRNA, any hits of ≥60 bp in length and a nucleotide identity of ≥80% were selected; for other rRNAs, any hits of ≥90% nucleotide identity were selected. The rRNAs in a proximal region were then manually merged into a single rDNA region. The tRNA genes were originally predicted for the IRGSP build 5 assembly in collaboration with the tRNADB-CE database group (Abe et al. 2009), and the locations were converted to the IRGSP-1.0 assembly. The coordinates of the microRNAs were downloaded from the miRBase database (version 19) (Kozomara and Griffiths-Jones 2011).
Simple sequence repeats (SSRs)
SSRs were initially predicted for the IRGSP build 5 assembly. We downloaded the list of known SSR markers from the GRAMENE database (Youens-Clark et al. 2011) and mapped primer sequences using e-PCR (Schuler 1997). SSRs were predicted by SSRIT with minimal repeat units of nine, six and five for di-, tri- and tetranucleotide repeats, respectively (Temnykh et al. 2001). For the SSRs listed in GRAMENE, we retained the SSR markers if the primer sequences were uniquely mapped to the genome and the predicted SSR had a sequence identical to the list, which resulted in 8,762 SSRs with ‘RM’ marker IDs (International Rice Genome Sequencing Project 2005). In addition, we detected 19,513 novel SSRs, and a total of 28,275 SSRs were assigned unique IDs using a format similar to the gene locus ID, i.e. ‘OsXXssrXXXXXXX’. To convert the positions of the SSRs to the IRGSP-1.0 assembly, we extracted the SSR and the flanking 100 bp sequence of both ends and mapped the sequences using BLASTN. As a result, we successfully converted 28,263 SSRs. In addition, we predicted 45 novel SSRs in the IRGSP-1.0 assembly by SSRIT.
Literature-based manual curation
Our initial annotation was based on computational analyses. Although a large number of known transcript and protein sequences enabled us to predict highly reliable gene structures, protein-coding sequences and gene functions, manual curation is of great importance for verifying the accuracy of the annotation and including additional up to date functional information based on experimental data. Therefore, we have been performing a literature-based manual curation that includes the extensive review of journal articles, correction of gene structures based on the experimentally validated transcript sequences, and updating of the annotation. The information derived from the manual curation includes the gene function, gene product, transcript and protein sequence IDs, literature IDs, and gene names and symbols that were determined by the Committee on Gene Symbolization, Nomenclature and Linkage (CGSNL) of the Rice Genetics Cooperative (McCouch and CGSNL 2008) (Fig. 2). In addition, we obtained the CGSNL-based annotation data from the Oryzabase database (Yamazaki et al. 2010) and included the data in RAP-DB. Currently, 1,626 loci have literature-based annotation data, including CGSNL gene names and symbols. Users can search for commonly used gene names or symbols, such as sd1 and pi21, through a Keyword Search and Advanced Keyword Search functions. Literature-based annotation data will be updated a few times a year.
Next-generation sequencing data
Currently, a large amount of genome and transcriptome sequences derived from next-generation sequencing technologies are publicly available, facilitating the precise comparison of genome sequences between cultivars and complementing the gene prediction by mapping the RNA-Seq reads to the genome. We developed a new browser, Short-Read Assembly Browser (S-RAB), to display the nucleotide alignments of the short-read sequences in addition to the gene annotation and single nucleotide polymorphisms (SNPs) (see details below and Fig. 3). Short-read genome sequences of the leading Japanese cultivar, O. sativa (japonica group) cv. Koshihikari, and a Chinese cultivar, O. sativa (indica group) cv. Guangluai-4, were downloaded from the DDBJ Sequence Read Archive (DRA) (http://trace.ddbj.nig.ac.jp/dra/index_e.shtml) (Yamamoto et al. 2010) and the EBI European Nucleotide Archive (ftp://ftp.era.ebi.ac.uk/) (Huang et al. 2010), respectively. We mapped the short-read sequences to the Nipponbare genome sequence by BWA (Li and Durbin 2009) with the default settings and retained only the uniquely mapped reads with ≥20 mapping quality. After mapping the reads, we conducted a local re-alignment around the indels using GATK (McKenna et al. 2010). For the paired-end reads of Guangluai-4, we discarded the putative PCR duplicates using Picard (http://picard.sourceforge.net). The overlapping reads on the genome were merged into contigs, and the coordinates are shown on the GBrowse.
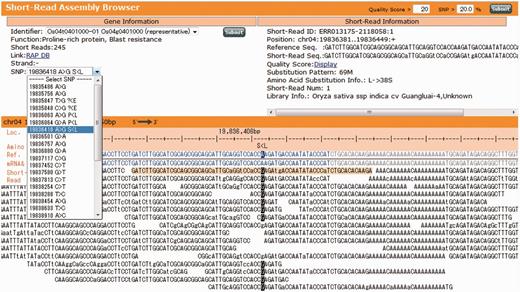
Short-Read Assembly Browser (S-RAB). The S-RAB window consists of (i) a Gene information view (upper left); (ii) an Alignment view (bottom); and (iii) a Short-read information view (upper right).
A large-scale gene expression study is a powerful tool to deepen the understanding of the gene functions of rice (Hamada et al. 2011, Obayashi et al. 2011, Sato et al. 2011). To illustrate the genome-wide gene expression profile derived from the next-generation sequencing technology, we incorporated 27 publicly available Illumina RNA-Seq data sets, which include seven tissues, 16 stress conditions and four normal conditions (Mizuno et al. 2010, Oono et al. 2011, Sakai et al. 2011). The seven tissues are callus, leaf, panicle before/after flowering, root, seed and shoot; the 16 stress conditions include salinity and high/low phosphate stress at several time points. For the stress and normal conditions, total RNAs were sampled from the roots and leaves (Mizuno et al. 2010, Oono et al. 2011). The RNA-Seq reads were mapped to the genome sequence using TopHat version 1.3.3 (Trapnell et al. 2009) with ‘-segment-length 20 -segment-mismatches 1 -min-intron-length 30 -max-intron 6000’ options. In addition, the known exon–intron junction information based on the gene annotation was added by ‘-GTF’ option. We quantified the expression level of each transcript by calculating the number of uniquely mapped reads per kilobase per million reads (RPKM) and found that 33,134 of the 37,869 loci (87.5%) were expressed with ≥1.0 RPKM in one or more condition or tissue. We detected expression for 2,609 of the 8,121 ab initio predicted loci without any transcriptional evidence (32.1%), which suggests that these loci are bona fide expressed genes in the rice genome. The expression level of each gene is shown at a single nucleotide resolution in the gene map view (Fig. 1).
Gene family
To provide researchers with the basic knowledge of how genes are conserved among plant species and how gene families evolve in each species, we constructed gene family data from rice and two other fully sequenced monocot species, Sorghum bicolor and Zea mays, and a dicot species, Arabidopsis thaliana. Users can access the data by following a link from the details view window of each transcript or by directly visiting the satellite database Plant Gene Family Database (PGF-DB) (http://green.dna.affrc.go.jp/PGF-DB/). The protein sequences of S. bicolor, Z. mays and A. thaliana were obtained from Phytozome (Goodstein et al. 2012), MaizeSequence (http://www.maizesequence.org/index.html) and TAIR (Lamesch et al. 2012), respectively. First, we clustered the families of homologous genes using the Markov clustering (MCL) program with an option of -l 1.4 (http://micans.org/mcl/). The resulting clusters were then further subclustered using a complete linkage method based on a BLASTP search with the options of ‘-e 0.01 -a 4 -v 3000 -b 3000’. The gene family names were determined based on their functional domains, as predicted by InterProScan (e.g., Putative C-5 cytosine-specific DNA methylase, IPR001525); as a result, we detected 9,975 gene families.
Phylogenetic analysis of plant genes
For each gene family, we performed a BLASTP search against the UniProt and RefSeq protein databases by querying the protein sequences in the gene family to collect homologous sequences comprehensively among the plant species. Users can view the phylogenetic trees constructed through the multiple alignment of the homologous sequences by following a link from the details view window of each transcript or by directly visiting the satellite database, Integrative Database of Cereal Gene Phylogeny (IDCGP) (http://rap.dna.affrc.go.jp/IDCGP/topSearch.do) (Fig. 4). In the BLASTP searches, any hits with amino acid identity and sequence coverage of ≥50% were retained. After removing the sequence redundancy, we created a multiple alignment using ClustalW (Larkin et al. 2007) and reconstructed the phylogenetic tree using the Neighbor–Joining method (Saitou and Nei 1987) with ‘-bootstrap=1000 -seed=1 -kimura -tossgaps’ options of ClustalW. The trees were rooted by the mid-point rooting method using our custom-made program. Phylogenetic trees with ≥100 sequences were discarded, resulting in 6,126 trees containing 11,927 RAP-annotated transcripts.
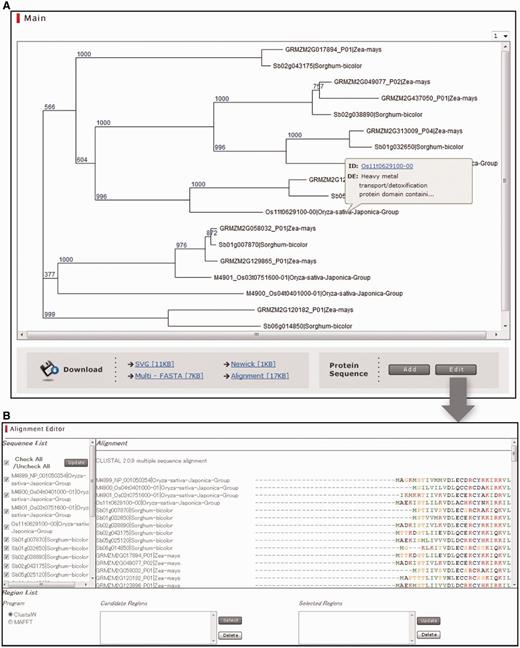
Integrative Database of Cereal Gene Phylogeny (IDCGP). (A) Main window of IDCGP showing the phylogenetic trees, hyperlinks to the downloadable data and buttons for adding sequences and editing multiple sequence alignments. (B) A window for editing multiple sequence alignments.
Experimental verification of O. rufipogon-specific genes
Comparative genome analysis of a wide variety of Oryza species is expected to be more beneficial than analysis of a single species. Therefore, the current version of RAP-DB contains some data of closely related wild rice. A previous study suggested that the genome of cultivated rice had lost a significant number of genes during domestication, whereas such lost genes were preserved in wild rice species (Sakai and Itoh 2010). In an attempt to explore wild rice-specific genes, we mapped 2,044 publicly available FLcDNAs of O. rufipogon (Lu et al. 2008) to the Nipponbare genome and found that 87 FLcDNAs could not be mapped. Based on the 87 FLcDNA sequences, we could design 64 primer pairs for verification by PCR analysis. Its result showed that 24 primer sets successfully amplified DNA fragments; 15 of them were confirmed to be specific to O. rufipogon, as they were not amplified using Nipponbare genomic DNA (Supplementary data). These O. rufipogon-specific genes are possibly related to features lost in today’s cultivated rice, such as stress tolerance (Supplementary data). Hence, we expect that this information will be useful for breeding in the future. The list of the unmapped FLcDNAs are available in RAP-DB.
Method for the database construction
RAP-DB, S-RAB, PGFD and IDCGP are implemented on Linux servers using the Apache web server. The gene structures and annotations are shown on GBrowse version 2.49, and the detailed annotations of the transcripts are shown on the original web page generated by a customized cgi program and modified from the original version implemented in GBrowse.
How to access the database contents
Gene map view and gene details view
The gene map view is based on GBrowse (Fig. 1). The gene details view (Fig. 2) consists of four tabs: Details, basic information including the CGSNL-based gene names and symbols; DB references, additional information and hyperlinks to the external and satellite databases; Sequences, transcript sequences, protein-coding sequences (CDSs) and protein sequences; and Gene structure, positions and sequences of each feature including untranslated regions (UTRs) and CDSs (Fig. 2).
Homology search
RAP-DB offers a homology search function in two ways: BLAST and BLAT (Kent 2002). Users can query sequences by directly pasting the sequences in the text box or by uploading a file in FASTA format. For BLAST searches, users can choose a DNA or protein database and an appropriate search program, e.g. blastn or blastp. We currently offer 11 DNA databases, including whole-genome sequence, CDSs with UTRs and/or introns, and 1,000, 2,000 or 3,000 bp of sequence upstream or downstream from genes. Options for filtering low-complexity sequences and avoiding lower case sequences when searching for initial exact matches and limiting the number of outputs are available as advanced options. The BLAT search is conducted with the default setting, and we are using the client/server version of BLAT for rapid searching. In cases of searching DNA sequences against the genome sequence, hyperlinks to GBrowse are provided in the result page so that users can visually check where and how the query sequences match to the genome. This function is quite useful, particularly when searching transcript sequences.
Batch retrieval
The batch retrieval tool enables users to retrieve sequences or annotation data of specific IDs or chromosomal region. In addition, by specifying any two SSR markers, users can obtain the data between them, which would be helpful, for example, to search for candidate genes of the target region detected by quantitative trait locus (QTL) analysis (Konishi et al. 2006, Fukuoka et al. 2009). The retrieved data are shown directly in the window or can be downloaded in FASTA, tab-delimited or Microsoft Excel format file.
Short-Read Assembly Browser (S-RAB)
S-RAB is linked to GBrowse. If users click on a contig of Guangluai-4 or Koshihikari on GBrowse, an S-RAB window appears (Fig. 3). The S-RAB window consists of three sections: (i) Gene information view (upper left); (ii) Alignment view (bottom); and (iii) Short-read information view (upper right). The gene information view shows the detailed annotation information of the gene overlapping with the contig selected by the user. The information includes the functional annotation, number of mapped short reads, gene orientation and pull-down list of the SNPs. Users can refer to more detailed information by following the link to return to RAP-DB. Each row in the SNP list represents the position of the SNP, nucleotide change and amino acid change, if available, from the left. Users can view the detailed alignment of an SNP and the surrounding region in the alignment view by selecting one of the SNPs in the list. In the alignment information view, the Nipponbare reference sequence is shown on the top and is represented by four colors: red, UTRs; blue, CDSs; gray, introns; and black, intergenic regions. The color pattern is based on the transcript selected in the gene information view and can be changed if more than one alternative variant is available. Transcripts other than the selected one are shown below the reference sequence with the same color pattern. The SNPs are highlighted in the alignments, and amino acid changes are shown above the reference sequence, e.g. ‘L>S’. The alignment view does not show the reverse complement sequence, even if the selected gene resides on the reverse strand. Therefore, in such cases, the amino acid changes are represented in reverse orientation, i.e. ‘S<L’. The SNPs are predicted simply based on the frequency of the variants with quality value of above the threshold. Initial settings are quality score of ≥20 and allele frequency of ≥20%, which can be changed in the upper right portion of the S-RAB window. The short-read information view shows the detailed information of the read selected in the alignment view.
Plant Gene Family Database (PGFD)
PGFD displays lists of gene family and subfamilies. The gene family window shows a list of the subfamilies contained in the gene family, and the subfamily window shows a list of the genes contained in the subfamily. Each gene in a subfamily window has a hyperlink to its source database, i.e. RAP-DB, Phytozome, MaizeSequence or TAIR, so that users can refer to the detailed information of the genes. Users can search for particular gene families through a keyword search function. The entire data can be downloaded in the tab-delimited text format file.
Interactive Database of Cereal Gene Phylogeny (IDCGP)
IDCGP displays phylogenetic trees and also enables users to add, delete or edit sequences or alignments through a GUI-based interface on their web browser (Fig. 4). The phylogenetic trees are stored in scalable vector graphics (SVG) format and are displayed in the main window. A pop-up window appears when placing the mouse over a sequence ID and offers a short description of the sequence and the hyperlink to the source database. Users can add their own protein sequences by pasting or uploading the protein sequences in FASTA format. New multiple alignments can be created using either ClustalW or MAFFT (Katoh et al. 2002). The new phylogenetic tree is added to the pull-down menu shown in the upper right of the tree so that the users can refer back to the initial tree. Users can add new sequences up to 30 times, and the resulting phylogenetic trees are assigned sequential numbers and stored in the pull-down menu. The Alignment Editor window consists of three panels: (i) Sequence List panel; (ii) Alignment panel; and (iii) Region List panel. The Sequence List panel shows the list of sequences contained in the phylogenetic tree, and the Alignment panel shows the actual multiple alignment. In cases in which users find any undesirable sequences in the alignment, the user can discard the sequences by unchecking them in the Sequence List panel. Alignment editing is accomplished by first selecting a particular region in an alignment and then performing a multiple alignment using the amino acid sequences in the selected regions. The target regions can be selected by specifying the start and end positions by placing the mouse over the alignment. Users can specify two or more regions so that multiple regions can be concatenated in reconstructing the new tree. As in the case of adding sequences, new alignments are created using either ClustalW or MAFFT, and the new trees are stored in the pull-down menu in the main window. The main window offers hyperlinks to four types of downloadable data: phylogenetic trees in SVG and Newick formats, protein sequences in multi-FASTA format and multiple sequence alignment in Clustal format.
Maintenance of legacy assemblies
Since some external databases such as RiceXPro (Sato et al. 2011) and KEGG (Kanehisa et al. 2012) were based on the older versions of RAP-DB, we decided to maintain the previous version of RAP-DB based on the IRGSP build 5 assembly at http://rapdblegacy.dna.affrc.go.jp/ where we also provide GBrowse service for IRGSP build 4 and downloadable data for IRGSP build 3 and 4.
Conclusion
With the recent advances in sequencing technology, an unprecedented scale of genomic research, such as genome-wide association studies (GWASs), has been conducted in the rice research area (Huang et al. 2010, Huang et al. 2012a, Huang et al. 2012b). One of the most important tasks of a GWAS is to determine the genetic consequences underlying the phenotypes of interest by analyzing hundreds of thousands of individuals sampled from multiple populations. To achieve such a task, accurate and reliable reference genome sequences and gene annotations are essential, and RAP-DB offers a highly reliable gene annotation based on the latest and most accurate genome assembly to date. In addition, by incorporating literature-based curation data, we will continue to provide up to date gene annotations. Since the completion of the rice genome sequencing in 2004 (International Rice Genome Sequencing Project 2005), genomes and transcriptomes of a number of plant species including primary cereal crops such as maize and barley have been sequenced and deposited in the public databases (for a review, see Mochida and Shinozaki 2010). With the increasing amount of genome and gene sequences, crucial issues are how to compile such data into a database and how to show the data to researchers with well-designed interfaces. To tackle such issues, we developed a new browser, S-RAB, to display the precise alignment of short-read sequences derived from next-generation sequencing technologies. In addition, we developed two satellite databases, PGFD and IDCGP, to exploit the relationships of homologous genes among diverse plant species. In particular, IDCGP exhibits phylogenetic trees and also provides users with an interactive interface to edit multiple sequence alignments and phylogenetic trees. Thus, by integrating all the data and databases into RAP-DB, users can search and retrieve data of interest on demand. RAP-DB will continue to serve as an integrative and interactive database for plant researchers working on a broad range of research subjects.
Funding
This work was supported by the Ministry of Agriculture, Forestry and Fisheries (MAFF) of Japan [Genomics for Agricultural Innovation (GIR1001)].
Acknowledgments
We would like to express our utmost gratitude to all of the members of the Rice Annotation Project (RAP). We also thank Yukiko Yamazaki of the National Institute of Genetics for the valuable discussion on the literature-based manual curation.
Abbreviations
- CDS
coding sequence
- CGSNL
Committee on Gene Symbolization, Nomenclature and Linkage
- EST
expressed sequence tag
- FLcDNA
full-length cDNA
- IRGSP
International Rice Genome Sequencing Project
- MCL
Markov clustering
- QTL
quantitative trait locus
- RAP
Rice Annotation Project
- RPKM
reads per kilobase per million reads
- S-RAB
Short-Read Assembly Browser
- SNP
single nucleotide polymorphism
- SSR
simple sequence repeat
- SVG
Scalable Vector Graphics
- UTR
untranslated region.
