-
PDF
- Split View
-
Views
-
Cite
Cite
Jennifer Schweer, Simon Geimer, Jörg Meurer, Gerhard Link, Arabidopsis Mutants Carrying Chimeric Sigma Factor Genes Reveal Regulatory Determinants for Plastid Gene Expression, Plant and Cell Physiology, Volume 50, Issue 7, July 2009, Pages 1382–1386, https://doi.org/10.1093/pcp/pcp069
Close - Share Icon Share
Abstract
Like bacteria, plastids contain sigma factors for promoter binding and transcription initiation. Accumulating evidence suggests that members of the plant sigma factor family can have specialized non-redundant roles in terms of promoter preference in various developmental and environmental situations. To specify regulatory determinants, we have chosen pairwise exchange of portions of Arabidopsis sigma coding regions, followed by transformation of the chimeric constructs into a sigma 6 knockout line. The resulting phenotypes and plastid RNA patterns point to an important though not exclusive role for the highly variable N-terminal portion of plant sigma proteins.
The key role of chloroplasts in plant cellular metabolism is reflected by the complexity of the gene expression machinery inside these organelles (Sugita and Sugiura 1996, Shiina et al. 2005, Toyoshima et al. 2005). Two different RNA polymerases, nucleus-encoded polymerase (NEP) and plastid-encoded polymerase (PEP), are involved in chloroplast transcription (Hedtke et al. 1997, Maliga 1998). NEP promoters are defined by GAA/YRTA motifs, PEP recognizes DNA elements that conform to the –35/–10 consensus sequences of bacterial promoters (Liere and Maliga 2001). PEP is composed of a prokaryotic core that interacts with regulatory sigma factor(s) to form the transcription-competent holoenzyme. Whereas the core subunits are products of chloroplast genes in most plants, plastid sigma factors are nucleus encoded (Liu and Troxler 1996, Tanaka et al. 1996).
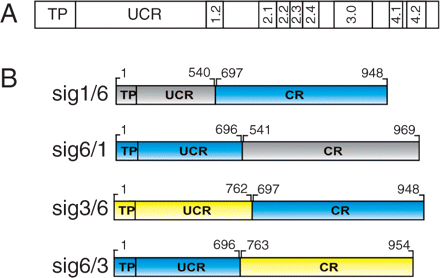
Arabidopsis thaliana contains six sigma genes, AtSig1–AtSig6 (Isono et al. 1997, Tanaka et al. 1997, Fujiwara et al. 2000, Hakimi et al. 2000, Privat et al. 2003). The derived proteins SIG1–SIG6 have a conserved C-terminal region (CR) containing the subregions 1.2–4.2 for basic sigma functions but lacking subregion 1.1 (Gruber and Gross 2003). Instead, they each contain a long N-terminal region (unconserved region; UCR) with low sequence conservation and unknown function. Mutational function studies have been applied to the CR (e.g. Hakimi et al. 2000) but not yet to the UCR. Here we have constructed cDNA clones that represent various UCR/CR combinations of chimeric sigma factors plus a transit peptide for plastid targeting (Fig. 1). These cDNAs were then introduced into an Arabidopsis sigma 6 knockout line, sig6-2 (Loschelder et al. 2006), obtained from the GABI-Kat (German Plant Genomics Program ‘Genome Analysis in Biological Systems-Knockout Arabidopsis thaliana’) collection (Rosso et al. 2003). Our results suggest a predominant, though not exclusive, role for the UCR in determining the visual and molecular phenotype.

Architecture of plant sigma factors and chimeric constructs. (A) Scheme showing the principal regions: transit peptide (TP) of the precursor and the UCR (left) and CR with subregions 1.2–4.2 (right) of the mature protein. (B) Chimeric sigma factors derived from Sig1 (At1g64860, gray), Sig3 (At3g53920, yellow) and Sig6 (At2g36990, blue) cDNAs. Fused sequences code for the TP and UCR of one factor and for the CR of another. Numbers correspond to sequence positions within database entries. Constructs were used to retransform the sig6-2 knockout line.
Table 1 presents a pairwise sequence comparison of all six Arabidopsis factors, showing weaker homology within the UCR as compared with the CR. The actual values (percentage sequence homology for UCR/CR) vary considerably between the two extremes defined by the pairs SIG1/SIG4 (2/33) and SIG2/SIG4 (16/25). The pairs that were chosen, SIG1/SIG6 (11/27) as well as SIG3/SIG6 (12/26) (shown in bold in Table 1), have intermediate values and thus might result in chimeric sigma lines with a detectable but not too strong (lethal) phenotype (Fig. 1B).
| Sigma factor pair . | . | UCR . | CR . | FL . |
|---|---|---|---|---|
| SIG1 | SIG2 | 13 | 33 | 25 |
| SIG1 | SIG3 | 4 | 20 | 12 |
| SIG1 | SIG4 | 2 | 33 | 26 |
| SIG1 | SIG5 | 5 | 27 | 19 |
| SIG1 | SIG6 | 11 | 27 | 21 |
| SIG2 | SIG3 | 9 | 34 | 24 |
| SIG2 | SIG4 | 16 | 25 | 29 |
| SIG2 | SIG5 | 7 | 30 | 21 |
| SIG2 | SIG6 | 14 | 38 | 28 |
| SIG3 | SIG4 | 5 | 27 | 23 |
| SIG3 | SIG5 | 6 | 20 | 15 |
| SIG3 | SIG6 | 12 | 26 | 21 |
| SIG4 | SIG5 | 11 | 25 | 21 |
| SIG4 | SIG6 | 18 | 32 | 28 |
| SIG5 | SIG6 | 5 | 29 | 22 |
Protein sequences were compared with ClustalW2. Alignments were carried out with either the conserved (CR) or unconserved region (UCR) alone, or with the full-length sigma factor (FL).
| Sigma factor pair . | . | UCR . | CR . | FL . |
|---|---|---|---|---|
| SIG1 | SIG2 | 13 | 33 | 25 |
| SIG1 | SIG3 | 4 | 20 | 12 |
| SIG1 | SIG4 | 2 | 33 | 26 |
| SIG1 | SIG5 | 5 | 27 | 19 |
| SIG1 | SIG6 | 11 | 27 | 21 |
| SIG2 | SIG3 | 9 | 34 | 24 |
| SIG2 | SIG4 | 16 | 25 | 29 |
| SIG2 | SIG5 | 7 | 30 | 21 |
| SIG2 | SIG6 | 14 | 38 | 28 |
| SIG3 | SIG4 | 5 | 27 | 23 |
| SIG3 | SIG5 | 6 | 20 | 15 |
| SIG3 | SIG6 | 12 | 26 | 21 |
| SIG4 | SIG5 | 11 | 25 | 21 |
| SIG4 | SIG6 | 18 | 32 | 28 |
| SIG5 | SIG6 | 5 | 29 | 22 |
Protein sequences were compared with ClustalW2. Alignments were carried out with either the conserved (CR) or unconserved region (UCR) alone, or with the full-length sigma factor (FL).
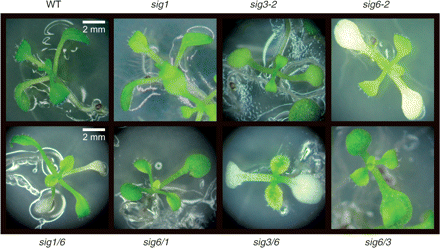
As shown in Fig. 2 (top row), sig6-2 seedlings reveal a strong chlorophyll-deficient phenotype, while sig1 and sig3-2 do not. Among the retransformed chimeric lines (bottom row), a chlorophyll-deficient phenotype is revealed by sig1/6 and sig3/6 but not by sig6/1 and sig6/3, suggesting that the UCR might be crucial for the observed phenotype.

Phenotype (10 d) of the wild type, sig6-2, sig1, sig3-2 and chimeric sigma lines: sig6/1 and sig6/3 resemble the wild type (green cotyledons), while sig1/6 and sig3/6 resemble the parental sig6-2 knockout (white).
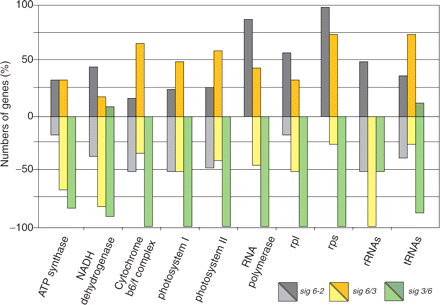
We next examined plastid transcript levels using macroarrays with RNA from the parental sig6-2 line as well as from sig3/6 and sig6/3. A summary view, based on percentage of up- versus down-regulated transcript levels in each functional gene group, is given in Fig. 3 and a more detailed picture in Supplementary Fig. S1, showing plastid transcript levels from single genes. All analyzed genes with their average fold expression changes, SD and P-values are listed in Supplementary Table S2.

Overview of plastid transcript levels in sig6-2 and the chimeric sigma lines sig6/3 and sig3/6 (color-coded bars). The percentage of up- and down-regulated plastid genes (compared with the WT) within each functional class indicated at the bottom is given (percentage scale on the left).
Compared with the wild type (WT), the array data for sig6-2 (Fig. 3 and Supplementary Fig. S2) indicate enhanced transcript levels of genes for ribosomal proteins, PEP core subunits, atpH and ndhG, some PSI and PSII genes (psaC, psbI and psbJ) and several tRNA genes (trnE, trnF and trnL). The majority of functionally grouped sets of plastid genes, however, revealed a ‘mixed’ pattern of up- or down-regulation among their individual members. This overall picture is comparable with that previously reported for a different sigma 6 knockout line, termed sig6-1 (Ishizaki et al. 2005).
The summary data (Fig. 3) for the chimeric sigma line sig6/3 indicate that, on a global scale, the plastid transcript pattern shares reasonable similarity with that of sig6-2. At higher resolution (Supplementary Fig. S1 and Table S2), however, expression details distinct from those of the parental line become more evident, e.g. for ribosomal protein and ndh transcripts, rRNAs and, in particular, several tRNAs, which are present at 5–10 times higher levels in sig6/3. One of them, tRNAGlu, is a known multifunctional molecule with roles in both gene expression and chlorophyll formation (Hanaoka et al. 2005). We note that the enhanced tRNA levels correlate with the green sig6/3 phenotype as compared with the white cotyledons of the sig6 knockout (Fig. 2).
Sig3/6, the line containing the converse chimeric construct, reveals a global negative effect on plastid gene expression compared with the parental knockout (Fig. 3). The more detailed view (Supplementary Fig. S1) shows that ndhG and trnE, i.e. the most enhanced RNA species in sig6-2, are still present at higher levels in sig3/6 compared with the WT. All other transcripts are strongly down-regulated below WT levels, regardless of whether they were up- or down-regulated in the sig6-2 knockout.
The strong negative effect on plastid gene expression in sig3/6 cannot be inferred from the transcript patterns in sig6 mutants (Ishizaki et al. 2005, this work). Likewise, it does not reflect that of a sigma 3 knockout, which (with the exception of psbN) was shown to be largely unaffected compared with the WT (Zghidi et al. 2007). Taken together, sig3/6 has a plastid transcript pattern indicative of a global negative effect on plastid transcription, probably as a severe consequence of imbalances among the other members of the sigma family.
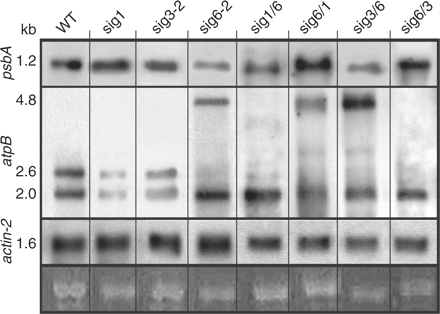
To complement the global array data, Northern blot hybridizations were carried out for two regions of Arabidopsis chloroplast DNA containing the psbA and atpB genes, respectively (Fig. 4). The psbA probe (top panel) detects the monocistronic 1.2 kb transcript synthesized under the control of the single PEP promoter (Liere et al. 1995). Using RNA samples from 5-day-old seedlings, the sig1 and sig3-2 knockouts contain WT levels of psbA transcript, whereas sig6-2 has reduced amounts at this time point (Loschelder et al. 2006). Of the retransformed chimeric lines, sig6/1 and sig6/3 have WT transcript levels. In contrast, sig1/6 and sig3/6 each show reduced levels, thus resembling the parental sigma 6 knockout.

Northern blot analysis of plastid transcripts in the wild type, sigma knockouts and chimeric lines. Total RNA (1 μg) was hybridized with digoxigenin-labeled RNA probes for the psbA, atpB and actin-2 genes. Left margin: transcript size (kb) determined by RNA markers (Promega). Bottom: portions of the stained gel at the position of 25S rRNA as loading control.
The atpB probe (Fig. 4, second panel) detects three different transcripts. Only one of them (2.6 kb) originates from a PEP promoter, while those at 2.0 and 4.8 kb have been assigned to NEP transcription (Schweer et al. 2006, Swiatecka-Hagenbruch et al. 2007). Whereas all lines show the 2.0 kb NEP transcript, the 2.6 kb PEP-related signal is visible only in the WT as well as in the sig1 and sig3-2 (but not sig6-2) knockouts. None of the retransformed chimeric lines show this latter transcript, confirming previous findings that functionally intact SIG6 is required for efficient transcription from this promoter (Schweer et al. 2006).
The 4.8 kb (NEP) transcript of sig6 is virtually absent from the WT as well as from sig1 and sig3-2. It is also absent from the sig1/6 and sig6/3 chimeric lines but is present in sig6/1 and sig3/6. This large transcript has been implicated in rescue transcription by the NEP from a far upstream promoter cluster (Schweer et al. 2006). Our current data suggest that NEP rescue transcription is not activated in any of the chimeric sigma lines (sig1/6, 6/1, 3/6 or 6/3) regardless of whether SIG6 CR or UCR sequences were part of the fusion construct. In any case, as for the global plastid transcript patterns (Fig. 3), no simple correlation seems to exist in these chimeric lines between atpB gene expression and the visual phenotype (Fig. 2). This differs from the situation seen for psbA transcript levels (Fig. 4, top panel), which are reduced only in those lines that reveal a chlorophyll-deficient phenotype (Fig. 2).
In conclusion, the current data provide initial clues to the involvement of the UCR in specifying the visual and/or molecular phenotype. It can be anticipated that more detailed studies will provide insights into several important aspects, including (i) the identity and location of the critical determinant(s) within the UCR; (ii) the expression of introduced sigma gene variants as well as the localization and function of their proteins; and (iii) the control circuits involving the sigma family in a ‘natural’ (non-mutant) situation in response to environmental cues.
Materials and Methods
The cDNA for each chimeric sigma factor was generated by fusion PCR using PfuUltra II Fusion HS DNA Polymerase (Stratagene, La Jolla, CA, USA). In a first PCR step, the CR and UCR were separately amplified. In the second step, the chimeric product was generated by using primers for full-length hybrid sigma factors (including the transit sequence for plastid import) and was then cloned into vector pBSKS(–) (Stratagene). The insert was sequenced, cut out, and ligated behind the cauliflower mosaic virus (CaMV) 35S promoter of pBINAR (Höfgen and Willmitzer 1990). Constructs were then introduced into Rhizobium radiobacter, followed by floral dip transformation (Clough and Bent 1998) of the Arabidopsis sig6-2 mutant. The transformed plants were selected by kanamycin resistance and tested by PCR and reverse transcription–PCR (RT–PCR). At least three independent lines were maintained and regularly retested.
Arabidopsis T-DNA insertion lines were obtained from GABI-Kat (Rosso et al. 2003). To distinguish these lines from published knockouts from different sources (Ishizaki et al. 2005, Zghidi et al. 2007), the suffix ‘-2’ was added where appropriate. The insertion site is in exon 8 (of nine) of AtSig1 in the sig1 line (758B02) and in exon 7 (of nine) of AtSig3 in the sig3-2 line (238A06) (http://www.gabi-kat.de). The site is in exon 5 (of nine) of AtSig6 in sig6-2 (242G06), which would place it within the UCR (Loschelder et al. 2006). WT, knockout and chimeric mutant seedlings were grown (8 h short day at 24°C and 60 mmol m−2 s−1), and cotyledons were harvested and powdered in liquid nitrogen for preparation of total RNA (Loschelder et al. 2006).
Digoxigenin-labeled RNA probes were synthesized by in vitro transcription using phage polymerases (Promega, Madison, WI, USA) and cloned DNA templates. Total plant RNA samples (1 μg) were subjected to gel blot analysis with the probes according to the Roche DIG manual (Loschelder et al. 2006, Schweer et al. 2006).
PCR-amplified DNA probes representing 94 Arabidopsis chloroplast genes were spotted onto nylon membranes. A 20 μg aliquot of total RNA was reverse transcribed using [α-32P]dCTP and SuperScript III reverse transcriptase (Invitrogen, Karlsruhe, Germany). The macroarray filters were hybridized with the labeled cDNA, washed and then exposed to phosphoimaging plates, followed by scanning in an FLA-3000 phosphoimager (Fuji, Tokyo, Japan). Images were analyzed using TotalLab software (Phoretix International) and an online normalization tool (http://nbc11.biologie.uni-kl.de). For each RNA sample, macroarray experiments were performed in triplicate and each gene was represented in four spots at two different concentrations. Based on the hybridization signals obtained, intensity ratios and P-values were calculated and data were further evaluated using scatter plots (Cho et al. 2008).
Funding
The Deutsche Forschungsgemeinschaft (SFB 480/B7 to G.L. and SFB TR1/B2 to J.M.).
Acknowledgments
We gratefully acknowledge the generous supply of the sig1, sig3-2 and sig6-2 knockout mutant lines by Professor B. Weisshaar, University of Bielefeld, and the GABI-Kat team at the Max-Planck-Institute für Zuechtungsforschung, Cologne. We would like to thank Brigitte Link for expert technical assistance.
References
Abbreviations
- CaMV
cauliflower mosaic virus
- CR
‘conserved’ C-terminal region
- GABI-Kat
German Plant Genomics Program ‘Genome Analysis in Biological Systems-Knockout
Arabidopsis thaliana
’
- NEP
nucleus-encoded polymerase, a single-subunit phage-type DNA-dependent RNA polymerase
- PEP
plastid-encoded polymerase, a multisubunit bacterial-type RNA polymerase
- SIG
transcription initiation factor sigma
- sig
sigma knockout line
- UCR
‘unconserved’ N-terminal region
- WT
wild type.
Author notes
This paper is dedicated to Professor Achim Trebst on the occasion of his 80th birthday.


