-
PDF
- Split View
-
Views
-
Cite
Cite
Md. Sayeedul Islam, Yasuo Niwa, Shingo Takagi, Light-Dependent Intracellular Positioning of Mitochondria in Arabidopsis thaliana Mesophyll Cells, Plant and Cell Physiology, Volume 50, Issue 6, June 2009, Pages 1032–1040, https://doi.org/10.1093/pcp/pcp054
Close - Share Icon Share
Abstract
Mitochondria, the power house of the cell, are one of the most dynamic cell organelles. Although there are several reports on actin- or microtubule-dependent movement of mitochondria in plant cells, intracellular positioning and motility of mitochondria under different light conditions remain open questions. Mitochondria were visualized in living Arabidopsis thaliana leaf cells using green fluorescent protein fused to a mitochondrion-targeting signal. In darkness, mitochondria were distributed randomly in palisade cells. In contrast, mitochondria accumulated along the periclinal walls, similar to the accumulation response of chloroplasts, when treated with weak blue light (470 nm, 4 μmol m−2 s−1). Under strong blue light (100 μmol m−2 s−1), mitochondria occupied the anticlinal positions similar to the avoidance response of chloroplasts and nuclei. While strong red light (660 nm, 100 μmol m−2 s−1) induced the accumulation of mitochondria along the inner periclinal walls, green light exhibited little effect on the distribution of mitochondria. In addition, the mode of movement of individual mitochondria along the outer periclinal walls under different light conditions was precisely analyzed by time-lapse fluorescence microscopy. A gradual increase in the number of static mitochondria located in the vicinity of chloroplasts with a time period of blue light illumination clearly demonstrated the accumulation response of mitochondria. Light-induced co-localization of mitochondria with chloroplasts strongly suggested their mutual metabolic interactions. This is the first characterization of the light-dependent redistribution of mitochondria in plant cells.
Introduction
One of the characteristic features of plant cells is rapid, continuous movement of cell organelles, which is essential for the active growth and development of plant cells. This applies not only to nuclei and chloroplasts, of which various aspects of intracellular distribution and movement have been intensively investigated for a long period of time (Britz 1979, Haupt and Scheuerlin 1990, Nagai 1993), but it has been revealed recently that other cell organelles such as the Golgi apparatus and peroxisomes are also motile (Wada and Suetsugu 2004, Logan 2006). Although the functional significance of organelle movement in plant cells has not been completely uncovered, its occurrence throughout the plant kingdom suggests indispensable physiological roles. Organelle movement is often affected by various environmental stimuli such as cold, drought, salinity, light, nutrient deficiency, temperature and physical stress (Britz 1979, Nagai 1993, Wada et al. 2003). Among all of these environmental stimuli, light is probably the most important factor in terms of regulation of plant organelle movement.
Chloroplast photorelocation movement is the most extensively analyzed organelle movement in a variety of plant species including algae, mosses, ferns and angiosperms (Haupt and Scheuerlin 1990, Wada et al. 2003). In general, chloroplasts move towards low-intensity light, resulting in accumulation along the periclinal walls (accumulation response) to maximize light capture for photosynthesis (Zurzycki 1955). In contrast, under high-intensity light, chloroplasts move to the anticlinal walls parallel to the direction of incident light (avoidance response) in order to avoid surplus light (Zurzycki 1957, Kasahara et al. 2002). In different types of plant cells, it has been reported that chloroplast movement is driven mainly by the actin cytoskeleton (Takagi 2003, Wada and Suetsugu 2004). Recent genetic approaches using Arabidopsis thaliana identified phototropin (phot) as the photoreceptor involved in blue-light-dependent chloroplast movement. The accumulation response is mediated by both phot1 and phot2 redundantly, whereas the avoidance response is mediated solely by phot2 (Jarillo et al. 2001, Kagawa et al. 2001, Sakai et al. 2001). Several other factors assumed to function in the signal transduction pathway have also been identified in A. thaliana (Oikawa et al. 2003, DeBlasio et al. 2005, Suetsugu et al. 2005, Luesse et al. 2006).
Light-dependent nuclear relocation movement in non-dividing mature plant cells was reported in prothallial cells of the fern Adiantum capillus-veneris for the first time (Kagawa and Wada 1993, Kagawa and Wada 1995). This unique phenomenon has also been found recently in leaf cells of A. thaliana (Iwabuchi et al. 2007). Although relevant photoreceptors have been identified both in Adiantum (Tsuboi et al. 2007) and in Arabidopsis (Iwabuchi et al. 2007), the general occurrence and physiological significance of those responses are still not well understood compared with chloroplast photorelocation movement (Iwabuchi and Takagi 2008).
Mitochondria have been envisaged to serve as cellular power plants and play a key role in cellular energy metabolism as the site of many anabolic and catabolic pathways. Plant mitochondria have evolved distinct strategies for genome maintenance, genetic decoding, gene regulation and organelle segregation (Logan 2003). Furthermore, recent research has also revealed that plant mitochondria function as fundamental elements for metabolic interactions with chloroplasts, for example in nitrogen assimilation, photorespiration and dissipation of excess reducing equivalents generated from the photochemical reactions in chloroplasts (Raghavendra and Padmasree 2003, Noctor et al. 2007, Noguchi and Yoshida 2008). The well-known intimate association or co-localization of mitochondria with chloroplasts and peroxisomes may be a prerequisite for such interactions (Frederick and Newcomb 1969, Logan and Leaver 2000).
On the other hand, mitochondria are highly dynamic organelles. Numerous studies have been carried out on mitochondrial morphology and movement in a variety of cells (Yaffe 1999), and it has been known that environmental stresses affect those features of mitochondria (Logan 2006). The molecular mechanism of mitochondrial movement has been extensively investigated in budding yeast, in which mitochondria exhibit a linear, bi-directional movement in a polarized fashion from the mother cell to the bud (Boldogh et al 2005). Plant mitochondria have also been revealed to change their shape and position within a few seconds (Logan and Leaver 2000), and visualized in association with actin microfilaments (Van Gestel et al. 2002, Doniwa et al. 2007) and microtubules (Romagnoli et al. 2007). Furthermore, mutant plants exhibiting abnormal distribution patterns of mitochondria were screened and partially characterized (Logan et al. 2003). However, many questions, such as the mechanisms underlying mitochondrial movement, positioning and distribution, still remain unanswered. The fusion of S65T-type (replacement of serine in position 65 with threonine) green fluorescent protein (GFP) with mitochondrion-targeting sequences has revealed the localization of GFP signals in the mitochondria (Niwa et al. 1999). Using A. thaliana stably expressing mitochondria-targeted GFP (mt-GFP), the present article aims to ask whether mitochondria in leaf mesophyll cells change their intracellular positions depending on different light conditions. We focused in particular on the mode of movement of individual mitochondria and co-localization with chloroplasts during those processes.
Results
Light-induced redistribution of mitochondria in mesophyll cells of A. thaliana
In dark-adapted palisade mesophyll cells, when viewed from the adaxial side, mitochondria along the outer periclinal walls seemed to be distributed uniformly over the cytoplasm (Fig. 1A). In transverse sections of the leaves, we confirmed that mitochondria were randomly distributed in the whole cytoplasm (Fig. 1B). Chloroplasts were distributed along the inner periclinal walls and the lower half of the anticlinal walls. After continuous illumination with weak blue light (wBL; 470 nm, 4 μmol m−2 s−1) for 4 h, mitochondria seemed to accumulate along the outer periclinal walls (Fig. 1C). In transverse sections of the leaves, we confirmed their positions on the outer and inner periclinal regions of the cells (Fig. 1D). Chloroplasts were exclusively distributed along the outer and inner periclinal walls, known as the accumulation response of chloroplasts. In contrast, after continuous illumination with strong blue light (sBL; 470 nm, 100 μmol m−2 s−1) for 4 h, mitochondria occupied their positions along the anticlinal walls (Fig. 1E, F). Chloroplasts were also distributed along the anticlinal walls, known as the avoidance response of chloroplasts.
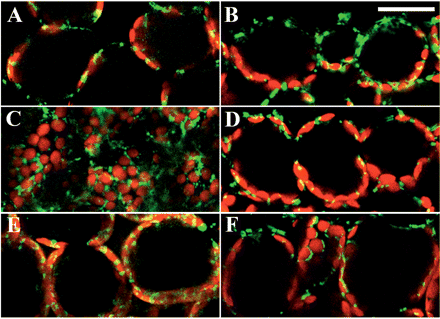
Redistribution of mitochondria in palisade cells of A. thaliana exposed to wBL and sBL. GFP signals in fixed palisade cells were visualized with confocal microscopy after dark treatment for 16 h (A, B), illumination with wBL (470 nm, 4 μmol m−2 s−1) for 4 h (C, D) and with sBL (470 nm, 100 μmol m−2 s−1) for 4 h (E, F), respectively. In the left panels (A, C, E), cells were observed from the adaxial side of the leaf. In the right panels (B, D, F), cells in transverse sections of the leaf were observed from the side. Green, GFP signals; red, chlorophyll autofluorescence. Bars = 50 μm.
Fig. 2 shows the distribution patterns of mitochondria and chloroplasts observed in single cells on transverse sections of the leaves after exposure to monochromatic light of different wavelengths for 4 h. The periclinal (Fig. 2A) and anticlinal (Fig. 2B) distributions of both organelles are clearly seen under wBL and sBL, respectively. On the other hand, under strong green light (sGL; 510–560 nm, 100 μmol m−2 s−1) (Fig. 2C) or strong red light (sRL; 660 nm, 100 μmol m−2 s−1) (Fig. 2D), mitochondria seemed to be randomly distributed in the cells, similar to the dark-adapted cells (Fig. 1B). Chloroplasts exhibit a typical distribution pattern as observed in the dark-adapted cells (Fig. 1B).
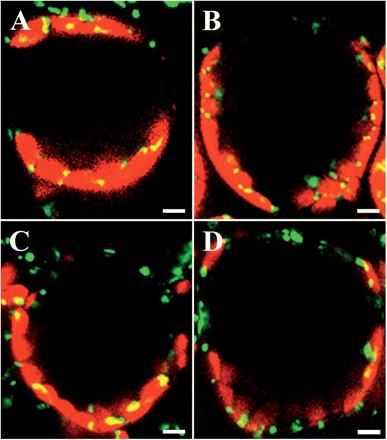
Distribution of mitochondria in single palisade cells of A. thaliana under different light conditions. Dark-adapted leaves were continuously illuminated for 4 h with wBL (A), sBL (B), sGL (510–560 nm, 100 μmol m−2 s−1) (C) and sRL (660 nm, 100 μmol m−2 s−1) (D), respectively. GFP signals in fixed palisade cells on transverse sections were visualized with confocal microscopy. Green, GFP signals; red, chlorophyll autofluorescence. Bars = 10 μm.
Semi-quantitative analysis of light-induced redistribution of mitochondria
To characterize light-dependent redistribution of mitochondria more precisely, the distribution patterns of mitochondria in individual cells were analyzed in a semi-quantitative manner by image processing of GFP signals. In the dark-adapted cells, approximately half of the GFP signals were detected in the periclinal regions, and the other half in the anticlinal regions (Fig. 3A, Dark). After exposure to wBL or sBL for 4 h, >80% of GFP signals were detected in the periclinal or anticlinal regions, respectively (Fig. 3A, wBL and sBL). In cells after exposure to sGL for 4 h, the distribution pattern of GFP signals exhibited little change from that obtained in the dark-adapted cells (Fig. 3A, sGL). On the other hand, after exposure to sRL for 4 h, the GFP signals detected in the periclinal regions showed a small but significant increase compared with those of the dark-adapted cells (Fig. 3A, sRL). We further examined the distribution patterns of GFP signals in the inner and outer periclinal regions separately (Fig. 3B). It becomes evident that sRL induced an accumulation of GFP signals only in the inner periclinal region.
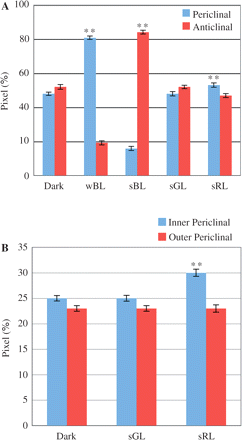
Semi-quantitative analysis of the distribution of mitochondria in palisade cells of A. thaliana under different light conditions. The relative distribution of GFP signals in the periclinal and anticlinal regions of fixed palisade cells was analyzed by image processing after dark adaptation (Dark) and 4 h illumination with wBL, sBL, sGL and sRL (A). The distribution of GFP signals in the periclinal regions was further examined after separation into the inner and outer periclinal regions (B). Asterisks indicate that significant differences were detected when compared with the value obtained after dark adaptation (**P < 0.01, Student’s t-test). Out of 10 different leaves, 10 cells were examined for each light condition. Data shown are the means ± SE.
Fig. 4 is the time course for redistribution of mitochondria induced by wBL. A gradual accumulation of GFP signals in the periclinal regions with illumination time was clearly detected. The response seemed to reach a plateau at 3–4 h of illumination. In the case of illumination with sBL, the accumulation of GFP signals in the anticlinal regions proceeded much more rapidly (data not shown). The response seemed to be saturated within 2 h of illumination. Thus we have succeeded in demonstrating light-induced redistribution of mitochondria in plant cells in a discernible way for the first time.
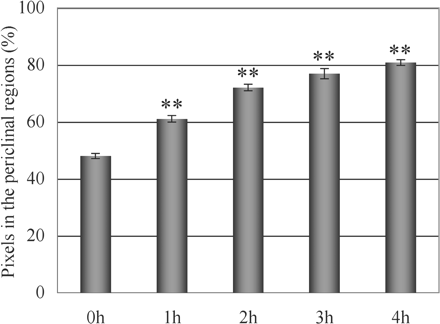
Time course for redistribution of mitochondria in palisade cells of A. thaliana induced by wBL. The relative distribution of GFP signals in the periclinal regions of fixed palisade cells was analyzed at 0, 1, 2, 3 and 4 h of illumination with wBL. Asterisks indicate that significant differences were detected when compared with the value obtained at 0 h (**P <0.01, Student’s t-test). Out of 10 different leaves, 10 cells were examined for each time point. Data shown are the means ± SE.
Motion analysis of mitochondria
Next, we asked how the light-induced accumulation of mitochondria into specific intracellular regions is brought about. After the behavior of mitochondria along the outer periclinal walls was sequentially recorded under fluorescence microscopy, movement of the individual mitochondria was analyzed. Mitochondria move vigorously throughout the cytoplasm, probably together with the cytoplasmic matrix conducting the cytoplasmic streaming, but often stop, change their direction, and form mutual attachments and detachments. Their movement ranged from small oscillations of <1 μm to a large-scale displacement of >10 μm s−1. Typical examples obtained at the start (Fig. 5) and after 4 h (Fig. 6) of illumination with wBL are presented. From such recordings, the movement of each mitochondrion was traced (Fig. 7). We noticed that the mode of movement of mitochondria can be divided mainly into three classes. The first is static mitochondria exhibiting no or only very fine movement at a velocity of <0.5 μm s−1 (yellow arrows in Figs. 5 and 6). The second is slow mitochondria exhibiting jerky movement in random directions at a velocity of 0.5–2.5 μm s−1 (white arrows in Fig. 5). The last one is fast mitochondria exhibiting rapid and linear movement at a velocity of >2.5 μm s−1 (red arrows in Fig. 5).
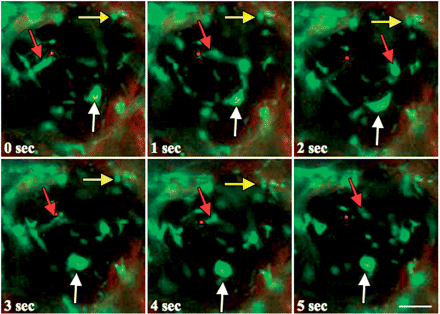
Movement of mitochondria in a living palisade cell of A. thaliana at 0 min of wBL illumination. Fluorescence images of the same cell were sequentially captured at 1 s time intervals. Movement of mitochondria during a 5 s observation time was demonstrated. The yellow, white and red arrows indicate static, slow and fast mitochondria, respectively. Bar =10 μm.
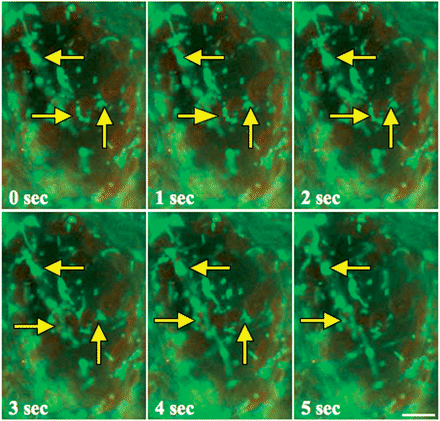
Movement of mitochondria in a living palisade cell of A. thaliana at 4 h of wBL illumination. Movement of mitochondria was demonstrated as described in the legend of Fig. 5. The yellow arrows indicate static mitochondria co-localized with chloroplasts. Bar = 10 μm.

Changes in the mode of movement of mitochondria along the outer periclinal walls of palisade cells of A. thaliana exposed to wBL. From the sequential fluorescence images captured at 0 min (A), 30 min (B) and 4 h (C) of wBL illumination, movements of individual mitochondria were traced. Eight representative results obtained at each time point are demonstrated at 1 s time intervals. Bar = 10 μm.
We examined changes in the frequency distribution of the three classes of mitochondria induced by different light treatment. Immediately after the dark adaptation, approximately two-thirds of mitochondria moved rapidly (Table 1, 0 min). The static mitochondria were very few and comprised about 4%. Under continuous illumination with wBL, the number of static mitochondria gradually increased and, instead, that of fast mitochondria decreased (Fig. 7; Table 1, wBL). After 4 h of illumination, almost one-third of mitochondria became static (Fig. 7C; Table 1, wBL). This phenomenon ultimately resulted in the accumulation of mitochondria on the outer periclinal regions. We noticed that many of the static mitochondria, if not all, were in close proximity to chloroplasts, as shown in Fig. 6. While sBL exhibited a similar effect to wBL (Table 1, sBL), sGL and sRL never induced any increase in the number of static mitochondria on the outer periclinal walls (Table 1, sGL and sRL).
The mode of movement of mitochondria along the outer periclinal walls of palisade cells of A. thaliana under different light conditions.
| Illumination time . | Static (%) <0.5 μm s−1 . | Slow (%) 0.5–2.5 μm s−1 . | Fast (%) >2.5 μm s−1 . | Velocity (μm s−1) . | |
|---|---|---|---|---|---|
| 0 min | 4 | 29 | 67 | 2.27 ± 0.17 | |
| wBL | 15 min | 4 | 31 | 65 | 2.54 ± 0.17 |
| 30 min | 7 | 33 | 60 | 3.82 ± 0.16 | |
| 1 h | 16 | 38 | 46 | ||
| 2 h | 21 | 42 | 37 | ||
| 4 h | 29 | 50 | 21 | 2.26 ± 0.14 | |
| sBL | 15 min | 4 | 28 | 68 | 2.87 ± 0.22 |
| 30 min | 6 | 31 | 63 | 4.50 ± 0.16 | |
| 4 h | 25 | 45 | 30 | 2.72 ± 0.16 | |
| sGL | 30 min | 6 | 34 | 60 | 2.46 ± 0.15 |
| 4 h | 6 | 32 | 62 | 2.59 ± 0.18 | |
| sRL | 30 min | 5 | 31 | 64 | 2.35 ± 0.16 |
| 4 h | 6 | 34 | 60 | 2.26 ± 0.15 | |
From recordings taken with time-laps fluorescence microscopy at given time points, we classified mitochondria into three populations, namely, static, slow and fast, according to their velocity. We examined the frequency distribution of mitochondria with the different modes of movement as well as the average velocity of slow and fast mitochondria. Velocities were determined from the distance moved by individual mitochondrion in 1 s and are given as the means ± SE. At each time point, 100 mitochondria out of 25 different cells were examined
Intriguingly, although the number of static mitochondria increased under wBL, the average velocity of the slow and fast mitochondria was accelerated in the first 30 min of illumination with wBL (Table 1, wBL). After 4 h exposure to wBL, however, the average velocity returned to the initial level. In the case of illumination with sBL, which induced the accumulation of mitochondria in the anticlinal regions, the average velocity of the slow and fast mitochondria was accelerated more rapidly and reached a more elevated level at 30 min (Table 1, sBL), which was significantly higher than the level obtained at 30 min of wBL illumination (P < 0.01, Student’s t-test). Since the average velocity obtained at 30 min of sBL illumination was significantly higher than those obtained using sGL and sRL (Table 1), the effect is BL specific. Even after 4 h of exposure to sBL, the average velocity exhibited a significantly higher level compared with the case of wBL (P < 0.05, Student’s t-test) and sRL (P < 0.05, Student’s t-test).
Discussion
Light-dependent intracellular positioning of mitochondria
Intracellular positioning of mitochondria has not been characterized in detail in photosynthesizing plant cells because of the difficulty in observing the phenomenon clearly. Using A. thaliana stably expressing mt-GFP (Niwa et al. 1999), we revealed that mitochondria in leaf palisade cells occupy different intracellular positions under different light conditions (Figs. 1–3). To our knowledge, this is the first characterization of light-induced mitochondrial redistribution in plant cells. In the present study, we followed the movement of individual mitochondria on the outer periclinal region of the living palisade cells under a fluorescence microscope. Mitochondria exhibit typically discrete, spherical to sausage-shaped morphology regardless of whether movement occurs, and seem to be distributed throughout the cyto-plasm.
In the dark-adapted cells, most of the mitochondria exhibited rather vigorous movement at an average velocity of 2.3 μm s−1 (Table 1, 0 min). The velocity is comparable with the previously reported values ranging from 1.4 to 2.6 μm s−1, such as in pollen tubes (Heslop-Harrison and Heslop-Harrison 1987, Romagnoli et al. 2007) and A. thaliana leaf epidermal cells (Doniwa et al. 2007). Although this state was maintained for 15 min after the start of continuous illumination with wBL to induce the accumulation of mitochondria in the periclinal regions, the mitochondrial motility increased afterwards (Table 1, wBL). Thereafter, mitochondria gradually became sluggish (Table 1, wBL; Fig. 7), and many such mitochondria were apparently in contact with chloroplasts, which also accumulated along the periclinal walls as a result of the accumulation response (Fig. 6). Consequently, we concluded that the progressive loss of motility of mitochondria on the periclinal regions is the first cause of redistribution of mitochondria induced by wBL. Whether the loss of motility is a direct effect of the interaction with chloroplasts remains to be elucidated.
Assuming that mitochondria lose their motility when associated with chloroplasts under illumination, we propose that the sBL-induced accumulation of mitochondria in the anticlinal regions is brought about through similar processes to those demonstrated on the outer periclinal regions. Under sBL, mitochondria may lose their motility on the anticlinal regions where chloroplasts accumulated as a result of the avoidance response. Since sBL accelerated the velocity of mitochondria more rapidly and markedly compared with wBL (Table 1), translocation of mitochondria from the periclinal regions into the anticlinal regions should proceed efficiently. This may explain why the redistribution of mitochondria under sBL was completed more rapidly than under wBL.
Photoreceptor systems mediating mitochondrial positioning
Illumination with wBL or sBL caused an early acceleration and the subsequent deceleration of the velocity of mitochondria (Table 1). This intriguing response is reminiscent of the accumulation response of chloroplasts observed in an aquatic angiosperm Vallisneria gigantea (Dong et al. 1996). In the leaf epidermal cells of this plant, red light of a low fluence rate produced a rapid acceleration and a delayed deceleration of the chloroplast movement. The former response is under the control of phytochrome and the latter occurs depending on the operation of photosynthesis. We have also hypothesized that the acceleration and deceleration of mitochondrial movement in A. thaliana palisade cells are mediated by different photoreceptor systems.
Since the early acceleration of mitochondrial movement is induced by BL specifically and seemed to be fluence rate dependent (Table 1), we can assume that this process is mediated by phototropins. In A. thaliana, Kagawa and Wada (2004) demonstrated that the velocity of chloroplasts during the avoidance response depends on the fluence rate of incident light, and proposed that the velocity is determined by the amount of light-activated photoreceptor molecules, namely phot2. A similar mechanism might be involved in regulation of the velocity of mitochondria, though the mode of movement is not unidirectional as seen in the avoidance response of chloroplasts. Examination of light-induced changes in the mode of mitochondrial movement in mutant plants deficient in phototropin functions should provide a critical answer.
Concerning the late deceleration of mitochondrial movement, as discussed above, we propose that mitochondria lose their motility through co-localization with chloroplasts involved in photosynthesis. If the movements of mitochondria are hampered at specific intracellular regions, they should be detected as specific distribution patterns of mitochondria. Under sRL, mitochondria accumulated in the inner periclinal region (Fig. 3B), where the majority of chloroplasts were located (Fig. 2D). Although it was almost impossible to analyze the behavior of mitochondria along the inner periclinal walls under the present optical conditions, and it involved only 30% of the mitochondria present in the cell, we believe that those mitochondria lost their motility. On the other hand, in dark-adapted cells and cells exposed to sGL, we could not detect any specific distribution pattern of mitochondria (Figs. 1–3). Mitochondria in those cells kept active movement at least on the outer periclinal regions (Fig. 7A, Table 1), and it may be true of mitochondria on the other regions of those cells. Consequently, we presume that the well-known co-localization of mitochondria with chloroplasts in photosynthesizing cells (Frederick and Newcomb 1969, Logan and Leaver 2000, Takagi 2003) is a light-dependent phenomenon regulated by specific photoreceptor systems.
Materials and Methods
Plant materials
A wild-type A. thaliana (L.) Heynh. ecotype Columbia (Col) and a transgenic A. thaliana (Col background) expressing mitochondrion-targeted, S65T-type GFP (mt-GFP) (Niwa et al. 1999) were used. Seeds were sown on compost and grown under 16 h of white light (80 μmol m−2 s−1) and 8 h of darkness at 23°C. Mature plants used in the experiments were 4–5 weeks old and had 3–4 rosette leaves.
Light treatment
Rosette leaves were cut from the plants at the petioles, floated on deionized water and then kept in complete darkness for 16 h. The dark-adapted specimens were illuminated from the adaxial side with blue (470 nm), green (510–560 nm) and red (660 nm) light as described in Iwabuchi et al. (2007). The intensity of light was measured using a quantum sensor and data logger (LI-1400; LI-COR Inc., Lincoln, NE, USA). We confirmed that the fluorescence intensity of GFP in leaves of mt-GFP plants was normal even after continuous illumination with blue light (470 nm, 100 μmol m−2 s−1) for 24 h.
Distribution of mitochondria on transverse sections of the leaf explants
Specimens after different light treatments were fixed with 2.0% formaldehyde in a buffer solution (10 mM EGTA, 5 mM MgSO4, 50 mM PIPES, pH 7.0) for 30 min under evacuation. After fixation, transverse sections were prepared by hand. Confocal laser-scanning microscopy was performed using a confocal microscope (Fluoview; Olympus, Tokyo, Japan) in a fluorescent mode. The microscope was equipped with a × 40 oil-immersion objective with a numerical aperture (NA) of 1.0 (UPlanApo; Olympus). Two fluorescence detection channels were used, one for the mt-GFP signal (excited at 488 nm) and the other for chlorophyll autofluorescence (excited at 568 nm). Confocal images were collected only from the cells and/or tissues which appeared undamaged, resembling intact ones. All the experiments were done on palisade cells.
The distribution of GFP signals on confocal images was semi-quantitatively analyzed by image-processing procedures. From confocal images obtained under different light conditions, we randomly selected single cells in which GFP signals were clearly demonstrated over the whole cytoplasm. After each confocal image was digitized, maximum intensity projections of GFP signals were changed into a gray image. For all the gray images, one optimal threshold level for the brightness of pixels was selected. On each gray image, a single cell was separated into four parts, namely upper and lower periclinal regions and right and left anticlinal regions. Then we classified all pixels on each gray image with values above the selected threshold level as white, and all other pixels as black. After binarization of the gray images, the numbers of white pixels in periclinal and anticlinal regions were calculated, respectively. We excluded the results obtained on extremely narrow or wide cells, because such cells exhibited a large imbalance between the periclinal and anticlinal area.
Motion analysis of individual mitochondria
Each specimen after a defined light treatment was simply mounted on a glass slide with distilled water and overlaid with a coverslip. Living palisade cells were observed and photographed using a fluorescence microscope (BX-50; Olympus, Tokyo, Japan). To take time-lapse images, the specimen was sequentially scanned 20 times on the same region at the same focal plane with 1 s time intervals. Images were captured by a high-sensitivity camera (Retiga-2000RV; TILL Photonics, Munich, Germany). To avoid potential damage and non-specific effects on the cells caused by low oxygen pressure (Logan 2006), microscopic observations of one sample were completed within 1 min. The mode of movement of mitochondria was analyzed using image-processing software (Adobe Photoshop 8.0.1; Adobe Systems, Mountain View, CA, USA). From stored time-lapse images, 10 serial images were superimposed onto one image and the movement of each mitochondrion was traced. The velocity of mitochondria was determined from the distance each mitochondrion moved in 1 s using image-processing software (Image Pro Plus; Media Cybernetics, Bethesda, MD, USA).
Funding
The Ministry of Education, Culture, Sports, Science and Technology (MEXT) Grant-in-Aid for Scientific research on Priority Areas (No. 19039020 to S.T.); MEXT to M.S.I.
Acknowledgments
We are grateful to Dr. Takashi Hotta for his excellent technical assistance and constructive discussion.
References
Abbreviations:
- Col
Columbia
- mt-GFP
mitochondrion-targeted green fluorescent protein
- NA
numerical aperture
- sBL
strong blue light
- sGL
strong green light
- sRL
strong red light
- wBL
weak blue light


