


Abstract
In the present-day universe, the most massive galaxies are ellipticals located in the cores of galaxy clusters, harboring the heaviest super-massive black holes (SMBHs). However, the mechanisms that drive the early growth phase and subsequent transformation of the morphology and kinematics of galaxies remain elusive. Here we report (sub)kiloparsec-scale observations of stars, gas, and dust in ADF22.A1, a bright dusty starburst galaxy at |$z=3.1$|, hosting a heavily obscured active galactic nucleus and residing in a proto-cluster core. ADF22.A1 is a giant spiral galaxy with the kinematics of a rotating disk with rotation velocity |$V_{\rm rot}=530\pm 10$| km s|$^{-1}$| and diameter |$>$|30 kpc. The high specific stellar angular momentum of this system, |$j_*=3400\pm 600$| kpc km s|$^{-1}$|, requires a mechanism to effectively spin-up ADF22.A1, indicating the importance of accretion from the cosmic web to supply both gas and angular momentum to galaxies in their early gas-rich starburst phase. In its inner region, gas flows along dust lanes in a bar connected with the bright dusty core and the estimated mass ratio of the bulge to the SMBH matches the local relation, suggesting that bars are a key mechanism to shape the early co-evolution of these components. Comparison with cosmological simulations shows that ADF22.A1 will likely evolve into a massive elliptical, experiencing a significant reduction in angular momentum associated with subsequent galaxy mergers.
1 Introduction
One of the fundamental correlations observed in galaxy evolution is the morphology–density relation. It is known that the cores of clusters in the local universe are populated by the oldest and most massive elliptical galaxies, while spiral galaxies are more common in the surrounding low-density environments (Dressler 1980). In addition to their stellar populations, supermassive black holes (SMBHs) are known to be hosted by these galaxies; this provides an important clue. An important observational result that links the central SMBH with the host galaxy is a tight correlation between the mass of the central black hole, |$M_\mathrm{BH}$|, and the mass of the host galaxy’s bulge (e.g., Magorrian et al. 1998; Kormendy & Ho 2013). This relation suggests a co-evolutionary pathway, where the growth of the SMBH and the host galaxy are regulated by common processes. The connection between the environment and these galaxy populations shows that the environment plays a key role in the formation and evolution of galaxies.
Recent observations and theoretical models suggest that the progenitors of massive ellipticals observed in the local Universe have formed most of their stars at high redshift (|$z \gtrsim 2$|; Thomas et al. 2005; De Lucia et al. 2006). Dusty star-forming galaxies (DSFGs), characterized by intense star formation and significant dust obscuration (for a review, see Casey et al. 2014), are plausible progenitors (Toft et al. 2014; Casey 2016)). DSFGs often harbor active galactic nuclei (AGNs), which suggests that DSFGs also exhibit the growth phase of SMBHs (e.g., Alexander et al. 2005). In recent decades, several works have reported the coexistence of DSFGs and proto-clusters at |$z\sim 3$|–4 based on interferometric observations (e.g., Daddi et al. 2009; Umehata et al. 2015; Wang et al. 2016; Oteo et al. 2018; Miller et al. 2018).
The SSA22 proto-cluster at |$z=3.09$| has one of the most remarkable overdensities at |$z>2$| (Steidel et al. 1998; Hayashino et al. 2004; Yamada et al. 2012) and offers one of the best targets for investigating the early formation of massive galaxies and the environmental dependence. On top of single-dish surveys prior to the launch of the Atacama Large Millimeter/submillimeter Array (ALMA; Blain et al. 2004; Geach et al. 2005; Chapman et al. 2005; Tamura et al. 2009; Umehata et al. 2014), Umehata et al. (2015) (see also Umehata et al. 2019) discovered that 16 DSFGs and 6 X-ray-selected AGNs with |$z_{\rm spec}\approx 3.09$| are concentrated into the proto-cluster core, utilizing the contiguous 1 mm mapping of the |$2^{\prime \prime } \times 3^{\prime \prime }$| core region. This was the first discovery of the tight connection between such a large number of DSFGs/AGNs and proto-clusters in the early universe free from source confusion. The ALMA mosaic field is called the ALMA Deep Field in SSA22 (ADF22; Umehata et al. 2015, 2017).
ADF22.A1 at |$z_{\rm spec}=3.09$| is the brightest DSFG in ADF22 situated within a large-scale Ly |$\alpha$| filament extending over several Mpc (Umehata et al. 2019). It is also the most luminous X-ray source in the field, hosting an intrinsically bright yet heavily obscured AGN (Tamura et al. 2010; Monson et al. 2023). As such, ADF22.A1 offers a unique laboratory for exploring how the most massive galaxies and SMBHs accumulate their mass, acquire their morphology, and undergo the transformations that ultimately evolve them into the most massive elliptical galaxies observed at |$z=0$|. For years our understanding of the structure of the galaxy has been hampered because of heavy dust extinction affecting its rest-frame UV appearance (Tamura et al. 2010; Umehata et al. 2014). However, with the advent of the James Webb Space Telescope (JWST) and ALMA, we can now resolve its structure and kinematics, providing unprecedented insights into the physical processes shaping the evolution of massive galaxies.
We adopt a standard concordance cosmology with |$H_0=70$| km s|$^{-1}$| Mpc|$^{-1}$|, |$\Omega _{\rm m}=0.30$|, and |$\Omega _\lambda =0.70$|. Here, |$H_0$| is the Hubble constant, and |$\Omega _{\rm m}$| and |$\Omega _\lambda$| are the matter density and dark energy density at the present time, respectively. This gives a scale of 7.63 kpc per arcsec at |$z=3.09$|.
2 Observation and data reduction
2.1 JWST NIRCam imaging
The NIRCam imaging observation was performed on 2023 October 15 as part of a JWST Cycle-2 program (PI: H. Umehata, GO 3547) designed to cover ADF22, including ADF22.A1, with four filters (F115W, F200W, F356W, and F444W). The exposure time for each filter was 1869 s. We used the STANDARD subpixel dither pattern, while no primary dither was applied. We used the MEDIUM8 readout mode. Data reduction was performed using the JWST calibration pipeline (v.1.8.4), following the recipe provided by the CEERS team (Bagley et al. 2023). We applied “snowball” removal, wisp subtraction, and “1|$/$|f” noise subtraction in addition to the standard reduction. The 5 |$\sigma$| limiting magnitudes for a |$0{^{\prime \prime }_{.}}1$|-radius aperture are 29.01, 29.15, 29.49, and 29.00 AB mag for F115W, F200W, F356W, and F444W, respectively. The point spread function (PSF) of each image was matched to that of the F444W image. We refer to the joint ALMA-JWST effort within the proto-cluster core as “ADF22-WEB.”
2.2 ALMA observations
The [C ii] emission was observed using ALMA Band-8 as part of two ALMA observing programs. The main program, to obtain a high angular resolution map of ADF22.A1, was carried out in 2022 April to June during the Cycle-8 project (PI: H. Umehata, 2021.1.01406.S). The array configurations of C43-2 and C43-5 were utilized to achieve both high angular resolution and sensitivity to spatially extended emission. The on-source times were 11 min and 39 min, respectively. The precipitable water vapour (PWV) was typically 0.4 mm. Two spectral windows of 1.875 GHz bandwidth (with dual polarization) centered at 463.822 and 465.663 GHz were employed. Data reduction was performed using version 6.5.0 of the Common Astronomy Software Applications (CASA) package. After continuum subtraction the data were mapped with the tclean task, adopting Briggs weighting (robust = 0.5). This yielded a synthesized beam |$0{^{\prime \prime }_{.}}23 \times 0{^{\prime \prime }_{.}}17$| at a position angle of 78|$^{\circ }$|. The typical noise level is |$1\, \sigma =0.47$| mJy beam|$^{-1}$| per 80 km s|$^{-1}$| channel. The parameters of the observations are summarized in table 1, which also includes details of other observations described below.
Summary of ALMA and JVLA observations.
| Facility | Band | Observable | Beam size | PA (|$^{\circ }$|) | RMS (mJy) | Project ID |
|---|---|---|---|---|---|---|
| ALMA | Band-8 | [C ii] | |$0{^{\prime \prime }_{.}}23 \times 0{^{\prime \prime }_{.}}17$| | 78 | 0.47 mJy beam|$^{-1}$| per 80 km s|$^{-1}$| | 2021.1.01406.S |
| Band-8 | [C ii] | |$0{^{\prime \prime }_{.}}92 \times 0{^{\prime \prime }_{.}}84$| | 74 | 0.8 mJy beam|$^{-1}$| per 80 km s|$^{-1}$| | 2021.1.00041.S, 2021.1.01406.S | |
| Band-8 | 630 |$\mu$|m | |$0{^{\prime \prime }_{.}}078 \times 0{^{\prime \prime }_{.}}062$| | |$-$|67 | 0.23 mJy beam|$^{-1}$| | 2022.1.00223.S | |
| Band-7 | 870 |$\mu$|m | |$0{^{\prime \prime }_{.}}21 \times 0{^{\prime \prime }_{.}}20$| | 78 | 21 |$\mu$|Jy beam|$^{-1}$| | 2021.1.00071.S | |
| Band-6 | 1.1 mm | |$0{^{\prime \prime }_{.}}042 \times 0{^{\prime \prime }_{.}}042$| | |$-$|4 | 12 |$\mu$|Jy beam|$^{-1}$| | 2019.1.00008.S | |
| Band-6 | 1.1 mm | |$0{^{\prime \prime }_{.}}079 \times 0{^{\prime \prime }_{.}}079$| | |$-$|81 | 18 |$\mu$|Jy beam|$^{-1}$| | 2019.1.00008.S | |
| JVLA | Ka-Band | CO(1–0) | |$3{^{\prime \prime }_{.}}23 \times 2{^{\prime \prime }_{.}}55$| | |$-$|9 | 30–40 |$\mu$|Jy beam|$^{-1}$| per 100 km s|$^{-1}$| | 16A-357, 21A-346 |
As part of the ALMA Cycle-8 project (PI: H. Umehata, 2021.1.00041.S), [C ii] emission in ADF22.A1 was also observed in ALMA Band-8 in the C43-2 configuration in April 2022. The total on-source time was 18 min, adopting the same correlator set-ups as the project above. Imaging was performed using the tclean task adopting natural weighting and uvtaper = |$0{^{\prime \prime }_{.}}75$| to trace extended emission, combining all 29 min of data taken with the C43-2 configuration in this project and the one above. The cube has a synthesized beam size of |$0{^{\prime \prime }_{.}}92 \times 0{^{\prime \prime }_{.}}84$| with position angle 74|$^{\circ }$|. The typical noise level is |$1\, \sigma =0.8$| mJy beam|$^{-1}$| per 80 km s|$^{-1}$| channel.
As part of the ALMA Cycle-9 project (PI: H. Umehata, 2022.1.00223.S), dust continuum emission in ADF22.A1 was observed in ALMA Band 8. The C43-7 configuration was used in 2023 June. The total on-source time was 64 min. The image has a representative frequency of 476.667 GHz (630 |$\mu$|m). The cube has a synthesized beam size of |$0{^{\prime \prime }_{.}}078 \times 0{^{\prime \prime }_{.}}062$| with position angle |$-67^{\circ }$|. The typical noise level is |$1\, \sigma =0.23$| mJy beam|$^{-1}$|. This image was used to obtain a high-resolution dust continuum map.
ALMA Band-7 observations to map the 870 |$\mu$|m continuum were performed as part of the Cycle-8 project (PI: H. Umehata, 2021.1.00071.S). The C43-3 and C43-6 array configurations were utilized in 2022 May and July, achieving on-source times of 8 min and 21 min, respectively. The correlator was set up with two spectral windows of 1.875 GHz bandwidth (dual polarization) each per sideband. The spectral windows had central frequencies of 336.5, 338.4, 348.5, and 350.5 GHz, respectively. Data reduction was performed using version casa 6.5.0, mapped with the tclean task, adopting natural weighting to yield a synthesized beam of |$0{^{\prime \prime }_{.}}21 \times 0{^{\prime \prime }_{.}}20$| with position angle 78|$^{\circ }$|. Typical noise level is |$1\, \sigma = $| 21 |$\mu$|Jy beam|$^{-1}$|.
Finally, ALMA Band-6 observations to map the 1.1 mm dust continuum were carried out in 2021 August as part of the Cycle-7 project (PI: H. Umehata, 2009.1.00008.S). The array configuration was C43-8 and the total integration time was 31 min. The four spectral windows had central frequencies of 253.0, 254.8, 267.0, and 269.0 GHz. Data reduction was performed using version 6.1.0 of the casa package. The continuum image was created using the line-free channels with the tclean task. In the case of natural weighting, the resulting synthesized beam size is |$0{^{\prime \prime }_{.}}042 \times 0{^{\prime \prime }_{.}}042$| with position angle |$-4^{\circ }$|. The root rms noise level is |$1\, \sigma =12$| |$\mu$|Jy beam|$^{-1}$|. In the case of adopting natural weighting with uvtaper = |$0{^{\prime \prime }_{.}}038$|, the resulting synthesized beam size is |$0{^{\prime \prime }_{.}}079 \times 0{^{\prime \prime }_{.}}072$| with position angle |$-81^{\circ }$|. The rms noise level is |$1\, \sigma =18$| |$\mu$|Jy beam|$^{-1}$|. The tapered image is used in figures throughout the paper, while the original natural weighting image is utilized to measure the size of the dusty core.
2.3 JVLA observation
The CO(1–0) line at |$z=3.09$| falls in the Ka-band of the Karl G. Jansky Very Large Array (JVLA). Observations were carried out over winter 2016 to summer 2021 in two programs (PI: H. Umehata, 16A-357, 21A-346). We utilized the Wideband Interferometric Digital Architecture (WIDAR) correlator with 8-bit samplers. A continuous frequency range of 32.67–33.70 GHz and 27.67–28.70 GHz, which allowed us to observe the CO(1–0) line at the redshift range of |$z=2.42$|–2.53 and |$z=3.02$|–3.17 covering the |$z=3.1$| proto-cluster. The array configurations of C, CnB, and D were utilized to accumulate the total on-source time of 24 hr. The calibration was accomplished using the standard casa pipeline for VLA (version 6.1.2.7). All the |$uv$|-data were combined into a single data set. The data were mapped using tclean in casa with robust 2.0 weighting. The resulting synthesized beam size is |$3{^{\prime \prime }_{.}}23 \times 2{^{\prime \prime }_{.}}55$| with position angle |$-9^{\circ }$|. The achieved rms level per 100 km s|$^{-1}$| velocity channel is 30–40 |$\mu$|Jy beam|$^{-1}$| at 28.0–28.4 GHz.
2.4 Astrometry
The astrometric accuracy of the ALMA images and cubes depends on (i) the signal-to-noise ratio of the source and (ii) the quality of phase referencing and the positional uncertainty of the phase calibrator. First, we measured the centroid of the phase calibrator J2226–0052 using the observed 870 |$\mu$|m image, and confirm that the source position is matched within 1 mas in the International Celestial Reference System (ICRS). Then we adopted the nominal positional accuracy for a compact source of 11 mas for the Band-7 data, which is derived by |${\rm pos}_{\rm acc}\approx {\rm beam}_{\rm FWHM}/{\rm SNR}/0.9$|, where |${\rm beam}_{\rm FWHM}$| is the full width at half maximum of the synthesized beam, SNR is the signal-to-noise ratio (up to 20), and 0.9 is a factor to account for a nominal 10% signal decorrelation (ALMA Technical Handbook and references therein). The JWST/NIRCam observation is not a mosaic but a single field observation. The limited spatial coverage of the NIRCam image means only a small number of Gaia stars are available. This makes it challenging to derive accurate absolute coordinates. Here our purpose is matching the JWST coordinate system with that of ALMA. We first aligned the four-band NIRCam images to each other, matching with Gaia stars. Then we performed the emission profile fit for ALMA 870 |$\mu$|m and NIRCam F444W images in a manner described in section 7 also for other DSFGs in the field (see Umehata et al. 2025 for more details). We matched the ALMA and JWST images, minimizing the systematic offsets between the peaks measured with both images. Consequently, both images matched within the pixel scale of the JWST F444W image (|$0{^{\prime \prime }_{.}}063$| pixel|$^{-1}$|).
3 Analysis and results
3.1 Resolved views in stellar, gas, and dust components
The JWST/NIRCam images trace the rest-frame optical-to-near-infrared wavelengths, and resolved the main stellar components at |$0{^{\prime \prime }_{.}}2$| resolution (1.5 kpc at |$z=3.1$|). Our images uncover a spiral structure in the galaxy (figure 1a) and the 870 |$\mu$|m dust continuum and emission in the fine-structure line of singly ionized carbon ([C ii] 158 |$\mu$|m) at kiloparsec resolution. These observations resolve the distribution and kinematics of the cold interstellar medium (ISM) in the young spiral galaxy. As shown in figure 1b, the resolved dust continuum image uncovered that active star-formation activity, accompanied by significant dust production, occurs not only at the galactic center but across the whole disk. The [C ii] intensity distribution broadly traces the stellar light, suggesting spiral arms (figure 1c; see also figure 11). The velocity field is characteristic of a regularly rotating disk in ADF22.A1, while non-circular motions cause a twisted pattern at the center (figure 1d).
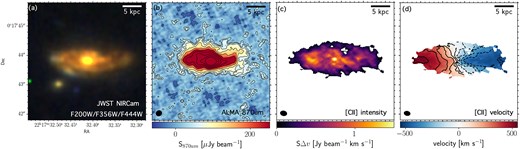
(a) Color image of a bright DSFG, ADF22.A1 at |$z=3.09$| taken with JWST/NIRCam (blue: F200W, green: F356W, red: F444W), showing that ADF22.A1 resembles a giant spiral galaxy. (b) 870 |$\mu$|m dust continuum image of ADF22.A1 taken with ALMA Band-7, which unveils active starburst activity throughout the disk. (c), (d) [C ii] 158 |$\mu$|m intensity and velocity maps of ADF22.A1 taken with ALMA Band-8, respectively. The intensity distribution shows a hint of spiral structure as also seen in stellar light. The velocity field is characteristic of a rotating disk, while non-circular motions are also observed as a twisted pattern at the center. The synthesized beam size for the ALMA data are shown in the lower left corners of the relevant panels.
3.2 Panchromatic SED fit
Total flux densities of ADF22.A1 in the NIRCam images were measured with an elliptical aperture, yielding |$<$|0.24, |$1.89\pm 0.15$|, |$7.34\pm 0.04$|, and |$13.5\pm 0.24\, \mu$|Jy for F115W, F200W, F356W, and F444W, respectively. We measured an 870 |$\mu$|m flux density of |$S_{\rm 870}=15.5\pm 0.6$| mJy based on the curve growth method. The X-ray-to-infrared spectral energy distributions (SEDs) of ADF22.A1, except for these new measurements, were previously fitted with the SED-fitting code lightning (Monson et al. 2023). This code allows us to simultaneously constrain emission from star-formation heated dust and AGN dust emission. We improved the fit by including the NIRCam and ALMA measurements. The new best-fitting SED model and the probability distribution function for key parameters are shown in figure 2. The fit yields SFR = |$610_{-270}^{+340}\, M_\odot$| yr|$^{-1}$|, log(|$M_*/M_\odot$|) = 11.4|$^{+0.1}_{-0.2}$|, log(|$M_{\rm BH}/M_\odot$|) = 8.5|$^{+0.2}_{-0.3}$|, and log|$\lambda _{\rm Edd}$| = |$-0.9^{-0.4}_{-0.3}$|, where |$\lambda _{\rm Edd}$| is the Eddington ratio. The estimates are generally consistent with previous ones.
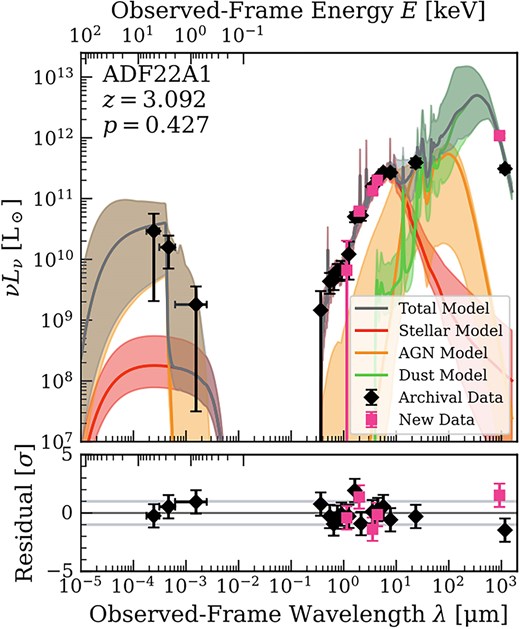
Best-fit SED model for ADF22.A1 from lightning (Monson et al. 2023). The shaded regions indicate the full range of the best-fitting 68% of models.
3.3 Profile fit
We performed Sérsic profile fitting using the F444W image with galfit (Peng et al. 2002, 2010). The image traces the rest-frame near-infrared emission around 1 |$\mu$|m, which is expected to be sensitive to stellar mass distribution. The best-fitting model and residual images are shown in figure 3. This best-fitting model has an effective radius of |$r_{{\rm e},\mathit{F444w}}=7.0\pm 0.1$| kpc and Sérsic index |$n=1.7\pm 0.1$|.
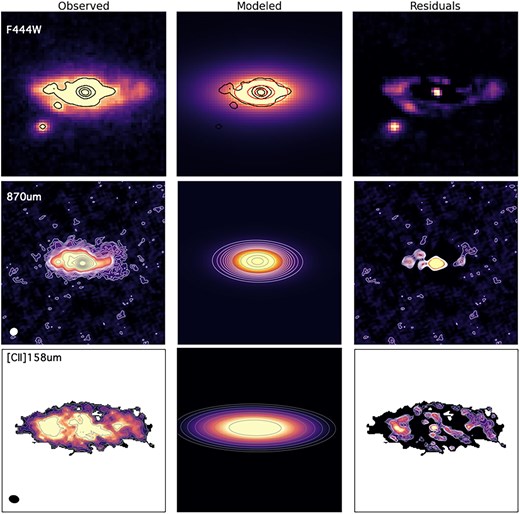
Results of the profile fit of ADF22.A1. From top to bottom, JWST/NIRCam F444W, ALMA 870 |$\mu$|m, and [C ii] moment-0 maps are shown. In each row, the observed maps are shown together with model and residual images. Each panel is |$3{^{\prime \prime }_{.}}84$| in size. In the F444W maps, black contours show 20%, 40%,..., 80% of the peak flux in the observed or residual maps, while red contours show the best-fitting model. In the 870 |$\mu$|m maps, white (gray) contours show |$\sigma$|, |$3\, \sigma$|,..., |$10\, \sigma$| (|$20\, \sigma$|, |$30\, \sigma$|,..., |$100\, \sigma$|). In the [C ii] maps, the gray contours are |$1.5\, \sigma$|, |$1.5\, \sigma ^2$|,..., |$1.5\, \sigma ^7$|, while the white contours are from |$1\, \sigma$| to |$5\, \sigma$| in steps of |$1\, \sigma$| (here, |$\sigma$| is for three Hanning-smoothed 40 km s|$^{-1}$| channels). As shown, the modeled Sérsic profiles successfully reproduce the observed profile to a certain degree, while the |$0{^{\prime \prime }_{.}}2$| maps leave additional sub-components, such as core and spiral arms.
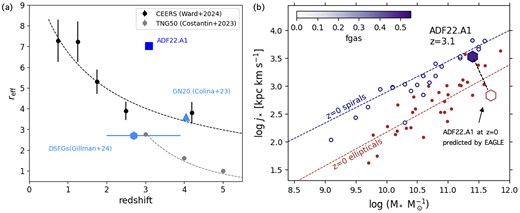
We compare the measured size of the stellar emission with other works based on JWST NIRcam observation and simulations in figure 4. It is known that there is a trend relating galaxy size and stellar mass (van der Wel et al. 2014). For a fair comparison, we focus here on works that use the rest-frame optical-to-near-infrared wavelengths proved with JWST images (or simulations for JWST). The size–mass relation derived based on the NIRCam images taken with the CEERS survey was measured (Ward et al. 2024), which provides a suitable comparison sample (note that most of their samples are based on photometric redshifts). We plot the derived effective radius for each redshift bin, adopting |$M_*=2\times 10^{11}\, M_{\odot }$|, which is equivalent to the stellar mass of ADF22.A1. We note that we use the relation for star-forming galaxies in this work, while they discuss both star-forming galaxies and passive galaxies separately.
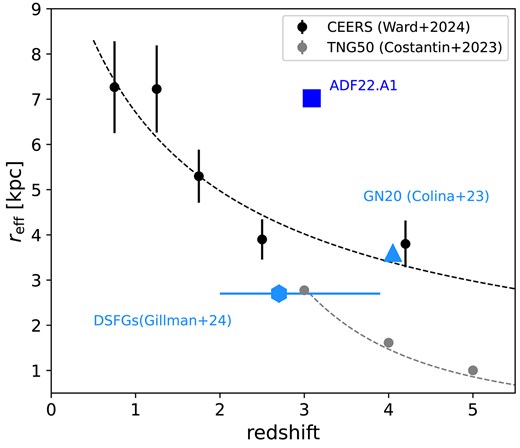
Effective radius of star-forming galaxies as a function of redshift. Expected trends for a stellar mass of |$2\times 10^{11}\, M_{\odot }$| of the size–mass relations for star-forming galaxies are illustrated for JWST observations (Ward et al. 2024) and simulations (Costantin et al. 2023b). The effective radius of ADF22.A1 is larger than other star-forming galaxies, including typical |$z\sim 3$| DSFGs, and equivalent to |$z\sim 1$| galaxies, showing an accelerated size and mass growth in the |$z=3.1$| proto-cluster core.
The result of mock observations of TNG50 simulations are also shown, adopting the same stellar mass (Costantin et al. 2023b). The best-fitting functions for the observation and simulation are |$r_{\rm eff}/{\rm kpc}=11.2\times (1+z)^{-0.74}$| and |$r_{\rm eff}/{\rm kpc}=165.4\times (1+z)^{-2.9}$|, respectively. Note that there are several caveats. The sampling of the CEERS survey data is sparse at |$z>3$|, resulting in a single redshift bin to cover |$z=3$|–5.5. Meanwhile, the simulation models galaxies at |$z=3$|–6 only. Galaxies with |$M_*\gtrsim 2\times 10^{11}\, M_{\odot }$| are quite rare at |$z\gtrsim 3$| in both observations and simulations, and the size–mass relation in the mass range largely relies on extrapolation of the lower-mass range. Nevertheless, they provide a useful comparison at |$z\simeq 3$|. As shown, the effective radius of ADF22.A1 at |$z=3.09$| is about 1.8–2.5 times larger than the representative values expected at the redshift from observations or simulations. The effective radius is larger than any galaxies in the CEERS survey at |$z>3$| (Ward et al. 2024), which demonstrates that ADF22.A1 is one of the largest galaxies at such an early epoch. The effective radius is equivalent to that of typical star-forming galaxies at |$z$| = 0.5–1.0, suggesting accelerated growth of a stellar disk in the violent growth phase in a rare |$z=3.1$| proto-cluster core with a space density below those sampled by recent simulations. The Sérsic index is significantly larger than unity, giving further evidence for the existence of a growing bulge.
In figure 4, we also compare the result with other measurements on stellar sizes of DSFGs based on JWST/NIRCam. Eighty DSFGs observed by the PRIMER project at |$z=2.7_{-0.7}^{+1.2}$| have effective radius |$r_{{\rm e},\mathit {F444W}}=2.7\pm 0.2$| kpc (Gillman et al. 2024), with two relatively large examples with |$r_{{\rm e},\mathit {F444W}}\sim 7$| kpc. GN20 at |$z=4.05$|, which is a member of the proto-cluster at the field, has an effective radius of |$r_{{\rm e},\mathit {F560W}}=3.6\pm 0.03$| kpc (Colina et al. 2023). It is also reported that A1489-850.1 at |$z=4.26$| has |$r_{{\rm e},\mathit {F444W}}=3.8\pm 0.4$| kpc (Smail et al. 2023). While these are relatively larger than other DSFGs at a lower redshift, their sizes are still only about half of ADF22.A1. Thus, the large size of ADF22.A1 is unusual among the DSFG population.
We also modeled the |$0{^{\prime \prime }_{.}}2$| 870 |$\mu$|m dust continuum emission and [C ii] total flux with a Sérsic profile (figure 3). ADF22.A1 has a peak flux density of |$S_{\rm 870}=2.61 \pm 0.02$| mJy beam|$^{-1}$|, which corresponds to SNR |$\approx$| 124. We masked |$5\, \sigma$| peaks as presented in Hodge et al. (2019) in the case of the 870 |$\mu$|m dust continuum, which yielded the best-fitting model with an effective radius |$r_{\rm e, 870}=4.7\pm 0.1$| kpc and Sérsic index |$n=0.9\pm 0.1$|. For [C ii], the |$^{\rm 3D}$|barolo package (Di Teodoro & Fraternali 2015) was used to extract the [C ii] emission from the cube with 40 km s|$^{-1}$| bins to make the moment-0 map. The genuine emission was identified with the search task with snrcut = 4.5, growthcut = 4.5, and minchannels = 3. The [C ii] peak flux is |$1.95\pm 0.07$| Jy beam|$^{-1}$| km s|$^{-1}$| (SNR |$\approx$| 28, by assuming three channels as the typical channel width to combine). We fitted a Sérsic profile without a bright emission mask and obtained |$r_{\rm e, [C\, {\small II}]}=7.6\pm 0.2$| kpc and Sérsic index |$n=0.4\pm 0.1$|. We note that the models still leave residuals, which demonstrate the power of high-resolution images at the |$0{^{\prime \prime }_{.}}2$| resolution. These substructures include a core, clumps, and spiral arms. The spiral arms are indicated by all three components (stars, dust, and gas), while the relative strength among the three tracers shows significant variation.
3.4 Kinematic modeling
We made [C ii] data cubes and fitted them with a rotating disk model to derive the kinematic properties. As presented in figure 1, the observed [C ii] velocity field shows a generally monotonic velocity gradient, indicating a rotating gas disk in the spiral galaxy. A twisted pattern at the center also suggests the presence of non-circular motion (see also figure 11b for the detailed view).
The |$^{\rm 3D}$|barolo package was utilized to model the [C ii] kinematics as a rotating disk, which also allows a chance to isolate the non-circular components. In addition to the original |$0{^{\prime \prime }_{.}}2$|-resolution cube, we used a smoothed cube with a |$0{^{\prime \prime }_{.}}9$| resolution, which improves the detectability of emission in the outskirts and suppresses the deviations produced by the non-circular motions at the center.
First we made use of the high-resolution cube (|$0{^{\prime \prime }_{.}}2$|). The cube was created with a 40 km s|$^{-1}$| bin, which was then Hanning-smoothed with the smoothspec function. We adopted a disk model where the kinematic center (|$x_0$|, |$y_0$|), position angle (PA), inclination (|$i$|), systemic velocity (|$V_{\rm sys}$|), rotation velocity (|$V_{\rm rot}$|), and velocity dispersion (|$\sigma$|) were free parameters. The scale height of the disk was fixed to be 300 pc (Lelli et al. 2021). We adopted a ring width of |$0{^{\prime \prime }_{.}}097$|, which is half of the resolution element |$\sqrt{\theta _x + \theta _y}$|, where |$\theta _{\rm x}$| and |$\theta _{\rm y}$| are the major and minor axes of the synthesized beam. Considering the complex gas morphology (figure 1), a disk model with non-axisymmetric gas distributions was studied by renormalizing the flux density of each spatial pixel to the observed intensity map. The evaluated inclination generally ranges from |$i=70^{\circ }$| to |$i=75^{\circ }$| with typical errors of 4|$^{\circ }$|. The median value is |$i=73^{\circ }$|. For the position angle, PA = |$87^{\circ }$|–|$96^{\circ }$| (a median value of PA = 92|$^{\circ }$| with errors of 5|$^{\circ }$|) are estimated. The kinematic center position matches with peaks of F444W and 870 |$\mu$|m dust continuum emissions within the F444W pixel sampling. Figure 5a shows the position–velocity (PV) diagram of the best-fitting model, compared to the observed emission. While the model successfully reproduces the observed emission as a whole, there are some discrepancies in the innermost region comprising the twisted pattern. The errors on the derived parameters become large, reflecting the influence of the non-circular motion at the center. An elliptical region, centered at the kinematic center and aligned along the kinematic major axis, is defined to isolate the innermost region. This region is denoted as the “bar region” since it corresponds to the area of the dusty core and offset ridges (figure 11). We will discuss this aspect more in subsection 4.2, together with the possible influence of an AGN.
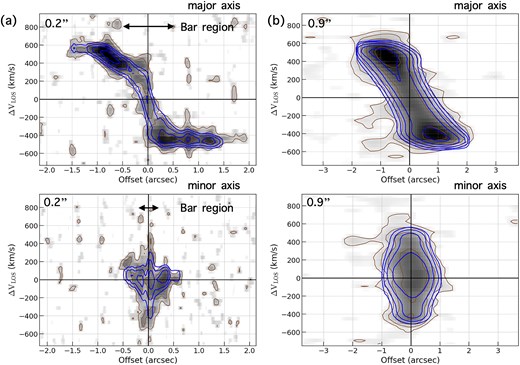
Position velocity diagrams of the [C ii] emission at |$0{^{\prime \prime }_{.}}2$| and |$0{^{\prime \prime }_{.}}9$| along the major and minor axes as labelled. The background image and brown contours (|$2\, \sigma$|, |$4\, \sigma$|, |$8\, \sigma$|, |$16\, \sigma$|, and |$32\, \sigma$|) represent the observed emission. The best-fitting three-dimensional model derived with 3d barolo is overlayed in blue contours. The model globally reproduces the observed emission for the two cases with different angular resolutions. There are some discrepancies in the innermost region (denoted as the “bar region”) in the |$0{^{\prime \prime }_{.}}2$| case, which encompasses the “twisted” pattern in the velocity field shown in figure 1. The innermost velocity structure is further investigated in subsection 4.2.
The |$0{^{\prime \prime }_{.}}9$|-resolution cube was used to obtain the overall trend of the velocity structure, which is insensitive to the innermost non-circular motion and sensitive to the extended emission in the outer region. We adopted and fixed the obtained median values of the parameters during the run for the |$0{^{\prime \prime }_{.}}2$| cube, except for the rotation velocity and velocity dispersion. We adopted a ring width of |$0{^{\prime \prime }_{.}}35$|, which is 40% of the resolution element, considering the consistency with the spatial resolution and the accuracy of the velocity field estimation. In the fit, the rotation velocity and velocity dispersion are estimated. The PV diagrams of the modeled and observed emissions are shown in figure 5. In this case, the model generally reproduces the observed emission.
It has been suggested that the velocity dispersion derived by |$^{\rm 3D}$|barolo in the standard way can be significantly underestimated when the velocity resolution is not sufficient, which may be a typical situation in observations of galaxies at high redshift (Lelli et al. 2023). We used the spacepar task in |$^{\rm 3D}$|barolo to investigate a global minimum in the |$V_{\rm rot}$|–|$\sigma$| space and obtained a better constraint on velocity dispersion, fixing the other parameters. The explored parameter space is a range of |$V_{\rm rot}$| from 1 to 700 km s|$^{-1}$| and |$\sigma$| from 1 to 100 km s|$^{-1}$|. The steps were 2 km s|$^{-1}$| for each. The minimum |$\sigma$| is in a range from 44 to 60 km s|$^{-1}$| at |$r= 0{^{\prime \prime }_{.}}63$| to |$1{^{\prime \prime }_{.}}02$| (4.8 to 7.8 kpc). The area corresponds to bright spiral arms and disks away from the central bulge and bar regions. This is close to the velocity resolution (80 km s|$^{-1}$|) and hence we performed a similar test for a cube with 20 km s|$^{-1}$| bins (the velocity resolution after Hanning smoothing is 40 km s|$^{-1}$|). This test resulted in a similar |$\sigma$| range, which supports the validity of the measurement with the original cube. We conservatively adopt a representative |$\sigma =60$| km s|$^{-1}$|.
The evaluated rotation velocity is plotted as a function of the radius in figure 6 for both cases. We fitted the rotation curve based on the |$0{^{\prime \prime }_{.}}9$| cube with an arctangent model,
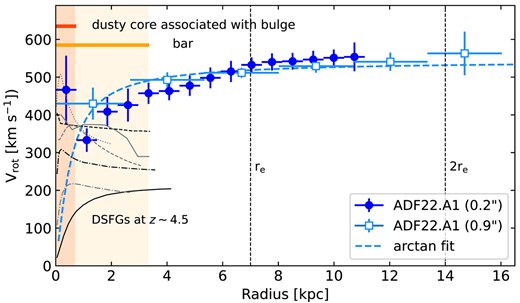
Observed rotation curve of ADF22.A1 at |$z=3.09$| derived from [C ii] cubes at |$0{^{\prime \prime }_{.}}2$| (blue circles) and |$0{^{\prime \prime }_{.}}9$| (cyan squares). The smoothed data is beneficial for tracing the overall trend. As the best-fitting arctangent model is overlaid (cyan dashed line), the gas disk of ADF22.A1 is generally characterized as a rotating disk with a flat rotation curve |$V_{\rm rot}=530$| km s|$^{-1}$| [at |$r=2{\rm r}_{{\rm e},\mathit {F444W}}$|, where |${\rm r}_{{\rm e},\mathit {F444W}}$| is the stellar effective radius measured with the F444W image]. The high-resolution data shows a deviation from the model curve in the inner region, indicating the influence of potentials associated with the bar and bulge (as their sizes are indicated). Other well-resolved rotation curves based on [C ii] of |$z\sim 4.5$| DSFGs are also plotted (Rizzo et al. 2020, 2021; Lelli et al. 2021)]. The comparison between ADF22.A1 and such typical DSFGs highlights the unusually large extent and |$V_{\rm rot}$| of ADF22.A1.
where |$v_{\infty }$| is the asymptotic velocity at sufficiently large radii and |${r_{\rm t}}$| is the scale radius at which the rotation curve transitions from rising to flat.
The best-fitting model is also shown in figure 6 with |$v_{\infty }=540$| km s|$^{-1}$| and |${r_{\rm t}}=0.52$| kpc. The rotation curve from the |$0{^{\prime \prime }_{.}}2$| cube is generally consistent with that of the |$0{^{\prime \prime }_{.}}9$| cube. Potential deviations are seen in the inner region (|$r\lesssim 4$| kpc). The steep rise in the innermost bin can be caused by the compact gravitational potential associated with the stellar bulge, as other works report in some DSFGs (Lelli et al. 2021). The derived rotation velocity |$V_{\rm rot}$| remains flat, with |$V_{\rm rot}=530\approx$| km s|$^{-1}$| in the outer disk, extending to |$r\approx 15$| kpc. We measured a rotation velocity |$V_{\rm rot}$| using the arctangent model. At a radius of |$r=2{r}_{\rm e}$|, |$V_{\rm rot}=530\pm 10$| km s|$^{-1}$|. Adopting this value as a representative |$V_{\rm rot}$|, the ratio between the rotation velocity and velocity dispersion is |$V_{\rm rot}/\sigma =8.8\pm 1.5$|. Hence, rotation support dominates pressure support in ADF22.A1. Based on this result, we assume that the rotation velocity is approximated as equal to the circular velocity.
The nature of ADF22.A1, a huge and rapidly rotating disk, is distinguished among the known galaxies in the early universe. The rotation velocity and extent of the gas disk are several times larger than those reported for DSFGs at |$z\sim 4$|–5 (Rizzo et al. 2020, 2021; Lelli et al. 2021; see figure 6), and also uniquely large among DSFGs at |$z\sim 2$| (Amvrosiadis et al. 2025). One possibly similar case is GN20 at |$z=4.05$| (Hodge et al. 2012). While the CO(2–1) data obtained with the VLA does not have sufficient quality for fair comparison with ADF22.A1, the reported maximum rotational velocity of |$v_{\rm max} = 575 \pm 100$| km s|$^{-1}$| is comparable. They reported that the emission extends to |$r=7$| kpc, which is about half of that of ADF22.A1. Interestingly, GN20 also resides in a proto-cluster at |$z=4$|, similar to ADF22.A1. There are also intriguing discoveries about normal star-forming galaxies (not DSFGs). Large disk galaxies at |$z\sim 3$| in an overdensity have recently been reported (Wu et al. 2023; Wang et al. 2024). While the rotation velocity is not so large (|$v_{\rm rot} \sim 200$|–300 km s|$^{-1}$|), the disk size is similar to ADF22.A1. There may be a common driver to form rapidly rotating disks and/or giant disks in a proto-cluster environment. As we discussed in the paper, both cold gas accretion and gas-rich major-mergers are expected to work efficiently in such an environment. A difference between rotation velocities based on the two resolution cubes is identified in the inner region (|$r\lesssim 4$| kpc), while both measurements are consistent in the outer part. A steep rise in |$V_{\rm rot}$| in the innermost region may be caused by a bulge potential Lelli et al. 2021, while the adjacent decline indicates the effect of a bar flow (Hirota et al. 2009).
3.5 Resolved stellar profile and specific stellar angular momentum
The stellar specific angular momentum (|$j_*=J_*/M_*$|, where |$J_*$| is total stellar angular momentum) involves three uncorrelated variables, a length scale, and a rotation velocity, and is one of the most fundamental quantities to describe the kinematics and structures of galaxies (e.g., Fall & Efstathiou 1980; Romanowsky & Fall 2012). The specific stellar angular momentum is given by
where |${\boldsymbol r}$|, |$\bar{{\boldsymbol v}}({\boldsymbol r})$|, and |$\rho ({\boldsymbol r})$| are the the position, mean-velocity vectors, and the three-dimensional density of the stars. Equation (2) can be reduced to a one-dimensional integral given by
where |$r$| is the radius, |$\Sigma (r)$| is the surface mass density at radius |$r$|, and |$v(r)$| is the rotational velocity at radius |$r$|. Thus, one needs to derive the surface stellar mass density profile and rotation velocity as a function of radius, in a spatially resolved way for both, to calculate the stellar specific angular momentum.
First we evaluate the surface stellar mass density profile through a multi-wavelength SED fit in a pixel-by-pixel way. Here we briefly describe the method; the details will be reported in another paper (H. Umehata et al. in preparation; see also Smail et al. 2023). We used the F115W, F200W, F356W, and F444W images, matching the PSF to that of F444W. To account for the dust-obscured star-formation activity, we also included a spatially resolved 870 |$\mu$|m dust continuum map at a |$0{^{\prime \prime }_{.}}2$| sampling.
Utilizing the F444W image as a detection mask, we used the magphys code (da Cunha et al. 2012) to fit the SED of each pixel. We adopted the median of the stellar mass distribution as a representative value for a pixel, while lower and upper values were determined as the 16th and 84th percentiles.
We used the stellar mass map to derive a stellar mass density profile through elliptical aperture photometry. The profile obtained is shown in figure 7a. There is a significant excess of stellar mass surface density at the innermost region (|$R\lesssim 2$| kpc) above a simple exponential disk, which reflects the stellar bulge in ADF22.A1. Note that the panchromatic SED fit for the whole galaxy including X-ray suggests that the contribution from the AGN in the F444W photometry is limited (|$\lesssim$|5%) and does not have significant impact on the derived stellar mass profile (figure 2). As in some previous works (e.g., Lelli et al. 2023), we fitted the observed profile with a combination of bulge and disk components. For the bulge, we adopted the Sérsic profile with |$n=3$|, while we assumed an exponential profile for the disk. The best-fitting model is shown in figure 7a. This model was not significantly affected by the Sérsic index for a range of |$n=2$|–4. There is potential excess at |$z\sim 2$|–3 kpc between the observed and modeled profiles, which may be due to a stellar bar, but the limited sampling of the profile prevents us from adding the third component. We evaluated the bulge to a total stellar mass ratio |$B/T\approx 0.2$| from the excess over the disk exponential profile in the inner part. Since the currently available photometry taken with JWST and ALMA is not sufficient to uncover the stellar mass surface distribution in the outer parts due to the lack of sensitivity, we extrapolated the profile at |$R\gtrsim 8$| kpc.
(a) Profile of the stellar mass surface density. The best-fitting model of bulge, disk, and the combined profiles are also shown. The excess in the innermost region reflects the stellar bulge, while the bar may also contribute to the excess. Since the current photometry is not sensitive enough to measure the profile at the outer parts, we extrapolate it, assuming an exponential disk. (b) Cumulative fraction of the stellar mass |$M_*$|, rotation velocity |$V_{\rm rot}$|, and specific stellar angular momentum |$j*$| as a function of radius for ADF22.A1. As shown, the specific stellar angular momentum, calculated using the stellar mass distribution and rotation curves, converges at a large radius.
Until recently, stellar specific angular momentum was approximated with simplified profiles of stellar mass distribution and velocity at high redshift (Romanowsky & Fall 2012). Now, we can derive the parameter with the measured stellar mass distribution obtained from the pixel-by-pixel SED fit including sub-millimeter photometry, and a rotation curve, assuming that the gas kinematics trace the stellar component (Obreschkow & Glazebrook 2014). To suppress the influence of non-circular motion in the bar region, we adopted the arctangent model as the rotation velocity profile. Then the stellar specific angular momentum (|$j_*$|) was calculated following equation (3). The cumulative profile of the stellar specific angular momentum is plotted in figure 7b, together with profiles of the stellar mass distribution and rotation velocity. The total stellar specific angular momentum was calculated as a converged value, |$j_*=3400\pm 600$| km s|$^{-1}$| kpc.
While the above method is the most direct way to derive |$j_*$|, it is usually quite challenging to obtain both a resolved rotation curve and a stellar mass surface density profile for galaxies at high redshift due to the limited sensitivity, spatial resolution, and available range of photometries. As an approximation, a scaling relation among specific angular momentum, rotation velocity, and disk size and morphology has been suggested (Romanowsky & Fall 2012):
where |$v_s$| is the rotation velocity at |$2\times r_{\rm e}$|. The remaining parameter |$k_n$| is a numerical coefficient that depends on the Sérsic index (|$n$|) of the galaxy:
Assuming that we only have the effective radius in an image (here F444W is adopted), this approximation gives |$\tilde{j_*}\simeq 5100$| kpc km s|$^{-1}$|, which is |$\sim$|50% larger than the estimate based on the resolved profile and rotation curve. There are several plausible factors to make the estimate of the stellar angular momentum uncertain in the approximation. First, the F444W emission profile of ADF22.A1 is not perfectly modeled with a single Sérsic profile as there are residual emissions (figure 3). ADF22.A1 has a bulge and spiral arms, and there is a limitation to fitting with a single component. Second, the stellar emission in the F444W image would not necessarily be a good tracer of stellar mass distribution. The rest-frame wavelength is 11 000 Å, which can still be affected by significant dust attenuation in massive star-forming galaxies, including DSFGs. It is reported that dust attenuation can result in flatter light profiles that yield larger effective radii (Costantin et al. 2023b; LaChance et al. 2025). This can also lead to an overestimate of the specific stellar angular momentum. The result demonstrates that calculation of specific stellar angular momentum based on resolved profiles of stellar mass surface density and rotation velocity for galaxies at high redshift is critically important.
3.6 Molecular gas mass and the Toomre Q parameter
To investigate the cause of the starburst activity seen in ADF22.A1, the Toomre |$Q$| parameter was computed for ADF22.A1, utilizing the resolved gas kinematics traced by [C ii] and total molecular gas mass measured with CO(1–0) emission. The total molecular gas mass of ADF22.A1 was estimated utilizing the line luminosity of the CO(1–0) emission. The ground |$J$| = 1–0 transition offers a well-established tracer of the cold molecular gas reservoirs of galaxies. The JVLA observations have successfully detected the emission in ADF22.A1; the velocity-integrated flux image is shown in figure 8. The total line flux measured using the casa/imfit task was (|$0.20\pm 0.03$|) Jy km s|$^{-1}$|, which corresponds to a line luminosity of |$L^{\prime }_{\rm CO(1-0)}=(8.1\pm 1.4)\times 10^{10}$| K km s|$^{-1}$| pc|$^2$|. This gives the molecular gas mass |$M_{\rm gas}=(\alpha _{\rm CO}/2.5)\times (2.0\pm 0.4)\times 10^{11}\, M_{\odot }$|. It is known that |$\alpha _{\rm CO}$| varies among galaxies (for example, |$\alpha _{\rm CO}\simeq 0.8$| for local ULIRGs and |$\alpha _{\rm CO}\simeq 4.6$| for Milky-Way-like galaxies (Solomon & Vanden Bout 2005, and references therein). We adopted |$\alpha _{\rm CO}\simeq 2.5$| as a representative value, which was derived through comparison between the CO and [C i] line luminosities for a set of DSFGs (Bothwell et al. 2017). The molecular gas mass measurement provides an estimate of the gas mass fraction, |$f_{\rm gas}=M_{\rm gas}/(M_{*}+M_{\rm gas})=0.45\pm 0.10$|.
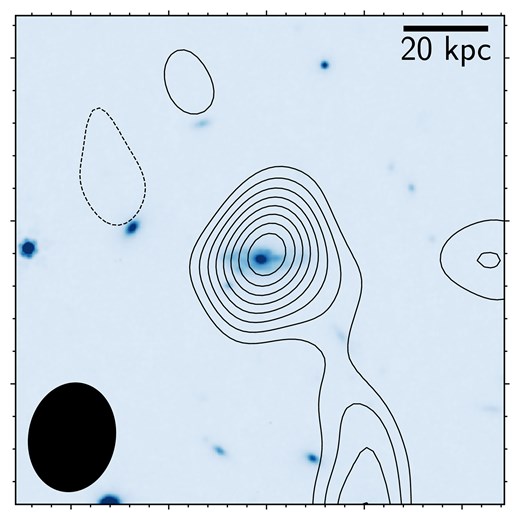
JVLA CO(1–0) intensity map of ADF22.A1. The contours are steps of |$1\, \sigma$| starting from |$\pm 3\, \sigma$| (negative contours are dotted). The background image is the JWST/NIRCam F444W image and we show the synthesized beam in the lower left corner.
The Toomre |$Q$| parameter (Toomre 1964) was calculated to examine the average stability of the galactic disk against local gravitational collapse. The parameter is defined as |$Q=\sigma \kappa / (\pi G \Sigma _{\rm gas})$|, where |$G$| is the gravitational constant, and |$\Sigma _{\rm gas}$| is the gas mass surface density. Here, |$\sigma$| is the velocity dispersion and |$\kappa$| is the epicyclic frequency. Since A1 shows a flat rotation curve, we approximate it as |$\kappa =\sqrt{2}V_{\rm rot}/r$|, where |$V_{\rm rot}$| is the rotation velocity of the disk at radius |$r$|. The CO(1–0) emission is not well resolved with JVLA (figure 8). Here we assumed that the CO(1–0) profile is the same as that of [C ii]. We calculated the Toomre |$Q$| parameter, calculating |$\kappa$| at |$r_{\rm e,[C\, {\small II}]}$| and the averaged molecular gas mass surface density within the radius. We adopted the velocity profile and velocity dispersion measured with the [C ii] modeling. The calculated |$Q=0.7\pm 0.2$| supports a scenario where the gas disk is gravitationally unstable and the instabilities can develop on scales larger than the Jeans length and drive active star formation observed across the disk (figure 1).
4 Discussion
4.1 Origin of the rapidly rotating, giant disk
The derived relation between stellar mass and specific stellar angular momentum is plotted in figure 9. For comparison, we also show the relation measured for local spiral galaxies (Obreschkow & Glazebrook 2014; Di Teodoro et al. 2023) and ellipticals (Fall & Romanowsky 2018), together with the best-fitting functions (Fall & Romanowsky 2018). For ADF22.A1 and local spiral galaxies, the markers are color-coded with the molecular gas mass fraction |$f_{\rm gas} = M_{\rm mol}/(M_*+M_{\rm mol})$|.
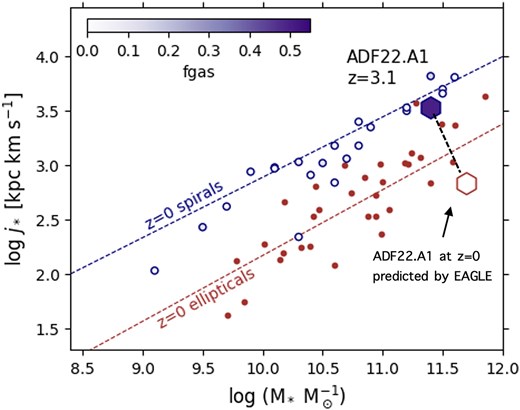
Relation between stellar mass and stellar specific angular momentum for ADF22.A1 compared to local spiral galaxies (Obreschkow & Glazebrook 2014; Fall & Romanowsky 2018). ADF22.A1 has a high stellar specific angular momentum equivalent to local, massive spiral galaxies, indicating a mechanism to effectively fuel gas and angular momentum in the early universe. ADF22.A1 is expected to evolve into massive elliptical galaxies in a local cluster core, losing its angular momentum by |$z\approx 0$|. A prediction from the EAGLE simulation illustrates the expected evolution in |$j_*$| (Zavala et al. 2016).
The specific stellar angular momentum of ADF22.A1 is as high as seen in the most massive and largest local spiral galaxies (Obreschkow & Glazebrook 2014), following the local |$M_*$|–|$j_*$| relation for spiral galaxies (Romanowsky & Fall 2012). Therefore, the nature of ADF22.A1 likely reflects a high stellar mass and a rapidly rotating disk. This also suggests that the association with the Hubble sequence (the “mass–spin–morphology relation”; Fall & Romanowsky 2013), has already emerged at |$z\sim 3$|. However, a distinct characteristic between ADF22.A1 at |$z=3.09$| and local spirals is the molecular gas mass fraction. ADF22.A1 is a starburst and has an implied gas mass fraction of |$\sim$|45%, which is around two orders of magnitude higher than local spirals (figure 9). There must be a source which supplies angular momentum and gas fuel to form such a system—a rapidly rotating gas disk—only |$\sim$|2 billion years after the Big Bang.
A plausible mechanism for forming a large, rapidly rotating disk is cold stream accretion from the cosmic web (Dekel & Birnboim 2006; Dekel et al. 2009). The redshift–|$M_{\rm h}$| diagram was proposed by Dekel and Birnboim (2006) as a diagnostic of whether cold mode accretion is allowed or prohibited (figure 10). Cosmological simulations show that these cold gas flows have a specific angular momentum much higher than that of the host halo and are able to quickly form into an extended disk of cold gas in |$t\lesssim 1$| Gyr (Stewart et al. 2013; Kretschmer et al. 2022).
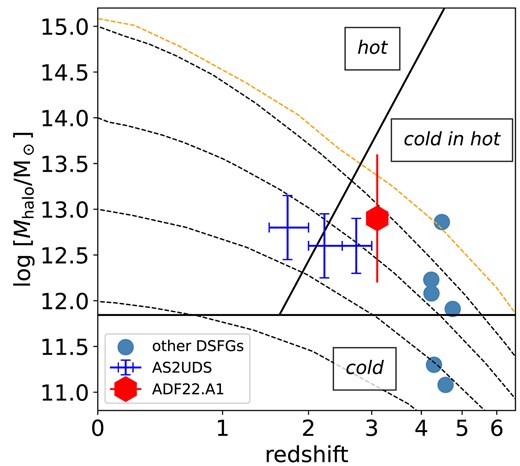
Relation between redshift and halo mass. The black dashed lines show the evolution of dark matter halos, while the orange line shows the most massive halos in the |$\lambda$|CDM universe (Overzier 2016). The black solid lines separate the diagram into three regimes: “hot,” “cold,” and “cold in hot” (Dekel & Birnboim 2006). While a cold stream is not expected in the “hot” regime due to virial shock heating, cold stream accretion is predicted to penetrate the hot media in the most massive halos in the “cold in hot” regime (Overzier 2016). The derived halo mass of ADF22.A1 at |$z=3.1$| is log(|$M_{\rm h}/M_{\odot })=12.9\pm 0.7$| and is one of the largest values among DSFGs (measured with clustering analysis; Stach et al. 2021). ADF22.A1 is located in the “cold in hot” regime, suggesting active cold accretion onto the galaxy regardless of the large halo mass.
We estimated the dark matter halo mass (|$M_{\rm h}$|) hosting ADF22.A1 utilizing the empirical relation between the halo mass and flat rotation velocity for late-type galaxies (Katz et al. 2019):
where |$A=2.216\pm 0.208$| and |$B= 6.907\pm 0.471$| for the Navarro–Frenk–White halo profile (Navarro et al. 1996). Using the flat rotation velocity derived above, the relation gives log(|$M_{\rm h}/M_{\odot }$|) |$=$| |$12.9\pm 0.7$|. In figure 10, we plot the relation between redshift and dark matter halo mass, comparing with model tracks of the mass growth of dark matter halos and derived values in previous works for host halos of DSFGs with clustering analysis (Stach et al. 2021) or decomposition of rotation curves (Rizzo et al. 2020, 2021; Lelli et al. 2021). The host halo of ADF22.A1 is one of the most massive halos known at |$z\simeq 3$| and also the most massive among host halos of DSFGs in the early universe. ADF22.A1 corresponds to the “cold in hot” regime as marked in figure 10. This suggests that while ADF22.A1 resides in a very massive halo, cold mode accretion can still survive to provide fuel and angular momentum for the galaxy. Intriguingly, ADF22.A1 resides in the massive halo, which is associated with plentiful cool gas visible as a Mpc-scale network of Ly |$\alpha$| filaments (Umehata et al. 2019). Such an environment is predicted to sustain efficient cold gas accretion.
In addition to cold accretion, there is another possible contributor. Mergers of gas-rich spiral galaxies are considered to converge to a larger, massive spiral disk satisfying the |$M_*$|–|$j_*$| relation (Hopkins et al. 2009). Mergers may hence account for the nature of ADF22.A1, coupled with the formation of gas-rich, rapidly rotating pre-merger galaxies from cold accretion. The resultant giant gas disk has a significant amount of molecular gas mass while the rotation velocity is large. As a consequence, the Toomre |$Q$| parameter is below unity, as estimated in subsection 3.6, and can show starburst nature due to disk instability.
4.2 Bar-driven bulge formation
4.2.1 A bar traced in the dust continuum
We further explored the inner regions of the galaxy where dust emission is concentrated. The |$0{^{\prime \prime }_{.}}08$|-resolution 1.1 mm dust continuum map shows that ADF22.A1 has a bright dusty core (with the effective radius), accompanied by a pair of curved dust lanes at a scale of |$r\approx 3.3$| kpc. The spatial relation between the spiral arms and the dusty core and dust lanes in ADF22.A1 is illustrated in figure 11a, while the structure of the dust emission is shown in figure 11b. As illustrated, the high-fidelity 1.1 mm dust continuum image of the inner region uncovers a pair of curved dust lanes located on the leading side, associated with the central, dusty core. The same structure is present in the 630 |$\mu$|m map, demonstrating that these structures are securely detected. The dust lanes are called “offset ridges,” which form on the leading side (Athanassoula 1992). Such ISM structures are a common feature seen in local barred spiral galaxies and have been reproduced by numerical and analytical calculations, including the cloud-orbit and hydrodynamical shock wave models (Contopoulos & Papayannopoulos 1980; Binney et al. 1991; Athanassoula 1992; Schinnerer et al. 2023). Thus the resolved structure traced by the dust continuum shows that ADF22.A1 has a bar.
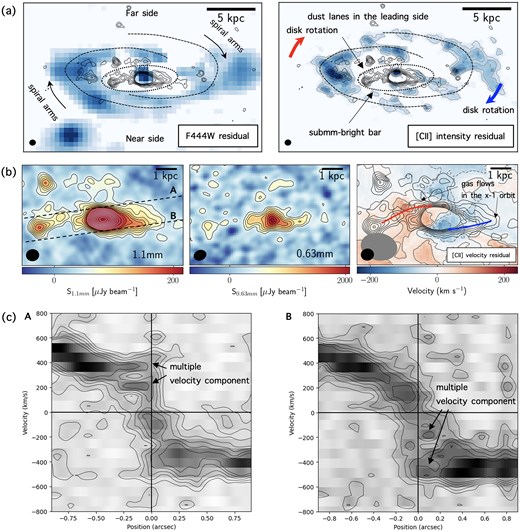
(a) Residual images of F444W and [C ii] intensity maps after subtracting the best-fitting models. The dashed lines and ellipticals outline spiral arms and the bar region. Dust lanes are visible on the leading side, as are seen in local barred galaxies (Athanassoula 1992). The contours are ALMA 1.1 mm as explained below. (b) The left panel shows the ALMA 1.1 mm dust continuum image at |$0{^{\prime \prime }_{.}}07$| toward the central region. The black contours are in |$1\, \sigma$| steps from |$3\, \sigma$| to |$10\, \sigma$|, while the white contours are in steps of |$2\, \sigma$| from |$12\, \sigma$|. A compact dusty core and accompanying offset ridges in a bar are discovered. The central panel shows the case of a 630 |$\mu$|m dust continuum map. The contours show |$2\, \sigma , 3\, \sigma , \ldots , 10\, \sigma$|. The dusty core and dust lanes are detected independently at the two different wavelengths. The right panel shows the residual [C ii] velocity field after subtraction of the best-fitting model in the same field as the two leftmost panels. The twisted pattern is coincident with the offset ridges, indicating that gas flows in the |$x-1$| orbit in the bar is likely to be responsible for the non-circular motion. (c) Two PV diagrams along the offset ridges. The positions are shown in panel (b) as “A” and “B.” In both cases, multiple velocity components are identified along the offset ridges. Gas flows in the bar [panel (b)] have a smaller velocity than the bulge or disk [panel (a)], which causes multiple velocity components in the bar region.
The existence of bars in star-forming galaxies at high redshift have been discussed in previous works (e.g., Costantin et al. 2023a; Tsukui et al. 2024). Bars are suggested based on elongated morphology in dust emission (Hodge et al. 2019; Gullberg et al. 2019), though signatures are not seen in stellar emission (Hodge et al. 2025), while the morphology of stellar emission shows hints of a bar in some DSFGs (Smail et al. 2023; Huang et al. 2023). ADF22.A1 shows the most detailed map of dust emission in DSFGs, allowing us to delineate the offset ridges in the bar. The profile fit for the dusty core in the high-angular-resolution image (|$0{^{\prime \prime }_{.}}04$|) shows |$r_{\rm e}=670\pm 30$| pc and |$n=0.6\pm 0.1$|. The bar length is roughly estimated as the major axis of the elliptical aperture that encompasses the offset ridges delineated with 1.1 mm dust continuum (figure 11a). The estimated bar size is |$r\approx 3.3$| kpc.
The bar structure is not clearly visible in other tracers, including stellar light or [C ii] intensity, as has also been reported for some DSFGs (Hodge et al. 2025). This is most likely due to severe dust attenuation. The fact that the region is bright in the dust continuum indicates that dust obscuration is significant. A similar situation, a visible dust bar which is not seen in stellar light due to high extinction, is reported for the local barred spiral NGC 253 (Jarrett et al. 2003). While the F444W image allows us to observe |$\sim$|11 000 Å at rest frame, this is insufficient to overcome the high dust extinction. The second angular resolution of the two tracers, |$0{^{\prime \prime }_{.}}2$| (1.5 kpc), may not be sufficiently fine to resolve the inner structure that is visible with the |$0{^{\prime \prime }_{.}}07$| (500 pc) resolution.
4.2.2 A bar traced in gas kinematics
The offset ridges in the bar spatially coincide with the twisted pattern of the non-circular motion in the [C ii] velocity field (figure 1d). The right panel of figure 11b shows the residual velocity map at |$0{^{\prime \prime }_{.}}2$| after subtracting a model derived with |$^\mathrm{3D}$|barolo, together with the 1.1 mm dust continuum contours. As shown, both approaching and receding gas motion is detected, bracketing the central dusty core. To further diagnose the origin of the non-circular motion, we derived two PV diagrams along the offset ridges (A is on the side associated with the receding gas flow, while B is on the other side connected with the approaching gas flow, figure 11c). As shown, it is found that there are multiple velocity components in the inner region (|$r\lesssim 0{^{\prime \prime }_{.}}4$|). In addition to a high-velocity component whose velocity is equivalent to that of the outer regions, a low-velocity component is found on both sides. This is what is expected in the gas flow in the |$x-1$| orbit along the bar potential toward a core (e.g., Schinnerer et al. 2023). Gas clouds flow toward the core along the offset ridge in the rotating frame with a bar pattern speed. The line-of-sight velocity of the gas flow is governed by the bar pattern speed in the innermost region, which appears as low-velocity components in the bar region (Hirota et al. 2009).
Hence, as summarized in figure 11, there is gas inflow along the offset ridges toward the dusty core, in addition to the disk rotation. While the moderate spatial resolution of the [C ii] data allows significant blending from both components in the region, the disk rotation and bar flow has different velocities as described above, which are identified as multiple velocity components and a non-circular motion with the twisted pattern. This finding strongly supports the theoretical expectation that bars drive gas inward from the disk, triggering central star formation and contributing to the growth of pseudobulges in disk galaxies (Kormendy & Kennicutt 2004). Cosmological simulations predict that a gas-rich, short-lived (|$t\lesssim 1$| Gyr) bar forms in response to various perturbations, including cold accretion from the filaments and mergers (Bi et al. 2024), which can account for the case of ADF22.A1.
4.2.3 Contribution from AGNs
ADF22.A1 harbors an obscured AGN at the center (Tamura et al. 2010; Monson et al. 2023), and AGN outflow may offer another mechanism to cause a non-circular motion. While it is challenging to determine such a contribution from AGN outflow to the [C ii] velocity field in ADF22.A1, we note that a typical biconical outflow which is perpendicular to the disk plane is unlikely to produce the non-circular motion. Considering the configuration that the southern side is the near side and the north side is the far side from us, which is determined by the combination of the velocity field and the pattern of spiral arms (Genzel et al. 2023), such an outflow would show a blue-shifted component in the north and a red-shifted component in the south. This is opposite of what is observed. Furthermore, the observed non-circular motion is caused by low-velocity components, which is different from the fast AGN outflows often observed in AGN-host galaxies (Übler et al. 2024). Thus, the observational evidence obtained so far suggests that any outflow from the AGN is not dominating the [C ii] kinematics.
4.3 Co-evolution in the hidden early phase
ADF22.A1 is known to harbor a heavily obscured, but intrinsically X-ray bright (|$\log L_X=44.3$| erg s|$^{-1}$|; Tamura et al. 2010; Monson et al. 2023) active galactic nucleus, and hence active accretion onto its central supermassive black hole is expected in the bright dusty core. We investigated the relation between the SMBH mass and total stellar mass/bulge mass of ADF22.A1. These masses are derived based on the SED fit as described above. We plot the two ratios in figure 12. For comparison, we also show the relation for the total galaxy mass for both spiral galaxies and ellipticals in the local universe. Data for individual galaxies and best-fitting functions are adopted from a recent review (Greene et al. 2020 and references therein).
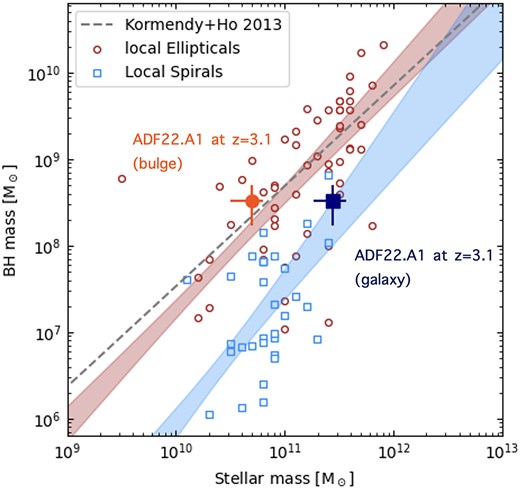
Relationship between stellar (bulge) mass and SMBH mass for local galaxies (Greene et al. 2020). Individual galaxies and best-fitting functions for spiral galaxies (blue) and elliptical galaxies (red) are shown. In the case of ADF22.A1 at |$z=3.1$|, the relation is consistent with local spirals for the whole galaxy, while the ratio resembles ellipticals when comparing bulge mass.
As shown, the total galaxy mass–SMBH mass relation is consistent with that measured for local spirals, suggesting a relatively overmassive stellar mass compared with the relation for local ellipticals. This trend is consistent with previous results which report a similar trend for DSFGs at |$z\sim 2$| (Alexander et al. 2008). If we only focus on the bulge components, on the other hand, the mass ratio between the SMBH and bulge masses, |$M_{\rm BH}/M_{\rm bulge}$|, matches that of local ellipticals (Kormendy & Ho 2013; Greene et al. 2020; see figure 12). This suggests that the co-growth of bulges and SMBHs can occur during the early formation phase at |$z\approx 3$|, driven by bar structures. This furthermore indicates that subsequent reconfiguration of the stellar mass in the current disk component of ADF22.A1 into a pressure-supported spheroid must also be associated with further growth of the SMBH.
4.4 Evolution into local massive ellipticals
ADF22.A1 is the most massive and active galaxy in the SSA22 proto-cluster core (Umehata et al. 2015; Monson et al. 2023) and a plausible analog for the progenitors of the most massive elliptical galaxies in today’s dense clusters, such as Brightest Cluster Galaxies (BCGs), including cD galaxies. The results presented here give unique insights into the evolution of the most massive galaxies and SMBHs.
ADF22.A1 is a spiral galaxy, although it is located in a proto-cluster core. This exhibits an inverse relation between galaxy morphology and environment compared with the local clusters (Dressler 1980), indicating that the most massive galaxies in overdense environments must evolve from late-type rotationally dominated disks to early-type dispersion-dominated ellipticals.
To achieve this, ADF22.A1 will have to experience a significant loss of angular momentum. The EAGLE simulation suggests that bulge-dominated galaxies (with bulge-to-total stellar mass ratio |$B/T>0.5$|) lose the majority of their specific stellar angular momentum (|$80\%$| is the median value) from “turnaround” (at |$z\sim 3$|) to |$z\sim 0$| (Zavala et al. 2016), associated with mergers of galaxies and dynamical friction during the inner dark matter halo’s assembly (Lagos et al. 2017, 2018). In figure 9b, we plot a predicted descendant at |$z=0$| of ADF22.A1, assuming that (i) the molecular gas mass is all converted into stars, (ii) other processes (additional inflow, mergers, outflows) do not affect the stellar mass of the descendant, and (iii) 80% of the specific stellar angular momentum is lost. As shown, the net loss predicted by the simulation sufficiently reduces the angular momentum to the levels seen in elliptical galaxies.
5 Conclusion
We present JWST NIRCam imaging and ALMA imaging spectroscopy to resolve the inner structures and kinematics on (sub-)kpc scales in a bright DSFG located at the core of a |$z=3.09$| proto-cluster. Our main findings include:
NIRCam images reveal a spiral-like stellar structure tracing rest-frame optical-to-near-infrared emissions. The measured effective radius, |$r_{\rm e} = 7.0 \pm 0.1,\mathrm{kpc}$|, is more than twice the typical size of coeval, equally massive galaxies and is comparable to that of local galaxies at |$z = 0$|–1, suggesting accelerated size growth in the proto-cluster core.
The ALMA 870 |$\mu$|m image reveals that the dust continuum is not just concentrated in a core, as seen in some DSFGs, but is distributed across the disk. This indicates that active star formation is also occurring in the disk, accompanied by significant dust production. Statistical samples with resolved studies will reveal if this is general.
The [C ii] velocity field is primarily dominated by rotation, with non-circular motion also detected in the center. Kinematic modeling of the [C ii] emission reveals a flat rotation curve with |$V_{\rm rot} = 530 \pm 10$| km s|$^{-1}$| out to |$r\sim 15$| kpc, indicating that ADF22.A1 is an unusually fast-rotating, giant spiral galaxy.
The derived |$M_*$|–|$j_*$| relation tells us that ADF22.A1 at |$z=3.09$| follows the mass–spin–morphology relation seen in the local universe. This requires a mechanism to highly spin up the disk of ADF22.A1 only |$\sim$|2 billion years after the Big Bang. Cold accretion is the most plausible case, coupled with mergers.
A bright, compact dusty core is found at the galaxy’s center, indicating the active growth phase of a proto-bulge. The estimated mass ratio of the bulge to the SMBH aligns with the local relation, while the mass ratio of the entire galaxy to the SMBH matches that of local spirals. These results suggest the emergence of bulge–SMBH co-evolution at |$z \sim 3$|, driven by bars.
Comparison with the EAGLE simulation suggests that ADF22.A1 likely underwent significant angular momentum loss during halo assembly and associated mergers. Massive, giant spirals may represent an important early phase in the formation of BCGs and cD galaxies found in present-day cluster cores.
The data presented in this paper demonstrate the power of combining JWST and ALMA for well-resolved studies. Expanding the sample and obtaining higher-resolution observations will be crucial for deepening our understanding of the early formation phases of the most massive galaxies.
Acknowledgments
We thank the anonymous referee for constructive suggestions and comments. We thank Hidenobu Yajima for discussions on perspectives of simulations; Takuma Izumi for discussions on co-evolution; Fumi Egusa and Fumiya Maeda for discussions on local analogs of barred galaxies; and Tom Bakx for discussions on ALMA data reduction. This work is based on observations made with the NASA/ESA/CSA James Webb Space Telescope. The data were obtained from the Mikulski Archive for Space Telescopes at the Space Telescope Science Institute, which is operated by the Association of Universities for Research in Astronomy, Inc., under NASA contract NAS 5-03127 for JWST. These observations are associated with program #3547. This paper makes use of the following ALMA data: ADS/JAO.ALMA#2019.1.00008.S, 2021.1.00041.S, 2021.1.00071.S, 2019.1.00008.S, 2021.1.01406.S, 2022.1.00223.S. ALMA is a partnership of ESO (representing its member states), NSF (USA), and NINS (Japan), together with NRC (Canada), NSTC and ASIAA (Taiwan), and KASI (Republic of Korea), in cooperation with the Republic of Chile. The Joint ALMA Observatory is operated by ESO, AUI/NRAO, and NAOJ. The National Radio Astronomy Observatory is a facility of the National Science Foundation operated under cooperative agreement by Associated Universities, Inc. This work is based on the observations of the Karl G. Jansky Very Large Array (program ID: 16A-357; 21A-346). HU acknowledges support from JSPS KAKENHI Grant Numbers 20H01953, 22KK0231, 23K20240. KK acknowledges support from JSPS KAKENHI Grant Numbers 22H0493, 23K20035, 24H00004. DI acknowledges support from JSPS KAKENHI Grant Number 23K20870. This work was supported by NAOJ ALMA Scientific Research Grant Numbers 2024-26A. IS, AMS, DMA acknowledge STFC support (ST/X001075/1).
