


Abstract
It has been argued that SDSS J1430+2303 possesses a supermassive black hole binary that has been predicted to merge within a few months or three years from 2022 January. We have conducted follow-up optical spectroscopic observations of SDSS J1430+2303 with the KOOLS-IFU on the Seimei Telescope in 2022 May, June, and July, and 2023 April. The observed spectrum around Hα shows a central broad component ∼103 km s−1 blueshifted from the narrow Hα line, as well as a broader double-peaked component with a separation of ∼± 5 × 10³ km s−1, similar to the spectrum reported in 2022 January. We investigate the variability of the complex broad Hα emission line relative to the continuum over the observation period. The continuum-normalized relative flux of the central broad component shows an increasing trend from 2022 May to July, which is interpreted to be caused by the decrease of the continuum; this is also supported by damping of the X-ray, UV, and optical light curves observed for the same period. From 2022 July to 2023 April, however, the central broad component decreased significantly. For the relative flux of the broader double-peaked component, no significant change appears at any epoch. These results suggest that the complicated broad line profile of SDSS J1430+2303 is generated from at least two distinct regions. While the central broad component originates from a broad-line region, the broader double-peaked component arises in the vicinity of the continuum source.
1 Introduction
Active galactic nuclei (AGNs) play an important role in helping us to understand the growth of supermassive black holes (SMBHs) and their relationship with the host galaxies. A crucial question is how SMBHs formed and evolved in the hierarchical growth of galaxies in the universe (Silk & Rees 1998; Hopkins et al. 2008; Kormendy & Ho 2013). While SMBHs are formed in galaxies and they increase their mass with subsequent gas accretion events, they can also grow with the merging of the galaxies that already host the SMBH (Rees 1984).
More than a few supermassive black hole binary (SMBHB) systems and candidates have been identified and extensively studied so far (Begelman et al. 1980; Roos 1981; De Rosa et al. 2019; Sillanpaa et al. 1988; Bhatta et al. 2016; Dey et al. 2019; Komossa et al. 2021). They are observationally characterized by the resolved close pair of AGNs or more typically the existence of double-peaked emission lines, and sometimes by the distinctive quasi-periodic photometric light curves (Shen & Loeb 2010). The orbital motion of SMBHBs may also affect their broad emission-line profiles and cases have been observed where broad lines significantly shifted from the narrow lines (Shen & Loeb 2010; Popović 2012).
SDSS J143016.05+230344.4 (hereafter SDSS J1430+2303, also known as AT2019cuk and Tick Tock) is a Seyfert1 galaxy at redshift 0.08105 with AB magnitude ∼16.5 in the r band. It is argued that it possesses an SMBHB system just before coalescence (Jiang et al. 2022). From the rapid decay of the amplitudes and periods of the light curves in X-ray, UV, and optical wavelengths observed by 2022 January, it has been predicted that the SMBHB in SDSS J1430+2303 could coalesce within ∼100 d or 3 yr (Jiang et al. 2022). However, recent follow-up observations suggest that the optical light curve is hardly explained by the binary scenario (Dotti et al. 2023). It is interesting to note that the optical broad emission-line profile of this object also dramatically changed between 2005 and 2022. While the spectrum of SDSS J1430+2303 taken in 2005 showed only one broad line, which is blueshifted (∼2400 km s−1) from the narrow Hα line, the spectrum taken in 2022 January showed drastically changed puzzling profiles of a broad line that is blueshifted (∼900 km s−1) from the narrow Hα line together with the component that is represented by a pair of two broad lines with symmetry (Jiang et al. 2022). Such abrupt changes in the broad line profile are considered quite unique even among the AGNs with the most prominent line profile variations, and it is important to monitor this phenomenon over a sufficiently long timescale, whether or not it is directly related to the predicted SMBHB coalescence itself.
A subclass of AGNs is also known to show changes in their broad emission lines in the UV/optical spectrum and these are called changing-look (or changing-state) AGNs (MacLeod et al. 2016; Stern et al. 2018; MacLeod et al. 2019; Ross et al. 2020; Ricci & Trakhtenbrot 2023). Although the physical origins of changing-look AGNs are still under debate, this phenomenon can be related to the change in the accretion rate (Graham et al. 2020). While SDSS J1430+2303 can be broadly categorized as a changing-look AGN, the origin of the broad line variation may differ from that of changing-look AGNs where typically a single broad emission appears or disappears and such a drastic change of the velocity profile in SDSS J1430+2303 is rarely observed.
In this paper, we report our results of optical spectroscopy of SDSS J1430+2303 at the Hα wavelength region over four epochs from 2022 May to 2023 April. We show that the overall line structure is similar to that observed in 2022 January but that there is a significant change in part of the broad components.
Throughout this paper, we assume ΛCDM cosmological parameters of Ωm = 0.3 and |$\Omega _\Lambda =0.7$|, and a Hubble constant H0 = 70 km s−1 Mpc−1. We use the AB magnitude system.
2 Observations and data reduction
SDSS J1430+2303 was observed with the KOOLS-IFU, which is a fiber-fed integral field spectrograph mounted on the 3.8 m Seimei telescope (Matsubayashi et al. 2019; Kurita et al. 2020). The instrument consists of 110 fibers for objects (after 2020 October), which achieves a total field of view (FoV) of 8.4 × 8.0 arcsec2. We conducted the spectroscopic observations on 2022 May 27, June 18 (Proposal ID, 22A-K-0029; PI, Ohta), and July 28 (Proposal ID, 22B-N-CN05; PI, Hoshi), and 2023 April 17 (Proposal ID, 23A-N-CT01; PI, Hoshi). These observation epochs are denoted as (a), (b), (c), and (d). The information of the observations is summarized in table 1. We used the VPH-blue (4100–8900 Å) and VPH683O56 (6200–7500 Å) grisms. The spectral resolution (R = λ|$/$|Δλ) of VPH-blue and VPH683O56 is R ∼ 500 and R ∼ 2000, respectively.
Summary of the observations.
| Epoch | Proposal ID | Date | MJD | From 2022 Jan 1 | Grism | Total exposure | Standard star |
|---|---|---|---|---|---|---|---|
| (a) | 22A-K-0029 | 2022 May 27 | 59726 | 146 d | VPH-blue | 1800 s | HZ 44 |
| (b) | 22A-K-0029 | 2022 June 18 | 59748 | 168 d | VPH683O56 | 3600 s | BD|$\, +33^\circ$|2642 |
| (c) | 22B-N-CN05 | 2022 July 28 | 59788 | 208 d | VPH-blue | 1800 s | BD|$\, +33^\circ$|2642 |
| (d) | 23A-N-CT01 | 2023 April 17 | 60051 | 471 d | VPH-blue | 1800 s | BD|$\, +33^\circ$|2642 |
The data reduction, such as spectrum extraction, flat fielding, and wavelength calibration, was performed by using PyRAF, a Python package developed by the Space Telescope Science Institute (STScI) using the scripts developed for the KOOLS-IFU. Spectroscopic standard stars, HZ44 and BD|$\, +33^\circ$|2642, were observed for relative flux calibration over the observed wavelength ranges (Oke 1990). We also corrected the atmospheric absorption around the redshifted Hα lines. For all the observation epochs, flat-fielding frames were created by using the twilight sky and the wavelength calibration was performed by using the arc lamps (Hg, Ne, Xe). The wavelength sampling is typically ∼2 Å per pixel and the wavelength determination accuracy is ∼0.25 Å. Median stacking was used to remove cosmic rays.
3 Results and discussion
3.1 Broad line decomposition
In order to investigate the variability of the broad Hα emission line, we present the continuum-normalized spectra in figure 1 (left panel). Using the curve_fit function from the scipy module (Virtanen et al. 2020) in Python, we determined the relative flux (R(i)), which is normalized by the continuum. The index i corresponds to each epoch (a), (b), (c), and (d). The continuum, which includes both the AGN and the host galaxy components, was derived by fitting the spectrum within the wavelength ranges of 6150–6250 Å and 6850–6950 Å using a linear function. We also show the AGN continuum-normalized spectra (|$R^{\prime }_{(i)}$|) after subtracting the host component in figure 1 (upper-right panel). Because SDSS J1430+2303 is classified as a typical elliptical galaxy (Jiang et al. 2022), the host contribution is estimated by the equivalent width (EW) of the Na D absorption line using a template spectrum of the elliptical galaxy in Kinney et al. (1996). Although the Na D absorption may suffer from interstellar absorption, its wavelength is close to that of Hα, and here we ignore the Na D interstellar absorption, which corresponds to the case of maximum contribution of the host component. Unfortunately, we are not able to estimate the fraction of the host galaxy in epoch (b) because of the limited wavelength coverage of the VPH683O56 grism. The lower-right panel in figure 1 shows the light curves in the r band and X-ray during the observation period up to epoch (c) from Masterson et al. (2023).
![Left panel: Continuum-normalized spectra R(a) + 0.9, R(b) + 0.6, R(c) + 0.3, and R(d). The spectra observed in epochs (a), (b), (c), and (d) correspond to the orange, gray, red, and blue lines. Right panel: AGN continuum-normalized spectra $R^{\prime }_{(a)}$, $R^{\prime }_{(c)}$, and $R^{\prime }_{(d)}$ after subtracting the host component are shown in the upper panel. In epoch (b), the host component is not measured because of the limited wavelength coverage. The light curves of SDSS J1430+2303 in the r band and X-ray at around the observed epochs [refer to Masterson et al. (2023)] are shown in the lower panel.](https://oup.silverchair-cdn.com/oup/backfile/Content_public/Journal/pasj/76/1/10.1093_pasj_psad083/1/m_psad083fig1.jpeg?Expires=1747971520&Signature=gmpYzwCHNUJCP341ewNSDt9uJLPW7LkCRZmOItZvpEghn81agiV7J1s6vHs~EDJ91stRE-I6qXMmK195SXM8P3moprjoRgEPXP0JDIeh4PH9aW53RCalNXfB-b628omDWh~fkSO12G6qQWprdhSqRPPI4ZHxztZsZSrldNjsJCWQYP7JcC9W~wgII0~p~mt68qXHYqkzsTmdep4i9gx9u~BoGtmzwBVW5HnR186TPXdfQv7turfNvSWfpP-Oagq7h7niP16-4KinGjrHK0Kl19Sr3um~P4JtQmSuNDlP--aDuWraqfkaylbKW2DWlC7o-Vk9vFwN8ZNPQUwWF6nO-w__&Key-Pair-Id=APKAIE5G5CRDK6RD3PGA)
Left panel: Continuum-normalized spectra R(a) + 0.9, R(b) + 0.6, R(c) + 0.3, and R(d). The spectra observed in epochs (a), (b), (c), and (d) correspond to the orange, gray, red, and blue lines. Right panel: AGN continuum-normalized spectra |$R^{\prime }_{(a)}$|, |$R^{\prime }_{(c)}$|, and |$R^{\prime }_{(d)}$| after subtracting the host component are shown in the upper panel. In epoch (b), the host component is not measured because of the limited wavelength coverage. The light curves of SDSS J1430+2303 in the r band and X-ray at around the observed epochs [refer to Masterson et al. (2023)] are shown in the lower panel.
The spectra in the Hα region exhibit a consistently complicated profile over all epochs. To decompose the possible multiple components, we fit the spectra using a linear continuum in the range 6100–7000 Å and simple multiple Gaussian components in the Hα region. The velocity widths of the five narrow emission lines, namely, Hα, [N ii]λλ6548, 6583, and [S ii]λλ6717, 6734 are fixed at the same value for each epoch. The flux ratio |${{\rm [N\,{\small II}}]\lambda 6583}/{{\rm [N\,{\small II}]}\lambda 6548}=4.26$| is fixed with the typical composite quasar spectra from the Sloan Digial Sky Survey (SDSS; Vanden Berk et al. 2001). The [O i]λ6300 line is also fitted simultaneously, but the velocity width is not fixed.
The broad Hα feature can be fitted by the combination of the central component (hereafter referred to as BL1) with FWHM ∼5 × 10³ km s−1, which is ∼103 km s−1 blueshifted from the narrow Hα line, and a symmetrical wing-like pair of the blueshifted and redshifted (−7 × 10³, +5 × 10³ km s−1) components (hereafter referred to as BL2), as suggested by Jiang et al. (2022) for the spectra taken in 2022 January. For the component BL2, symmetrical profiles with two peaks of the same width and intensity provide reasonable fitting results for the spectrum at each epoch. The obtained velocity width of the each BL2 peak is ∼4 × 10³ km s−1. We show the best-fitting result and a representative continuum-normalized spectrum of SDSS J1430+2303 at epoch (c) in figure 2 for an example.
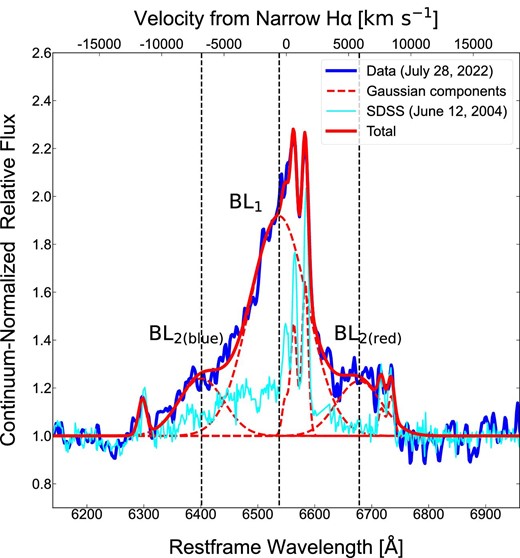
Broad Hα profile of SDSS J1430+2303. The blue and cyan lines show the observed spectrum, which is normalized by the total continuum on epoch (c) and on the 2004 June 12. The red dashed and solid lines represent each Gaussian component and the sum of all the models. The narrow Hα line is set to 0 km s−1. The centers of BL1 and BL2 are plotted by the vertical dashed line. The components BL1 and BL2 can be fitted with the velocity widths 5 × 10³ and 4 × 10³ km s−1.
3.2 Variability of the broad-line region
Figure 3 shows the differences in the relative flux spectra from epoch to epoch. In order to show the significance of the features, we normalized the residuals by the standard deviation values measured at the wavelength ranges used for the continuum fitting. Note that the standard deviation of R(b) in the continuum is 0.20, which is more than twice as large as those of the other epochs (0.08, 0.06, and 0.07 for R(a), R(c), and R(d), respectively), as it was obtained using a different higher dispersion grism, VPH683O56. The red histograms represent the residuals in 10-Å bins. For comparison, we also show the mean values of the central wavelength of BL1, BL2(blue), and BL2(red) in all epochs using vertical dashed lines.
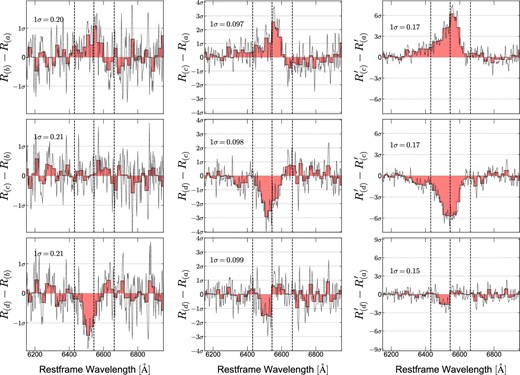
Left and middle columns: Significance of broad line variations in the continuum-normalized spectra. Black solid lines show the significance of the difference in the relative flux R(i) and R(j). 1σ is a standard deviation of R(i) and R(j) in the wavelength ranges 6150–6250 and 6850–6950 Å. Each histogram shows the difference in the relative flux R(i) and R(j) with 10 Å bins. The mean values for the center of BL1, BL2(blue), and BL2(red) are plotted by the vertical dashed lines. While each bin does not exceed 3σ, the continuous change around the central wavelength of BL1 is significant. The BL1 component exhibits a significant variation around 6550 Å, whereas the BL2 component remains invariant. Right column: Significance of broad line variations in the AGN continuum-normalized spectra of |$R^{\prime }_{(i)}$|.
We found significant positive or negative variations in the broad line features (BL1). The relative line flux at around 6550 Å increases from epoch (a) to (b), and (a) to (c) in the top panels of the left and middle columns. The peak of the variation nearly coincides with the center of BL1. No significant variation is observed between epochs (b) and (c) in the middle left panel. The relative flux in epoch (d) is reduced compared with other epochs, leading to negative variations around 6500 Å.
Such variations in the relative flux must occur as a result of the time lag between AGN continuum variations and the response by the ionized gas. Therefore, the central broad component BL1, which shows the variability of the relative flux, is considered to originate from a distant region from the central continuum source, such as a broad-line region. It is interesting to note that these variations are observed only within the limited wavelength range of the broad Hα line, implying that the complicated broad emission-line feature of SDSS J1430+2303 can be physically decomposed into multiple components. Given that there is no significant variation in the relative flux around the two peaks of BL2(blue) and BL2(red) in figure 3, it suggests that the broad lines respond rapidly to the change of the continuum flux. This feature must originate from the vicinity of the continuum source, significantly closer than a few tens of light days. In addition to the variability of the relative flux, we also found that there is a wavelength shift between the peaks of the positive residual from epochs (a) to (c) and of the negative residual from epochs (c) to (d). This shift can be interpreted as the change of broad-line region profile responsible for BL1, suggesting that the gas in the region changes its kinematic profile within a yearly observation timescale. Similar variations are observed in the AGN continuum-normalized spectra after subtracting the host galaxy component, as shown in the right column of figure 3.
SDSS J1430+2303 is observed in the X-ray and optical wavelength for more than 200 d since 2022 January 1. The light curve in the X-ray and optical bands shows a continuous decline from the 156th day, when the large flare occurred, to the 200th day (Masterson et al. 2023). The increase of the relative flux R(i) at around the wavelength of 6550 Å from epoch (a) to (b) and (c) is attributed to the continuous decline of the continuum—epochs (a) and (c) correspond to the 146th day and the 208th day after 2022 January 1, respectively. Quantitatively, the continuum flux in the r band, including the host galaxy, decreased by ∼10% from epoch (a) to (c) (Masterson et al. 2023). This decrease contributes to the positive residual of the peak relative flux of BL1 by ∼0.2 (10% of ∼1.8; see the BL1 component in figure 2). The decrease of R(i) at around the wavelength of 6500 Å from epoch (c) to (d) suggests the recovery of the continuum flux after epoch (c). However, it should be noted that no information regarding the light curves in 2023 is available at the time of writing this paper.
We refrain from further speculation on questions such as why the BL1 and BL2 structures appeared in the recent spectra in 2022, the origin of the BL2, and whether these variations are related to the claimed SMBHB merging event or not. To understand the complexity of the line profiles and their physical origins, it is essential to continue monitoring the further variation of this interesting object SDSS J1430+2303.
Acknowledgments
We thank Kyoto University and the National Astronomical Observatory of Japan (NAOJ) for their help, advice, and cooperation at the Seimei Telescope Observatory. This work was supported by the Japan Science and Technology Agency (JST), the establishment of university fellowships towards the creation of science technology innovation, Grant Number JPMJFS2102. This publication is based upon work supported by KAKENHI (22K03693) through the Japan Society for the Promotion of Science.
