


Abstract
Hadronic γ-ray sources associated with supernova remnants (SNRs) can serve as stopwatches for the escape of cosmic rays from SNRs, which gradually develops from highest-energy particles to lowest-energy particles with time. In this work, we analyze the 13.7 yr Fermi-LAT data to investigate the γ-ray feature in/around the SNR G298.6−0.0 region. With γ-ray spatial analyses, we detect three point-like components. Among them, Src-NE is at the eastern SNR shell, and Src-NW is adjacent to the western edge of this SNR. Src-NE and Src-NW demonstrate spectral breaks at energies around/below 1.8 GeV, suggesting an old SNR age of >10 kyr. We also look into the X-ray emission from the G298.6−0.0 region, with the Chandra-ACIS data. We detected an extended keV source having a centrally filled structure inside the radio shell. The X-ray spectra are well fitted by a model which assumes a collisional ionization equilibrium of the thermal plasma, further supporting an old SNR age. Based on our analyses of the NANTEN CO- and ATCA-Parkes H i-line data, we determined a kinematic distance of ∼10.1 kpc from us to G298.6−0.0. This distance entails a large physical radius of the SNR of ∼15.5 pc, which is additional evidence for an old age of >10 kyr. Besides this, the CO data cube enables us to three-dimensionally locate the molecular clouds (MCs) which are potentially interacting with SNR G298.6−0.0 and could account for the hadronic γ-rays detected at Src-NE or Src-NW. Furthermore, the multiwavelength observational properties unanimously imply that the SNR–MC interaction occurs mainly in the north-eastern direction.
1 Introduction
Synchrotron X-rays (Koyama et al. 1995) and GeV–TeV γ-rays (e.g., Aharonian et al. 2004; Acero et al. 2016) from the regions of supernova remnants (SNRs) indicate that the shock fronts of SNRs are powerful sites of cosmic-ray acceleration. When a hadronic cosmic-ray particle (usually a proton or an atomic nucleus) from an SNR collides with gas in the interstellar medium, a neutral pion is produced and quickly decays into two γ-ray photons that we can observe. However, the escape of accelerated particles from SNR shocks remains an undetailed process.
γ-ray spatial analyses enable us to compare the γ-ray morphology of an SNR-associated source with the SNR morphologies in the radio continuum and X-ray, as well as the molecular cloud (MC) distributions traced by radio line emissions and the shock–cloud interaction sites indicated by “maser” spots. It is interesting to note that the γ-ray location of such a source can generally be offset from the SNR shell yet be more consistent with a MC clump. The γ-ray emissions associated with RX J1713.7−3946 (figure 1 of Fukui et al. 2012), Kes 79 (figure 2 of He et al. 2022) and Kes 41 (figure 1 of Liu et al. 2015) are conspicuous examples of this phenomenon, which representatively agrees with the fact that pion decays occur at proton collision sites (MCs) rather than the proton acceleration site (SNR shock). More accurately speaking, in a hadronic model for an SNR–MC system, the actual γ-ray emitters are the MCs impacted by the SNR-accelerated cosmic-ray protons, in addition to a radiative shell behind the SNR shock. We will also embrace this concept when interpreting the γ-rays from our targeted regions.
Spectral breaks in the GeV γ-ray band (Acero et al. 2016) are common signatures of SNR–MC interaction systems observed by the Fermi Large Area Telescope (Fermi-LAT), reflecting the escape of over-energetic particles from the vicinities of SNRs. More interestingly, there have been a number of attempts to formulate the relation of the γ-ray spectrum with the SNR age (e.g., Dermer & Powale 2013; Bamba et al. 2016; Zeng et al. 2019; Suzuki et al. 2020, 2022). All these studies point to a trend that, as an SNR grows older, the γ-ray spectrum of the SNR–MC source becomes softer and the spectral peak shifts to a lower energy. Such an observed trend is consistent with a theoretical prediction that the escape of cosmic rays from SNRs gradually develops from highest-energy particles to lowest-energy particles with time (Ptuskin & Zirakashvili 2003, 2005). Hence, SNR–MC interaction sources can serve as stopwatches for this escape process. In particular, it is important for us to investigate γ-rays from regions of old (≳10 kyr) SNRs more deeply, for the sake of figuring out the later evolution stages of the escape.
SNR G298.6−0.0 was detected by Molonglo at 408 MHz and by MOST at 843 MHz, and was found to have a flat radio spectral index of −0.3 (Shaver & Goss 1970; Kesteven & Caswell 1987; Whiteoak & Green 1996). Reach et al. (2006) claimed a possible detection of infrared emission from the direction of G298.6−0.0, suggesting an encounter between the SNR shock and a high-density medium. These conditions set up an adequate environment for emitting GeV γ-rays, which are also detected by Fermi-LAT (Acero et al. 2016). Bamba et al. (2016) presented the first X-ray imaging spectroscopy for G298.6−0.0 using Suzaku data, and they characterize the X-rays from this SNR as thermal emissions of plasma in collisional ionization equilibrium. In addition, Bamba et al. (2016) found a centrally filled X-ray structure inside the radio shell, categorising G298.6−0.0 as a mixed-morphology (i.e., thermal composite) SNR. These X-ray properties suggest that this SNR is relatively older and thus ideal for our studies. Intriguingly, there has not yet been a published estimation of the age of G298.6−0.0, encouraging us to provide the very first constraints on its age.
To the south-west of G298.6−0.0 (about 0.°3 apart), there is another SNR—G298.5−0.3, detected by Molonglo and MOST at 408 MHz and 843 MHz, respectively (Shaver & Goss 1970; Whiteoak & Green 1996). A claimed possible detection of infrared emission from the direction of G298.5−0.3 (Reach et al. 2006) makes it likely to be associated with a GeV γ-ray source as well. In view of the relatively poor angular resolution of Fermi-LAT, the γ-rays at/around G298.5−0.3 contribute non-negligible contamination to the measurements of γ-ray properties of our targeted G298.6−0.0.
This paper reports our γ-ray observational results on the regions of SNR G298.6−0.0, SNR G298.5−0.3, and their vicinities (in subsection 3.1). Our X-ray (subsection 3.2) and radio (emission lines; subsection 3.3) observational results on G298.6−0.0 are also presented in this paper. We interpret the multiwavelength properties of G298.6−0.0 comprehensively, and propose the hadronic scenarios of SNR–MC interaction (in subsection 4.1). In turn, we estimate its age for the first time (in subsection 4.2). The interpretations for G298.5−0.3 are beyond the scope of this paper.
2 Observations and data reductions
2.1 Fermi-LAT γ-ray data
In this work, we use the Fermitools version 2.0.8 to reduce and analyze the Fermi-LAT data. We select Pass 8 (P8R3) “SOURCE” class events collected between 2008 August 4 and 2022 April 28. The region of interest (ROI) we choose is 21° × 21° centered at RA |$= {12^{\rm h}13^{\rm m}40{_{.}^{\rm s}}80}$|, Dec = −62°37′12.0″ (J2000.0). This ROI center is inside the radio dimension of SNR G298.6−0.0.
We perform a series of binned maximum-likelihood analyses, with an angular bin size of 0.°05 that is sufficiently small to sample the point-spread function (PSF) well at energies up to ∼20 GeV (see SLAC).1 To model the background better, the Galactic diffuse component (gll_iem_v07.fits), the isotropic diffuse component (iso_P8R3_SOURCE_V2_v1.txt), and the sources in the Fermi LAT 12-Year Point Source Catalog (4FGL-DR3; Abdollahi et al. 2022) are included as background sources in our analyses. We set the spectral parameters of the sources within 5.°5 from the ROI center (including the normalizations of the Galactic diffuse background and of the isotropic diffuse background) as free in each analysis. For the sources at angular separation beyond 5.°5 from the ROI center, their spectral parameters are fixed to the catalog values.
In the newest 4FGL-DR3 catalog, 4FGL J1213.3−6240e is assigned with a disk morphology enclosing SNR G298.6−0.0 and SNR G298.5−0.3. In this work, we decompose 4FGL J1213.3−6240e into a number of spatial components that we identify.
2.2 Chandra-ACIS X-ray data
With the aid of the CIAO version 4.14, we reprocess, reduce, and analyze the Chandra-ACIS data of the observation ID 14889. This dataset contains the events in/around the dimension of SNR G298.6−0.0. The observation started on 2013 September 3 at 12:34:17.
The data reprocessing is done with the CIAO command “chandra_repro” and the resultant exposure time is 20 ks. The command “fluximage” is operated on the event file to generate count maps, exposure maps, and flux maps (i.e., exposure-corrected maps). “specextract” is implemented to extract spectra for source regions and background regions. Then, Sherpa version 4.14.0 enables us to produce background-subtracted spectra and to perform spectral fittings on them.
2.3 NANTEN CO- and ATCA-Parkes H i-line data
In order to trace the spatial distribution of MCs and dense media at/around SNR G298.6−0.0, we reduce and analyze the 12CO(J = 1–0) (115 GHz) line data collected by NANTEN (Mizuno & Fukui 2004) as well as the combined ATCA-Parkes data of H i (1.4 GHz) line emissions provided by the Southern Galactic Plane Survey (SGPS; McClure-Griffiths et al. 2005). The angular resolution is 156″ for the NANTEN 12CO(J = 1–0) data and 130″ for the ATCA-Parkes H i data. The typical noise fluctuation per velocity resolution of 1 km s−1 is ∼0.2 K for the NANTEN CO data and ∼1.4 K for the ATCA-Parkes H i data. Each data cube has three dimensions: the right ascension, the declination, and the radial velocity with respect to the local standard of rest (VLSR).
3 Results of data analyses
3.1 Fermi-LAT results
3.1.1 γ-ray spatial morphology
In order to investigate the morphologies of γ-rays from this region, we create test-statistic (TS) maps in different energy bands (figure 1), where diffuse backgrounds and all 4FGL-DR3 catalog sources except 4FGL J1213.3−6240e are subtracted. We adopt only “PSF3” data for the best angular resolution. On each panel, we overlay the |$68\%$| containment circle of the PSF (see SLAC) at the applied minimum energy cut. Based on TS maps, we localize each centroid as a position with a peak TS value. Then, we inspect the TS distribution around each local peak, so as to determine the error circle of each centroid at the |$95\%$| confidence level for 4 d.o.f., where the TS value is lower than the local peak by 9.5.2 Additionally, we perform a likelihood ratio test to quantify the significance of extension for each identified sub-feature in this region.
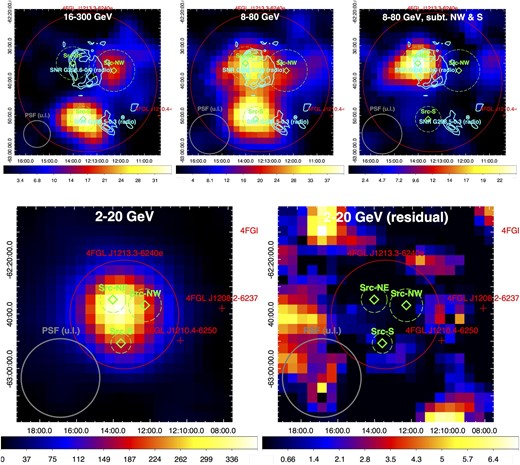
Fermi-LAT TS maps (for “PSF3” data in different energy bands) of the field around G298.6−0.0, where all neighboring 4FGL-DR3 catalog sources and diffuse backgrounds are subtracted. The top left-hand panel shows a 16–300 GeV TS map, which is used to determine the positions and |$95\%$| error circles of Src-NW and Src-S. The top middle panel shows an 8–80 GeV TS map. The top right-hand panel is also created with the same 8–80 GeV dataset, but Src-NW and Src-S are subtracted so that we determine the position and |$95\%$| error circle of Src-NE based on this map. The 2–20 GeV map is shown in the bottom left-hand panel, and its corresponding residual map after subtracting Src-NE, Src-NW, and Src-S is shown in the bottom right-hand panel. On each panel, the grey thick circle indicates the |$68\%$| containment size of the PSF (taken from SLAC2) at the applied minimum energy cut, and the positions (and dimensions) of 4FGL-DR3 catalog sources are indicated in red. The MOST 843 MHz radio contours of SNR G298.6−0.0 and SNR G298.5−0.3 (Whiteoak & Green 1996) are overlaid in cyan on the top panels.
We started with analysing the >16 GeV data whose PSF diameter is less than one-fifth of that of 4FGL J1213.3−6240e. As shown on the 16–300 GeV TS map, there are two centroids whose angular separation exceeds the PSF diameter. When we replace the catalogued extended source 4FGL J1213.3−6240e with two sources at the centroids, the maximum likelihood fit is improved with |$2\Delta \rm {ln}(\mbox{likelihood})= 17.1$| (corresponding to 3.7σ for 2 d.o.f.). For each spatial component, any extended morphology yields a |$2\Delta \rm {ln}(\mbox{likelihood})$| of only <0.02 relative to the point-source model. Therefore, we model them as point sources, namely Src-NW (the north-western component) and Src-S (the southern component), in what follows. We note that Src-NW at (183.°0752744, −62.°6203894)J2000.0 is only |$\sim {3{^{\prime }_{.}}5}$| from the western edge of our targeted SNR G298.6−0.0, and Src-S at (183.°394902, −62.°8528466)J2000.0 is only ∼5′ from the eastern edge of the other SNR G298.5−0.3.
In order to address the bias induced by the reduced photon statistics, we also look into the >8 GeV data which maintains a small PSF diameter, |${<}30\%$| of that of 4FGL J1213.3−6240e. From the 8–80 GeV TS map, we found an additional north-eastern component, namely Src-NE, which is spatially coincident with the eastern radio shell of SNR G298.6−0.0. Then, we re-create this map by subtracting Src-NW and Src-S, so as to localize the centroid of Src-NE, (183.°5018108, −62.°5858333)J2000.0, which remains at a high detection significance of ∼4.9σ. When we replace 4FGL J1213.3−6240e with Src-NE, Src-NW, and Src-S, the maximum likelihood fit is improved with |$2\Delta \rm {ln}(\mbox{likelihood}) = 12.9$| (corresponding to 2.52σ for 4 d.o.f.). We also model Src-NE as a point source in what follows, since |$2\Delta \rm {ln}(\mbox{likelihood}) < 0.2$| for any extended morphology.
On the 2–20 GeV TS map, because of the large PSF size, none of the aforementioned sub-features could be resolved. Nevertheless, after subtracting the three point sources Src-NE, Src-NW, and Src-S, almost no residual emission is left on the whole map (the maximum TS value is only ∼7.2). Additionally, we make a comparison between the observed and modelled count maps, with a bin size of 0.°1 that is large enough to reconcile the noise fluctuation. Among the 52 bins which are inside 4FGL J1213.3−6240e or overlapping its edge, only three show observed counts less than the model predictions by 2–2.5σ, and the others show observed and predicted counts consistent within the tolerance of 2σ uncertainties. What is more, the total observed count and total predicted count of these 52 bins are 746 and 744.9 respectively, the difference between which is much less than the Poissonian statistical uncertainty. Hence, the over-/under-subtraction is less of an issue in 2–20 GeV and it is further justifiable to replace 4FGL J1213.3−6240e with Src-NE, Src-NW, and Src-S in subsequent analyses.
3.1.2 γ-ray spectroscopy
We adopt “FRONT+BACK” data (i.e., photons converted into pairs in the front and back sections of the LAT tracker, respectively) for investigating the γ-ray spectra of Src-NE, Src-NW, and Src-S. We enable the energy dispersion corrections to reduce the systematic effects on the spectral shape parameters. For the 0.3–300 GeV band, we perform spectral fittings with a power law (PL) model:3
a log parabola (LPB):4
and a broken power-law (BKPL) model:5
The 0.3–300 GeV spectral properties are tabulated in table 1, and the spectral energy distributions (including binned spectra and fitted models) are demonstrated in figure 2.
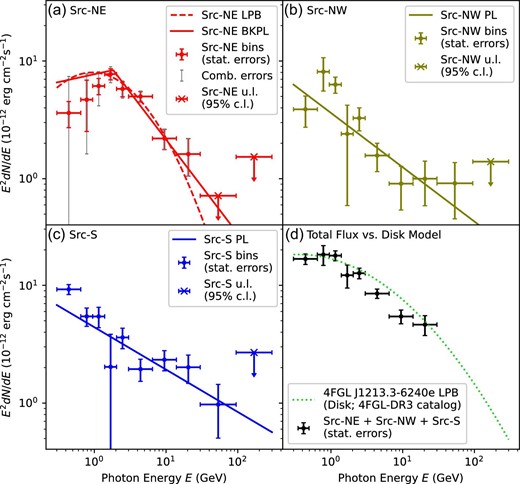
Fermi-LAT spectral energy distributions of (a) Src-NE, (b) Src-NW, (c) Src-S, and (d) their total emission in comparison with the 4FGL-DR3 catalog model of 4FGL J1213.3−6240e. Upper limits at the |$95\%$| confidence level are calculated for bins with TS <9. The combined uncertainty of each flux bin in panel (a) is defined as the statistical and systematic uncertainties added in quadrature.
γ-ray spectral parameters of different spatial components, determined with the Fermi-LAT data in 0.3–300 GeV.*
| Src-NE | Src-NW | Src-S | |
|---|---|---|---|
| Power Law (PL) | |||
| Γ | 2.364 ± 0.036 | 2.461 ± 0.071 | 2.360 ± 0.054 |
| Flux† (10−9 photons cm−2 s−1) | 16.21 ± 0.85 | 8.99 ± 0.90 | 10.41 ± 0.90 |
| TS | 690.3 | 177.4 | 313.7 |
| Log Parabola (LPB) | |||
| α | 2.534 ± 0.070 (|$^{+0.108}_{-0.092}$|) | 2.458 ± 0.072 | 2.355 ± 0.050 |
| β | 0.230 ± 0.045 (|$^{+0.084}_{-0.046}$|) | −0.007 ± 0.039 | −0.038 ± 0.028 |
| Flux (10−9 photons cm−2 s−1) | 14.08 ± 0.93 (|$^{+7.38 }_{-4.14}$|) | 9.02 ± 0.93 | 10.82 ± 0.93 |
| TS | 730.3 | 177.4 | 315.3 |
| Broken Power-Law (BKPL) | |||
| Γ1 | 1.866 ± 0.135 (|$^{+0.260}_{-0.353}$|) | −1.129 ± 7.174 | 2.463 ± 0.113 |
| Ebr (MeV) | 1832 ± 440 (|$^{+199 }_{-94 }$|) | 400 ± 178 | 4003 ± 1480 |
| Γ2 | 2.801 ± 0.132 (|$^{+0.078}_{-0.029}$|) | 2.512 ± 0.079 | 2.177 ± 0.124 |
| Flux (10−9 photons cm−2 s−1) | 14.09 ± 0.95 (|$^{+7.49 }_{-4.24}$|) | 8.50 ± 2.18 | 10.90 ± 0.97 |
| TS | 731.4 | 179.0 | 316.2 |
The uncertainties without parentheses are statistical (1σ), and those inside parentheses are systematic.
The fluxes are integrated from 0.3 GeV to 300 GeV.
For the Src-NE spectrum, both LPB and BKPL models are preferred over PL by ≥6.3σ. The TS values yielded by LPB and BKPL differ by only ∼1.1, making it unclear whether the spectral turnover is a gradual curvature or a sharp peak. The apparent discrepancy between the flux bins and BKPL model below the spectral break is discussed in subsection 4.3. Both Src-NW and Src-S spectra are satisfactorily described by PL, such that the extra parameters of LPB and BKPL are not significantly required (only ≤1.6σ).
In order to cross-check the significance of the spectral curvature/break for Src-NE, we repeat the LPB and BKPL fittings for Src-NE with the following adjustments: (i) shifting the normalization of the Galactic diffuse background by |$\pm 5\%$|; (ii) discarding “PSF0” data (i.e., data of poorest angular resolution); and (iii) discarding “EDISP0” data (i.e., data of poorest energy resolution). Each of these adjustments is implemented separately. We record the difference in each parameter value for each adjustment. We quantify the systematic uncertainty of each parameter (appended in table 1) as the differences added in quadrature. We follow a similar scheme to determine the background-associated systematic uncertainties for the flux bins of Src-NE as well, in an attempt to account for the discrepancy between its binned spectrum and BKPL model (subsection 4.3).
For Src-NE, after combining the statistical and systematic uncertainties in quadrature, the curvature index β of LPB is still greater than 0 by ∼3.6σ, the break energy Ebr of BKPL is still higher than 0.3 GeV (the applied minimum energy cut) by ∼3.4σ, and the photon index Γ2 above the break is still softer than Γ1 below the break by ∼2.9σ. We hereby confirm that the spectral turnover of Src-NE is genuine. The differential flux of Src-NE peaks at |$E_{\rm br}=1.83\pm 0.44_{\rm stat}{^{+0.20}_{-0.09}}_{\rm sys}\:$|GeV. Based on the binned spectra, we constrain the peak energy of the differential flux to be ≲1.2 GeV and ≲0.5 GeV for Src-NW and Src-S, respectively.
We repeat the PL and LPB fittings for the three spatial components with 2–300 GeV data, so that the data below the spectral turnover of Src-NE is excluded. The results are tabulated in table 2. It turns out that PL is sufficient to describe the 2–300 GeV spectrum of each component, while LPB only improves the fits by ≤1.1σ. Noticeably, Src-NE has the softest spectrum while Src-S has the hardest spectrum.
γ-ray spectral parameters of different spatial components, determined with the Fermi-LAT data in 2–300 GeV.*
| Src-NE | Src-NW | Src-S | |
|---|---|---|---|
| Power Law (PL) | |||
| Γ | 2.814 ± 0.110 (|$^{+0.146 }_{-0.016 }$|) | 2.462 ± 0.161 (|$^{+0.156 }_{-0.010 }$|) | 2.252 ± 0.109 (|$^{+0.049 }_{-0.034 }$|) |
| Flux (10−9 photons cm−2 s−1)† | 1.36 ± 0.09 (|$^{+0.23 }_{-0.06 }$|) | 0.55 ± 0.08 (|$^{+0.06 }_{-0.01 }$|) | 0.73 ± 0.08 (|$^{+0.08 }_{-0.05 }$|) |
| TS | 344.1 | 75.7 | 161.0 |
| Log Parabola (LPB) | |||
| α | 2.742 ± 0.212 | 2.788 ± 0.175 | 2.341 ± 0.138 |
| β | 0.050 ± 0.130 | −0.122 ± 0.056 | −0.033 ± 0.046 |
| Flux (10−9 photons cm−2 s−1) | 1.36 ± 0.10 | 0.57 ± 0.08 | 0.74 ± 0.08 |
| TS | 344.2 | 76.9 | 161.1 |
The uncertainties without parentheses are statistical (1σ), and those inside parentheses are systematic.
The fluxes are integrated from 2 GeV to 300 GeV.
We follow the aforementioned scheme to determine the systematic uncertainties of PL parameters for the three components (appended in table 2). After combining the statistical and systematic uncertainties in quadrature, the 2–300 GeV photon index Γ of Src-NE is still softer than that of Src-S by ∼3.4σ. We also note that the 2–300 GeV integrated flux of Src-NE is higher than that of Src-NW by ∼5.5σ, considering their combined uncertainties.
We compute the binned spectrum of the total emission of Src-NE, Src-NW, and Src-S and compare it with the 4FGL-DR3 catalog model of 4FGL J1213.3−6240e (see figure 2d), which assumes a LPB spectral shape and a disk spatial morphology. It turns out that they are essentially consistent with each other, despite the maximum deviation of |$\sim \!\! 30\%$| at ∼9.5 GeV.
3.2 Chandra-ACIS results
3.2.1 X-ray spatial morphology
In X-ray spatial analyses, considering the Suzaku result of Bamba et al. (2016), we adopt the 1–4 keV data so as to maximize the signal-to-noise ratio of the diffuse emission at/around SNR G298.6−0.0 roughly. In a search for point sources by the CIAO tool “wavdetect,” we identified five point-like features (table 3) in the whole field of view. Each of their apparent source ellipses indicates the combination of the PSF size and positional uncertainty in centroid localization, while their actual extensions are negligibly small compared with the PSF.
Spatial (and spectral) properties of five point-like X-ray sources identified with “wavdetect.”
| Pt1 | Pt2 | Pt3 | Pt4 | Pt5 | |
|---|---|---|---|---|---|
| RA (°) | 183.743 | 183.695 | 183.457 | 183.331 | 183.208 |
| Dec (°) | −62.598 | −62.552 | −62.667 | −62.635 | −62.513 |
| Rapx (″)* | 40.9 | 8.7 | 19.1 | 7.7 | 32.3 |
| Source Spectrum | |||||
| NH, src (1022 cm−2)† | – | 0.22 ± 0.12 | – | 0.35 ± 0.17 | – |
| Γsrc‡ | – | 2.13 ± 0.26 | – | 3.45 ± 0.57 | – |
| Fsrc (10−15 erg cm−2 s−1)§ | – | 96 ± 14 | – | 14 ± 4 | – |
| Background Spectrum | |||||
| NH, bkg (1022 cm−2)|| | – | 0 ± 0.06 | – | 0 ± 0.12 | – |
| Γbkg♯ | – | 0.88 ± 0.30 | – | 1.08 ± 0.37 | – |
| Fbkg (10−15 erg cm−2 s−1)** | – | 45 ± 14 | – | 26 ± 10 | – |
Approximate radius of an apparent source ellipse, defined as the square-root of the product of the semi-major and semi-minor axes determined by “wavdetect” (i.e., we approximate an ellipse as a circle with the same area). This quantifies the combination of the PSF size and positional uncertainty in centroid localization.
Equivalent hydrogen column density for photoelectric absorption at the direction of the source component.
Power-law index of the unabsorbed source spectrum.
Unabsorbed 2–10 keV source flux predicted by the power-law.
Equivalent hydrogen column density for photoelectric absorption at the direction of the background component.
Power-law index of the unabsorbed background spectrum.
Unabsorbed 2–10 keV background flux predicted by the power-law.
These source ellipses are all beyond the |$95\%$| error circles of our identified γ-ray sources Src-NE, Src-NW, and Src-S, making it difficult to relate these point-like X-ray sources to those GeV γ-ray emissions (a more detailed discussion is in section 4). Among the five point-like features, only Pt2 and Pt4 have their source ellipses smaller than or comparable to the wing part of the Chandra-ACIS PSF (a radius of ∼10″), because their higher photon statistics lead to more precise localizations of their centroids.6 The source ellipses of Pt1, Pt3, and Pt5 have approximate radii greater than or about double that of the on-axis PSF wing’s, reflecting their large positional uncertainties due to their off-axis positions and the lack of photon statistics.
Thus we create a flux map (i.e., an exposure-corrected map; the top panel of figure 3) that excludes the data in the determined elliptical regions of these point-like features. We use ds9 to determine the flux-weighted centroid of this map, and we apply the CIAO command “dmextract” on the event file to compute a radial brightness profile around this centroid (the bottom panel of figure 3).
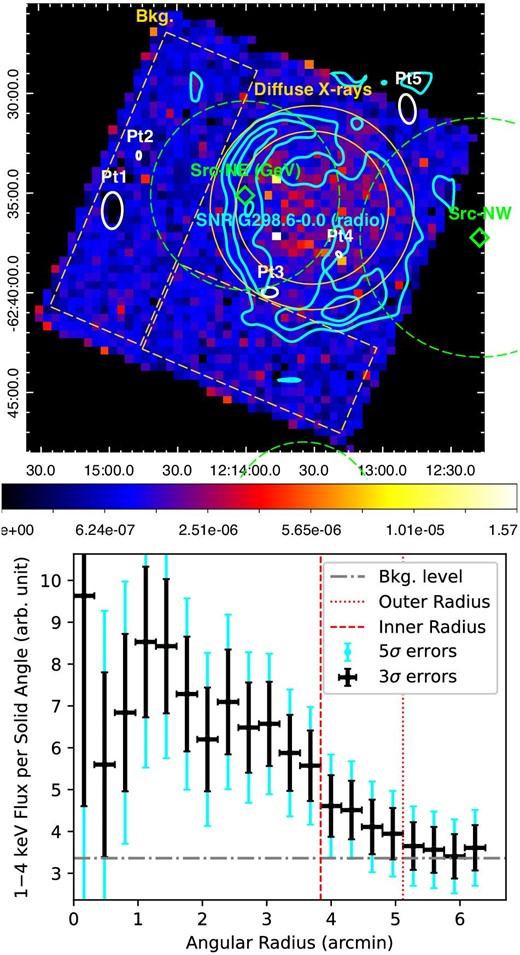
(Top) Chandra-ACIS flux map (i.e., exposure-corrected map) of the field around G298.6−0.0, in 1–4 keV. It is overlaid with the MOST 843 MHz radio contours of G298.6−0.0 (Whiteoak & Green 1996) in cyan. The centroids and |$95\%$| error circles of our identified γ-ray sources are indicated in green. The color bar represents the flux in the unit of photons cm−2 s−1 and is in a square-root (“sqrt”) scale. The two gold concentric circles indicate the inner and outer regions of the diffuse X-ray source, which are defined according to the bottom panel. The combination of the two gold dashed boxes is our chosen background region. Five point-like background sources which have been subtracted are indicated as white thick ellipses determined by the “wavdetect” algorithm. (Bottom) Radial brightness profile around the 1–4 keV centroid. The 3σ uncertainties (black) and the background flux (the grey horizontal line) are used to determine the outer radius (the red dotted line), while the 5σ uncertainties (cyan) and the background flux are used to determine the inner radius (the red dashed line).
As the separation from the centroid increases, we notice a gradually decreasing trend of the brightness. We define the “inner” and “outer” regions of the diffuse source (i.e., the two gold concentric circles in figure 3) in this way: beyond the inner region, the brightness starts to be consistent with the background level within the tolerance of ∼5σ uncertainties; beyond the outer region, the brightness is no longer higher than the background level by ≳3σ. The dimension of this diffuse X-ray source and the radio-continuum region of SNR G298.6−0.0 largely overlap each other, as shown in the top panel of figure 3.
For the first time, we notice that the centroid position of this extended keV source is slightly tilted to the north-eastern part of the SNR. It shows no significant emission (<3σ) at the southern, south-western, or western edges of the SNR. Such an X-ray morphology is in stark contrast to the radio-continuum morphology (Whiteoak & Green 1996), the south-western shell of which is the brightest region.
3.2.2 X-ray spectroscopy
We look into the 0.5–7 keV spectra of our defined “inner” and “whole” (inner + outer) regions, where the background emissions from the source-free region (see figure 3) are subtracted. We fit the VAPEC × PHABS model (i.e., an emission spectrum from plasma in collisional ionization equilibrium, with interstellar absorption) to each spectral dataset. We have seven free parameters in the fittings: the equivalent hydrogen column density (NH) for photoelectric absorption, the plasma temperature (kT), the emission measure (EM; i.e., the normalization), and the abundances of magnesium (Mg), silicon (Si), sulphur (S), and iron (Fe). The data points and model lines are plotted in figure 4, and the parameter values are tabulated in table 4.
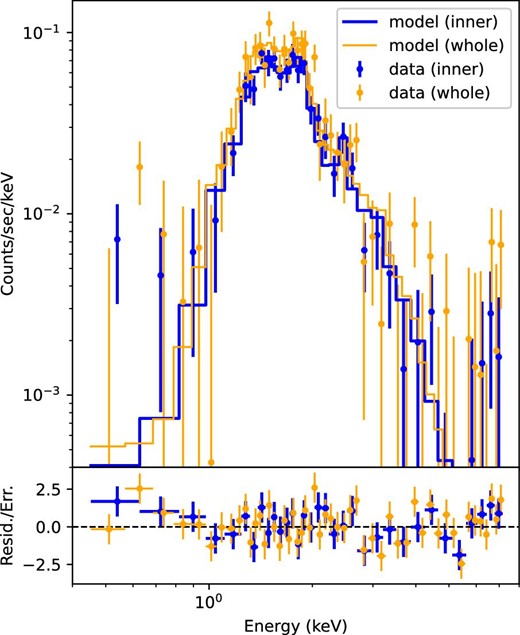
(Top) Background-subtracted Chandra-ACIS spectra of the diffuse X-ray source associated with G298.6−0.0, and the best-fitting VAPEC × PHABS models. The data and model for our defined “inner” region are plotted in blue, while those for our defined “whole” (inner + outer) region are plotted in orange. (Bottom) Residual (data − model) divided by the corresponding uncertainty.
Spectral fittings for the Chandra-ACIS data of the diffuse X-ray source in 0.5–7 keV, with the VAPEC × PHABS model.*
| Inner region | Whole region | |
|---|---|---|
| NH (1022 cm−2) | 1.93 ± 0.27 | 2.25 ± 0.55 |
| kT (keV) | 0.71 ± 0.10 | 0.64 ± 0.11 |
| Mg | 0.45 ± 0.25 | 0.48 ± 0.32 |
| Si | 0.27 ± 0.11 | 0.26 ± 0.10 |
| S | 0.41 ± 0.22 | 0.02 ± 0.17 |
| Fe | 0 ± 0.04 | 0.18 ± 0.24 |
| EM (cm−5)† | 8.9 ± 3.8 | 15.8 ± 8.7 |
| χ2/d.o.f. | 30.1/26 | 63.3/45 |
The abundances of elements are in solar units.
Emission measure, defined as 10−11(4πD2)−1∫nenHdV.
We compare our spectral fitting results for the two defined regions and that of Bamba et al. (2016) for Suzaku data altogether. For all parameters except S, three sets of solutions are mutually consistent with each other within the tolerance of 1σ uncertainties. The S value we obtain for the whole region appears to be smaller than that for the inner region as well as that obtained by Bamba et al. (2016), but the significance of the difference is only <2σ.
We also look into the 0.5–7 keV spectra of our identified point-like features, the spectral files of which are also generated in the “wavdetect” procedure. Among these five sources, only two (respectively labelled as Pt2 and Pt4 in figure 3) have sufficient photon statistics for spectral fittings. In view of the relatively low signal-to-noise ratios, we adopt “cstat” as the statistic function, perform fittings on ungrouped data, and assume an absorbed power-law model for the Pt2 and Pt4 spectra as well as the corresponding background spectra. The major outcome of these fittings (appended in table 3) is that all NH values are much smaller (at >4.5σ significance) than the NH we obtained for the diffuse source’s inner region and the NH reported by Bamba et al. (2016) on the diffuse source.
3.3 NANTEN CO and ATCA-Parkes H i results
Figure 5 shows the integrated-intensity map of the NANTEN 12CO(J = 1–0) data superimposed with the radio-continuum contours and the position–velocity (p–v) diagram of CO towards SNR G298.6−0.0. The integrated declination range (from −62°42′47″ to −62°30′13″) for this p–v diagram closely matches the declination range of the SNR extension. Interestingly, this p–v diagram demonstrates a cavity-like structure towards G298.6−0.0 at VLSR of 27 ± 8 km s−1. It is noteworthy that this cavity has an extent in right ascension that is roughly consistent with the right ascension range of the SNR. Besides, the integrated-intensity map of CO demonstrates significant peaks at around |$({12^{\rm h}11^{\rm m}48{^{\rm s}}}, -62^{\circ }35{^{\prime }}30{^{\prime \prime }})_\mathrm{J2000.0}$| and |$({12^{\rm h}14^{\rm m}48{^{\rm s}}}, -62^{\circ }38{^{\prime }}00{^{\prime \prime }})_\mathrm{J2000.0}$|, which roughly coincide with the γ-ray centroids of Src-NE and Src-NW.
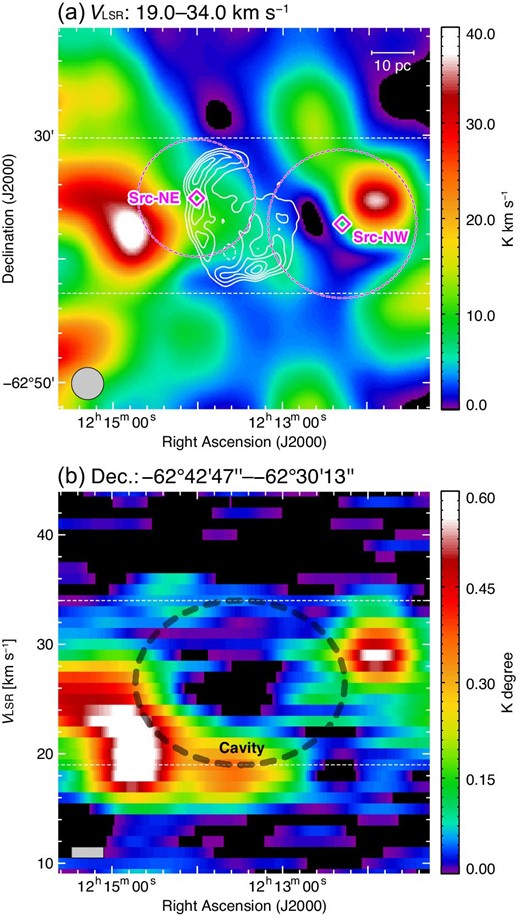
(a) Integrated-intensity map of the 12CO(J = 1–0) emission line, observed with NANTEN, towards SNR G298.6−0.0. The VLSR range for integration is from 19.0 km s−1 to 34.0 km s−1, which is most likely associated with the SNR. The superimposed white contours indicate the MOST 843 MHz radio-continuum emission (Whiteoak & Green 1996). The centroids and |$95\%$| error circles of γ-ray sources Src-NE and Src-NW are indicated in magenta. The grey circle at the bottom left-hand corner of the map indicates the half-power beam width of NANTEN. (b) Position–velocity (p–v) diagram of the CO line. The declination range for integration is from −62°42′47″ to −62°30′13″. We highlight the cavity-like structure with a thick-dashed ellipse.
Figure 6 shows the typical H i spectra towards SNR G298.6−0.0 and a background region respectively. We found a hint of an H i absorption feature in a broad VLSR range from approximately −46 km s−1 to +32 km s−1, where the positive-VLSR end is well consistent with the CO cavity.
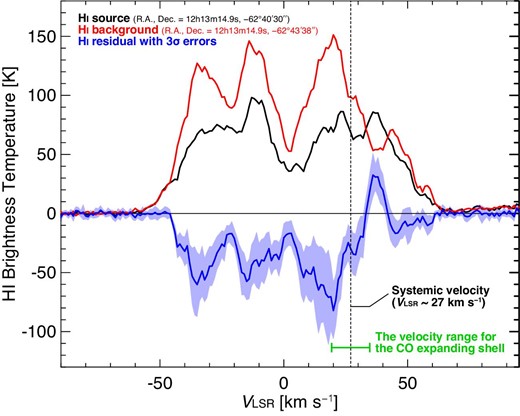
Spectra of the H i (1.4 GHz) line, reconstructed from the combined ATCA-Parkes data, towards G298.6−0.0 (black) and a background region (red). The extraction region for each spectrum is approximately a square box of side ∼100″. Additionally, the residual (source − background) is plotted as a blue line sandwiched within the blue-shaded 3σ uncertainty range.
We will explore the relation among the CO cavity, H i absorption, and the SNR, as well as the relation between the MC clumps and the γ-ray emissions, in subsection 4.1.
4 Discussion and summary
From the Fermi-LAT TS maps (figure 1), we found that the extended GeV γ-ray source 4FGL J1213.3−6240e in the 4FGL-DR3 catalog is decomposable into three spatial components (Src-NE, Src-NW, and Src-S) with point-like morphologies. Src-NE has a much higher spectral peak energy than Src-S, and the 2–300 GeV photon index of Src-NE is significantly softer than that of Src-S. Such differences in spectral shape suggest different origins of the responsible cosmic-rays. Src-NE is at the eastern shell of SNR G298.6−0.0, and Src-NW is adjacent to the western edge of this SNR. Therefore, we will explore the SNR–MC interaction scenarios for Src-NE and Src-NW. Src-S is very close to the other SNR G298.5−0.3, suggesting a possible association as well, but the discussions on this pair are beyond the scope of this paper.
The Chandra-ACIS flux map (figure 3) demonstrates a diffuse keV X-ray source which is highly spatially coincident with SNR G298.6−0.0. Our defined inner region of this X-ray feature is a brighter and filled structure inside the radio SNR shell, confirming that G298.6−0.0 is a mixed-morphology SNR (as put forward by Bamba et al. 2016).
It is worth mentioning that, in our X-ray spectral fitting results, the average sulphur abundance of the whole diffuse X-ray source seems to be lower than that of the inner region. If this apparent difference is genuine, then it possibly implies that the ejecta keep an onion-like structure of nuclear burning, resulting in a concentration of the sulphur abundance in the inner region. Nevertheless, because of the large uncertainties, we can only claim a low significance of <2σ for the difference in sulphur abundance. Therefore, further deep X-ray observations (e.g., with the upcoming XRISM telescope; Tashiro et al. 2020) are necessary to confirm or deny this hypothetical phenomenon.
Noteworthily, five background X-ray sources (table 3) are also identified inside/around the angular dimension of SNR G298.6−0.0. All of them are well separated from the centroids of our identified γ-ray sources (>2σ), making them unlikely to be major contributors to the detected GeV γ-rays. Only two of them (Pt2 and Pt4) have sufficiently high photon statistics for spectral analyses. Our spectral fittings for Pt2 and Pt4 yield NH values that are less than half of the NH we obtained for the SNR, implying that Pt2 and Pt4 are closer to us than the SNR by a few kpc. It is, therefore, unreasonable to associate these background X-ray sources with a putative pulsar originated from the same supernova explosion as G298.6−0.0.
Furthermore, both the spectra of Src-NE and Src-NW (figure 2) follow the simple PL model from 2 GeV to ≳30 GeV, in contrast with typical spectra of pulsars having an exponential cutoff at about 1–4 GeV (at most 10 GeV for some extreme cases; Abdo et al. 2013). It is, therefore, safe to exclude the possibility that the γ-ray emission of Src-NE or Src-NW originated from a putative pulsar.
4.1 Interactions of SNR G298.6−0.0 with MCs
We argue that the cavity-like structure in the p–v diagram of CO represents an expanding gas motion likely caused by the supernova shocks and/or strong stellar winds from the progenitor of the SNR (e.g., Koo et al. 1990; Koo & Heiles 1991; Hachisu et al. 1996, 1999a, 1999b). It is noteworthy that the apparent size of such a wind cavity is expected to be the same as that of the SNR because the free expansion phase inside the wind cavity is very short owing to a much lower density (e.g., Weaver et al. 1977). Moreover, the expansion velocity of the wind cavity in SNR G298.6−0.0 is ∼8 km s−1, which is consistent with those in Galactic/Magellanic SNRs (∼3–13 km s−1; e.g., (Landecker et al. 1989; Fukui et al. 2012; Kuriki et al. 2018; Sano et al. 2019, 2021b, 2021a).
The physical association between the CO cavity and the SNR is further supported by the H i absorption. The absorption feature is significant only in the VLSR range of −46 to +32 km s−1, the positive-VLSR end of which is roughly equal to the maximum VLSR of the CO cavity. We, therefore, propose that the wind-cavity at VLSR = 19–34 km s−1 was formed by the strong stellar winds from the high-mass progenitor and is now physically interacting with the supernova shocks.
According to the Galactic rotation curve model (Brand & Blitz 1993) with the IAU-recommended values of R0 = 8.5 kpc and Θ0 = 220 km s−1 (Kerr & Lynden-Bell 1986), the VLSR of 27 ± 8 km s−1 harbouring the cavity of the CO expanding shell corresponds to a kinematic distance of 10.1 ± 0.5 kpc between us and the SNR. This value of kinematic distance is in good agreement with the maximum distance from us to most interstellar hydrogen in this direction (10 kpc; see the face-on maps of Nakanishi & Sofue 2006), as well as a measurement based on the “radio surface brightness vs. diameter” relation (9.5 kpc; Case & Bhattacharya 1998).
At VLSR ∼ 19 km s−1 along our line of sight to the SNR (i.e., slightly in front of the CO cavity), there is an MC clump traced by the CO p–v diagram. This clump is slightly more concentrated in the northern half of the SNR’s angular dimension, as shown by the integrated-intensity map. Right next to the eastern edge of the SNR, the CO emissions reveal a larger and denser MC clump centered at VLSR ∼ 22 km s−1. In a scenario of SNR–MC interaction, the combined contribution of these two MC clumps could possibly account for the γ-ray emission of Src-NE, whose |$95\%$| error circle of the centroid significantly overlaps with both of them.
Along our line of sight to the western vicinity of the SNR, the CO emissions also reveal another dense MC clump, which is centered at VLSR ∼ 29 km s−1 and is spatially coincident with Src-NW. This clump is also potentially interacting with the SNR, and hence could possibly explain the γ-rays of Src-NW whose |$95\%$| error circle of the centroid encloses most of its CO emission.
γ-ray sources of SNR–MC hadronic interaction detected by Fermi-LAT commonly have spectral breaks in the GeV band (Acero et al. 2016). Src-NE has a spectral break at |$E_{\rm br}=1.83\pm 0.44_{\rm stat}{^{+0.20}_{-0.09}}_{\rm sys}\:$|GeV, further supporting an emission mechanism where MCs are impacted by SNR-accelerated hadronic cosmic-rays. The break energy of the Src-NW spectrum is constrained to be ≲1.2 GeV according to the flux bins. Despite an undetermined lower limit for the break energy, a hadronic scenario of an SNR–MC system is a viable option for interpreting the Src-NW emission as well.
Our results of γ-ray, X-ray, and radio data analyses unanimously point to the same implication, that the interaction of G298.6−0.0 with MCs occurs mainly in the north-eastern direction. Our observational evidence for this argument is as follows: (i) The >2 GeV integrated flux of Src-NE is much greater than Src-NW’s (table 2); (ii) The extended keV emission slightly slants to the north-eastern part of the SNR, contrasting harshly with the radio-continuum morphology (Whiteoak & Green 1996) which has the brightest shell at the south-western edge; (iii) In the vicinity of the SNR, the MCs (traced by CO) on the northern, north-eastern and eastern sides are larger, denser and closer to the SNR.
We note that the neutral iron line at ∼6.4 keV can be emitted from SNR regions, due to the SNR-accelerated MeV cosmic-ray protons ionizing the iron in MCs (Nobukawa et al. 2018, 2019). Hence, this line emission can be treated as another tracer of SNR–MC interaction. Unfortunately, T. Morikawa et al. (in preparation) reports a non-detection of this emission line from our targeted SNR G298.6−0.0. Deeper observations in the future are needed to unveil the properties of the neutral iron line in G298.6−0.0.
4.2 Estimated old age of SNR G298.6−0.0
For Src-NE and Src-NW, the photon indices above the break energies are rather steep (about 2.5–2.8), suggesting that these spectral breaks are associated with the cosmic-ray escape from SNR G298.6−0.0 and hence could hint at the SNR age.
Suzuki et al. (2022) explored the relation between the break energy of an SNR-associated γ-ray source and the SNR age (see figure 2b of that paper). Based on a sample of ∼ 20 SNRs with ages of ∼(0.34–69) kyr and break energies of ∼(3 GeV–1 TeV), they confirm a trend that the break energy decreases with age. This observed trend agrees with the theory predicting a gradual decline of the escape energy of SNR-accelerated cosmic-rays with time (Ptuskin & Zirakashvili 2003, 2005). Suzuki et al. (2022) approximate the γ-ray break energy as a power-law function of the SNR age. If we substitute Ebr ∼ 1.8 GeV of Src-NE or Ebr ≲ 1.2 GeV of Src-NW into the power law with the best-fitting parameters, then the age of SNR G298.6−0.0 would be computed to be an unrealistically large value for a GeV-bright SNR. Taking into account the large uncertainties of the power-law parameters, an SNR with a given break energy Ebr should be at least older than (Ebr/140 GeV)−0.68 kyr. Considering the statistical and systematic uncertainties of Ebr of Src-NE, its upper limit is, at the very most, 3.3 GeV. We hereby place a conservative and reliable constraint of >10 kyr on the age of G298.6−0.0.
It is noteworthy that an old (≳10 kyr) SNR may have a broken shell formed from the shock–cloud interaction. An additional component of lower-energy cosmic-rays may be leaked from this broken shell, neglecting the escape energy required for runaway cosmic-rays. This additional component could lead to a more dramatic drop in Ebr of the γ-ray spectrum. For instance, this scenario has been applied to interpret the Ebr ∼ 1.0 GeV (Cui et al. 2018) associated with >30 kyr SNR W28 (Velázquez et al. 2002), and the Ebr < 2 GeV (He et al. 2022) associated with 8.3 ± 0.5 kyr SNR Kes 79 (Kuriki et al. 2018). Besides this, simulations (e.g., Lee et al. 2015; Yasuda & Lee 2019; Kobashi et al. 2022) revealed a wide diversity of evolutionary routes of the γ-ray emission strongly correlated with the environmental characteristics of an SNR, such as the density distribution of ambient gas and the profile of the magnetic field. This diversity could naturally entail a considerable range of possible ages for a given Ebr in γ-rays.
The environmental diversity and/or the broken-shell-leaked cosmic ray could explain why the observed Ebr values of the outlying SNRs in the sample of Suzuki et al. (2022) appear to be lower than their power-law predictions. Among these outlying SNRs, the two with the lowest break energies (∼3 GeV) are about 11–13 kyr old. Thus, our lower limit of >10 kyr on the age of G298.6−0.0 would remain valid even if G298.6−0.0 is an outlying SNR.
The physical size of SNR G298.6−0.0 can provide an independent constraint on its age. In subsection 4.1, we derive a kinematic distance of 10.1 ± 0.5 kpc between us and G298.6−0.0. As observed by MOST at the radio frequency of 843 MHz (Whiteoak & Green 1996), this SNR has an angular radius of |${\sim}{5{^{\prime }_{.}}3}$|, which corresponds to a physical radius of ∼15.5 pc at 10.1 kpc from us. Such a large physical size also suggests an old SNR age of >10 kyr [see figure 7 of Cui et al. 2018].
Moreover, our Chandra-ACIS X-ray spectra reconstructed for the inner and whole regions of the diffuse emission, as well as the Suzaku X-ray spectrum of Bamba et al. (2016), can both be fitted with the VAPEC × PHABS model, which assumes a collisional ionization equilibrium of the thermal plasma. Such good fits imply that G298.6−0.0 had already passed the long-lasting ionization-dominant stage (duration >10 kyr; e.g., Masai 1984; Smith & Hughes 2010), further supporting the old age estimated from the γ-ray spectra and the radio SNR size.
4.3 Caveats: Systematic effects of background modelings on Fermi-LAT spectral analyses
In the γ-ray spectral energy distribution of Src-NE (figure 2a), the partial discrepancy between the BKPL model and the binned spectrum deserves our attention. Below the spectral break of Ebr ∼ 1.8 GeV, the flux measurements for those individual bins are collectively lower than the predictions given by BKPL, and the binned spectrum has an even harder photon index than the best-fitting Γ1 of BKPL. In the Galactic diffuse model (gll_iem_v07.fits), we notice that the spatial distribution of the modelled diffuse γ-rays at/around Src-NE is very similar to the MC distribution traced by our CO map (figure 5a). In other words, the Galactic diffuse component significantly overlaps with the PSF of Src-NE. We speculate that the discrepancy between the model line and individual bins at lower energies is owing to the inaccurate energy-dependence of gll_iem_v07.fits for the Src-NE region.
On the other hand, it is comforting to note two things: (i) the apparent difference in lower-energy photon index between the line and bins is consistent with our quantified systematic uncertainty of Γ1 of BKPL (table 1); and (ii) the flux difference between the model line and each bin below the break energy is within the quadratic combination of statistical and systematic uncertainties. We also stress that our detection of the spectral break is robust against the combination of statistical and systematic uncertainties.
The CO MC clumps at/around another γ-ray source, Src-NW, appear to be omitted from the model of Galactic diffuse γ-rays. With regards to this issue, we recommend that the origins of Src-NW should be interpreted as the Galactic cosmic-ray sea in addition to the cosmic rays accelerated by SNR G298.6−0.0.
In a more detailed modeling approach, it is crucial to distinguish the physical meanings derived from different Γ1 values of the Src-NE spectrum. To be specific, the relatively soft index Γ1 ∼ 1.9 yielded by the BKPL fit would imply there is another break at a lower energy which is the signature of pion-decays, while the harder Γ1 demonstrated by the binned spectrum would suggest a sharp (i.e., quasi-monoenergetic) proton spectrum. It is also crucial to constrain the relative contributions of SNR G298.6−0.0 and the Galactic cosmic-ray sea to the observed Src-NW emission.
Acknowledgements
The NANTEN project is based on a mutual agreement between Nagoya University and the Carnegie Institution of Washington (CIW). We greatly appreciate the hospitality of all the staff members of the Las Campanas Observatory of CIW. We are thankful to many Japanese public donors and companies who contributed to the realization of the project. The Australia Telescope Compact Array (ATCA) and the Parkes radio telescope are parts of the Australia Telescope National Facility which is funded by the Australian Government for operation as a National Facility managed by CSIRO.
PKHY thanks the Japan Society for the Promotion of Science (JSPS) fellowship (id. PE21024). This work is also supported in part by Grants-in-Aid for Scientific Research from the Japanese Ministry of Education, Culture, Sports, Science and Technology (MEXT) of Japan, Nos. 19K03908 (AB) and 21H01136 (HS). We thank S.-H. Lee of Kyoto University, T. Mizuno of Hiroshima University, Kumiko K. Nobukawa of Kindai University and H. Suzuki of Konan University for useful discussion. We also thank the anonymous referee for the fruitful comments.
Footnotes
Fermi LAT Performance 〈http://www.slac.stanford.edu/exp/glast/groups/canda/lat_Performance.htm〉.
A χ2 distribution is assumed. There are 4 d.o.f. because of the four variables: the right ascension, declination, flux normalization, and photon index.
N0 and Γ represent the normalization and photon index, respectively.
α and β represent the photon index at 3 GeV and curvature index, respectively.
Ebr represents the energy of the spectral break. Γ1 and Γ2 represent the photon indices below and above Ebr, respectively.
Understanding the Chandra PSF 〈https://cxc.cfa.harvard.edu/ciao/PSFs/psf_central.html〉.
