


Abstract
Accurate estimations of the brightness of (3200) Phaethon up to lower phase angles are essential for the planning of the on-board camera for the DESTINY+ mission. We carried out intensive observations of Phaethon in the optical wavelength (g, r, and i) with the TriCCS camera on the Seimei 3.8 m telescope in 2021 October and November. We derived the absolute magnitude HV and the slope parameter G of Phaethon as HV = 14.23 ± 0.02 and G = 0.040 ± 0.008 from multiple photometric observations including lower phase angles down to ∼9° with the H–G model. Using the HV value and the geometric albedo of Phaethon derived in previous polarimetric studies, we estimated that Phaethon’s diameter is within a range of 5.22–6.74 km, which is consistent with radar and occultation observations. With the linear model, we derived HV = 14.65 ± 0.02, which corresponds to a diameter range of 4.30–5.56 km. Our simultaneous tricolor light curves of Phaethon indicate that no rotational spectral variations larger than 0.018 and 0.020 mag in the g − r and r − i colors, possibly related to inhomogeneity of the surface material and/or structure, are seen at the 2021 apparition.
1 Introduction
The asteroid (3200) Phaethon is one of the most attractive asteroids: dust activity near the perihelion (Jewitt & Li 2010; Jewitt et al. 2013; Li & Jewitt 2013; Hui & Li 2017), near-Sun and near-Earth orbits (Ohtsuka et al. 2009), and the parent body of the Geminid meteor shower (Williams & Wu 1993). Phaethon was discovered in images from the Infrared Astronomy Satellite (IRAS) in 1983 (Green & Kowal 1983). Phaethon approaches the Sun every about 1.4 yr with a large eccentricity, ∼0.89, and an extremely small perihelion distance, ∼0.14 au. The perihelion activities were reported in 2009, 2012, and 2016 by observations with the Solar TErrestrial RElations Observatory (STEREO) spacecraft (Jewitt & Li 2010; Jewitt et al. 2013; Li & Jewitt 2013; Hui & Li 2017). Phaethon is taxonomically classified as B-type in the Bus taxonomy (Bus 1999; Bus & Binzel 2002).
Phaethon is selected as a target of the exploration mission Demonstration and Experiment of Space Technology for INterplanetary voYage Phaethon fLyby and dUst Science, DESTINY+ (Arai et al. 2018). DESTINY+ is a mission proposed for the JAXA/ISAS Epsilon class small program and will be launched in 2024 (Arai et al. 2018, 2022; Ozaki et al. 2022). Since a rendezvous is difficult for Phaethon, with a large relative velocity arising from its large eccentricity and orbital inclination, DESTINY+ will fly by Phaethon in 2028 (Arai et al. 2018). High-resolution imaging with the panchromatic telescopic camera (TCAP) and the VIS–NIR multiband camera (MCAP) will be performed on the flyby.
To successfully achieve just one DESTINY+ flyby with Phaethon, we need to know its surface brightness with high accuracy beforehand. It is desired that the on-board camera settings, such as sensor gain and exposure time, are fixed before the flyby since the time available to change the camera settings just before the approach is limited due to the large relative velocity at the flyby.
The disk-integrated brightness dependence on the solar phase angle is called a phase curve. The phase curve provides an estimate of an absolute magnitude H, the apparent magnitude of an object located 1 au away from the Sun and the Earth at zero phase angle. In general, we inevitably derive the H by extrapolating the phase curve because it is difficult to obtain photometric data at the zero phase angle. For Phaethon, Ansdell et al. (2014) reported the absolute magnitude in the Johnson R band, HR, as 13.90 in observations at phase angles of 12°–83°. Tabeshian et al. (2019) derived HR as 13.28 ± 0.02 in observations at phase angles of 20°–100°. The derived absolute magnitudes have a discrepancy. In addition, there may be a systematic uncertainty in the absolute magnitude of Phaethon since no observation at phase angles α below 12° has been reported. That is to say, the disk-integrated brightness for Phaethon is still unclear, especially at lower phase angles. To derive the absolute magnitude with high accuracy, additional observations at lower phase angles are necessary.
An investigation of the surface inhomogeneity of Phaethon is also one of the most important tasks to do before the DESTINY+ flyby. Several surface features on Phaethon such as concavities and boulders have been reported by radar observations (Taylor et al. 2019). To identify the local terrain of Phaethon’s surface by ground-based observations before the flyby is important for the DESTINY+ mission because they can adjust the flyby timing to observe the interesting side of Phaethon.
Rotational color variations can reflect the surface inhomogeneity of asteroids. In previous studies, color variations of Phaethon were detected by spectroscopic (Licandro et al. 2007; Kareta et al. 2018; Lazzarin et al. 2019; Ohtsuka et al. 2020) and multicolor photometric observations (Tabeshian et al. 2019; Lin et al. 2020). Recently, MacLennan, Marshall, and Granvik (2022) found evidence of the heterogeneity of surface grain size on Phaethon between different latitudes with thermophysical modeling (TPM) using the latest shape model constructed with radar data as well as optical light curves. However, uniform colors of Phaethon in longitude are also reported (Borisov et al. 2018; Lee et al. 2019). The inhomogeneity of Phaethon’s surface is still debated and follow-up observations at other apparitions are required.
The aims of this study are to constrain the HV and G parameters and to investigate Phaethon’s surface inhomogeneity before the DESTINY+ flyby. We carried out simultaneous multicolor photometry of Phaethon in 2021. Simultaneous multicolor observations allow us to achieve accurate measurements of the surface colors since the simultaneity cancels out the atmospheric variations in the measurements. In this paper, we will describe observations and data reduction in section 2. The results are compared with previous studies in section 3. In section 4, we discuss the absolute magnitude, diameter, and inhomogeneity of Phaethon.
2 Observations and data reduction
2.1 Observations
We conducted multicolor photometry with the TriColor CMOS Camera and Spectrograph (TriCCS) on the Seimei 3.8 m telescope (Kurita et al. 2020) in Okayama, Japan. The observing conditions are summarized in table 1. We obtained g-, r-, and i-band images with the Pan-STARRS filters simultaneously with TriCCS. The field of view of each 2k × 1k CMOS image sensor is 12|${_{.}^{\prime}}$|6 × 7|${_{.}^{\prime}}$|5 with a pixel scale of |${0{_{.}^{\prime\prime}}350}$|.
Summary of the observations.*
| Obs. date | Texp | Nimg | V | Velocity | α | Δ | rh | Airmass | Note |
|---|---|---|---|---|---|---|---|---|---|
| (UTC) | (s) | (mag) | (″ h−1) | (°) | (au) | (au) | |||
| 2021 Oct 27 14:03:30–20:14:54 | 30 | 585 | 17.9 | 46.6 | 15.9 | 1.4602 | 2.3133 | 1.01–1.28 | |
| 2021 Oct 28 11:56:47–20:08:57 | 60 | 408 | 17.9 | 47.4 | 15.6 | 1.4498 | 2.3107 | 1.01–1.87 | photometric |
| 2021 Oct 29 13:29:30–20:19:49 | 60 | 318 | 17.8 | 49.2 | 15.2 | 1.4380 | 2.3075 | 1.01–1.34 | |
| 2021 Nov 10 10:34:33–20:27:50 | 60 | 304 | 17.5 | 64.8 | 10.3 | 1.3286 | 2.2683 | 1.00–1.89 | photometric |
| 2021 Nov 11 10:27:49–20:13:04 | 60 | 357 | 17.4 | 66.0 | 10.0 | 1.3215 | 2.2647 | 1.00–1.87 | |
| 2021 Nov 12 10:19:30–20:25:47 | 60 | 435 | 17.4 | 67.2 | 9.7 | 1.3148 | 2.2611 | 1.00–2.01 | photometric |
| 2021 Nov 24 12:40:26–18:56:40 | 60 | 186 | 17.2 | 79.1 | 9.1 | 1.2614 | 2.2126 | 1.00–1.99 | |
| 2021 Nov 25 09:30:53–17:15:42 | 60 | 267 | 17.2 | 78.7 | 9.3 | 1.2597 | 2.2088 | 1.00–1.60 | photometric |
| 2021 Nov 26 09:31:57–18:48:41 | 60 | 408 | 17.2 | 79.1 | 9.6 | 1.2580 | 2.2044 | 1.00–2.06 | photometric |
Observation time in UTC (Obs. date), exposure time (Texp), and the number of images (Nimg) for each night are listed. Predicted V-band apparent magnitude (V), angular rate of change in apparent RA and Dec (Velocity), phase angle (α), distance between Phaethon and observer (Δ), and distance between Phaethon and the Sun (rh) at the observation starting time are from NASA JPL/HORIZONS as of 2022 November 8 (UTC). Elevations to calculate airmass range (Airmass) are also from NASA JPL/HORIZONS.
Phaethon was observed on nine nights in 2021 October and November. On the first day, October 27, we set the exposure time to 30 s and realized that the signal-to-noise ratio was not high enough to reveal the surface inhomogeneity. Thus, we set nominal exposure times to 60 s from October 28 to achieve a high signal-to-noise ratio.
The telescope was operated in the non-sidereal tracking mode to follow Phaethon during our observations with ephemerides from NASA JPL/HORIZONS.1 Elongations of the point spread functions (PSF) of stars in the images (hereinafter referred to as reference stars) were negligible since Phaethon’s angular velocities in the observations were small enough compared to a typical PSF, 2″–5″ in full width at half maximum (FWHM). The observation fields were crowded with reference stars since Phaethon was located close to the Galactic plane at the time of our observations (galactic latitude |b| < 20°, figure 1).
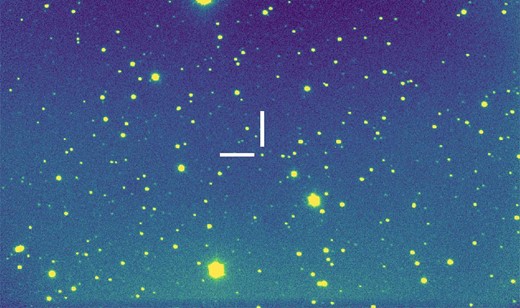
Image of (3200) Phaethon in the r band with a 60 s exposure on 2021 October 28 taken by TriCCS. Field of view covers 12|${_{.}^{\prime}}$|6 × 7|${_{.}^{\prime}}$|5. North is to the top and east is to the left.
2.2 Data reduction
2.2.1 Photometry
After standard corrections (bias subtraction, dark subtraction, and flat-field correction), cosmic ray events were removed using the Python package astroscrappy (C. McCully et al. 2018)2 based on Pieter van Dokkum’s L.A.Cosmic algorithm (van Dokkum 2001). The standard circular aperture photometry was done on Phaethon and reference stars in each frame using the SExtractor-based Python package sep (Bertin & Arnouts 1996; K. Barbary et al. 20153). The aperture radius was set to two times larger than the FWHM of the PSF of reference stars. The FWHM of the PSF in each frame was calculated using reference stars before the photometry. The light-traveltime correction was done to obtain the time-series colors and magnitudes (Harris & Lupishko 1989).
Stars meeting any of the following criteria were not used in the analysis: uncertainties in g-, r-, or i-band magnitudes in Pan-STARRS Data Release 2 (DR2, Chambers et al. 2016) larger than 0.05 mag; (g − r)PS > 1.1; (g − r)PS < 0.0; (r − i)PS > 0.8; or (r − i)PS < 0.0, where (g − r)PS and (r − i)PS are colors in the Pan-STARRS system. Also, we removed photometric results close to the edges of the image (200 pixels from the edge) or with any other sources in its aperture frame by frame. Extended sources, possible quasars, and variable stars were removed using objinfoflag and objfilterflag in Pan-STARRS DR2.
2.2.2 Color and magnitude derivation
2.2.3 Periodic analysis
We used the Lomb–Scargle method for periodic analysis (Lomb 1976; Scargle 1982; VanderPlas 2018). The details of the periodic analysis are summarized in Beniyama et al. (2022). The purpose of the periodic analysis in this study is not to derive the rotation period of Phaethon, but to create fitting curves to estimate the mean magnitude, which is essential for the phase curve fitting. Thus, we referred to the reported rotation period of Phaethon P = 3.603957 ± 0.000001 h (Kim et al. 2018; Hanuš et al. 2018) and fixed it to determine the Fourier coefficients of the model curve. Since Phaethon’s sidereal and synodic periods during our observations show little difference (∼1.2 s, Harris et al. 1984), we referred to Phaethon’s sidereal period derived in the previous studies.
2.2.4 Phase curve fitting
gred,mean and rred,mean were converted to R-band magnitudes using the equation in Tonry et al. (2012) to refer to Ansdell et al. (2014) for data at other phase angles, in which Phaethon was observed with an R-band filter (see subsection 3.4 for details). In subsection 3.4, we used two types of models in phase curve fitting to derive the absolute magnitude and the slope parameter.
The posterior distributions of the parameters were estimated using the Monte Carlo technique. We created 1000 phase curves by randomly sampling the observed data points assuming that every point follows a normal distribution. We adopted the standard deviations as the uncertainties of the parameters. The median (50th percentile) and 95% highest density interval (HDI) values were obtained.
3 Results
3.1 Comet-like activity
Comet-like activity near perihelion, possibly related to dust production, has been reported for Phaethon (Jewitt & Li 2010; Jewitt et al. 2013; Li & Jewitt 2013; Hui & Li 2017). Though Phaethon was far from its perihelion at the time of our observing runs, we searched for comet-like activity by Phaethon in the r-band image of 2021 October 28. A comparison of the radial profile of Phaethon with that of a standard star SA23−433 (Landolt 2013) is shown in figure 2. The standard star SA23−433 was observed in the sidereal tracking mode before Phaethon’s image. The exposure starting times of the images of Phaethon and SA23−433 are 2021 October 28 16:06:55 and 2021 October 28 16:11:38 (UT), respectively. Both images were obtained in similar low-airmass conditions (∼1.02). The fluxes were averaged in the azimuthal direction from the centroids of Phaethon and SA23−433. The uncertainties of the fluxes consist of the background noise and the Poisson noise in each annulus. Moffat functions were used to fit both radial profiles to derive the FWHMs of the PSFs. The derived FWHMs were |${2{_{.}^{\prime\prime}}46}$| and |${2{_{.}^{\prime\prime}}50}$| for Phaethon and SA23−433, respectively. The similarity of the radial profile of Phaethon and SA23−433 implies that no noticeable comet-like activity was found in the 2021 apparition.
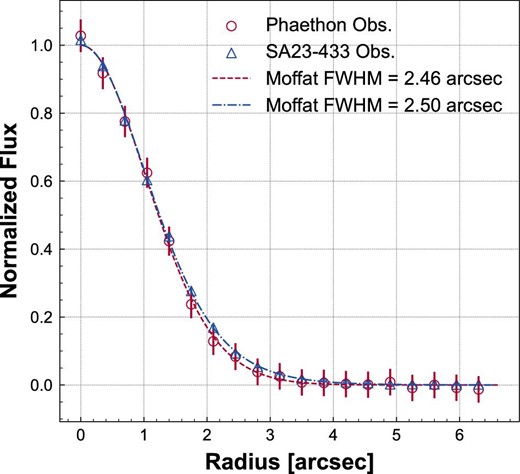
Radial profiles of Phaethon (circles) and SA23−433 (triangles) in the r-band images of 2021 October 28. The profiles were normalized to the peaks of the Moffat fits (dashed and dot–dashed lines). Bars indicate the 1σ uncertainties.
3.2 Light curves
The folded light curves with P = 3.603957 h (Kim et al. 2018; Hanuš et al. 2018) from nine nights are shown in figure 3.
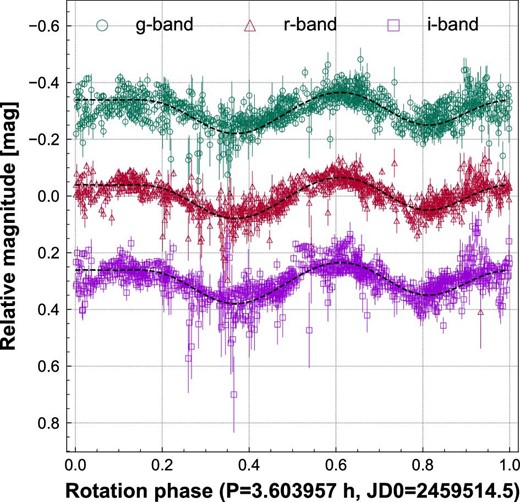
Phased relative light curves of Phaethon from nine nights. From top to bottom, g- (circles), r- (triangles), and i-band (squares) relative light curves from each day are presented. Light curves are folded by the reported period of 3.603957 h and phase zero is set to 2459514.5 JD. Bars indicate the 1σ uncertainties. Fitting model curves are shown by dashed lines. Phased light curves of Phaethon from each day are shown in figure 7; see appendix 1.
3.3 Surface colors
The colors from five photometric nights, October 28, November 10, 12, 25, and 26, are shown in figure 4. We calculated the weighted averages of the colors for each night. Here we presume that the systematic uncertainty of colors derived by our observations is 0.02 mag based on the photometry of reference stars (see appendix 2). Systematic uncertainties dominate over statistical uncertainties in the derived colors. Then, the weighted averages of the colors were g − r = 0.35 ± 0.02 and r − i = 0.08 ± 0.02. The color corresponds to V − R = 0.36 ± 0.02 in the Johnson system (Tonry et al. 2012).
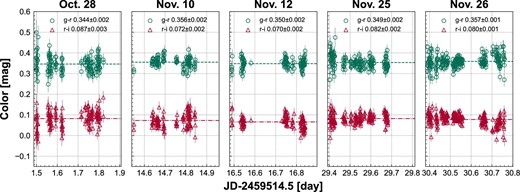
Colors of Phaethon from five photometric nights. g − r and r − i colors are shown by circles and triangles, respectively. Weighted averages of g − r and r − i colors for each night are presented with dashed and dash–dotted horizontal lines, respectively. Bars indicate the 1σ uncertainties.
We summarize the derived surface colors with those reported in previous studies in table 2. To compare the colors obtained in different filter systems, color transformations between the Pan-STARRS and the Johnson systems were performed with the equations in Tonry et al. (2012). Since some observations (Dundon 2005; Jewitt 2013; Ansdell et al. 2014) did not observe Phaethon in the I band, we derived only the g − r color in the Pan-STARRS system for them.
Comparison of Phaethon’s surface colors.*
| Reference | Obs. date | g − r | r − i | B − V | V − R | R − I |
|---|---|---|---|---|---|---|
| (UTC) | (mag) | (mag) | (mag) | (mag) | (mag) | |
| Dundon (2005) | 1996 Nov 12 | 0.37 ± 0.03 | — | |$\mathbf {0.618 \pm 0.005}$| | |$\mathbf {0.347 \pm 0.004}$| | — |
| Dundon (2005) | 1997 Nov 22 | 0.40 ± 0.03 | 0.08 ± 0.03 | |$\mathbf {0.650 \pm 0.004}$| | |$\mathbf {0.295 \pm 0.002}$| | |$\mathbf {0.320 \pm 0.003}$| |
| Dundon (2005) | 2004 Nov 19 | 0.34 ± 0.03 | — | |$\mathbf {0.587 \pm 0.005}$| | |$\mathbf {0.349 \pm 0.003}$| | — |
| Kasuga and Jewitt (2008) | 2007 Sept 4 | 0.36 ± 0.03 | 0.03 ± 0.05 | |$\mathbf {0.61 \pm 0.01}$| | |$\mathbf {0.34 \pm 0.03}$| | |$\mathbf {0.27 \pm 0.04}$| |
| Jewitt (2013) | 2010 Sept 10 | 0.42 ± 0.03 | — | |$\mathbf {0.67 \pm 0.02}$| | |$\mathbf {0.32 \pm 0.02}$| | — |
| Ansdell et al. (2014) | 1997 Nov 12 | 0.34 ± 0.03 | — | |$\mathbf {0.58 \pm 0.01}$| | |$\mathbf {0.34 \pm 0.02}$| | — |
| Ansdell et al. (2014) | 1997 Nov 22 | 0.33 ± 0.03 | — | |$\mathbf {0.57 \pm 0.01}$| | |$\mathbf {0.36 \pm 0.01}$| | — |
| Ansdell et al. (2014) | 1995 Jan 4 | 0.28 ± 0.03 | — | |$\mathbf {0.52 \pm 0.01}$| | |$\mathbf {0.33 \pm 0.01}$| | — |
| Lee et al. (2019) | 2017 Nov 11–13 | 0.39 ± 0.03 | 0.07 ± 0.04 | |$\mathbf {0.64 \pm 0.02}$| | |$\mathbf {0.34 \pm 0.02}$| | |$\mathbf {0.31 \pm 0.03}$| |
| Tabeshian et al. (2019) | 2017 Dec 11–19 | 0.45 ± 0.03 | 0.03 ± 0.03 | |$\mathbf {0.702 \pm 0.004}$| | |$\mathbf {0.309 \pm 0.003}$| | |$\mathbf {0.266 \pm 0.004}$| |
| Lin et al. (2020) | 2017 Oct/Nov/Dec | 0.38 ± 0.04 | 0.10 ± 0.03 | |$\mathbf {0.633 \pm 0.036}$| | |$\mathbf {0.336 \pm 0.011}$| | |$\mathbf {0.334 \pm 0.015}$| |
| Sergeyev and Carry (2021)† | 2009 Jan 26 | 0.32 ± 0.03 | 0.07 ± 0.03 | 0.56 ± 0.05 | 0.34 ± 0.03 | 0.30 ± 0.04 |
| This work | 2021 Oct 28 | |$\mathbf {0.34 \pm 0.02}$| | |$\mathbf {0.09 \pm 0.02}$| | 0.59 ± 0.04 | 0.35 ± 0.02 | 0.32 ± 0.03 |
| This work | 2021 Nov 10 | |$\mathbf {0.36 \pm 0.02}$| | |$\mathbf {0.07 \pm 0.02}$| | 0.60 ± 0.04 | 0.36 ± 0.02 | 0.31 ± 0.03 |
| This work | 2021 Nov 12 | |$\mathbf {0.35 \pm 0.02}$| | |$\mathbf {0.07 \pm 0.02}$| | 0.60 ± 0.04 | 0.36 ± 0.02 | 0.31 ± 0.03 |
| This work | 2021 Nov 25 | |$\mathbf {0.35 \pm 0.02}$| | |$\mathbf {0.08 \pm 0.02}$| | 0.60 ± 0.04 | 0.36 ± 0.02 | 0.32 ± 0.03 |
| This work | 2021 Nov 26 | |$\mathbf {0.36 \pm 0.02}$| | |$\mathbf {0.08 \pm 0.02}$| | 0.60 ± 0.04 | 0.36 ± 0.02 | 0.32 ± 0.03 |
g − r, r − i (Pan-STARRS), B − V, V − R, and R − I (Johnson) colors are listed with their references. Colors derived without any transformation are shown in bold. Colors derived after transformations based on Tonry et al. (2012) are shown in normal text.
The Pan-STARRS and Johnson colors are converted from the SDSS colors.
3.4 Phase curve
We successfully observed Phaethon at lower phase angles down to about 9°. The phase curves of Phaethon are shown in figure 5. As in subsection 3.3, we limited the results obtained to the five photometric nights.
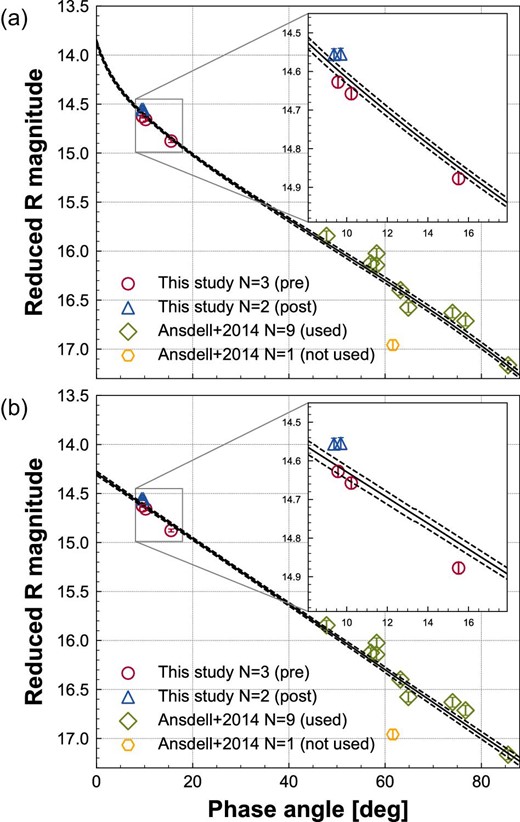
Phase curves of Phaethon with (a) the H–G and (b) the linear models. Mean reduced R-band magnitudes in 2021 pre-opposition, 2021 post-opposition, and Ansdell et al. (2014) are presented as circles, triangles, and diamonds, respectively. Removed data in Ansdell et al. (2014) are presented as hexagons (see text for details). Bars indicate the 1σ uncertainties. Medians (50th percentiles) of fitting model curves are presented by solid lines. Uncertainty envelopes representing the 95% HDI values are shown by dashed lines.
We combined our observational results with those reported in Ansdell et al. (2014), not Tabeshian et al. (2019). This is because we regard the average of the B − V color in Tabeshian et al. (2019) as different from the colors reported in other studies (table 2). The data sets in Ansdell et al. (2014) obtained in 2004 November and 2013 December are not used in this paper since those light curves are relative rather than absolute without absolute calibrations due to the lack of field stars. We note that the observational results for 2013 November 13 in Ansdell et al. (2014) are also removed by eye and not used for phase curve fittings since the average of the reduced R-band magnitude is far from other observations.
The uncertainties of gred,mean and rred,mean are given as the standard error of the weighted average of the light curves. These uncertainties are much smaller than those of the mean R-band magnitudes of our observations (∼0.015) due to uncertainties in the magnitude transformation between the Pan-STARRS and the Johnson systems. This is the same for the observation results in Ansdell et al. (2014), but the propagated uncertainties of the mean R-band magnitudes are smaller than ours since there is no magnitude transformation. Taking into account the fact that the light-curve amplitudes of Phaethon are about 0.1–0.2 mag and not all light curves in Ansdell et al. (2014) fully covered the rotation phase, we set the uncertainties of the mean reduced R-band magnitudes in Ansdell et al. (2014) to 0.05 mag. We obtained the mean R-band magnitudes as R = 14.88 ± 0.02 mag at α = 15|${_{.}^{\circ}}$|5, R = 14.66 ± 0.02 mag at α = 10|${_{.}^{\circ}}$|2, R = 14.63 ± 0.02 mag at α = 9|${_{.}^{\circ}}$|6, R = 14.56 ± 0.02 mag at α = 9|${_{.}^{\circ}}$|4, and R = 14.55 ± 0.02 mag at α = 9|${_{.}^{\circ}}$|7, where α is the mean solar phase angle at night.
We also tried the phase curve fitting with Shevchenko’s model (Shevchenko 1996), but the fitting curve showed a strong opposition surge. This is possibly due to the lack of observations at lower phase angles (α ≤ 9°). Thus, we did not derive the absolute magnitude with the Shevchenko model.
4 Discussion
4.1 Updated absolute magnitude
The opposition surge is seen in phase curves with the H–G model in figure 5a. This is not the case for the linear model by definition in figure 5b. Whether the opposition surge exists in Phaethon’s phase curve is unclear even with our latest results (α ≥ 9°). Devogèle et al. (2020) found that the phase curve of 2005 UD, which may have the same parent body as Phaethon (Ohtsuka et al. 2006; Jewitt & Hsieh 2006), shows very little or no opposition surge, although Phaethon and 2005 UD may have similar properties by chance (Ryabova et al. 2019; Kareta et al. 2021). In that case, the opposition surge may exist in Phaethon’s phase curve. We conservatively derived a possible absolute magnitude range as HV = 14.18–14.66 with HR, HR, lin, and their uncertainties considering both cases with and without the opposition surge. The comparison with the phase curve from in situ observations of DESTINY+ is awaited to investigate the existence of the opposition surge.
4.2 Diameter
In table 3, we compared Phaethon’s derived diameter with those estimated by other techniques: radar observations, TPMs, and occultation observations. Taylor et al. (2019) reported the volume-equivalent diameters as 6.2 km and 5.5 km using Doppler-only echo spectra with the spherical and top-shaped assumptions, respectively. Also, the mean equatorial diameter was derived as 6.25 km using the range-Doppler technique. Hanuš et al. (2016, 2018) derived a convex shape model for Phaethon and estimated the volume-equivalent diameter as 5.1 ± 0.2 km by a TPM with thermal infrared data taken by IRAS, UKIRT (Green et al. 1985), and Spitzer Space Telescope in combination with optical light curves. They assumed HV = 14.31 and G = 0.15 in their TPM. Masiero, Wright, and Mainzer (2019) estimated the volume-equivalent diameter as |$4.6^{+0.2}_{-0.3}$| km with the spherical assumption by a TPM with thermal infrared data taken by WISE. They assumed HV = 14.31 ± 0.03 in their TPM. Recently, MacLennan, Marshall, and Granvik (2022) derived a volume-equivalent diameter of 5.4 ± 0.1 km using a TPM that incorporates AKARI observations (Usui et al. 2011) in addition to the data used in all the prior studies with an accurate non-convex shape model. As for occultation observations, Devogèle et al. (2020) combined Phaethon’s convex shape model in Hanuš et al. (2018) and occultation chords from the USA on 2019 July 29. The volume-equivalent diameter is derived as 5.2 ± 0.1 km. Yoshida et al. (2023) reported that the projected size of Phaethon is 6.12 ± 0.07 × 4.14 ± 0.07 km by stellar occultation observations in Japan on 2021 October 13. The area-equivalent diameter of the projected ellipse is estimated to be 5.03 ± 0.07 km.
Comparison of Phaethon’s diameters.
| D | |||
|---|---|---|---|
| References | Methods | Shape | (km) |
| Taylor et al. (2019) | Doppler-only | sphere | 6.2* |
| Taylor et al. (2019) | Doppler-only | top-shape | 5.5* |
| Taylor et al. (2019) | Range-Doppler | — | 6.25† |
| Hanuš et al. (2016, 2018) | TPM | convex shape | 5.1 ± 0.2* |
| Masiero, Wright, and Mainzer (2019) | TPM | sphere | |$4.6^{+0.2}_{-0.3}$|* |
| MacLennan, Marshall, and Granvik (2022) | TPM | non-convex shape | 5.4 ± 0.1* |
| Devogèle et al. (2020) | Occultation | convex shape | 5.2 ± 0.1* |
| Yoshida et al. (2023) | Occultation | ellipse | 5.03 ± 0.07‡ |
| This study H–G model + Geem et al. (2022) | Photometry and polarimetry | — | 5.22–6.74§ |
| This study linear model + Geem et al. (2022) | Photometry and polarimetry | — | 4.30–5.56§ |
Volume-equivalent diameter.
Mean equatorial diameter.
Area-equivalent diameter of a projected ellipse.
Rotation-averaged area-equivalent diameter.
The diameter derived with the H–G model in this study falls into the larger range of diameters. This is consistent with radar and occultation observations. On the other hand, the diameter derived with the linear model falls into the smaller range of diameters, which is consistent with those derived by TPMs.
4.3 Surface inhomogeneity
We conducted simultaneous tricolor observations of Phaethon for the first time. The simultaneity in the multicolor photometry is crucial to investigate the surface inhomogeneity of the asteroid since it can reduce the effects of atmospheric variations on the measurements.
We referred to two published observational studies on surface spectroscopic variations of Phaethon. Using multicolor photometry, Tabeshian et al. (2019) reported a B − V color variation of about 0.1 mag with observations from 2017 December 11–19. They interpreted that the color variation with sub-observer latitude may be associated with craters on the surface since they observed both southern and northern parts in the 2017 apparition. Lin et al. (2020) detected an R − I color variation of 0.037 mag in rotation phase with observations from 2017 October 6–December 21. They interpreted that the color variation may be caused by the inhomogeneous surface.
We divided the phased colors into five sections equally and calculated the weighted mean colors as shown in figure 6. The largest deviations from the global mean values are 0.018 mag and 0.020 mag in the g − r and r − i colors, respectively, considering the uncertainties. Color variations in the 2021 apparition are smaller than those reported in previous studies.
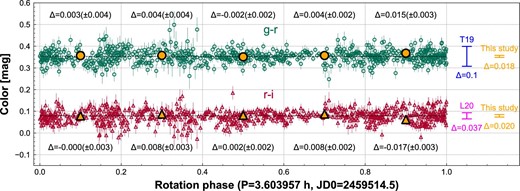
Phased colors of Phaethon from five photometric nights. g − r and r − i colors are shown by open circles and open triangles, respectively. Weighted average g − r and r − i colors in each night are presented with dashed and dash–dotted horizontal lines, respectively. Weighted average g − r and r − i colors per 0.2 phase are shown by filled circles and filled triangles with derivations from the global average colors. The values in parentheses are the uncertainties of the binned colors. The ranges corresponding to the color variations reported in Tabeshian et al. (2019: T19), Lin et al. (2020: L20), and this study are presented by arrows on the right.
Phaethon’s latitudinal surface inhomogeneity can probably explain this inconsistency. As is often the case in near-Earth asteroids, the aspect angles are different in each apparition and sometimes even in the same apparition. We mainly observed the slightly northern part of Phaethon in our observing runs; sub-observer latitudes were calculated with the pole orientation λ = 316° and β = −48|${_{.}^{\circ}}$|7 (MacLennan et al. 2022) as 29|${_{.}^{\circ}}$|7 to 29|${_{.}^{\circ}}$|2 between October 27 and 29, 25|${_{.}^{\circ}}$|6 to 24|${_{.}^{\circ}}$|8 between November 10 and 12, and 19|${_{.}^{\circ}}$|5 to 18|${_{.}^{\circ}}$|5 between November 24 and 26. On the other hand, the aspect angle was changed a lot in the 2017 apparition. Thus, our observational result suggests that Phaethon’s Northern hemisphere is almost homogeneous compared with the southern/northern latitudinal difference seen in Tabeshian et al. (2019). This may be relevant to the latitudinal heterogeneity of the surface grain sizes on Phaethon (MacLennan et al. 2022).
Both the latitudinal surface inhomogeneity and our homogeneous color are not necessarily inconsistent with the color variation in the rotation phase reported by Lin et al. (2020). If the colors in the former (0.0–0.5) and the latter (0.5–1.0) rotation phases in Lin et al. (2020) were derived using data obtained in different periods (i.e., aspect angles), this is consistent with the latitudinal surface inhomogeneity. Since there is no detailed information on the observations in Lin et al. (2020), such as the observation date and time of each piece of data, further discussion is beyond the scope of this paper. We note that there is a possibility that the reported surface color variation is affected by observational artifacts. The situation is the same for 2005 UD. Kinoshita et al. (2007) detected the surface color variation on 2005 UD by multicolor photometry in 2005. However, Devogèle et al. (2020) did not detect any color variations on 2005 UD by spectroscopy on two nights in 2018. For reliable detections of surface color variation, independent observations (e.g., optical and NIR, López-Oquendo et al. 2022) and/or observations in multiple rotation phases are desired in addition to careful data reduction. As for Phaethon, the DESTINY+ mission might put an end to the discussion related to its surface inhomogeneity.
5 Conclusions
We conducted simultaneous tricolor photometry for the first time for the DESTINY+ mission target asteroid (3200) Phaethon. Using observations at lower phase angles down to ∼9°, we updated the absolute magnitude HV and the slope parameter G as HV = 14.23 ± 0.02 and G = 0.040 ± 0.008 with the H–G model. Assuming geometric albedo derived by polarimetry, Phaethon’s diameter was estimated to be in the range of 5.22–6.74 km, which is consistent with diameters derived from other techniques such as radar and occultation observations. We derived HV = 14.65 ± 0.02 with the linear model, which corresponds to a diameter range of 4.30–5.56 km. The diameters by thermophysical modelings should be updated using our derived HV and G values. No noticeable rotational spectral variation was found in our simultaneous multicolor light curves from 2021. Our observational result suggests that Phaethon’s Northern hemisphere is more homogeneous than the southern/northern latitudinal difference reported in previous studies.
Acknowledgements
The authors are grateful to our reviewer Eric MacLennan for helpful comments on the first version of this manuscript. JB would like to express his gratitude to the Iwadare Scholarship Foundation and the Public Trust Iwai Hisao Memorial Tokyo Scholarship Fund for the grants. This work is supported in part by the Optical and Near-Infrared Astronomy Inter-University Cooperation Program (OISTER), the Ministry of Education, Culture, Sports, Science and Technology (MEXT) of Japan, JST SPRING, Grant Number JPMJSP2108, and the UTEC UTokyo Scholarship. The authors thank the TriCCS developer team (which has been supported by the JSPS KAKENHI Grant Numbers JP18H05223, JP20H00174, and JP20H04736, and by NAOJ Joint Development Research).
Appendix 1 Phased light curves
Phased light curves for each day are presented here in figure 7.
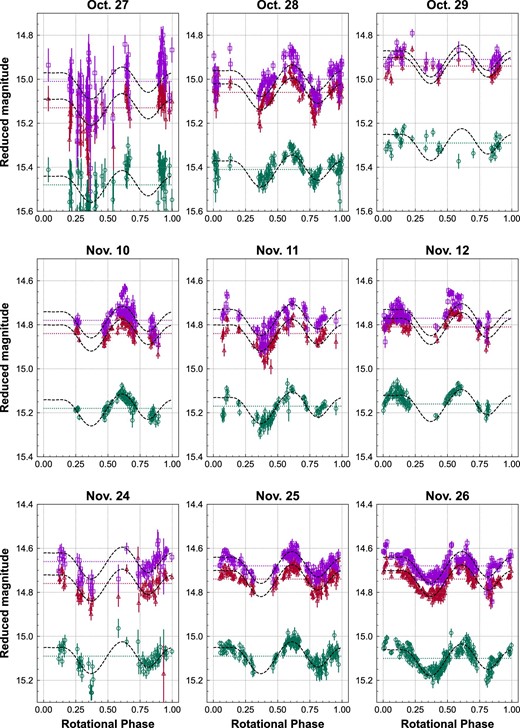
Phased light curves of Phaethon from nine days. From top to bottom, g- (circles), r- (triangles), and i-band (squares) light curves for different days are presented. Bars indicate the 1σ uncertainties. Model curves adopting the number of harmonics n = 4 are shown by dashed lines. Mean reduced magnitudes are given as constant terms of the model curves as presented by dotted lines.
Appendix 2 Photometric conditions
The photometric results of the reference stars and CTIs are presented in figures 8 and 9. The color deviations between those in the Pan-STARRS DR2 and those derived here are at most 0.02 mag for the reference stars on October 28, November 10, 12, 25, and 26. Thus, we presume that the systematic uncertainty of the colors is 0.02 mag in both g − r and r − i. We consider October 28, November 10, 12, 25, and 26 as photometric nights since the CTIs are stable on those days.
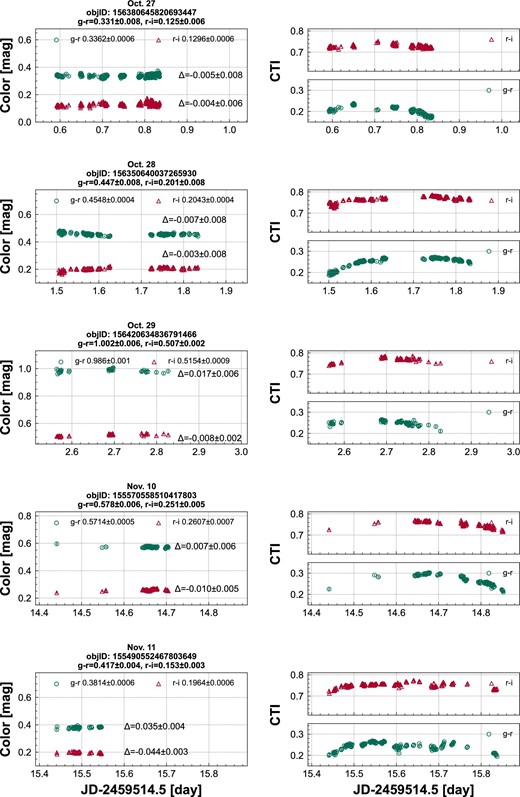
Colors of reference stars on October 26–28 and November 10, 11 (left). Object name (objID) and colors in the Pan-STARRS DR2 are given at the top of the panel. g − r and r − i colors are shown by circles and triangles, respectively. Bars indicate the 1σ uncertainties. The differences Δ, i.e., colors in Pan-STARRS DR2 minus those derived here, are given. The number of observations of reference stars differs from star to star due to the change in the field of view. Time-series CTIs on October 26–28 and November 10, 11 (right). CTIg − r and CTIr − i are shown by circles and triangles, respectively. Bars indicate the 1σ uncertainties.
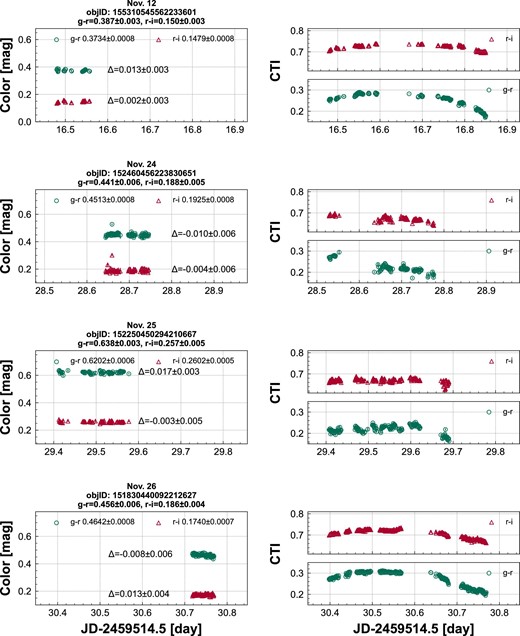
Same as figure 8 but for November 12, 24, 25, and 26.
Footnotes
McCully, C., et al. 2018, Astropy/Astroscrappy: V1.0.5 Zenodo Release 〈https://doi.org/10.5281/zenodo.1482019〉.
Barbary, K., Boone, K., & Deil, C. 2015, sep: v1.3.0 〈https://doi.org/10.5281/zenodo.15669〉.
