


Abstract
We present 250 GHz continuum and H29α line data toward W 49 N:A2, a hypercompact H ii region ionized by an O9 star. The data obtained with ALMA at a resolution of ∼0|${_{.}^{\prime\prime}}$|05 (600 au) confirmed the presence of an ionized ring with a radius of ∼700 au inclined by ∼50° (0° for pole-on). It has a width of ∼1000 au and is relatively flat with a scale height of less than several hundred au. The tilted ring, or the apparent ellipse, has a prominent velocity difference between its NW and SE ridges along the minor axis, suggesting that it is expanding in the equatorial plane at a velocity of 13.2 km s−1. The ring also shows a hint of rotation at 2.7 km s−1, which is significantly (2.5 σ) smaller than the Kepler velocity of 5.2 km s−1 at its radius around the 20 M⊙ star. This can be interpreted as that the ring gas has been transported from the radius of ∼170 au by conserving its original specific angular momentum that it had there. The ionized ring may thus be a remnant of the accretion disk that fed the O9 star, the radiation or magnetic activities of which became so strong that the disk accretion was reversed due to the intense thermal or magneto-hydrodynamic pressure around the star. The data has revealed a rare example of how a massive star terminates its accretion at the end of its formation, transforming a hypercompact H ii region into an ultracompact H ii region.
1 Introduction
Hypercompact H ii (HC H ii) regions are characterized by their small sizes (<0.05 pc or 10000 au), high electron densities (ne > 106 cm−3), large emission measures (>108 pc cm−6), and broad radio recombination line widths (ΔV > 40 km s−1) (Sewilo et al. 2004; Kurtz 2005; Murphy et al. 2010). They are considered to precede the phase of ultracompact H ii (UC H ii) regions in massive star formation.
Photoevaporating accretion disk models may explain the characteristics of HC H ii regions (Hollenbach et al. 1994; Lizano et al. 1996; Keto 2007), in which inevitable outflows may be responsible for the broad radio recombination lines (e.g., Tanaka et al. 2016). Alternatively, the broad line width may also be explained by the pressure broadening caused by the high-density ionized gas in HC H ii regions (e.g., Brocklehurst & Seaton 1972; Kurtz 2005). Numerical calculations show that a small quasi-spherical H ii region first forms within the accretion flow (Keto 2007). The initial H ii region is gravitationally trapped within the Bondi–Parker radius, while the accretion may proceed through the H ii region (Keto 2002). As the ionizing flux increases, the H ii region expands driven by the ionized gas pressure, transitioning to an ionized bipolar outflow, and eventually, as the outflow opening angle increases, the accretion flow is confined to a thin disk. The photoionization of the bipolar low-density cavities pushes mass from high latitudes toward the disk. This feedback yields an increase in disk mass and hence stellar accretion rate in the last stage of massive star formation (Kuiper & Hosokawa 2018).
W 49 N:A is one of the UC H ii regions cataloged by De Pree et al. (De Pree et al. 1997) in their 8.3 GHz map. Higher-resolution observations at 45 GHz have resolved it into two sources, A1 and A2 (De Pree et al. 2000), with A2 showing a distinct ring located at the center of the oppositely directed, edge-brightened bipolar lobes of ionized gas (De Pree et al. 2020). W 49 N:A2 is ionized by a Lyman continuum photon luminosity equivalent to an O9 zero-age main sequence (ZAMS) star and has a total ionized gas mass of 0.12 M⊙ (De Pree et al. 2020). In this paper, we present the 250 GHz continuum and H29α line data for W 49 N:A2 and examine its kinematics. We assume the distance to W 49 N to be |$11.11^{+0.79}_{-0.69}\:$|kpc (Zhang et al. 2013) throughout this paper.
2 ALMA archival data
We used Atacama Large Millimeter/submillimeter Array (ALMA) archival data (#2018.1.00520.S: PI D. Wilner) for the study of protostars in W 49 N. The observations were performed from 2019 July to September using 43–48 12 m antennas. The shortest and longest baselines for the 12 m antennas were 38.4 m and 3637.7 m, respectively. Flux, bandpass, pointing, and phase calibrations were carried out with J1905+0952, J1907+0907, and J1908+1201.
Four spectral windows (240.76–242.63, 242.61–244.49, 255.86–257.74, and 257.70–259.57 GHz), each covering a ∼2 GHz bandwidth, were set up to observe the target source W 49 N. Image analysis was done using the CASA software (The CASA Team 2022). We separated the continuum and line emissions by fitting a linear baseline to line-free channels of each spectral window using the “uvcontsub” task of CASA. The continuum data at the effective frequency of 250 GHz was then made by averaging the line-free intensities of all four windows.
For the H29α line data, we set up a data cube with a spectral resolution of 2 km s−1. Although the frequency resolution (channel width) was 1128.91 kHz (∼1.31 km s−1), there was variation in the frequency-to-channel relation between datasets obtained on different days. We thus proportionally distributed the flux received in an original spectral channel into the nearest 2 km s−1 bins by setting the width parameter of the “tclean” task to be 2 km s−1 to compensate for the variation. We analyzed three sets of data 3.1 hr long in total, but the second set showed a large noise level, probably due to errors in the calibration process, and was not used.
The phase center was α(ICRS) |$= {19^{\rm h}10^{\rm m}13{^{\rm s}_{.}}300}$| and δ(ICRS) = |${09{^{\circ}}06^{\prime }14.^{\prime \prime }00}$| with a primary beam field of view (HPBW) of 23|${_{.}^{\prime\prime}}$|3. We set the parameters of the “tclean” task as weighting = “briggs” and robust = “0.5.” This setting creates a PSF that smoothly varies between natural and uniform weighting based on the signal-to-noise ratio of the measurements and a tunable parameter that defines the noise threshold. The synthesized beam size of the continuum image was 0|${_{.}^{\prime\prime}}$|046 × 0|${_{.}^{\prime\prime}}$|032 (PA = 70|${_{.}^{\circ}}$|3) at the effective frequency of 250 GHz, and that of the H29α recombination line image was 0|${_{.}^{\prime\prime}}$|052 × 0|${_{.}^{\prime\prime}}$|033 (PA = 58|${_{.}^{\circ}}$|0) at its frequency of 256 GHz. The resultant noise levels were 0.7 mJy beam−1 and 2.0 mJy beam−1 for the continuum and line maps, respectively.
3 Results and discussion
3.1 Continuum and H29α rings
Figure 1 shows the 250 GHz continuum image of W 49 N:A2, with A1 also seen at its ∼0|${_{.}^{\prime\prime}}$|4 north. A2 exhibits an extended emission elongated from the NE to SW with a central dip surrounded by a ridge of elliptical emission. This feature was first noted by De Pree et al. (2000) in their 45 GHz continuum map, which is shown by contours in figure 1 for comparison.1 This kind of annular morphology is relatively common in UC H ii regions and is interpreted as a ring or a shell, which may be distinguishable from the observed contrast ratio between the flux density of the shell peak and that of the cavity (Turner & Matthews 1984). For the 45 GHz image of W 49 N:A2, the ratio is inconsistent with a shell morphology, and the observed elliptical structure is interpreted as a ring or a flattened disk with a central gap of diameter ∼0|${_{.}^{\prime\prime}}$|08 (∼880 au) (De Pree et al. 2000, 2020). The major axis of the ellipse is perpendicular to the axis of the ionized bipolar outflow seen as an edge-brightened double-lobed structure in the 8.3 GHz maps (De Pree et al. 1997, 2020), which also suggests that the observed elliptical structure is a tilted equatorial ring perpendicular to the outflow. We therefore assume in this paper that the 250 GHz elliptical emission represents a tilted ring, which is intrinsically circular on the equatorial plane of the star. The ring is supposed to be geometrically and kinematically symmetric with respect to the polar axis of the star (rotational symmetry) and its equatorial plane (plane symmetry).
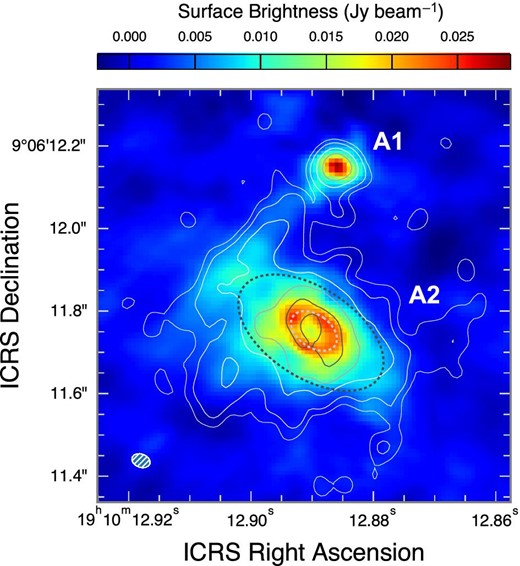
250 GHz continuum map superposed on the contours of the 45 GHz continuum emission (De Pree et al. 2000) at 1, 2, 5, 10, and 20 mJy beam−1. The two dotted ellipses show the ring (white) and the FWHM size of the entire emission nebula (black).
Table 1 lists the observed parameters of W 49 N:A2 derived from the 2D Gaussian fitting tool of CASA. The total flux density of A2 at 250 GHz is 1.11 Jy, which is compared with its 45 GHz flux density of 0.47 Jy to give a spectral index α = 0.5 (Fν ∝ να). Preliminary measurements using additional archival data resulted in the flux densities of 1.3 ± 0.3, 2.7 ± 0.2, 1.3 ± 0.2, and 0.59 ± 0.09 Jy at 100, 230, 360, and 450 GHz, respectively, including both A2 and A1.2 If we use all these data points, we obtain α = 0.4 ± 0.7, indicating that the source has a flat or slowly rising spectrum. The flux density distribution does not show any steeply (α > 2) rising tendency toward submillimeter wavelengths, suggesting a negligible contribution from thermal dust emission at these frequencies. We examined any molecular line emission directly toward the A2 nebulocity in the current archive data, finding no molecular lines significantly detected within 200 mas in radius, inside which the ionized ring is located. In particular, the lines of CH3CN (JK = 14K–13K), which would be a dominant molecular emission in the band if molecular gas existed, show very little (<3σ) emission there. In fact, the CH3CN emission was detected around A2 at radii larger than 200 mas, corresponding to the outside of the main ionized nebula A2. This tendency is the same for emissions from other molecular lines such as 13CO or SO. In other words, there is a hole of molecular emission toward A2, suggesting that no neutral disk is associated with the ionized ring inside the emission nebula A2.
Observed parameters.
| 250 GHz continuum | H29α line | 45 GHz continum* | |
|---|---|---|---|
| Center position | |||
| α(ICRS) 19h10m+ | 12|${_{.}^{\rm s}}$|8921 ± 0|${_{.}^{\rm s}}$|0003 | 12|${_{.}^{\rm s}}$|8927 ± 0|${_{.}^{\rm s}}$|0005 | 12|${_{.}^{\rm s}}$|8929 ± 0|${_{.}^{\rm s}}$|0001 |
| δ(ICRS) 09°06′+ | 11|${_{.}^{\prime\prime}}$|756 ± 0|${_{.}^{\prime\prime}}$|004 | 11|${_{.}^{\prime\prime}}$|781 ± 0|${_{.}^{\prime\prime}}$|008 | 11|${_{.}^{\prime\prime}}$|837 ± 0|${_{.}^{\prime\prime}}$|002 |
| Beam size (position angle) | 0|${_{.}^{\prime\prime}}$|046 × 0|${_{.}^{\prime\prime}}$|032 (70|$\fdg$|3) | 0|${_{.}^{\prime\prime}}$|052 × 0|${_{.}^{\prime\prime}}$|033 (61|$\fdg$|5) | 0|${_{.}^{\prime\prime}}$|055 × 0|${_{.}^{\prime\prime}}$|044 (8|$\fdg$|6) |
| Image component size† | |||
| Major axis FWHM | 400 ± 20 (mas) | 510 ± 30 (mas) | 270 ± 6 (mas) |
| Minor axis FWHM | 220 ± 10 (mas) | 310 ± 20 (mas) | 182 ± 4 (mas) |
| Position angle | 58° ± 2° | 40° ± 4° | 53° ± 3° |
| Inclination angle | 57° ± 2° | 53° ± 3° | 48° ± 2° |
| Peak brightness | 18.3 ± 0.1 (mJy beam−1) | 1.48 ± 0.07 (Jy beam−1 km s−1) | 22.2 ± 0.5 (mJy beam−1) |
| Total flux density | 1.11 ± 0.03 (Jy) | 152 ± 7 (Jy km s−1) | 0.47 ± 0.01 (Jy) |
| Ring size‡ | |||
| Major axis (PA = 55°) | 124 ± 4 (mas) | 116 ± 10 (mas) | 117 ± 5 (mas) |
| Minor axis (PA = 145°) | 79 ± 1 (mas) | 82 ± 3 (mas) | 96 ± 4 (mas) |
| Inclination angle | 50° ± 2° | 45° ± 6° | 35° ± 5° |
| Ring width† ‡ | |||
| Major axis FWHM (2a) | 90 ± 12 (mas) | 103 ± 41 (mas) | 84 ± 38 (mas) |
| Minor axis FWHM (2β) | 54 ± 9 (mas) | 62 ± 11 (mas) | 78 ± 39 (mas) |
| cos −1 (β/a) | 53° ± 9° | 53° ± 19° | 22° ± 97° |
The 250 GHz emission has the major and minor axis lengths of 400 mas × 220 mas (deconvolved FWHM), respectively, corresponding to 4400 au × 2400 au, with a major axis position angle of 58°. This gives an inclination angle of 57° ± 2° (0° for pole-on) if a geometrically thin circular structure is assumed. The distance between the two ridges of the ring is 124 ± 4 mas along the major axis, corresponding to 690 au, and 79 ± 1 mas along the minor axis, when a double Gaussian fit is applied to the spatial profiles. The minor-to-major axis ratio of the ring suggests an inclination of 50° ± 2° if we assume that the ring is intrinsically circular when viewed pole-on.
Figure 2 shows the moment 0 map of the H29α emission integrated over the velocity range from −20 to 60 km s−1 superposed on the 250 GHz continuum contours. The line emission follows the continuum map well, showing the elliptical ring of 116 mas × 82 mas, which are the distances between the ridges along the major (PA = 55°) and minor (PA = 145°) axes, respectively. The ring’s axis lengths are consistent between the 250 GHz and H29α data within the errors. We can thus naturally assume that the H29α emission represents the same ring as the 250 GHz continuum. The minor-to-major axis ratio of the H29α ring gives an inclination angle of 45° ± 6°.
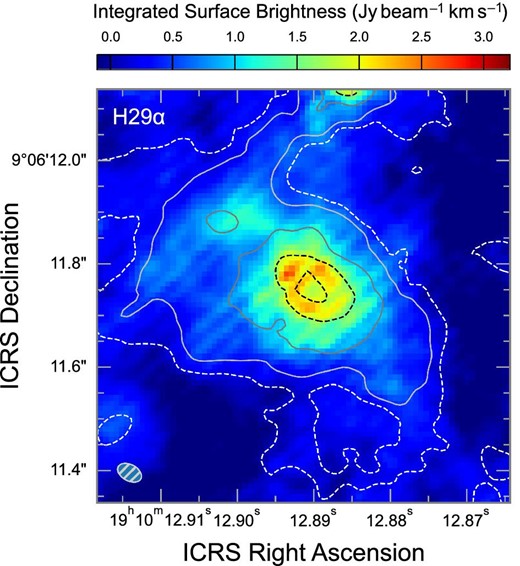
Integrated intensity (moment 0) map of the H29α emission superposed on the 250 GHz continuum contours at |$1\%$|, |$2\%$|, |$5\%$|, and |$10\%$| of 194 mJy beam−1. The integration range is from VLSR = −20 to 60 km s−1.
Table 1 also lists the beam deconvolved FWHM widths of the ring along the major and minor axes. The widths along the ring’s major axis, corresponding to its radial width on the equatorial plane, are 90 mas (1000 au) and 100 mas (1100 au) for the 250 GHz and H29α, respectively, They are consistently larger than the widths of 54 and 60 mas along the minor axis for the 250 GHz and H29α rings, respectively. This means that the ring has a smaller thickness than its radial width, as we will discuss below. This tendency was not confirmed for the 45 GHz ring. This is because the 45 GHz ring does not show a clear elliptical shape (see figure 2i of De Pree et al. 2000), and the double-Gaussian fit to its spatial profiles along the major and minor axes gives large errors for the ring widths. We will thus use only the 250 GHz and H29α data for the following discussion about the scale height.
To estimate the scale height of the ring, we assume a simple model that the ring has an elliptical cross-section with the semi-axis lengths of a and b along the ring’s equatorial plane and polar axis, respectively. The configuration is shown in figure 3. The ellipse on the left shows the tilted ring projected on the plane of the sky, while the ellipse on the right is a cross-section of the ring cut along the plane defined by the ring’s polar and radial axes. Under this model, the value 2a represents the non-projected radial width of the ring and 2b stands for its thickness, i.e., two times the scale height. The value 2β is the apparent width of the projected ring along its minor axis.
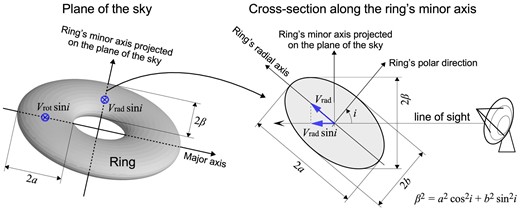
Ring model with an elliptical cross-section. The observed width 2β of the ring along the minor axis on the plane of the sky is related to the elliptical semi-axis lengths a and b as β2 = a2cos 2i + b2sin 2i, where i is the inclination of the ring (i = 0 for pole-on). If the ring has a radial (expansion or contraction) velocity Vrad and a rotational velocity Vrot along its equatorial plane, the line of sight velocities toward the major and minor axes are ±Vrorsin i and ±Vradsin i, respectively.
The ring width 2a can be directly measured by the width of the projected ring along its major axis, while the value 2β can be obtained from the width of the projected ring along its minor axis. The scale height b is then estimated from the values of a and β using the geometrical relation β2 = a2 cos 2i + b2 sin 2i, where i is the inclination angle of the ring (i = 0° for pole-on). If, for example, the ring cross-section was circular, i.e., a = b, we would obtain the trivial result β = a. If the ring was flat, i.e., b = 0, we would obtain another trivial result: β = a cos i.
For the 250 GHz and H29α data in table 1, the ring widths a and β are relatively well defined. The values of cos −1(β/a) are consistent with the ring inclination angle of 50° and 45°, respectively, within the errors. This means that the value b = 0 is consistent with the observations, suggesting that the ring is relatively flat and has a small scale height. We estimate a 2σ upper limit to the scale height b by taking 2σ larger and smaller values for β and a, respectively. The results are b < 410 au and b < 690 au for the 250 GHz and H29α rings, respectively. As expected, the ring’s scale height is smaller than its radial widths of ∼1000 au. It is also significantly smaller than the pressure scale height of ∼1700 au of an ionized gas disk of 10000 K around a 20 M⊙ star at a radius of 690 au, implying that the ring is not a static structure and is being evaporated by the ionizing radiation from the central star.
3.2 Velocity structure of the ring
Figure 4 shows the velocity channel maps of the H29α line, together with a moment 1 (mean velocity) map on the bottom right-hand panel. It demonstrates a clear velocity shift along the minor axis of the elliptical ring. The NW half of the ring is bright at the radial velocities less than 0 km s−1, while the SE part is bright at velocities larger than 30 km s−1. Under our assumption that the ring is intrinsically circular and symmetric with respect to its polar axis and equatorial plane, the line-of-sight velocity toward the minor axis reflects only the radial motion of the tilted ring, and not its rotational motion (see figure 3). Thus the observed large velocity difference between the two ridges along the minor axis means that radial motion is dominant in the ring. Whether the motion corresponds to expansion or contraction is not straightforward, and will be discussed in subsection 3.3.
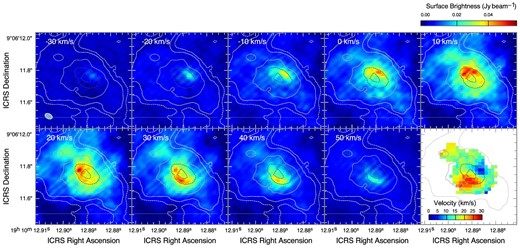
Velocity channel maps of the H29α line superposed on the 250 GHz continuum contours at |$1\%$|, |$2\%$|, |$5\%$|, and |$10\%$| of 194 mJy beam−1. The bottom right-hand panel shows a mean velocity (moment 1) map.
At VLSR = −10 and 0 km s−1, there is a hint that the NE side of the ring has stronger emission than the SW side. At VLSR = 40 and 50 km s−1, the emission peak is slightly shifted to the west along the southern part of the ring with respect to the minor axis of symmetry.
To examine this tendency in more detail, we show in figure 5 the position velocity diagrams along the major and minor axes. The velocity difference across the minor axis is obvious (right-hand panels). The position–velocity (PV) diagrams along the strips parallel to the major axis (left-hand panels) show convex features on the SE side, and, alternatively, concave features on the opposite NW side. Such convex/concave features in a PV diagram arise when the system has a systematic radial motion (expansion or contraction). The entire ring thus has a consistent radial motion, either expansion or contraction.3
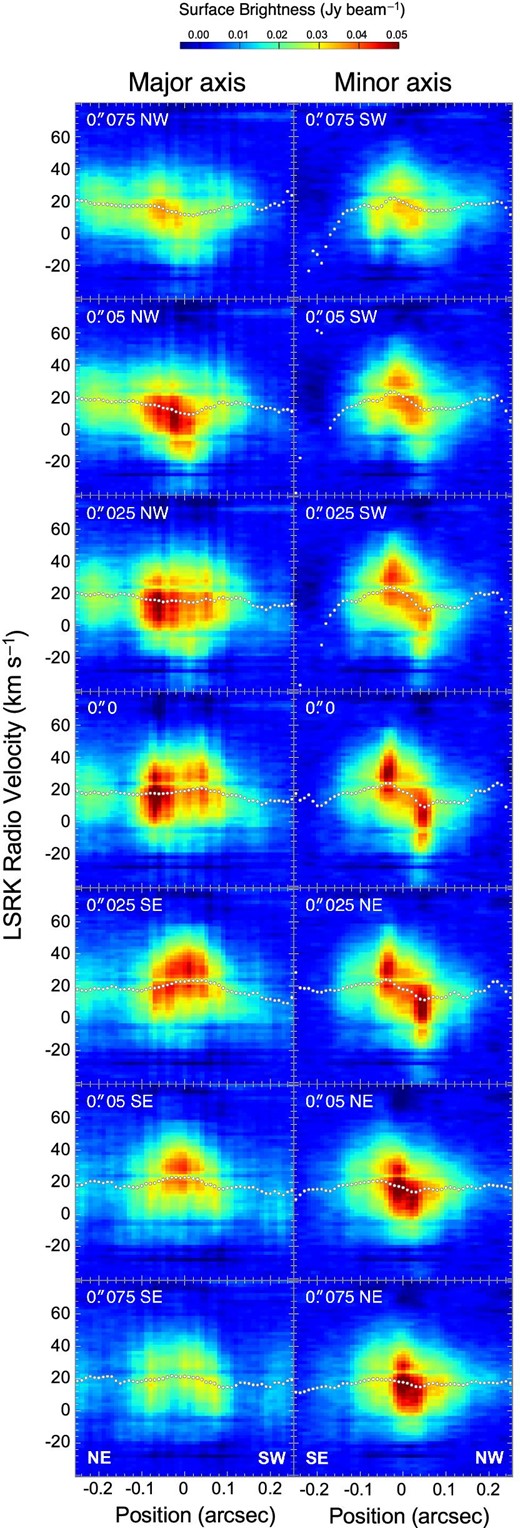
Position–velocity diagrams of the H29α line along the strips parallel to the major (PA = 55°, left) and minor (PA = 145°, right) axes. The brightness was averaged over three pixels (0|${_{.}^{\prime\prime}}$|03) perpendicular to each strip. The offset of each strip from the major (left) or minor (right) axis is shown at the top left-hand corner of each panel. Small circles show the mean velocities.
In the PV diagram at offset 0″ along the major axis, we do not see a drastic velocity change with positions. There seems to be a subtle difference in the line-of-sight velocity between the NE and SW ridges of the ring, and the entire PV diagram is marginally tilted. To examine the velocity structure of the ring in more detail, we plotted in figure 6 the variations of peak brightness, peak velocity, and FWHM velocity width of the H29α line along the major (left) and minor (right) axes. The values were measured by applying Gaussian fits to the line profiles on the PV diagrams.
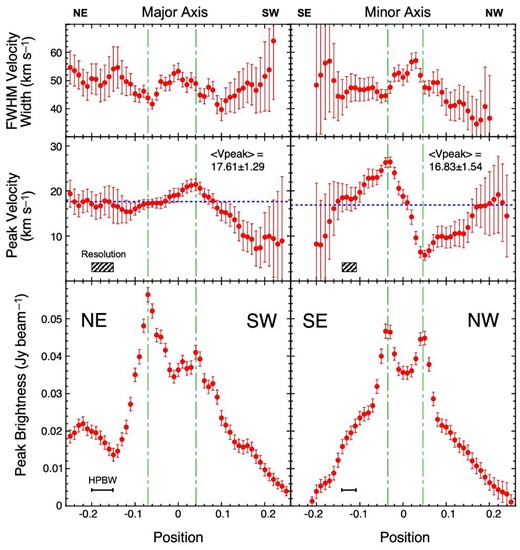
Variations of peak brightness, peak velocity, and FWHM velocity width of the H29α line along the major (left) and minor (right) axes. Data points with large errors are not plotted.
The radial velocities along the minor axis are 26.3 and 6.0 km s−1 at its SE (−0|${_{.}^{\prime\prime}}$|035) and NW (+0|${_{.}^{\prime\prime}}$|047) ridges, respectively. The apparent “smooth” velocity gradient from the SE to NW ridge is naturally attributed to a stepwise velocity difference smeared by the beam, which has an HPBW similar to the ring width. Because the velocity difference between the SE and NW ridges along the minor axis is caused either by expansion or contraction of the ring under our geometrical and kinematical assumptions, the velocity difference gives an expansion or contraction velocity of 13.2 ± 1.0 km s−1 at the radius of 706 au after correcting for the inclination angle, which is taken to be 50°.
The radial velocity along the major axis, which solely reflects the ring’s rotation velocity under our assumption, varies from 17.2 to 21.4 km s−1 as the position moves from the NE peak at −0|${_{.}^{\prime\prime}}$|073 to the SW peak at +0|${_{.}^{\prime\prime}}$|042. The velocity difference corresponds to a rotation velocity of 2.7 ± 1.0 km s−1 at the radius of 642 au after correcting for the inclination angle.
3.3 Expanding ring of ionized gas and its implication
We have found a remarkable fact that the ionized ring of W 49 N:A2 has a predominant radial motion of 13.2 ± 1.0 km s−1, with a hint of rotation at 2.7 ± 1.0 km s−1, at ∼700 au in radius. The ionizing source of A2 emits Lyman continuum photons equivalent to an O9 (ZAMS) star (De Pree et al. 2020), which should have a mass of 20 ± 7 M⊙ (Hohle et al. 2010).4 The ionized gas mass of A2 is 0.12 M⊙ (De Pree et al. 2020), which, together with the absence of molecular and dust emissions toward A2, implies that the total amount of mass within the ring cannot be much larger than 20 M⊙.
It is impossible that this amount of mass gravitationally accelerates any gas to ∼13 km s−1 at a distance of R = 700 au from the center of A2. We would need a total mass as large as 70 M⊙ if a lump of gas freely falling toward the central star obtains the three-dimensional velocity of ∼13 km s−1 at the radius. Alternatively, we can derive a Keplerian mass of 5.3–5.7 M⊙ from the inclination-corrected rotation velocity of 2.7 km s−1 at a radius of 642–700 au. This mass is significantly smaller than the expected mass of an O9 star. We, therefore, conclude that the ring’s observed radial motion cannot be gravitational infall or contraction.
Expansion, on the other hand, is a natural cause of motion. At the beginning of H ii region formation, ionized gas around a massive star is pushed outward due to the thermal pressure or magneto-hydrodynamical acceleration (Commerçon et al. 2022). A radially expanding motion perpendicular to the outflow axis has, for example, been observed toward Orion Source I (Hirota et al. 2017), where the expansion velocity of ∼10 km s−1 was observed above and below the disk plane that is supposed to be driving a magneto-centrifugal outflow.
The current case of A2 has a linear scale 10 times larger than the case of Source I, so we are unable to resolve the motion in the disk from that in the outflow. However, the entire ionized ring, which could be a mixture of a disk and an outflow, shows expansion with a hint of rotation, while in the case of Source I no radial motion was detected in the disk plane and rotation is dominant there. In the case of W 49 N:A2, the dominant motion in its equatorial plane is expansion.
The small rotation velocity of the A2 ring is consistent with its expanding motion. The observed rotation velocity at R ∼ 650 au is 2.7 ± 1.0 km s−1, which is significantly (2.5 σ) smaller than the Kepler velocity of 5.2 km s−1 at the radius around a 20 M⊙ star. It may be the case that the gas at R ∼ 650 au has been transported from an inner radius, specifically from R ∼ 170 au. The gas was originally in Keplerian rotation at the radius but was pushed out to the current radius by conserving its specific angular momentum of ∼1800 au km s−1. Such a phenomenon may occur when the accretion through the equatorial disk becomes hampered and reversed by the intense thermal or magnetohydrodynamical pressure caused by the central star as its luminosity increases dramatically at the end of Kelvin–Helmholtz contraction (Tanaka et al. 2016, 2017). Although we cannot exclude the possibility of a small amount of accretion through the mid-plane of the disk even at this later stage of massive star formation, we did not find any evidence of accretion around the ionizing star of A2.
The ionized gas toward A2 shows broad H29α line widths of ΔV = 40–60 km s−1, which may be attributed to a gas outflow with a large opening angle or to pressure broadening due to the high-density (Brocklehurst & Seaton 1972; Kurtz 2005). There is a marginal increase in line width inside the ring, seen on the upper panels of figure 6. The outflow there may have a higher velocity because it is accelerated in a region closer to the central star, or the outflow there is preferentially directed toward the polar direction.
From these pieces of observational evidence, we conclude that the massive star ionizing the HC H ii region W 49 N:A2 has finished its main accretion phase and is in the phase of disrupting its natal accretion disk. W 49 N:A2 thus provides an example of how a massive star terminates its accretion at the end of its formation. As time goes on, the ring will be fully evaporated by the stellar radiation. The ionized outflow will expand by gradually decreasing its expansion velocity, and the HC H ii region will eventually become a UC H ii region. Figure 7 shows a schematic drawing of the observed features, where outflow velocities are derived from the H29α line widths deconvolved by its thermal widths at the assumed temperature of 10000 K (De Pree et al. 1997).
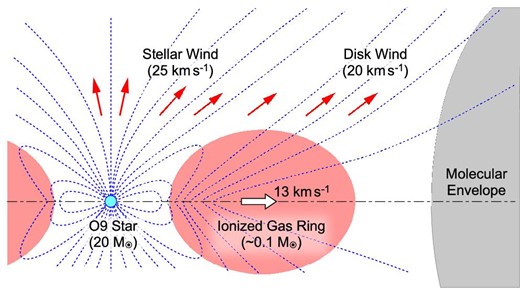
Schematic drawing of W 49 N:A2.
4 Conclusions
We have presented ALMA archival data for 241–260 GHz continuum and H29α recombination line observations toward the HC H ii region W 49 N:A2 at a resolution of ∼0|${_{.}^{\prime\prime}}$|05 (600 au), confirming the presence of an ionized ring of ∼700 au in radius inclined by ∼50°. The tilted ring has a prominent velocity difference between its NW and SE ridges along the minor axis, suggesting that it is expanding in the equatorial plane at a velocity of 13.2 km s−1.
The ring also shows a hint of rotation at 2.7 km s−1, which is significantly (2.5 σ) smaller than the Kepler velocity of 5.2 km s−1 at the ring radius around a 20 M⊙ star. This can be interpreted that the ring gas has been transported from the radius of ∼170 au by conserving its original specific angular momentum that it had there. The ionized ring may thus be a remnant of the accretion disk that fed the O9 star, the radiation or magnetic activities of which recently became so strong that the accretion was reversed. W 49 N:A2 provides a rare example of how a massive star terminates its accretion at the end of its formation and how an HC H ii region transitions to a UC H ii region.
Acknowledgements
ALMA is a partnership of ESO (representing its member states), NSF (USA), and NINS (Japan), together with NRC (Canada), NSC and ASIAA (Taiwan), and KASI (Republic of Korea), in cooperation with the Republic of Chile. The Joint ALMA Observatory is operated by ESO, AUI/NRAO, and NAOJ. We used the ALMA archival data #2018.1.00520.S (PI: D. Wilner), #2018.1.00589.S (PI: R. Galván-Madrid), #2016.1.00620.S (PI: A. Ginsburg), #2015.1.01535.S (PI: B. R. Alejandro), #2017.1.00318.S (PI: R. Galván-Madrid), #2017.1.01499.S (PI: F. Xiaoting).
Footnotes
The 45 GHz continuum map is shifted by (Δα, Δδ) = (−0|${_{.}^{\prime\prime}}$|019, −0|${_{.}^{\prime\prime}}$|065) from its original coordinates so that the peak position of A1 coincides with that of the 250 GHz map to compensate the unknown positional displacement described by Rodríguez et al. (2020). We also applied the task “phaseshift” to CLEAN the data but did not obtain any different results.
ALMA archival data: 100 GHz (#2018.1.00589.S PI: R. Galván-Madrid), 230 GHz (#2016.1.00620.S PI: A. Ginsburg), 360 GHz (#2015.1.01535.S PI: B. R. Alejandro and #2017.1.00318.S PI: R. Galván-Madrid), 450 GHz (#2017.1.01499.S PI: F. Xiaoting).
This conclusion is valid even if the ring, with its center at the exciting star, is tilted with respect to the equatorial plane. Thus, if we take an assumption that the ring is, for example, on the polar plane of the star, we derive the same conclusion that the ring has a radial motion. We, however, do not take such an assumption because it is simply unphysical: we do not find any reason that the inflowing or outflowing gas forms a regular ring on a plane significantly tilted with respect to the equatorial plane of the star, breaking the rotational symmetry about the polar axis.
Mean and standard deviation of mass for field O9 stars with the luminosity classes I, III, and V.
