-
PDF
- Split View
-
Views
-
Cite
Cite
Daiki Yamasaki, Shin’ichi Nagata, Kiyoshi Ichimoto, Polarization calibration of the Tandem Etalon Magnetograph of the Solar Magnetic Activity Research Telescope at Hida Observatory, Publications of the Astronomical Society of Japan, Volume 74, Issue 6, December 2022, Pages 1344–1355, https://doi.org/10.1093/pasj/psac072
Close - Share Icon Share
Abstract
The Tandem Etalon Magnetograph (TEM) is one of the instruments of the Solar Magnetic Activity Research Telescope of Hida Observatory. The TEM is a partial disk (320″ × 240″) filter magnetograph which scans the wavelength around a Fe i line at 6303 Å and achieves polarimetric sensitivity of <5 × 10⁻⁴ for each wavelength. To obtain the polarimeter response matrix of the instrument, we have carried out end-to-end polarization calibrations of the instrument. We have also measured the polarization characteristics of the polarization beam splitter (PBS), which is a crucial component of the instrument. As a result of end-to-end calibration, we found significant spatial variation in the response matrix across the field of view. From a laboratory test, we found that |$1\%$| of the magnitude of a circular diattenuation of the PBS was due to the retardation caused by the stress in the cube and the linear diattenuation of the film. Although the spatial variation across the field of view is more than 10 times larger, to achieve the polarimetric sensitivity of <5 × 10⁻⁴, this can be well explained by the polarization characteristic of the PBS and corrected by using the response matrix obtained in the end-to-end calibration. In addition, we also obtained the daily variation of the polarization property of the TEM. We found that the crosstalk from Stokes Q to V changes by an amount comparable to the tolerance through a day. In the present configuration, we require a pixel-by-pixel calibration every 100 min to meet the accuracy requirement.
1 Introduction
Solar flares are a rapid magnetic energy release phenomena in the solar corona. Magnetic reconnection plays an important role in the release of magnetic free energy (Priest & Forbes 2002; Shibata & Magara 2011). During solar flares, some of the accumulated magnetic energy is converted into kinetic energy of the erupting plasmas (Coppi & Friedland 1971; Spicer 1982). These erupting plasmas are often observed in the Hα line as filament eruptions (Seki et al. 2017, 2019) and as coronal mass ejections (CMEs: Parenti 2014) in coronagraphs. Solar filaments are cool and dense plasma supported by helical coronal magnetic field structures (Xu et al. 2012; Hanaoka & Sakurai 2017): magnetic flux ropes (MFRs). Thus, in order to understand the onset mechanisms of solar flares and filament eruptions comprehensively, we need to clarify the process by which the coronal magnetic field or MFRs become unstable. We also have to investigate the triggering structures. Since the coronal magnetic field cannot be directly observed due to observational limitations, the photospheric vector magnetic field observation is crucially important.
According to research based on the three-dimensional coronal magnetic field extrapolated from the photospheric magnetic field, it is widely believed that magnetohydrodynamical instabilities such as kink instability (Török & Kliem 2004), torus instability (Kliem & Török 2006), and double-arc instability (Ishiguro & Kusano 2017) play an important role in eruptions of MFRs (Inoue et al. 2018; Kusano et al. 2020; Yamasaki et al. 2021). Theoretical as well as observational studies (Kusano et al. 2012; Bamba et al. 2013) suggest that the triggering mechanism of some flares is the emergence of a small-scale magnetic flux with opposite sign to the magnetic helicity with respect to that of the global magnetic field around the polarity inversion line. Recent studies on the onset of flares and the triggering and driving mechanisms of MFR eruptions perform the extrapolation of the three-dimensional coronal magnetic field (Bamba et al. 2017; Kawabata et al. 2017, 2020; Muhamad et al. 2018; Woods et al. 2018; Kang et al. 2019; Inoue & Bamba 2021; Yamasaki et al. 2021). In these studies, extrapolations of the coronal magnetic field use the photospheric vector magnetic field data taken with either the Solar Optical Telescope (SOT: Ichimoto et al. 2008; Shimizu et al. 2008; Suematsu et al. 2008; Tsuneta et al. 2008) onboard Hinode (Kosugi et al. 2007) or the Helioseismic and Magnetic Imager (HMI: Schou et al. 2012) onboard the Solar Dynamics Observatory (SDO: Pesnell et al. 2012). However, for both of the instruments, it takes more than 10 min to obtain the full Stokes parameters with polarimetric sensitivity of >10−3 given the typical spatial size of active regions of ∼200 × 200 Mm2. On the other hand, in order to investigate the dynamical change of the photostpheric magnetic field caused by a topological change in the corona during the flares, such as the back reaction to the photospheric magnetic field (Hudson et al. 2008), observation with a time cadence of less than 10 min is needed. We also note that the Alfvén transit time across the typical coronal loop with a size of ∼70 Mm is ∼1 min. Thus, magnetic field measurements with a wide (>200 Mm) field of view and high temporal cadence of ∼1 min are required to investigate the dynamical evolution of the coronal magnetic field with regards to flares and filament eruptions. Since the change in Lorentz force balance in the solar atmosphere can also be estimated from the photospheric magnetic fields (Fisher et al. 2012), it is expected that we can clearly understand the triggering structures and the energy release process of solar flares from the observations of the photospheric vector magnetic field with such high temporal cadence.
The Tandem Etalon Magnetograph (TEM: Nagata et al. 2014) of the Solar Magnetic Activity Research Telescope (SMART: UeNo et al. 2004) aims to study, with a time cadence of up to 1 min and a polarimetric sensitivity of 5 × 10⁻⁴, the photospheric magnetic field and the magnetic field structure of solar filaments during solar flares. The TEM obtains the photospheric magnetic field via polarization of the Zeeman effect (del Toro Iniesta 2003; Stenflo 2003, 2013) in the Fe i (6302.5 Å) absorption line.
Polarization calibration is a method of modeling the polarization of the telescope and the other optical system included in the instrument. Polarization calibration is required for precise polarimetric measurements in solar observation (Ichimoto et al. 2008; Ishikawa et al. 2014; Anan et al. 2018; Harrington et al. 2019). In some cases, the instrument calibration unit placed on a focal plane is used to calibrate the optical system other than the telescope (Iglesias et al. 2016), and in some cases, end-to-end calibrations are performed by placing a polarizer in front of a telescope. In end-to-end calibration, we examine a polarimeter response matrix (D. F. Elmore 1990).1 The advantage of this method is that a polarimeter response matrix combines the stack of Mueller matrices of optical components of the instrument, and also includes the matrix representing the polarimeter's modulation and demodulation. Thus, it is a convenient single matrix type characterization of the measurement system as a whole. In our research, we performed an extensive polarization calibration of the whole instrument in order to achieve the polarimetric accuracy that meets the TEM’s sensitivity.
In this paper, we describe the methodology used for calibrating the TEM polarization and report the final polarization characteristics of the TEM. The rest of this paper is structured as follows: the instrument is introduced in section 2, the experiments are described in section 3, data analysis and results are presented in section 4, and discussions arising from our findings are summarized in section 5.
2 Instrument
2.1 Overview of the polarimeter
SMART at the Hida Observatory consists of four telescopes equipped to a unique equatorial mount. The TEM, the fourth telescope, is a 250 mm diameter telescope equipped with a magnetograph using tandem Fabry–Perot filters. In figure 1, we show the optical layout of the TEM. The polarization modulator of the TEM is a rotating waveplate placed just behind the primary focus. The waveplate is continuously rotating at a frequency of 1.7 Hz during observations. The waveplate is a 94.28 μm thick crystal attached to a 2.058 mm thick S-BSL7 substrate. The retardation of the waveplate at the working wavelength of 6302.5 Å (Fe i) is designed to be 127° at 25°C. In order to meet the accuracy requirement of the TEM, the retardation should be in the range of 127 ± |${0{_{.}^{\circ}}38}$|. We note that the ambient temperature of TEM is set at 25°C and is controlled by air in 25 ± 5°C. Thus, we can meet the accuracy requirement (see also Nagata et al. 2014). We take monochromatic images around 6302.5 Å with a tandem Fabry–Perot filter (the bandwidth is ∼130 mÅ). Since the Fabry–Perot filters are made of z-cut lithium niobate and are used in telecentric configuration, these filters do not change polarization state significantly. The polarization analyzer of the TEM is a polarizing beam splitter (PBS: Melles Griot 03 PBB 005), with which we divide the beam into orthogonally polarized rays of light; we use the coordinate system that defines +Q as the direction of the p component of the PBS in this study (figure 2). The PBS is made of a multi-layer film with substrate of BK7 and it has 0.01 of an extinction ratio in wavelength range of 4500–6800 Å. Note that the PBS is located on the image side of the telecentric optical system. Two CCD cameras placed behind the PBS simultaneously take each of the orthogonally polarized lights with a frame rate of 30 frames per second.
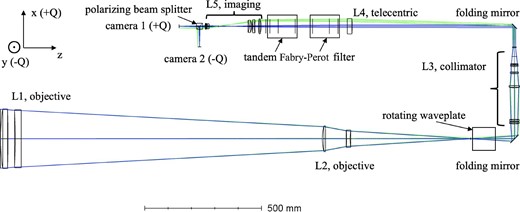
Optical layout of the TEM. Blue and green lines correspond to the ray at the center and the edge of the field of view, respectively. z-axis: incident light direction, x-axis: +Q, y-axis: −Q.

2.2 Measurement of Stokes vector
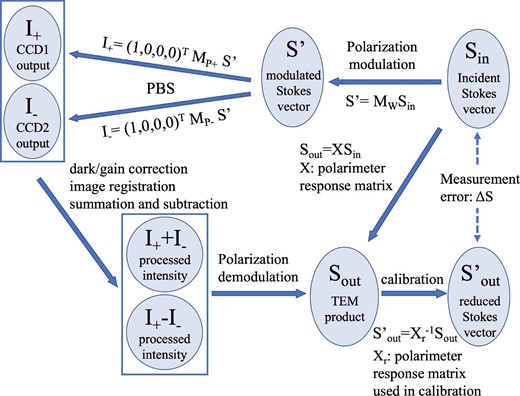
Definition of polarimeter response matrix and error in polarization measurement.
The advantage of the two orthogonal polarized beam measurements is that we can separate the time series of Iin and Qin/Uin/Vin by using a summation and a subtraction of two components. Thus, we can suppress the crosstalk from the incident Stokes I to the others. Since Stokes I is larger than the others, the suppression of the crosstalk from Stokes I due to image jitter during data accumulation is a crucial technique to derive accurate magnetic field measurements.
Based on the theoretical model given by equations (3) and (4), we derive the output Stokes vector |${\boldsymbol {S}_{\rm out}}$| by fitting a sinusoidal function of θ, 2θ, and 4θ which correspond to angular frequency of ω, 2ω, and 4ω. Here we perform demodulation after combining two orthogonally polarized beams since we need to make registration of images to suppress the guiding error during the data acquisition by using the combined and unmodulated intensity map.
3 Experiments
3.1 On the accuracy and sensitivity of polarization measurement
By using the inequality (8), we derived the tolerances for the physical properties of the instrument. The tolerance of the waveplate angle is determined as the angle error induced in |${{{\boldsymbol{\sf X}}}_{\rm r}}$| at which one of the matrix elements violates inequality (8). In this case, the matrix element representing the cross-talk between Stokes Q and U limits the error to 0.°7.
3.2 System and component calibration
In the following sections, we present three experiments, experiment 1 to 3, of TEM’s polarization calibration. Experiments 1 and 3 are end-to-end calibrations and experiment 2 is component calibration.
3.2.1 Experiment 1: System calibration
We have carried out an end-to-end polarization calibration of the instrument twice so far. We performed the first experiment on 2019 May 23 and 24 and the second one on 2021 June 10. We hereafter call these experiments using the whole instrument as experiment 1. In 2019, we placed the well-calibrated sheet polarizers (linear, right-hand circular, and left-hand circular) at the entrance of the telescope. The sheet polarizers used for the test were HN38 (linear), HNCP37R (right-hand circular), and HNCP37L (left-hand circular), all provided by 3M Corporation. These are the same polarizers used for the polarization calibration of Hinode/SOT (Ichimoto et al. 2008). The polarizers can be rotated around the optical axis of the telescope by using a stepping motor with a rotation-angle accuracy of |${2{_{.}^{\circ}}8}$| × 10−4. For the circular polarizer test, we used eight different incident Stokes parameters with polarizer angles of |${0{_{.}^{\circ}}00}$|, ±|${22{_{.}^{\circ}}50}$|, ±|${45{_{.}^{\circ}}00}$|, ±|${67{_{.}^{\circ}}50}$|, and |${90{_{.}^{\circ}}00}$| with respect to the mechanical origin. For the linear polarizers test, we used 16 different incident Stokes parameters corresponding the polarizer angles of |${0{_{.}^{\circ}}00}$|, ±|${11{_{.}^{\circ}}25}$|, ±|${22{_{.}^{\circ}}50}$|, ±|${33{_{.}^{\circ}}75}$|, ±|${45{_{.}^{\circ}}00}$|, ±|${56{_{.}^{\circ}}25}$|, ±|${67{_{.}^{\circ}}50}$|, ±|${78{_{.}^{\circ}}75}$| and |${90{_{.}^{\circ}}00}$|. In 2021, the same sheet polarizers (linear and right-hand circular) were also placed at the entrance. We used eight different Stokes parameters for both circular and linear polarizers (|${0{_{.}^{\circ}}00}$|, ±|${22{_{.}^{\circ}}50}$|, ±|${45{_{.}^{\circ}}00}$|, ±|${67{_{.}^{\circ}}50}$|, and |${90{_{.}^{\circ}}00}$|). At each rotating position of the sheet-polarizer, we measured Stokes parameters using the normal observation procedure: a waveplate rotation frequency of 1.7 Hz, a frame rate of 30 fps, 225 frames at each wavelength, and an exposure time of 4 ms. Here we note that in the TEM’s observation scheme we obtain the orientation angle of the retarder’s fast axis by using an encoder at every exposure. The error between exposure and the encoder record timing is about 20 μs, and this corresponds to the angle error of |${0{_{.}^{\circ}}01}$| with a rotaion period of 1.7 Hz. This is small enough compared to the rotating angle tolerance of |${0{_{.}^{\circ}}07}$|.
In order to avoid any significant polarization signal from active regions, the telescope was pointed to the quiet region at the center of the solar disk. We investigated the polarimeter response matrix at the four wavelengths of 6302.5 Å ±0.080 Å, ±0.160 Å in 2019, and at the six wavelengths of 6302.5 Å ±0.050 Å, ±0.120 Å, ±0.180 Å in 2021.
3.2.2 Experiment 2: Polarizing beam splitter
We also took the PBS out of the telescope and examined spatial variations of polarization properties of the PBS in the laboratory. The optical configuration of the test is shown in figure 4a. In this experiment, we used a light source (SIGMA KOKI IMH-250) which is a metal halide lamp with a color temperature of 7500 K. We placed a bandpass filter (ANDV9062) which has 3 Å FWHM centered at 6302 Å. The beam was collimated into linearly polarized light by transmission through the collimator lens and the linear polarizer (VLS-200-IR). After the linear polarizer, a rotating waveplate is placed. The intensity of the beam through the PBS was recorded with the same type of CCD camera used in the telescope (Prosilica GE1650), where the surface of the PBS was focused on the camera by an imaging lens. Moreover, we carried out this experiment with PBS with and without a mount jig to understand qualitatively an effect of the induced mechanical stress of the PBS on its polarization characteristics.
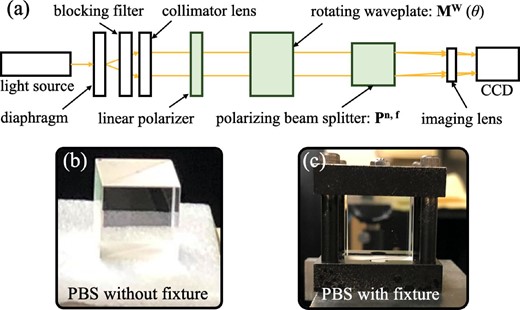
(a) Experiment setup of the PBS’s polarization property evaluation. (b), (c) Picture of the PBS without and with fixture, respectively.
3.2.3 Experiment 3: Variation in a day
To evaluate the variation of the response matrix in a day, we performed the end-to-end polarization calibration on 2021 June 9 and 10. On June 9, we placed the linear sheet polarizer (HN38) in front of the telescope and obtained the polarization modulation data from 01:48 to 06:59 UT. On June 10, we placed the right-hand sheet polarizer (HNCP37R) similarly and obtained the polarization modulation data from 02:29 to 05:33 UT. For these measurements, the telescope was again pointed toward the disk center and the wavelengths were tuned to 6302.5 Å ±0.050 Å, ±0.120 Å, ±0.180 Å. The temporal cadence was ∼200 s, and the exposure time of each frame was 4 ms.
4 Data analysis and results
4.1 Polarimeter response matrix
In figure 5, we show the gain ratio maps obtained in 2019 and 2021. We can clearly see the difference. In between the two experiments, we took the PBS out of the telescope and set it again in the telescope, as we mentioned above. Thus, the difference in gain ratio may be due to the change of mechanical stress of the PBS that can change the linear diattenuation of the cube.
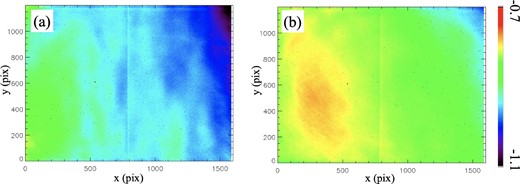
(a) Gain ratio map through SMART-TEM's field of view obtained from the experiment in 2019. (b) Gain ratio map obtained from the experiment in 2021.

Wavelength variation of the spatial mean of each polarimeter response matrix component. The line center is 6302.5 Å. Red and blue lines correspond to the mean value through four wavelength points and the required accuracy, respectively. (a) Experiment with observation points of four separate wavelengths. (b) Experiment with observation points of six separate wavelengths.
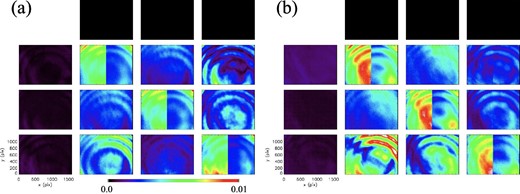
Standard deviation of polarimeter response matrix over the wavelength points through the TEM’s field of view. (a) Experiment in 2019 with observation points of four separate wavelengths. (b) Experiment in 2021 with observation points of six separate wavelengths.
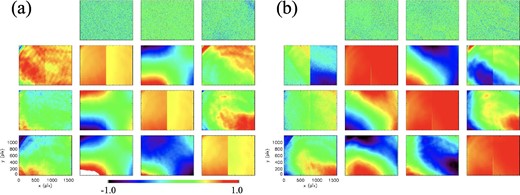
Polarimeter response matrix |${{{\boldsymbol{\sf X}}}_{\rm r}^{-1}}$| map through the TEM’s field of view. (a) Experiment in 2019 with observation points of four separate wavelengths. (b) Experiment in 2021 with observation points of six separate wavelengths.
In order to see the spatial distribution of each component of the response matrices clearly, we show the deviation from the spatially averaged value in figure 9. Panels (a) and (b) correspond to the results of calibration in 2019 and in 2021, respectively. In panel (a), we can see that |$X^{-1}_{23}$|, |$X^{-1}_{32}$|, and |$X^{-1}_{42}$| show similar spatial variation. We note that those components represent the crosstalk between Q and U, and the crosstalk from Q to V. In panel (b), we can see a similar spatial variation in |$X^{-1}_{23}$| and |$X^{-1}_{32}$|, and they resemble the component shown in panel (a). We also found that some components in figure 8 show a gap at the center of the field of view. We note that, however, this gap is far below the tolerance as shown in figure 9 and this is not critical with respect to the polarization property of the TEM.
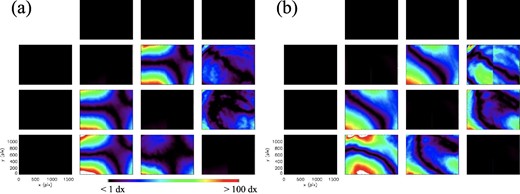
Deviation from the mean of each component through the TEM’s field of view. (a) Experiment in 2019 with observation points of four separate wavelengths. (b) Experiment in 2021 with observation points of six separate wavelengths.
4.2 Effect of the mechanical stress of the PBS
The results of the fitting with a sinusoidal function are shown in figure 10. Panels (a) and (c) show the spatial distribution of the amplitude of the 2θ component [|$(A_ {\sin 2\theta }^2+A_{\cos 2\theta }^2)^{1/2}$|] and that of the 4θ component [|$(A_{\sin 4\theta }^2+A_{\cos 4\theta }^2)^{1/2}$|], respectively, without fixture (see figure 4b). Panels (b) and (d) show the spatial distribution of the amplitude of the 2θ component and that of the 4θ component, respectively, with fixture (see figure 4c). In figure 10, we can find that the absolute signal of 4θ is far greater than that of 2θ in both cases of free and fixed PBS.
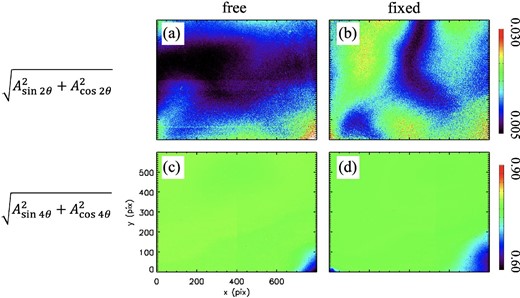
Sinusoidal fitting amplitude map through the ROI in experiment 2. (a) Absolute value of the 2θ component with the free PBS. (b) 2θ component with the fixed PBS. (c) 4θ component with the free PBS. (d) 4θ with the fixed PBS. All are normalized by a const. term of each fitting result.
As for the 2θ component, we find not only a significant signal in the 2θ amplitude in each of the measurements, but also a difference in the spatial variation of the 2θ amplitude between the two measurements (see figures 10a and 10b). As shown in equation (14), the amplitude of sin 2θ includes not only a Vin signal but also the product of Qin and |$p_{14}^{\mathrm{f,n}}$|, the circular diattenuation of the PBS. In addition, the amplitude of cos 2θ corresponds to the signal of Uin and it also includes the circular diattenuation of the PBS (|$p_{14}^{\mathrm{f,n}}$|) [see equation (14)]. Since the amplitude of the 2θ component shows |$\sim\!\! 1\%$|, the PBS could consist of a |$\sim\!\! 1\%$| circular diattenuation. Additionally, the significant difference in the spatial pattern found between panels (a) and (b) could be caused by differing stress in the PBS. Thus, the circular diattenuation of the PBS could be changed by the mechanical stress of the PBS.
As for the 4θ component, we find no significant spatial variation between the two measurements (see figures 10c and 10d). There is a spatially averaged amplitude of ∼0.79 for both cases. Since we selected linear polarization as the incident signal in this experiment, the amplitude of the 4θ component, which corresponds to the signal of linear polarization, was expected to be ∼0.80 = (1 − cos δ′)/2 with δ′ = 127°. These results suggest that the PBS works as a linear-diattenuator as we expected.
4.3 Variation of the polarization property in a day
We deduced the output Stokes vectors from the data obtained in experiment 3. In figure 11, panels (a), (c), and (e) show the daily variations of the Stokes signals of Qout/Iout, Uout/Iout, and Vout/Iout, respectively, in the case of linear polarization input. Panels (b), (d), and (f) show the temporal variation of the Stokes signals in the circular polarization input case. The signals shown in figure 11 are averaged over the field of view. We find that, in the case of the linear polarization input, the temporal variation of the Vout/Iout shows a variation greater than the tolerance. We also find that, for circular polarization, the temporal variation of Qout/Iout and Uout/Iout shows variation less than the tolerance.
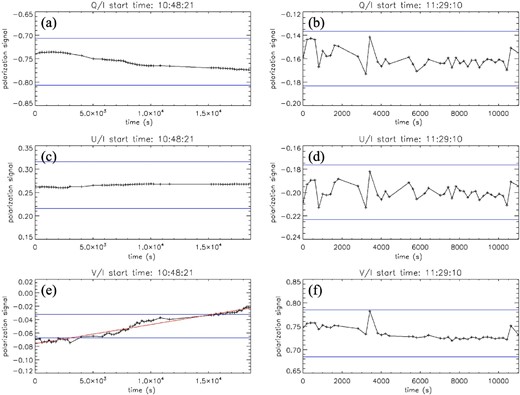
Temporal evolution of the polarization signals in a day is shown. Each of the blue solid lines show the tolerance corresponding to each polarization signal. (a) Qout/Iout for linear polarization input. (b) Qout/Iout for circular polarization input. (c) Uout/Iout for linear polarization input. (d) Uout/Iout for circular polarization input. (e) Vout/Iout for linear polarization input. (f) Vout/Iout for circular polarization input.
5 Discussion and conclusion
In the end-to-end calibration (experiment 1), we obtained the polarimeter response matrices of the TEM in 2019 and in 2021. We found that the polarimeter response matrices, which are obtained from calibration on different days, have significant spatial variations in their X23, X32, and X42 components, which correspond to the crosstalk from Q to U, from U to Q, and from Q to V, respectively. The spatial variations of the components were quite similar to each other. In the laboratory PBS test (experiment 2), we found that the PBS shows |$\sim\!\! 1\%$| circular diattenuation, and the spatial pattern of circular diattenuation of the PBS is affected by the mechanical stress to the PBS. Therefore, we suggest that the spatial variation in circular diattenuation of the PBS is due to a combination of retardation caused by the stress in the cube and linear diattenuation of the dielectric multilayer coating.
In this paper, we report the results of end-to-end and component polarization calibration of the TEM on SMART at Hida Observatory. Since the polarization properties of the TEM change both in the short term of a day and in the long term of a year, we suggest that a follow-up investigation of the polarization to meet the polarization accuracy is necessary for our future work. The TEM’s polarization calibration data presented in this paper are accessible via the SMART web site.2
Acknowledgements
We thank Mr. Y. Nakatani, Mr. G. Kimura, Ms. K. Hirose, Mr. Y. Kida, and Dr. K. Otsuji for their kind support of the experiments. We are grateful to Mr. Cannon Bryce for checking this manuscript. This work was supported by the “UCHUGAKU” project of the Unit of Synergetic Studies for Space, Kyoto University. This work was also supported by JSPS KAKENHI Grant Number JP21J14036 and JSPS KAKENHI 20684005, Grant-in-Aid for Young Scientist (A).
Footnotes
D. F. Elmore 1990, NCAR Technical Note NCAR/TN-355+ST.


