-
PDF
- Split View
-
Views
-
Cite
Cite
Mikito Kohno, Kengo Tachihara, Kazufumi Torii, Shinji Fujita, Atsushi Nishimura, Nario Kuno, Tomofumi Umemoto, Tetsuhiro Minamidani, Mitsuhiro Matsuo, Ryosuke Kiridoshi, Kazuki Tokuda, Misaki Hanaoka, Yuya Tsuda, Mika Kuriki, Akio Ohama, Hidetoshi Sano, Tetsuo Hasegawa, Yoshiaki Sofue, Asao Habe, Toshikazu Onishi, Yasuo Fukui, FOREST unbiased Galactic plane imaging survey with the Nobeyama 45 m telescope (FUGIN). VI. Dense gas and mini-starbursts in the W 43 giant molecular cloud complex, Publications of the Astronomical Society of Japan, Volume 73, Issue Supplement_1, January 2021, Pages S129–S171, https://doi.org/10.1093/pasj/psaa015
Close - Share Icon Share
Abstract
We performed new large-scale 12CO, 13CO, and C18O J = 1–0 observations of the W 43 giant molecular cloud complex in the tangential direction of the Scutum arm (l ∼30°) as a part of the FUGIN project. The low-density gas traced by 12CO is distributed over 150 pc × 100 pc (l × b), and has a large velocity dispersion (20–30 km s−1). However, the dense gas traced by C18O is localized in the W 43 Main, G30.5, and W 43 South (G29.96−0.02) high-mass star-forming regions in the W 43 giant molecular cloud (GMC) complex, which have clumpy structures. We found at least two clouds with a velocity difference of ∼10–20 km s−1, both of which are likely to be physically associated with these high-mass star-forming regions based on the results of high 13CO J = 3–2 to J = 1–0 intensity ratio and morphological correspondence with the infrared dust emission. The velocity separation of these clouds in W 43 Main, G30.5, and W 43 South is too large for each cloud to be gravitationally bound. We also revealed that the dense gas in the W 43 GMC has a high local column density, while “the current SFE” (star formation efficiency) of the entire GMC is low (|$\sim\!\! 4\%$|) compared with the W 51 and M 17 GMC. We argue that the supersonic cloud–cloud collision hypothesis can explain the origin of the local mini-starbursts and dense gas formation in the W 43 GMC complex.
1 Introduction
1.1 Giant molecular clouds and mini-starbursts in the Milky Way
Giant molecular clouds (GMCs), whose masses are ≳ 104 M⊙ (e.g., Blitz 1993), have been studied by CO surveys of the Milky Way using single-dish radio telescopes since the 1970s (e.g., Dame et al. 1986, 2001; Solomon et al. 1987; Scoville et al. 1987; Mizuno & Fukui 2006; see also reviews of Combes 1991; Heyer & Dame 2015). Recently, high-angular-resolution CO surveys have revealed the internal structures of GMCs using the Nobeyama 45 m (FUGIN—FOREST Unbiased Galactic plane Imaging survey with the Nobeyama 45 m telescope: Umemoto et al. 2017), the James Clerk Mawxell Telescope (JCMT) 15 m, [COHRS–CO High-Resolution Survey: Dempsey et al. 2013; CHIMPS—CO (J = 3–2) Heterodyne Inner Milky Way Plane Survey: Rigby et al. 2016], PMO 13.7 m (MWISP—The Milky Way Imaging Scroll Painting: Su et al. 2019), and Mopra 22 m (Burton et al. 2013; Braiding et al. 2018) telescopes. GMCs have ideal environments, with massive and dense gas, for the formation of high-mass stars and cluster formation (e.g., Lada & Lada 2003; McKee & Ostriker 2007), and their evolution and formation mechanism has been widely studied in the Milky Way and Local Group galaxies (e.g., Blitz et al. 2007; Fukui & Kawamura 2010). In particular, massive GMCs often form aggregations called “GMC complexes”, which are regarded as sites for mini-starbursts
including O-type stars (e.g., W 43, W 49, W 51, Sagittarius B2, NGC 6334-6357: see a review of Motte et al. 2018b). On the other hand, it is not yet clear how high-mass stars and natal massive dense cores are formed in GMCs (e.g., Gao & Solomon 2004; Lada et al. 2012; Torii et al. 2019).
1.2 The initial condition of O-type star formation produced by a supersonic cloud–cloud collision
To form the O-type stars (>20 M⊙), it is necessary to achieve high mass accretion at the rate of ∼10−3 M⊙ yr−1 (e.g., Wolfire & Cassinelli 1987) to overcome their strong radiation pressure. Zinnecker and Yorke (2007) argued that “rapid external shock compression” such as the supersonic gas motions might be an important initial condition for O-type star formation.
Cloud–cloud collisions have been discussed as one of the external triggering mechanisms that produce gravitational instability and high-mass star formation (e.g., Scoville et al. 1986; Elmegreen 1998). Recently, observational evidence has been presented of many super star clusters and O-type star-forming regions in the Milky Way. For example,
Super star clusters (young massive clusters): Compact distributions of O-type stars in 1 pc Westerlund 2 (Furukawa et al. 2009; Ohama et al. 2010), NGC 3603 (Fukui et al. 2014), RCW 38 (Fukui et al. 2016), etc.
Multiple O-type star formation in the GMCs Sagittarius B2 (Hasegawa et al. 1994; Sato et al. 2000), W 49 A (Mufson & Liszt 1977; Miyawaki et al. 1986; 2009), W 51 A (Okumura et al. 2001; Kang et al. 2010; Fujita et al. 2021), NGC 6334-6357 (Fukui et al. 2018b), M 17 (Nishimura et al. 2018), M 42 (Fukui et al. 2018a), RCW 79 (Ohama et al. 2018a), W 33 (Kohno et al. 2018), DR21 (Dobashi et al. 2019), etc.
Single O-type star formation in mid-infrared bubbles and H ii regions M 20 (Torii et al. 2011, 2017), RCW 120 (Torii et al. 2015), N37 (Baug et al. 2016), Sh2-235 (Dewangan & Ojha 2017), N49 (Dewangan et al. 2017), RCW 34 (Hayashi et al. 2018), RCW 36 (Sano et al. 2018), RCW 32 (Enokiya et al. 2018), GM 24 (Fukui et al. 2018c), S116-118 (Fukui et al. 2018d), N35 (Torii et al. 2018), N36 (Dewangan et al. 2018), Sh 2-48 (Torii et al. 2021), RCW 166 (Ohama et al. 2018b), S44 (Kohno et al. 2021), G8.14|$+$|0.23 (Dewangan et al. 2019), N4 (Fujita et al. 2019), etc.
Numerical simulations show that gravitationally unstable, dense cores are formed in the compressed layer of two colliding clouds (e.g., Habe & Ohta 1992; Anathpindika 2010; Takahira et al. 2014, 2018; Balfour et al. 2015, 2017; Matsumoto et al. 2015; Shima et al. 2018; Wu et al. 2015, 2017a, 2017b, 2018). Inoue and Fukui (2013) demonstrated from the results of a magneto-hydrodynamical (MHD) simulation that the shock compression from a collision can produce massive molecular cores by amplifying the turbulence and magnetic field. These massive cores can achieve a high enough accretion rate (>10−4 M⊙ yr−1) to form O-type stars (Inoue et al. 2018). Hence, a supersonic cloud–cloud collision is a prominent scenario in which the initial conditions for O-type stars and dense gas formation of galaxies can be met.
In order to clarify the origin of dense gas and O-type star formation in GMC complexes, we have performed a new high-resolution and complete survey in the 12CO, 13CO, and C18O J = 1–0 lines of the entire W 43 GMC complex, where active star formation is ongoing. This paper is constructed as follows: section 2 introduces the current knowledge on W 43; section 3 presents the observational properties; section 4 gives the FUGIN results and comparisons with infrared wavelengths; in section 5 we discuss the formation mechanism of the W 43 GMC complex; and in section 6 we provide the conclusions of this paper.
2 W 43 as a massive GMC complex in the Milky Way
W 43 is a Galactic mini-starburst region located in Aquila, which was first cataloged by the 1390 MHz thermal radio continuum survey (Westerhout 1958). It is one of the most massive GMC complexes in the Milky Way, corresponding to giant molecular associations (GMAs) of external galaxies (Nguyễn Lúóng et al. 2011). Figure 1a shows a three-color composite image obtained by the Spitzer space telescope, where blue, green, and red correspond to the 3.6 μm, 8 μm, and 24 μm emissions, respectively (GLIMPSE—Galactic Legacy Infrared Midplane Survey Extraordinaire: Benjamin et al. 2003; Churchwell et al. 2009; MIPSGAL—24 and 70 Micron Survey of the Inner Galactic Disk with MIPS: Carey et al. 2009). The X-marks indicate W 43 Main (Blum et al. 1999) and W 43 South (Wood & Churchwell 1989), which are active star-forming regions. G30.5 exists between W 43 Main and W 43 South, which contains five star-forming regions. A 100 pc bow-like structure, vertical to the Galactic plane, was found by the Nobeyama 10 GHz radio continuum survey (Sofue 1985; Handa et al. 1987).

(a) Spitzer three-color composite image of W 43. Blue, green, and red represent the Spitzer/IRAC 3.6 μm, Spitzer/IRAC 8 μm (Benjamin et al. 2003), and Spitzer/MIPS 24 μm (Carey et al. 2009) distributions. The X marks indicate W 43 Main (Blum et al. 1999) and W 43 South (Wood & Churchwell 1989). (b) Close-up image of W 43 Main. The white circles indicate the 51 protocluster candidates (W 43 MM1-MM51) cataloged by Motte, Schilke, and Lis (2003). (c) Close-up image of G30.5. (d) Close-up image of W 43 South. The white crosses indicate the radio continuum sources identified by Condon et al. (1998).
The 3.6 μm, 8 μm, and 24 μm emission traces thermal emission from stars, polycyclic aromatic hydrocarbon (PAH) features (e.g., Draine 2003; Draine & Li 2007), and hot dust grains (∼120 K) excited by the high-mass stars (Carey et al. 2009), respectively. The 8 μm emission shows diffuse distribution covering the whole GMC complex. The 24 μm emission is bright at W 43 Main and W 43 South, indicating the existence of H ii regions. The properties of these objects are described in table 1.
| Name . | Total luminosity . | Number of O-type stars . | Age . | References* . |
|---|---|---|---|---|
| W 43 Main | 7–10 × 106L|$\odot$| | ∼14–50 | 1–6 Myr | [1], [2], [3], [4], [5] |
| W 43 South | 2–6 × 10⁶L|$\odot$| | 6 | ∼0.1 Myr | [2], [6], [7] |
| Name . | Total luminosity . | Number of O-type stars . | Age . | References* . |
|---|---|---|---|---|
| W 43 Main | 7–10 × 106L|$\odot$| | ∼14–50 | 1–6 Myr | [1], [2], [3], [4], [5] |
| W 43 South | 2–6 × 10⁶L|$\odot$| | 6 | ∼0.1 Myr | [2], [6], [7] |
| Name . | Total luminosity . | Number of O-type stars . | Age . | References* . |
|---|---|---|---|---|
| W 43 Main | 7–10 × 106L|$\odot$| | ∼14–50 | 1–6 Myr | [1], [2], [3], [4], [5] |
| W 43 South | 2–6 × 10⁶L|$\odot$| | 6 | ∼0.1 Myr | [2], [6], [7] |
| Name . | Total luminosity . | Number of O-type stars . | Age . | References* . |
|---|---|---|---|---|
| W 43 Main | 7–10 × 106L|$\odot$| | ∼14–50 | 1–6 Myr | [1], [2], [3], [4], [5] |
| W 43 South | 2–6 × 10⁶L|$\odot$| | 6 | ∼0.1 Myr | [2], [6], [7] |
The distances of W 43 South and compact H ii regions around G31.5 have been measured by trigonometric parallax, yielding 5.49 kpc as the variance-weighted average of four maser sources of G029.86−00.04, G029.95−00.01, G031.2|$+$|00.06, and G031.58|$+$|00.07 from the Bar and Spiral Structure Legacy Survey (BeSSeL: Zhang et al. 2014; Sato et al. 2014). In this paper, we assume the same distance (5.49 kpc) toward W 43 Main, because it coincides with a near-side kinematic distance of vLSR ∼95 km s−1 at |$l \sim {30{_{.}^{\circ}}8}$|. Figure 2 shows the position of W 43 superposed on the top view of the Milky Way (R. Hurt: NASA/JPL-Caltech/SSC). We point out that W 43 exists close to the tangential point of the Scutum arm (e.g., Vallée 2014; Hou & Han 2014; Nakanishi & Sofue 2016). In addition, this region is suggested to be the meeting point of the Galactic long-bar and the Scutum arm (e.g., Nguyễn Lúóng et al. 2011; Veneziani et al. 2017). Therefore, W 43 is an important object for studying the spiral arm and bar interaction.
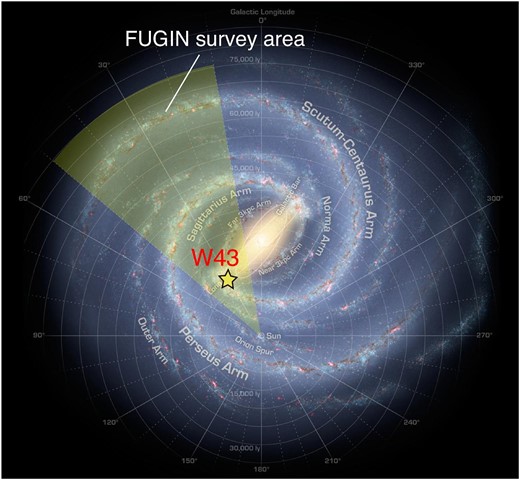
Top view of the Milky Way (NASA/JPL-Caltech/ESO/R. Hurt). The star symbol indicates the position of the W 43 GMC complex. The yellow shadow shows the inner survey area of the FUGIN project.
Large-scale CO observations of W 43 have been performed by single-dish radio telescopes (Nguyễn Lúóng et al. 2011; Carlhoff et al. 2013; Motte et al. 2014). They showed that W 43 is a molecular cloud complex with a size of ∼100–200 pc, and a broad velocity dispersion of 20–30 km s−1. They proposed that a cloud–cloud collision or a colliding flow scenario is likely to explain the origin of the mini-starbursts in the W 43 GMC at the tip of the Galactic bar (e.g., Nguyễn Lúóng et al. 2011, 2013; Motte et al. 2014; Louvet et al. 2016; see also review subsection 4.3 of Motte et al. 2018b). Furthermore, a number of papers have been published on the W 43 GMC complex (e.g., Pipher et al. 1974; Lester et al. 1985; Liszt et al. 1993; Liszt 1995; Mooney et al. 1995; Subrahmanyan & Goss 1996; Balser et al. 2001; Lemoine-Goumard et al. 2011; Beuther et al. 2012; Nishitani et al. 2012; Eden et al. 2012; Moore et al. 2015; Bihr et al. 2015; Walsh et al. 2016; Génova-Santos et al. 2017; Langer et al. 2017; Bialy et al. 2017). On the other hand, these papers do not deal with detail analysis toward individual objects in the W 43 GMC complex. In the next subsection, we introduce the individual objects of W 43 Main, G30.5, and W 43 South, on which we base our analysis.
2.1 W 43 Main (G030.8−00.0) as a mini-starburst region in the Milky Way
Figure 1b shows a close-up image of W 43 Main. The X-mark indicates the center position of an OB cluster (Blum et al. 1999), and the white circles present 51 protocluster candidates identified by sub-millimeter dust continuum observations (Motte et al. 2003). W 43 Main is the most active high-mass star-forming region in the W 43 GMC complex (e.g., Nguyễn Lúóng et al. 2013, 2017; Cortes et al. 2019), associated with a giant H ii region and a young massive cluster (Blum et al. 1999; Longmore et al. 2014). We find a ring-like structure in 8 μm emission, which corresponds to the infrared bubble N52 (Churchwell et al. 2006). The total infrared luminosity and ultraviolet photon number (NLy) are estimated to be 7–10 × 106 L|$\odot$| (e.g., Hattori et al. 2016; Hanaoka et al. 2019; Lin et al. 2016) and 2.3 × 1050 s−1 from the flux density at 5 GHz (Smith et al. 1978; Deharveng et al. 2010), respectively. The NLy is equivalent to ∼14 O5V or ∼40 O7V stars, based on the stellar parameters of Martins, Schaerer, and Hillier (2005). The W 43 Main cluster contains one W olf–Rayet star (W 43#1) and two O-type giant stars (W 43 #2 and W 43 #3), identified by Blum, Damineli, and Conti (1999). W 43#1 is also listed as WR 121a (van der Hutch 2001). W 43 #1 and #3 are likely to be binary O-type stars concentrated in a narrow space of <1 pc from the W 43 Main cluster (Luque-Escamilla et al. 2011; Binder & Povich 2018). Their stellar ages are estimated to be 1–6 Myr, based on the typical main-sequence lives of the O-type stars and Wolf-Rayet stars (Motte et al. 2003; Bally et al. 2010). We summarize the properties of the W 43 Main cluster in table 2.
| Name . | Galactic longitude . | Galactic latitude . | Spectral type . |
|---|---|---|---|
| W 43 #1a | 30|${_{.}^{\circ}}$|766995 | −0|${_{.}^{\circ}}$|034752 | WN7 |
| W 43 #1b | 30|${_{.}^{\circ}}$|766884 | −0|${_{.}^{\circ}}$|034631 | O4 III |
| W 43 #2 | — | — | O3.5 III |
| W 43 #3a | 30|${_{.}^{\circ}}$|766215 | −0|${_{.}^{\circ}}$|035086 | O3.5 V/O4 V |
| W 43 #3b | 30|${_{.}^{\circ}}$|766167 | −0|${_{.}^{\circ}}$|034975 | O3.5 V/O4 V |
Recently, several papers have been published on W 43-MM1 (e.g., Cortes & Crutcher 2006; Cortes et al. 2010, 2016; Cortes 2011; Herpin et al. 2012; Louvet et al. 2014; Sridharan et al. 2014; Jacq et al. 2016; Nony et al. 2018; Molet et al. 2019). These papers revealed that W 43-MM1 is the most massive protocluster in W 43 Main by interferometer observations. In particular, Motte et al. (2018a) identified 131 massive dust clumps in W 43-MM1 from Atacama Large Millimeter/Submillimeter Array (ALMA) observations. They showed that the core mass function (CMF) is flatter (more top-heavy) than the stellar initial mass function (IMF: Salpeter 1955), which suggests that massive dense cores are likely to be formed more efficiently in W 43-MM1.
2.2 G30.5
Figure 1c shows a close-up image of G30.5, which exists between W 43 Main and W 43 South. Five star-forming regions exist at G30.5: IRAS 18445–0222, IRAS 18447–0229, G030.489–00.364, G030.213–00.156, and G30.404–00.238 (Beichman et al. 1988; Anderson et al. 2014;1 Lockman 1989). There are 870 μm cold dust clumps corresponding to these infrared sources except for G030.489–00.364 (Nguyễn Lúóng et al. 2011). The authors also found multiple velocity components by using the 13CO J = 1–0 emission (see figure 4 of Nguyễn Lúóng et al. 2011). Recently, Sofue et al. (2019) analyzed the FUGIN data on the W 43 GMC complex. They revealed a molecular bow structure in G30.5, which is suggested to be formed by the Galactic shock compression (Fujimoto 1968; Roberts 1969; Tosa 1973). We point out that these star-forming regions correspond to the head of the molecular bow.
2.3 W 43 South (G29.96−0.02)
Figure 1d presents a close-up image of W 43 South (G29.96−0.02). The crosses indicate the radio continuum sources identified by the NRAO/VLA Sky Survey (NVSS: Condon et al. 1998), and correspond to the late-O or early-B type stars from the radio continuum flux (Beltrán et al. 2013). The numbering is the same as in Beltrán et al. (2013). The total luminosity is derived to be 2–6 × 10⁶ L|$\odot$| (Beltrán et al. 2013; Lin et al. 2016). The stellar age is derived to be ∼0.1 Myr from the evolutionary stage of the ultra-compact H ii region (Watson & Hanson 1997), which is younger than W 43 Main. The brightest infrared source (#1 = IRAS 18434–0242) is regarded as an ultra-compact H ii region or hot core, and has been well studied by many authors (e.g., Pratap et al. 1994, 1999; Afflerbach et al. 1994; Cesaroni et al. 1994, 1998, 2017; Fey et al. 1995; Lumsden & Hoare 1996, 1999; Ball et al. 1996; Watarai et al. 1998; Maxia et al. 2001; De Buizer et al. 2002; Morisset et al. 2002; Hoffman et al. 2003; Martín-Hernández et al. 2003; Olmi et al. 2003; Rizzo et al. 2003; Zhu et al. 2005; Kirk et al. 2010; Beltrán et al. 2011; Pillai et al. 2011; Townsley et al. 2014; Roshi et al. 2017). We summarize the properties of W 43 South in table 3.
| Number . | Galactic longitude . | Galactic latitude . | Spectral type . |
|---|---|---|---|
| #1 | 29|${_{.}^{\circ}}$|957 | −0|${_{.}^{\circ}}$|0170 | O6 |
| #2 | 30|${_{.}^{\circ}}$|023 | −0|${_{.}^{\circ}}$|0438 | B0 |
| #3 | 30|${_{.}^{\circ}}$|004 | −0|${_{.}^{\circ}}$|0730 | B0 |
| #4 | 29|${_{.}^{\circ}}$|934 | −0|${_{.}^{\circ}}$|0555 | O5 |
| #5 | 29|${_{.}^{\circ}}$|917 | −0|${_{.}^{\circ}}$|0497 | O6.5 |
| #6 | 29|${_{.}^{\circ}}$|912 | −0|${_{.}^{\circ}}$|0252 | O9.5 |
| #7 | 29|${_{.}^{\circ}}$|889 | −0|${_{.}^{\circ}}$|0056 | O8.5 |
| #8 | 29|${_{.}^{\circ}}$|860 | −0|${_{.}^{\circ}}$|0614 | O9.5 |
| #9 | 29|${_{.}^{\circ}}$|853 | −0|${_{.}^{\circ}}$|0591 | B0 |
| #10 | 29|${_{.}^{\circ}}$|822 | −0|${_{.}^{\circ}}$|1150 | B0.5 |
*Reference: Beltrán et al. (2013).
| Number . | Galactic longitude . | Galactic latitude . | Spectral type . |
|---|---|---|---|
| #1 | 29|${_{.}^{\circ}}$|957 | −0|${_{.}^{\circ}}$|0170 | O6 |
| #2 | 30|${_{.}^{\circ}}$|023 | −0|${_{.}^{\circ}}$|0438 | B0 |
| #3 | 30|${_{.}^{\circ}}$|004 | −0|${_{.}^{\circ}}$|0730 | B0 |
| #4 | 29|${_{.}^{\circ}}$|934 | −0|${_{.}^{\circ}}$|0555 | O5 |
| #5 | 29|${_{.}^{\circ}}$|917 | −0|${_{.}^{\circ}}$|0497 | O6.5 |
| #6 | 29|${_{.}^{\circ}}$|912 | −0|${_{.}^{\circ}}$|0252 | O9.5 |
| #7 | 29|${_{.}^{\circ}}$|889 | −0|${_{.}^{\circ}}$|0056 | O8.5 |
| #8 | 29|${_{.}^{\circ}}$|860 | −0|${_{.}^{\circ}}$|0614 | O9.5 |
| #9 | 29|${_{.}^{\circ}}$|853 | −0|${_{.}^{\circ}}$|0591 | B0 |
| #10 | 29|${_{.}^{\circ}}$|822 | −0|${_{.}^{\circ}}$|1150 | B0.5 |
*Reference: Beltrán et al. (2013).
Several papers have been published on the W 43 GMC complex and its individual clusters; so far a comprehensive study of diffuse molecular clouds and dense cores does not exist. In this paper, we have performed the analysis of 12CO, 13CO, and C18O J = 1–0 emissions from the W 43 GMC complex, obtained from the FUGIN data.
3 Data sets
3.1 The FUGIN project: the Nobeyama 45 m telescope 12CO, 13CO, and C18O J = 1–0 observations
We performed the CO J = 1–0 survey using the 45 m telescope at the Nobeyama Radio Observatory (NRO). We simultaneously observed the present region in 12CO (115.271 GHz), 13CO (110.201 GHz), and C18O (109.782 GHz) J = 1–0 transitions as part of the FUGIN project.2 The area of the inner Galaxy covering l = 10°−50°, b = −1°−1° as shown in figure 2 has been surveyed using the on-the-fly (OTF) mapping mode (Sawada et al. 2008) from 2014 April to 2017 March (Minamidani et al. 2015; Umemoto et al. 2017). The front-end consists of four beams, dual polarization, and sideband-separating (2SB) superconductor–insulator–superconductor (SIS) receiver FOur-beam REceiver System on the 45 m Telescope (FOREST: Minamidani et al. 2016; Nakajima et al. 2019), with a typical system noise temperature (Tsys) of ∼250 K (12CO) and 150 K (13CO). The back-end is an FX-type digital spectrometer named Spectral Analysis Machine for the 45 m telescope (SAM45: Kuno et al. 2011), which is the same as the digital spectro-correlator system for the ALMA Atacama Compact Array (Kamazaki et al. 2012). It has 4096 channels with a bandwidth and frequency resolution of 1 GHz and 244.14 kHz, which correspond to 2600 km s−1 and 0.65 km s−1 at 115 GHz, respectively. The effective velocity resolution is 1.3 km s−1. The half-power beam-width (HPBW) of the 45 m telescope is 14″ and 15″ at 115 GHz and 110 GHz, respectively. The effective beam size of the final data cube, convolved with a Bessel × Gaussian function, is 20″ for 12CO and 21″ for 13CO, corresponding to ∼0.5 pc at a distance of 5.5 kpc. The pointing accuracy is smaller than 2″–3″, and measured by observing 43 GHz SiO maser sources every hour using the H40 High Electron Mobility Transistor (HEMT) receiver. We used the chopper-wheel method (Ulich & Haas 1976; Kutner & Ulich 1981) to convert to the antenna temperature (|$T_{\rm a}^*$|) scale from the raw data. The data were calibrated to the main-beam temperature (Tmb) by using the equation |$T_{\rm mb}=T_{\rm a}^* / \eta _{\rm mb}$| with a main beam efficiency (ηmb) of 0.43 for 12CO, and 0.45 for 13CO and C18O. The relative intensity uncertainty is estimated at 10%–|$20\%$| for 12CO, |$10\%$| for 13CO, and |$10\%$| for C18O by observation of the standard source M 17 SW (Umemoto et al. 2017). The final 3D FITS cube has a voxel size of (l, b, v) = (|${8{_{.}^{\prime\prime}}5}$|, |${8{_{.}^{\prime\prime}}5}$|, 0.65 km s−1). We smoothed the data by convolving it with the two-dimensional Gaussian function (35″) to achieve a spatial resolution of ∼40″. The root-mean-square (rms) noise levels after smoothing are ∼1.0 K, 0.35 K, and 0.35 K for 12CO, 13CO, and C18O, respectively. For more detailed information on the FUGIN project, we refer the reader to Umemoto et al. (2017).
3.2 The CHIMPS project: JCMT 13CO J = 3–2 archive data
We also used the JCMT archival data of the CHIMPS project (Rigby et al. 2016, 2019).3 The cube data were obtained from the JCMT web page4 with an effective resolution of 15″ obtained by the Heterodyne Array Receiver Program (HARP: Buckle et al. 2009). We carried out the regridding in the spatial and velocity areas with reference to the FUGIN data. We adopted ηmb = 0.72 as the main beam efficiency (Buckle et al. 2009), and converted the intensity from |$T_{\rm a}^*$| to the Tmb scale. The relative intensity uncertainty was estimated within |$20\%$| for 13CO J = 3–2 (Rigby et al. 2016). We convolved the data with a 37″ Gaussian to achieve a spatial resolution of ∼40″. The rms noise level after smoothing was 0.14 K for 13CO J = 3–2.
3.3 Spitzer infrared archive data
We used infrared archival data obtained by the Spitzer space telescope (Werner et al. 2004). The near-infrared 3.6 μm and 8.0 μm images were obtained by the Infrared Array Camera (IRAC: Fazio et al. 2004) as a part of the Galactic Legacy Infrared Midplane Survey Extraordinaire (GLIMPSE) project (Benjamin et al. 2003; Churchwell et al. 2009). The mid-infrared 24 μm images were taken from the Multi-band Imaging Photometer for Spitzer (MIPS: Rieke et al. 2004) as a part of the MIPSGAL project (Carey et al. 2009). The resolutions of these images are ∼2″, ∼2″, and ∼6″ for 3.6 μm, 8.0 μm, and 24 μm, respectively. We summarize the observational properties and archival information in table 4.
| Telescope/survey . | Line . | Receiver . | Effective . | Velocity . | RMS noise* . | References† . |
|---|---|---|---|---|---|---|
| resolution | resolution | level | ||||
| Nobeyama 45 m/FUGIN | 12CO J = 1–0 | FOREST | 20″ | 1.3 km s−1 | ∼1.0 K | [1,2,3] |
| 13CO J = 1–0 | FOREST | 21″ | 1.3 km s−1 | ∼0.35 K | [1,2,3] | |
| C18O J = 1–0 | FOREST | 21″ | 1.3 km s−1 | ∼0.35 K | [1,2,3] | |
| JCMT/CHIMPS | 13CO J = 3–2 | HARP | 15″ | 0.5 km s−1 | ∼0.14 K | [4,5] |
| Telescope/survey | Band | Detector | Resolution | References | ||
| Spitzer/GLIMPSE | 3.6 μm | IRAC | ∼2″ | [6], [7], [8] | ||
| Spitzer/GLIMPSE | 8.0 μm | IRAC | ∼2″ | [6], [7], [8] | ||
| Spitzer/MIPSGAL | 24 μm | MIPS | 6″ | [9], [10] |
*The value of rms noise levels are after smoothing (space and/or velocity) data sets.
| Telescope/survey . | Line . | Receiver . | Effective . | Velocity . | RMS noise* . | References† . |
|---|---|---|---|---|---|---|
| resolution | resolution | level | ||||
| Nobeyama 45 m/FUGIN | 12CO J = 1–0 | FOREST | 20″ | 1.3 km s−1 | ∼1.0 K | [1,2,3] |
| 13CO J = 1–0 | FOREST | 21″ | 1.3 km s−1 | ∼0.35 K | [1,2,3] | |
| C18O J = 1–0 | FOREST | 21″ | 1.3 km s−1 | ∼0.35 K | [1,2,3] | |
| JCMT/CHIMPS | 13CO J = 3–2 | HARP | 15″ | 0.5 km s−1 | ∼0.14 K | [4,5] |
| Telescope/survey | Band | Detector | Resolution | References | ||
| Spitzer/GLIMPSE | 3.6 μm | IRAC | ∼2″ | [6], [7], [8] | ||
| Spitzer/GLIMPSE | 8.0 μm | IRAC | ∼2″ | [6], [7], [8] | ||
| Spitzer/MIPSGAL | 24 μm | MIPS | 6″ | [9], [10] |
*The value of rms noise levels are after smoothing (space and/or velocity) data sets.
4 Results
This section is organized as follows: subsection 4.1 presents the CO distribution in the first galactic quadrant; subsection 4.2 gives CO distributions and velocity structures of the W 43 GMC complex; and subsections 4.3–4.5 focus on the three regions of W 43 Main, G30.5, and W 43 South, respectively. These are active star-forming regions in the W 43 GMC complex.
4.1 Galactic-scale CO distributions and velocity structures in the first galactic quadrant with FUGIN
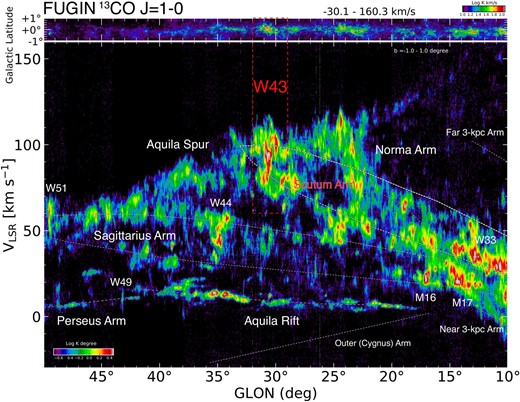
The upper panels of figures 3, 4, and 5 show the integrated intensity maps of the inner Galaxy (l = 10°–50°, b = −1°–1°) of 12CO, 13CO, and C18O, respectively. The integrated velocity ranges from −30 to 160 km s−1. The lower panels show the Galactic longitude–velocity diagrams, where the dotted lines indicate the spiral arm suggested by Reid et al. (2016). We find the Norma, Sagittarius, Scutum, Perseus, Near 3 kpc, Far 3 kpc, and Outer (Cygnus) spiral arms lie in this region of the inner Galactic plane. The Aquila Rift and Aquila Spur are also identified as the local components of the solar neighborhood and the inter-arm region, respectively. The active high-mass star-forming regions and a supernova remnant exist in each spiral arm (e.g., W 33, M 17, M 16, W 43, W 49, W 51, and W 44). W 43 exists in the Galactic plane in the direction of l = 30°, which contains rich gas, as seen in the integrated intensity maps and longitude–velocity diagram of the first quadrant (figures 3–5). This region is close to the tangential point of the Scutum Arm and the bar-end of the Milky Way (Nguyễn Lúóng et al. 2011). The 13CO also traces the spiral structures more clearly (figure 4). We note that dense gas traced by C18O (figure 5) has localized distribution compared with the low-density gas traced by 12CO (figure 3).
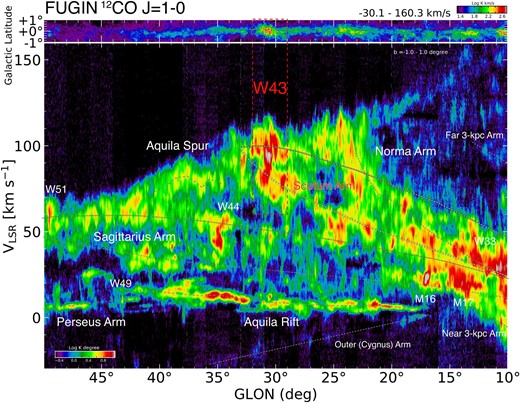
Upper panel: Integrated intensity map of 12CO J = 1–0 with the integrated velocity range of −30 km s−1–160 km s−1. Lower panel: Longitude–velocity diagram of 12CO J = 1–0 with the integrated latitude range of −1°–+1°. The white dotted lines indicate the spiral arm at the first quadrant from Reid et al. (2016). The near/far 3 kpc arm is also referred to in Dame and Thaddeus (2008). The color scale is displayed logarithmically.
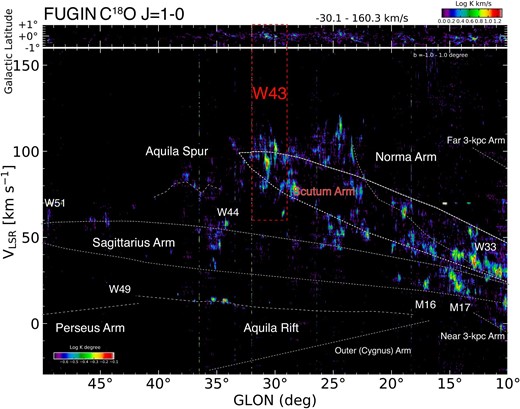
Same as figure 3, but for C18O J = 1–0. The data is smoothed to be ∼100″.
4.2 CO distributions of the W 43 giant molecular cloud complex
Figure 6 demonstrates the integrated intensity maps of the W 43 GMC complex, in (figure 6a) 12CO, (figure 6b) 13CO, and (figure 6c) C18O. The integrated velocity ranges from 78 to 120 km s−1, which corresponds to those defined by the previous IRAM CO J = 2–1 observations by Carlhoff et al. (2013). The X marks show the center positions of W 43 Main and W 43 South (Blum et al. 1999; Wood & Churchwell 1989). The entire GMC complex is distributed over ∼150 pc of the Galactic plane. The CO intensity has peaks at W 43 Main, G30.5, and W 43 South. Each region corresponds to a high-mass star-forming region. We point out that the C18O exists locally at W 43 Main, G30.5, and W 43 South. The C18O is surrounded by the diffuse molecular gas traced by 12CO.
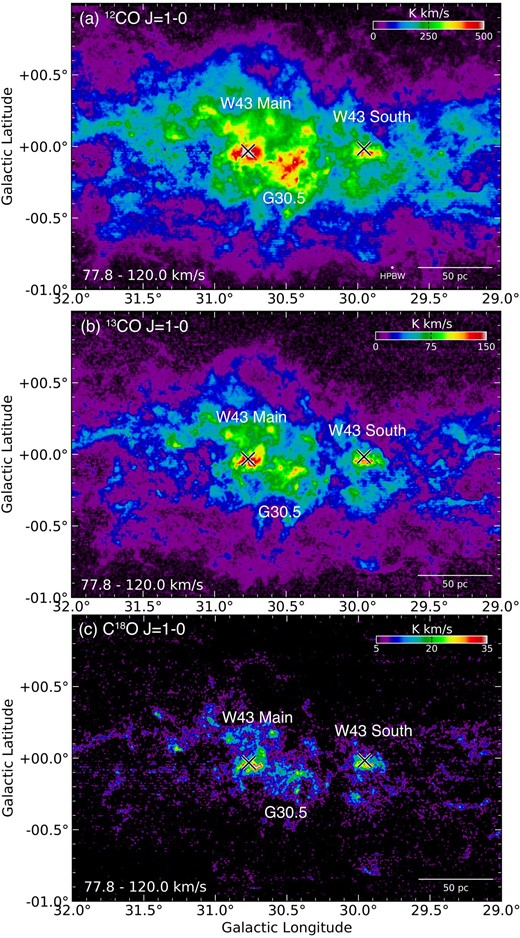
Integrated intensity maps of (a) 12CO, (b) 13CO, and (c) C18O J = 1–0 for the W 43 GMC complex. The integrated velocity range is from 78 km s−1 to 120 km s−1. The final beam size after convolution is 40″. The white crosses indicate W 43 Main (Blum et al. 1999) and W 43 South (Wood & Churchwell 1989).
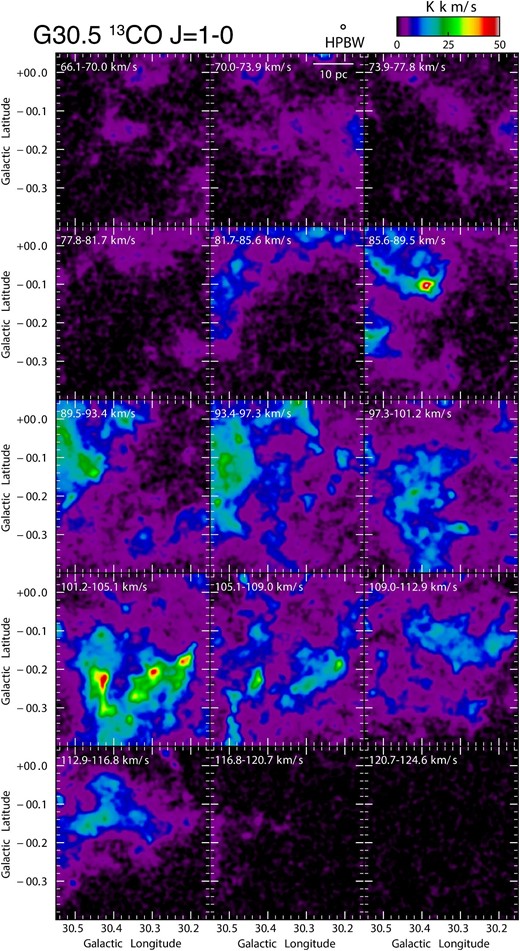
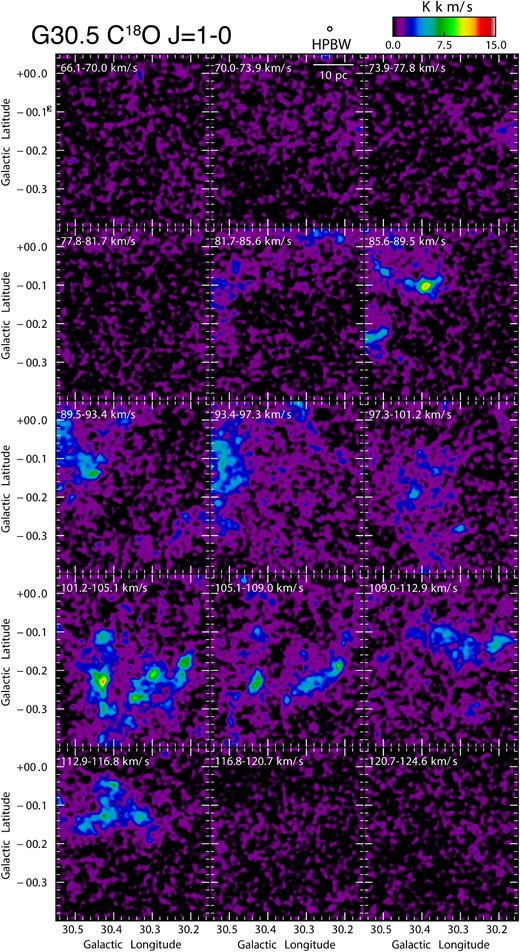
Figures 7, 8, and 9 show velocity channel maps of 12CO, 13CO, and C18O, respectively. The velocity ranges from 66 to 125 km s−1, with an interval of ∼4 km s−1. The velocity of the peak positions in W 43 Main, G30.5, and W 43 South ranges between 90–105 km s−1, 100–109 km s−1, and 93–105 km s−1, respectively. We find that the dense gas traced by C18O has clumpy structures over a wide velocity range (figure 9).
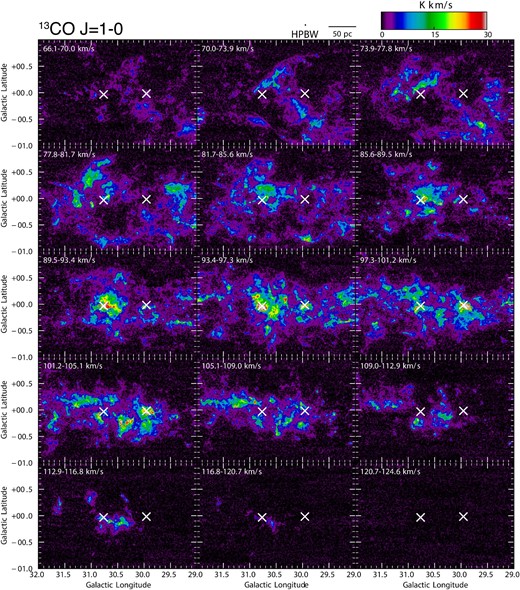
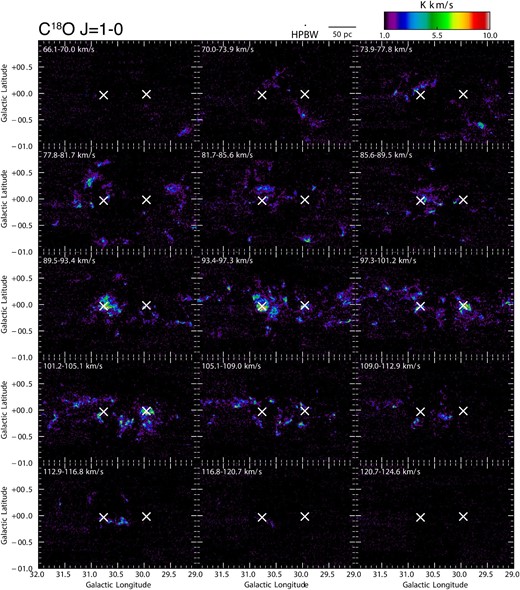
Figure 10 shows the longitude–velocity diagrams integrated over the latitudes between |$-{0{_{.}^{\circ}}4}$| and |${0{_{.}^{\circ}}4}$|. The 12CO has a much larger velocity width (∼20–30 km s−1; figures 10a and 11) than is typical for a GMC, with a size of 100 pc (Δv ∼10 km s−1) calculated by Larson’s law (Δv ∼ R0.5: Larson 1981; Heyer & Brunt 2004). The velocity width of the 13CO line is narrower than that of 12CO (figure 10a and 10b). However, C18O has clumpy structures with velocity widths of <10 km s−1 (figure 10c), and the large cloud complex in 12CO breaks into multiple velocity components in C18O.
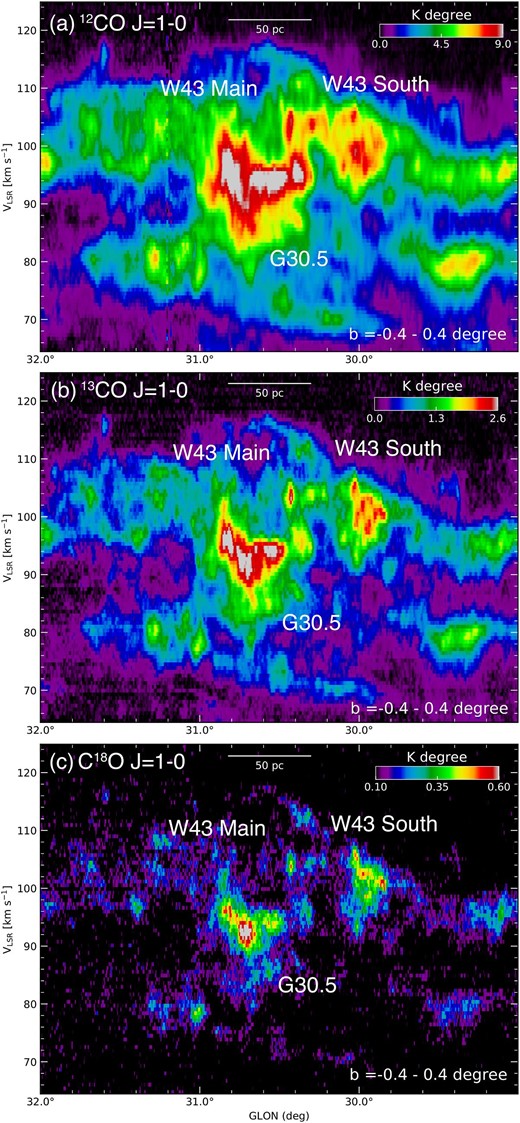
Longitude–velocity diagram of the (a) 12CO, (b) 13CO, and (c) C18O J = 1–0 emission with the integrated latitude range of |$b=-{0{_{.}^{\circ}}4}$|– |$+{0{_{.}^{\circ}}4}$|.

Spectra for 12CO, 13CO, and C18O J = 1–0 obtained at (a) W 43 Main, (b) G30.5, and (c) W 43 South. The red arrows indicate the velocity components associated with the W 43 GMC complex. The position of each spectrum is shown in the upper right of each panel.
The total molecular masses of the whole W 43 GMC are derived from 12CO, 13CO, and C18O to be ∼1 × 10⁷ M|$\odot$|, ∼1 × 10⁷ M|$\odot$|, and ∼2 × 10⁶ M|$\odot$| above 5σ noise levels (∼5 K of 12CO and 1.75 K of 13CO, C18O J = 1–0), respectively. Table 5 presents column densities and molecular masses of the W 43 GMC complex. The molecular masses estimated from 12CO are roughly consistent with the masses calculated from 13CO. On the other hand, the mass estimation from C18O is a factor of 4 lower than the others. This difference might be caused by the variation of the CO abundance ratio due to the UV radiation from OB-type stars in the W 43 GMC complex. According to Bally and Langer (1982), the selective photodissociation occurs in the surface layer of molecular clouds. Because the self-shielding against UV radiation is more efficient for more abundant molecules, dissociation of C18O becomes more effective in low-density regions, resulting in the C18O molecule becoming an empirical dense gas tracer. Indeed, Paron et al. (2018) reported that the 13CO|$/$|C18O abundance ratio (X13/18) is low in the dense region of W 43 South (G29.96−0.02). We present details of the method calculating the physical properties of the molecular gas in appendix 1.
| Name . | |$N^{12}_{\rm X\ peak}$| . | |$N^{12}_{\rm X\ mean}$| . | |$N^{13}_{\rm LTE\ peak}$| . | |$N^{13}_{\rm LTE\ mean}$| . | |$N^{18}_{\rm LTE\ peak}$| . | |$N^{18}_{\rm LTE\ mean}$| . | |$M^{12}_{\rm X}$| . | |$M_{\rm LTE}^{13}$| . | |$M_{\rm LTE}^{18}$| . |
|---|---|---|---|---|---|---|---|---|---|
| . | [cm−2] . | [cm−2] . | [cm−2] . | [cm−2] . | [cm−2] . | [cm−2] . | [M|$\odot$|] . | [M|$\odot$|] . | [M|$\odot$|] . |
| (1) . | (2) . | (3) . | (4) . | (5) . | (6) . | (7) . | (8) . | (9) . | (10) . |
| W 43 GMC complex | 3.3 × 10²³ | 1.1 × 10²² | 3.0 × 10²³ | 1.4 × 10²² | 3.2 × 10²³ | 2.2 × 10²¹ | 1.4 × 10⁷ | 1.1 × 10⁷ | 1.7 × 10⁶ |
| W 43 Main (Total) | 1.2 × 10²³ | 5.5 × 10²² | 2.6 × 10²³ | 6.4 × 10²² | 3.1 × 10²³ | 1.4 × 10²² | 2.0 × 10⁶ | 2.4 × 10⁶ | 5.3 × 10⁵ |
| 82 km s−1 cloud | 2.2 × 10²² | 8.0 × 10²¹ | 4.6 × 10²² | 8.0 × 10²¹ | 6.0 × 10²² | 2.6 × 10²⁰ | 2.9 × 10⁵ | 2.6 × 10⁵ | 8.2 × 10³ |
| 94 km s−1 cloud | 8.1 × 10²² | 3.3 × 10²² | 2.2 × 10²³ | 4.4 × 10²² | 3.1 × 10²³ | 1.2 × 10²² | 1.2 × 10⁶ | 1.6 × 10⁶ | 4.5 × 10⁵ |
| 103 km s−1 cloud | 2.8 × 10²² | 1.0 × 10²² | 7.9 × 10²² | 8.9 × 10²¹ | 8.6 × 10²² | 1.3 × 10²¹ | 3.8 × 10⁵ | 3.2 × 10⁵ | 4.7 × 10⁴ |
| 115 km s−1 cloud | 2.5 × 10²² | 3.7 × 10²¹ | 5.7 × 10²² | 4.6 × 10²¹ | 4.8 × 10²² | 7.4 × 10²⁰ | 1.4 × 10⁵ | 1.1 × 10⁵ | 1.8 × 10⁴ |
| G30.5 (Total) | 9.7 × 10²² | 4.5 × 10²² | 2.0 × 10²³ | 3.9 × 10²² | 2.3 × 10²³ | 6.1 × 10²¹ | 1.7 × 10⁶ | 1.4 × 10⁶ | 2.2 × 10⁵ |
| 88 km s−1 cloud | 3.2 × 10²² | 6.8 × 10²¹ | 1.1 × 10²³ | 7.7 × 10²¹ | 1.4 × 10²³ | 1.2 × 10²¹ | 2.5 × 10⁵ | 1.8 × 10⁵ | 2.7 × 10⁴ |
| 93 km s−1 cloud | 3.7 × 10²² | 1.5 × 10²² | 7.2 × 10²² | 1.3 × 10²² | 6.2 × 10²² | 6.5 × 10²⁰ | 5.7 × 10⁵ | 4.6 × 10⁵ | 2.3 × 10⁴ |
| 103 km s−1 cloud | 4.7 × 10²² | 1.5 × 10²² | 1.7 × 10²³ | 1.5 × 10²² | 2.3 × 10²³ | 3.6 × 10²¹ | 5.7 × 10⁵ | 5.3 × 10⁵ | 1.3 × 10⁵ |
| 113 km s−1 cloud | 2.4 × 10²² | 7.4 × 10²¹ | 4.0 × 10²² | 6.1 × 10²¹ | 5.9 × 10²² | 1.3 × 10²¹ | 2.7 × 10⁵ | 1.9 × 10⁵ | 4.1 × 10⁴ |
| W 43 South (Total) | 9.3 × 10²² | 3.0 × 10²² | 3.0 × 10²³ | 3.4 × 10²² | 3.2 × 10²³ | 1.3 × 10²² | 9.7 × 10⁵ | 1.1 × 10⁶ | 4.0 × 10⁵ |
| 93 km s−1 cloud | 3.9 × 10²² | 7.9 × 10²¹ | 1.3 × 10²³ | 9.3 × 10²¹ | 1.9 × 10²³ | 2.2 × 10²¹ | 2.6 × 10⁵ | 2.5 × 10⁵ | 6.1 × 10⁴ |
| 102 km s−1 cloud | 6.2 × 10²² | 1.7 × 10²² | 2.4 × 10²³ | 2.5 × 10²² | 3.0 × 10²³ | 1.1 × 10²² | 5.6 × 10⁵ | 7.4 × 10⁵ | 3.3 × 10⁵ |
*The clipping level is adopted as 5σ (∼5 K of 12CO and 1.75 K of 13CO, C18 O J = 1–0). The integrated velocity range of the total molecular gas is from 78 to 120 km s−1. The velocity clouds of W 43 Main, G30.5, and W 43 South are the same as in figures 12, 15, and 18, respectively.
†Columns: (1) Name. (2) Peak H2 column density from 12CO assuming the X-factor. (3) Average H2 column density of the cloud from 12CO assuming the X-factor. (4) Peak H2 column density from 13CO assuming the LTE. (5) Average H2 column density of the cloud from 13CO assuming the LTE. (6) Peak H2 column density from C18O assuming the LTE. (7) Average H2 column density of the cloud from C18O assuming the LTE. (8) Total H2 mass from 12CO assuming the X-factor. (9) Total H2 mass from 13CO assuming the LTE. (10) Total H2 mass from C18O assuming the LTE.
| Name . | |$N^{12}_{\rm X\ peak}$| . | |$N^{12}_{\rm X\ mean}$| . | |$N^{13}_{\rm LTE\ peak}$| . | |$N^{13}_{\rm LTE\ mean}$| . | |$N^{18}_{\rm LTE\ peak}$| . | |$N^{18}_{\rm LTE\ mean}$| . | |$M^{12}_{\rm X}$| . | |$M_{\rm LTE}^{13}$| . | |$M_{\rm LTE}^{18}$| . |
|---|---|---|---|---|---|---|---|---|---|
| . | [cm−2] . | [cm−2] . | [cm−2] . | [cm−2] . | [cm−2] . | [cm−2] . | [M|$\odot$|] . | [M|$\odot$|] . | [M|$\odot$|] . |
| (1) . | (2) . | (3) . | (4) . | (5) . | (6) . | (7) . | (8) . | (9) . | (10) . |
| W 43 GMC complex | 3.3 × 10²³ | 1.1 × 10²² | 3.0 × 10²³ | 1.4 × 10²² | 3.2 × 10²³ | 2.2 × 10²¹ | 1.4 × 10⁷ | 1.1 × 10⁷ | 1.7 × 10⁶ |
| W 43 Main (Total) | 1.2 × 10²³ | 5.5 × 10²² | 2.6 × 10²³ | 6.4 × 10²² | 3.1 × 10²³ | 1.4 × 10²² | 2.0 × 10⁶ | 2.4 × 10⁶ | 5.3 × 10⁵ |
| 82 km s−1 cloud | 2.2 × 10²² | 8.0 × 10²¹ | 4.6 × 10²² | 8.0 × 10²¹ | 6.0 × 10²² | 2.6 × 10²⁰ | 2.9 × 10⁵ | 2.6 × 10⁵ | 8.2 × 10³ |
| 94 km s−1 cloud | 8.1 × 10²² | 3.3 × 10²² | 2.2 × 10²³ | 4.4 × 10²² | 3.1 × 10²³ | 1.2 × 10²² | 1.2 × 10⁶ | 1.6 × 10⁶ | 4.5 × 10⁵ |
| 103 km s−1 cloud | 2.8 × 10²² | 1.0 × 10²² | 7.9 × 10²² | 8.9 × 10²¹ | 8.6 × 10²² | 1.3 × 10²¹ | 3.8 × 10⁵ | 3.2 × 10⁵ | 4.7 × 10⁴ |
| 115 km s−1 cloud | 2.5 × 10²² | 3.7 × 10²¹ | 5.7 × 10²² | 4.6 × 10²¹ | 4.8 × 10²² | 7.4 × 10²⁰ | 1.4 × 10⁵ | 1.1 × 10⁵ | 1.8 × 10⁴ |
| G30.5 (Total) | 9.7 × 10²² | 4.5 × 10²² | 2.0 × 10²³ | 3.9 × 10²² | 2.3 × 10²³ | 6.1 × 10²¹ | 1.7 × 10⁶ | 1.4 × 10⁶ | 2.2 × 10⁵ |
| 88 km s−1 cloud | 3.2 × 10²² | 6.8 × 10²¹ | 1.1 × 10²³ | 7.7 × 10²¹ | 1.4 × 10²³ | 1.2 × 10²¹ | 2.5 × 10⁵ | 1.8 × 10⁵ | 2.7 × 10⁴ |
| 93 km s−1 cloud | 3.7 × 10²² | 1.5 × 10²² | 7.2 × 10²² | 1.3 × 10²² | 6.2 × 10²² | 6.5 × 10²⁰ | 5.7 × 10⁵ | 4.6 × 10⁵ | 2.3 × 10⁴ |
| 103 km s−1 cloud | 4.7 × 10²² | 1.5 × 10²² | 1.7 × 10²³ | 1.5 × 10²² | 2.3 × 10²³ | 3.6 × 10²¹ | 5.7 × 10⁵ | 5.3 × 10⁵ | 1.3 × 10⁵ |
| 113 km s−1 cloud | 2.4 × 10²² | 7.4 × 10²¹ | 4.0 × 10²² | 6.1 × 10²¹ | 5.9 × 10²² | 1.3 × 10²¹ | 2.7 × 10⁵ | 1.9 × 10⁵ | 4.1 × 10⁴ |
| W 43 South (Total) | 9.3 × 10²² | 3.0 × 10²² | 3.0 × 10²³ | 3.4 × 10²² | 3.2 × 10²³ | 1.3 × 10²² | 9.7 × 10⁵ | 1.1 × 10⁶ | 4.0 × 10⁵ |
| 93 km s−1 cloud | 3.9 × 10²² | 7.9 × 10²¹ | 1.3 × 10²³ | 9.3 × 10²¹ | 1.9 × 10²³ | 2.2 × 10²¹ | 2.6 × 10⁵ | 2.5 × 10⁵ | 6.1 × 10⁴ |
| 102 km s−1 cloud | 6.2 × 10²² | 1.7 × 10²² | 2.4 × 10²³ | 2.5 × 10²² | 3.0 × 10²³ | 1.1 × 10²² | 5.6 × 10⁵ | 7.4 × 10⁵ | 3.3 × 10⁵ |
*The clipping level is adopted as 5σ (∼5 K of 12CO and 1.75 K of 13CO, C18 O J = 1–0). The integrated velocity range of the total molecular gas is from 78 to 120 km s−1. The velocity clouds of W 43 Main, G30.5, and W 43 South are the same as in figures 12, 15, and 18, respectively.
†Columns: (1) Name. (2) Peak H2 column density from 12CO assuming the X-factor. (3) Average H2 column density of the cloud from 12CO assuming the X-factor. (4) Peak H2 column density from 13CO assuming the LTE. (5) Average H2 column density of the cloud from 13CO assuming the LTE. (6) Peak H2 column density from C18O assuming the LTE. (7) Average H2 column density of the cloud from C18O assuming the LTE. (8) Total H2 mass from 12CO assuming the X-factor. (9) Total H2 mass from 13CO assuming the LTE. (10) Total H2 mass from C18O assuming the LTE.
Figure 11 shows the spectra of (figure 11a) W 43 Main, (figure 11b) G30.5, and (figure 11c) W 43 South. We find a large velocity width (20–30 km s−1) in 12CO and multiple velocity components in 13CO from 80 to 120 km s−1 (see red arrows of figure 11). We observe that the 70 km s−1 component is the foreground cloud, as suggested by Carlhoff et al. (2013).
In the next subsection, we present the results of detailed analysis of W 43 Main, G30.5, and W 43 South, aiming to reveal the origin of the dense gas and high-mass stars.
4.3 W 43 Main
4.3.1 13CO and C18O spatial distributions and velocity structures
We find four clouds at different velocities (82 km s−1, 94 km s−1, 103 km s−1, and 115 km s−1) in the W 43 Main cluster. Figure 12 presents integrated intensity maps of each cloud in the 13CO (figures 12a–12d) and C18O (figures 12e–12h) emission. The X mark indicates a stellar cluster, and the white circles show 51 protocluster candidates identified by Motte, Schilke, and Lis (2003).
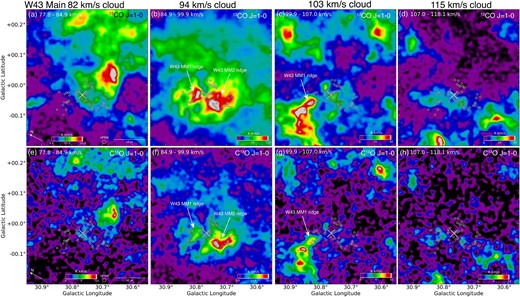
Integrated intensity map of 13CO J = 1–0 for the (a) 82 km s−1, (b) 94 km s−1, (c) 103 km s−1, and (d) 115 km s−1 clouds. The X marks indicate the W 43 Main cluster (Blum et al. 1999). The white circles present the 51 protocluster candidates (W 43 MM1-MM51) cataloged by Motte, Schilke, and Lis (2003). The final beam size after convolution is ∼40″. Integrated intensity map of C18O J = 1–0 obtained for the (e) 82 km s−1, (f) 94 km s−1, (g) 103 km s−1, and (h) 115 km s−1 clouds.
The 82 km s−1 cloud (figures 12a, 12e) has an intensity peak at |$(l,b)\sim ({30{_{.}^{\circ}}66}, {0{_{.}^{\circ}}03})$|, and extends over 20 pc on the western side of the cluster. The 94 km s−1 cloud (figures 12b, 12f) is the brightest component, and is distributed over 20 pc around the cluster. Two peaks in 13CO correspond to the W 43-MM1 and W 43-MM2 ridges identified in the N2H+ and SiO emission (Nguyễn Lúóng et al. 2013). In particular, the W 43-MM2 ridge is brightest in the C18O emission (figure 12f). The 103 km s−1 cloud (figures 12c, 12g) has intensity peaks at |$(l,b)\sim ({30{_{.}^{\circ}}83},{-{0{_{.}^{\circ}}05}})$| and |$(l,b)\sim ({30{_{.}^{\circ}}86}, {-{0{_{.}^{\circ}}08}})$|, ∼5 pc apart from the cluster. These peaks also correspond to the W 43-MM1 ridge. The 115 km s−1 cloud (figures 12d, 12h) shows the diffuse component of 13CO near the cluster center. The two peaks exist at |$(l,b)\sim ({30{_{.}^{\circ}}63}, -{0{_{.}^{\circ}}11})$| and |$(l,b)\sim ({30{_{.}^{\circ}}81}, -{0{_{.}^{\circ}}19})$|, which is separate from the cluster. We also show the velocity channel maps in the appendix (figures 26–28).
Figure 13 displays the latitude–velocity diagram of W 43 Main in (figure 13a) 13CO and (figure 13b) C18O J =1–0. The black boxes indicate the radio recombination line (RRL) velocity of 91.7 km s−1 at |$(l,b)\sim ({30{_{.}^{\circ}}780}, -{0{_{.}^{\circ}}020})$| obtained by Luisi et al. (2017). The yellow line indicates the position of the W 43 Main cluster. The 94 km s−1 cloud has ∼10 km s−1 line width, which is the broadest line width of all clouds and also traced by C18O J = 1–0. The RRL velocity coincides with the velocity range of the 94 km s−1 cloud. This cloud has the highest peak column density ∼1023 cm−2 among all clouds, and is connected with the 82 km s−1 and 103 km s−1 clouds in the velocity space of 13CO J = 1–0. However, the 115 km s−1 cloud is not connected to other clouds. More detailed analysis of these clouds, including the intermediate velocity components, are described in subsection 5.4.
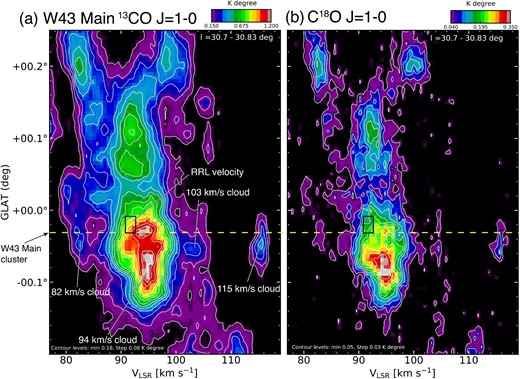
Galactic latitude–velocity diagram of (a) 13CO and (b) C18O J = 1–0 integrated over the latitude range from |${30{_{.}^{\circ}}7}$| to |${30{_{.}^{\circ}}83}$|. The contour levels and intervals are 0.18 K and 0.08 K of panel (a), 0.05 K and 0.03 K of panel (b), respectively. The black boxes show the radio recombination line velocity (91.7 km s−1) at |$(l, b) = ({30{_{.}^{\circ}}780}, -{0{_{.}^{\circ}}020})$| from Luisi et al. (2017), where their resolution is ∼1.86 km s−1 × 82″. The yellow dashed line indicates the position of the W 43 Main cluster (Blum et al. 1999).
4.3.2 13CO J = 3–2/1–0 intensity ratios and a comparison to the Spitzer 8 μm images
Figures 14a, 14b, 14c, and 14d show the 13CO J = 3–2/1–0 integrated intensity ratio (|$R^{13}_{\rm 3-2/1-0}$|) maps of the 82 km s−1, 94 km s−1, 103 km s−1, and 115 km s−1 cloud, respectively. We mask the region with low 13CO J = 3–2 intensity (<3σ). The intensity ratio of different rotational transition levels is a useful tool to investigate the physical state (gas density and kinematic temperature) of the molecular clouds (e.g., the Large Velocity Gradient model: Goldreich & Kwan 1974). We also present a comparison of |$R^{13}_{\rm 3-2/1-0}$| for each cloud with the Spitzer 8 μm images to clarify the physical association with W 43 Main. Figures 14e, 14f, 14g, and 14h show the 13CO J = 3–2 intensity of the 82 km s−1, 94 km s−1, 103 km s−1, and 115 km s−1 clouds by contours superposed on the Spitzer 8 μm image, respectively. The ring-like structure traced by the 8 μm emission corresponds to the infrared bubble N52 (see figure 19 of Deharveng et al. 2010).
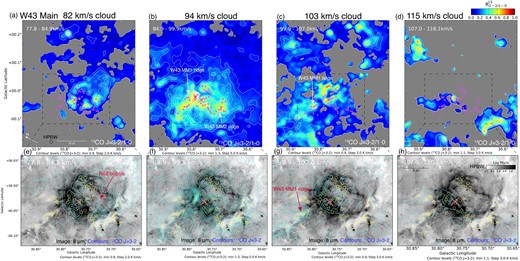
Intensity ratio map of 13CO J = 3–2/13CO J = 1–0 from JCMT and FUGIN for the (a) 82 km s−1, (b) 94 km s−1, (c) 103 km s−1, and (d) 115 km s−1 cloud. The X marks indicate W 43 Main cluster (Blum et al. 1999). The circles indicate the 51 compact fragments (W 43 MM1-MM51) cataloged by Motte, Schilke, and Lis (2003). The final beam size after convolution is ∼40″. The clipping levels are adopted as 3σ (∼0.9 K km s−1 ∼1.3 K km s−1, ∼0.9 K km s−1, and ∼1.1 K km s−1) of each integrated velocity range. Integrated intensity map of 13CO J = 3–2 (contours) obtained with JCMT (CHIMPS) superposed on the Spitzer 8 μm image for the (e) 82 km s−1, (f) 94 km s−1, (g) 103 km s−1, and (h) 115 km s−1 cloud.
The 82 km s−1 cloud (figures 14a and 14e) has a high-intensity ratio (|$R^{13}_{\rm 3-2/1-0}>0.5$|) around the N52 bubble, and corresponds to the brightest part of the 8 μm image. The 94 km s−1 cloud (figures 14b and 14f) is distributed over 10 pc around W 43 Main, and the intensity ratio (|$R^{13}_{\rm 3-2/1-0}>0.5$|) is enhanced at the protocluster candidates identified by Motte, Schilke, and Lis (2003). In particular, the high-intensity ratio positions correspond to the W 43-MM1 and W 43-MM2 ridge identified by Nguyễn Lúóng
et al. (2013). The 103 km s−1 cloud (figures 14c and 14g) has a high-intensity ratio around the bubble, which is a similar trend to the 82 km s−1 cloud. The central part of the bubble has a cavity-like structure. The intensity ratio at the W 43 MM1 ridge is also enhanced, where the dark cloud is recognized in the 8 μm image. The 115 km s−1 cloud (figures 14d and 14h) shows a locally high-intensity ratio near the W 43 Main cluster, which corresponds to the bright part of the 8 μm image. In addition, clouds 10 pc away from W 43 Main to the north and south also have enhanced intensity ratios (|$R^{13}_{\rm 3-2/1-0}>0.8$|). The average H2 density is estimated to be around 6 × 1022cm−2/20 pc ∼103 cm−3 from the 13CO average column density at W 43 Main, if we assume that the line of sight extends to 20 pc. The kinetic temperature is found to be ∼50 K with |$R^{13}_{\rm 3-2/1-0}\sim 0.4$| using the non-LTE code (LADEX:5 Van der Tak et al. 2007) assuming the input parameters as a line width of 5 km s−1, CO column density of 7.8 × 1016 cm−2 (= 6 × 10²²/X[13CO]), and H2 density of 103 cm−3, respectively. This kinetic temperature is higher than is typical for a molecular cloud without star formation. To summarize our results, these four clouds show the effect of heating by ultraviolet radiation from high-mass stars in W 43 Main. Therefore, these clouds are likely to be physically associated with W 43 Main from the velocity difference of ∼10–20 km s−1.
4.4 G30.5
4.4.1 13CO and C18O spatial distributions and velocity structures
We find four different velocity clouds at 88 km s−1, 93 km s−1, 103 km s−1, and 113 km s−1 for G30.5. Figures 15a–15h show the integrated intensity maps of 13CO and C18O J = 1–0 emissions of these clouds. The 88 km s−1 cloud (figures 15a and 15e) shows a peaked structure at |$(l,b)\sim ({30{_{.}^{\circ}}39}, -{0{_{.}^{\circ}}10})$|, which corresponds to the infrared source of IRAS 18445−0222. The 93 km s−1 cloud (figures 15b and 15f) has a peak of |$(l,b)\sim ({30{_{.}^{\circ}}45}, -{0{_{.}^{\circ}}14})$|, and is distributed over 15 pc of the northern side. The 103 km s−1 cloud (figures 15c and 15g) exhibits three CO peaks, which correspond to the infrared sources of G030.404−00.238, IRAS 18447−0229, and G030.213−00.156. The 113 km s−1 cloud (figures 15d and 15h) extends over 20 pc in the direction of the galactic longitude.
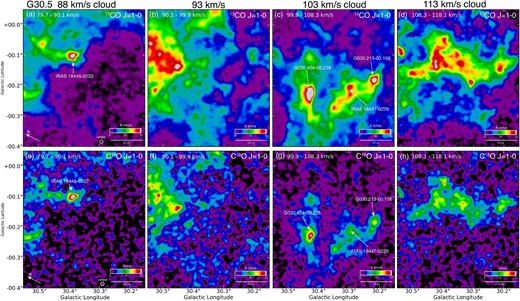
Integrated intensity map of 13CO J = 1–0 for the (a) 88 km s−1, (b) 93 km s−1, (c) 103 km s−1 and (d) 113 km s−1. The final beam size after convolution is ∼40″. Integrated intensity map of C18O J = 1–0 for the (e) 88 km s−1, (f) 93 km s−1, (g) 103 km s−1, and (h) 113 km s−1 cloud.
We also made a position–velocity diagram to investigate the relationship between these four clouds. Figure 16 shows the Galactic latitude–velocity diagram of (figure 16a) 13CO and (figure 16b) C18O J = 1–0. The dense gas traced by C18O J = 1–0 demonstrates the four discrete velocity components more clearly. The black boxes present the RRL velocity (∼102.5 km s−1) at |$(l,b)\sim ({30{_{.}^{\circ}}404}, -{0{_{.}^{\circ}}238})$| obtained by Lockman (1989). The RRL lies close to the 103 km s−1 clouds. We also present the velocity channel maps in the appendix (figures 29–31). We observe that G30.5 contains a high amount of molecular gas, while the present star-formation activity appears lower than W 43 Main.
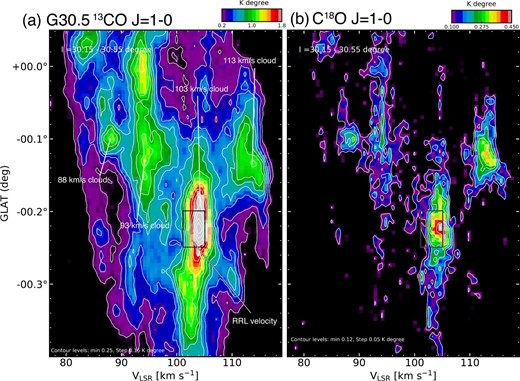
Galactic latitude–velocity diagram of (a) 13CO and (b) C18O J = 1–0 integrated over the latitude range from |${30{_{.}^{\circ}}15}$| to |${30{_{.}^{\circ}}55}$|. The black boxes show the radio recombination line velocity (∼102.5 km s−1) at |$(l,b)\sim ({30{_{.}^{\circ}}404}, -{0{_{.}^{\circ}}238})$| from Lockman (1989), where their resolution is ∼4 km s−1 × 3′. The contour levels and intervals are 0.25 K and 0.15 K of panel (a), 0.12 K and 0.05 K of panel (b). (Color online)
4.4.2 13CO J = 3–2/1–0 intensity ratios and a comparison to the Spitzer 8 μm images
Figures 17a–17d show |$R^{13}_{\rm 3-2/1-0}$| maps of the 88 km s−1, 93 km s−1, 103 km s−1, and 113 km s−1 clouds, respectively. The clipping levels are adopted at 3σ resulting in 0.8 K km s−1, 1.1 K km s−1, 1.0 K km s−1, and 1.1 K km s−1 for the 13CO J = 3–2 emissions, respectively. Figures 17e–17h show the 13CO J = 3–2 (contours) distribution superposed on the Spitzer 8 μm images. The 88 km s−1 cloud (figures 17a and 17e) indicates a local high-intensity ratio (|$R^{13}_{\rm 3-2/1-0} > 0.6$|) that corresponds to the infrared source of IRAS 18445−0222 (figures 17a, 17e). The 93 km s−1 cloud (figures 17b and 17f) has a low ratio (|$R^{13}_{\rm 3-2/1-0} < 0.3$|), but morphological correspondence of the infrared peak at |$(l,b)\sim ({30{_{.}^{\circ}}52}, -{0{_{.}^{\circ}}22})$|. The 103 km s−1 cloud (figures 17c, 17g) indicates high |$R^{13}_{\rm 3-2/1-0} > 0.6$| at G030.213−00.516, G030.404−00.238, IRAS 18447−0229, and G030.489−00.364, which have counterparts in the 8 μm image. The 113 km s−1 cloud (figures 17d, 17h) has enhanced |$R^{13}_{\rm 3-2/1-0} > 0.6$| at the western and eastern side. The 8 μm image also corresponds to the high |$R^{13}_{\rm 3-2/1-0}$| at the eastern side of G30.5. To summarize the results for G30.5, these four clouds are also likely to be partially associated with G30.5 because of high-intensity ratios or morphological correspondence with the infrared images.

Intensity ratio map of 13CO J = 3–2/13CO J = 1–0 from JCMT and FUGIN for the (a) 88 km s−1 cloud, (b) 93 km s−1 cloud, (c) 103 km s−1 cloud, and (d) 113 km s−1 cloud. The final beam size after convolution is ∼40″. The clipping levels are adopted as 3σ (∼0.8 K km s−1, ∼1.1 K km s−1, ∼1.0 K km s−1, and ∼1.1 K km s−1) of each integrated velocity range. Integrated intensity map of 13CO J = 3–2 (contours) obtained by JCMT superposed on the Spitzer 8 μm image for the (e) 88 km s−1 cloud, (f) 93 km s−1 cloud, (g) 103 km s−1 cloud, and (h) 113 km s−1 cloud.
4.5 W 43 South (G29.96−0.02)
4.5.1 13CO and C18O spatial distributions and velocity structures
We find two different velocity clouds (93 km s−1 and 102 km s−1) for W 43 South. Figure 18 shows the integrated intensity maps of 13CO and C18O J = 1–0 emissions, where crosses indicate the radio continuum sources
obtaine (Condon et al. 1998). These sources correspond to the OB-type stars identified by radio continuum observations, where the numbering is the same as in Beltrán et al. (2013). The 93 km s−1 cloud (figures 18a and 18c) has clumpy structures and a peak intensity at source number 2. This 13CO cloud is distributed over 10 pc in the direction of the Galactic longitude. The 102 km s−1 cloud (figures 18b and 18d) has peak intensities at sources 4, 5, 8, and 9. These extend from the northern to the southern side. We also demonstrate the velocity channel maps of W 43 South in the appendix (figures 32–34). We made the position–velocity diagram toward W 43 South. Figure 19 shows the Galactic longitude–velocity diagram of (figure 19a) 13CO, and (figure 19b) C18O J = 1–0, respectively. The two clouds can be identified on the position–velocity diagram (figure 19). The black box shows the RRL velocity (96.7 km s−1) at |$(l,b)\sim ({29{_{.}^{\circ}}944}, -{0{_{.}^{\circ}}042})$| obtained by Lockman et al. (1989), which coincides with the intermediate velocity of two clouds. The two clouds converge around |$l\sim {29{_{.}^{\circ}}9}$|. We also find a “V-shape”-like structure at the center of the RRL velocity (blue dotted lines). From the C18O emission in figure 19b, the two clouds and the “V-shape”-like structure can be seen more clearly. We point out that the V-shape exists slightly removed from the overlapping region of the two clouds. We argue that this velocity structure is a signpost of cloud–cloud collision (e.g., Fukui et al. 2018c). More detailed discussion is described in subsection 5.4.
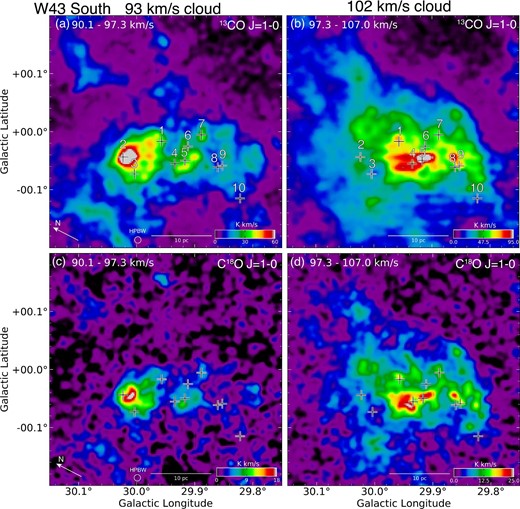
Integrated intensity map of 13CO J = 1–0 for (a) the 93 km s−1 cloud and (b) the 102 km s−1 cloud. The crosses indicate radio continuum sources identified by the NVSS survey (Condon et al. 1998), and the numbering is the same as in Beltrán et al. (2013). The final beam size after convolution is ∼40″. Integrated intensity map of C18O J = 1–0 for (c) the 93 km s−1 cloud and (d) the 102 km s−1 cloud.
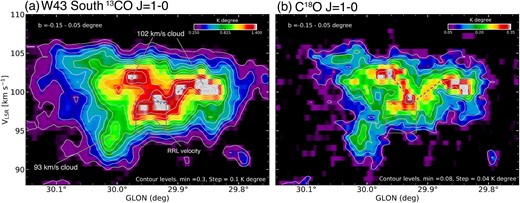
Galactic longitude–velocity diagram of (a) 13CO and (b) C18O J = 1–0 integrated over the latitude range from |$-{0{_{.}^{\circ}}15}$| to |${0{_{.}^{\circ}}05}$|. The contour levels and intervals are 0.3 K and 0.1 K of panel (a), 0.08 K and 0.04 K of panel (b), respectively. The black boxes show the H110α radio recombination line velocity (∼96.7 km s−1) at |$(l,b)\sim ({29{_{.}^{\circ}}944}, -{0{_{.}^{\circ}}042})$| from Lockman (1989), where their resolution is ∼4 km s−1 × 3′. The blue dotted lines present the V-shape like structure.
4.5.2 13CO J = 3–2/1–0 intensity ratios and a comparison to the Spitzer 8 μm images
Figures 20a and 20b show the |$R^{13}_{\rm 3-2/1-0}$| maps of the 93 km s−1 and 102 km s−1 clouds, respectively. The clipping levels are adopted at 3σ (0.9 K km s−1 and 1.1 K km s−1) for the 13CO J = 3–2 emissions. Figures 20c and 20d indicate the 13CO J = 3–2 distributions superposed on the Spitzer 8 μm images indicate the 13CO J = 3–2 distributions superposed on the Spitzer 8 μm images. The 93 km s−1 cloud (figures 20a and 20c) has high |$R^{13}_{\rm 3-2/1-0}>0.6$| around sources 1, 2, 6, and 7, which correspond to the 8 μm peaks. The 102 km s−1 cloud (figures 20b and 20d) also shows high |$R^{13}_{\rm 3-2/1-0}>0.6$| at sources 1, 5, 8, and 9, which correspond to the 8 μm peaks. These |$R^{13}_{\rm 3-2/1-0}$| results coincide with the positions of the high dust temperature (>70 K) obtained from the results of Herschel 70–350 μm (see figure 7 of Beltrán et al. 2013). To summarize the results for W 43 South, these two clouds are also likely to be physically associated with W 43 South because of their high-intensity ratios and morphological correspondence with the radio continuum sources.
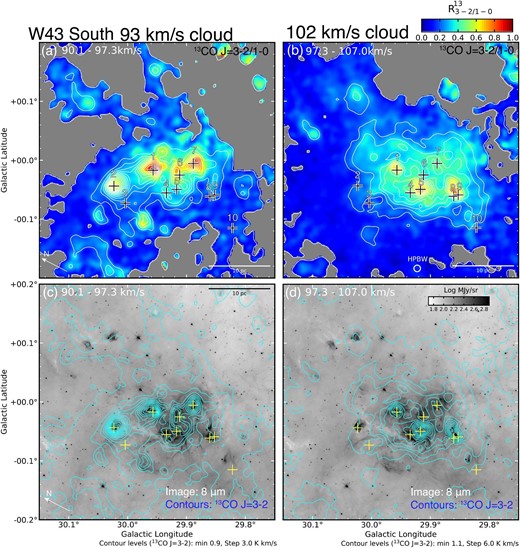
Intensity ratio map of 13CO J = 3–2/13CO J = 1–0 from JCMT and FUGIN for (a) the 93 km s−1 cloud and (b) the 102 km s−1 cloud. The crosses indicate radio continuum sources identified by the NVSS survey (Condon et al. 1998), and the numbering is the same as in Beltrán et al. (2013). The final beam size after convolution is ∼40″. The clipping levels are adopted as 3σ (∼0.9 K km s−1 and ∼1.1 K km s−1) of each integrated velocity range. Integrated intensity map of 13CO J = 3–2 (contours) obtained with JCMT superposed on the Spitzer 8 μm image for (c) the 93 km s−1 cloud and (d) the 102 km s−1 cloud.
5 Discussion
This section is structured as follows: subsection 5.1 gives a comparison of the brightness temperature with those in other GMCs (W 51 and M 17); subsection 5.2 shows the star formation efficiency (SFE) of GMCs; subsection 5.3 gives interpretation of the multiple clouds and velocity structures in W 43 Main, G30.5, and W 43 South; and in subsections 5.4–5.6 we propose the dense gas and high-mass star formation scenario produced by cloud–cloud collisions in the GMC complex in turbulent conditions. Finally, subsection 5.7 demonstrates the frequency of cloud–cloud collisions in the W 43 GMC complex.
5.1 Comparison of the brightness temperature with the W 51 and M 17 GMCs
We carried out the analysis using histograms of the molecular gas and of the W 43, W 51, and M 17 GMCs, aiming to reveal the molecular gas properties of the W 43 GMC complex. Figure 21 shows the integrated intensity maps of 12CO, 13CO, and C18O J = 1–0 for the W 51 and M 17 GMCs obtained by the FUGIN project.
The W 51 GMC: W 51 is a GMC including the high-mass star-forming regions of W 51 A and W 51 B (e.g., Carpenter & Sanders 1998; Parsons et al. 2012; Ginsburg et al. 2015, and reference therein). The parallactic distance is estimated to be 5.4 kpc near the tangential direction of the Sagittarius Arm (Sato et al. 2010), which is about the same distance as the W 43 GMC complex. The CO gas of three isotopes has a peak intensity at W 51 A, and the low-density gas traced by 12CO is distributed over 100 pc (figures 21a–21c). A more detailed analysis of the W 51 GMC using the FUGIN data is presented by Fujita et al. (2021).
The M 17 GMC: M 17 is also a GMC, composed of M 17 SW and M 17 SWex. M 17 SW includes the massive cluster NGC 6618 (e.g., Povich et al. 2007; Hoffmeister et al. 2008; Chini & Hoffmeister 2008 and references therein), and M 17 SWex has an infrared dark cloud, which is the location of the onset of massive star formation (Povich & Whitney 2010). The parallactic distance is derived to be 2.0 kpc, which corresponds to the distance to the Sagittarius Arm (Chibueze et al. 2016). All isotopes of CO have a strong peak at M 17 SW, while the diffuse gas is distributed over 30 pc near M 17 SWex (figures 21d–21f). Detailed properties of the M 17 cloud using the FUGIN data are described by Yamagishi et al. (2016) and Nishimura et al. (2018).
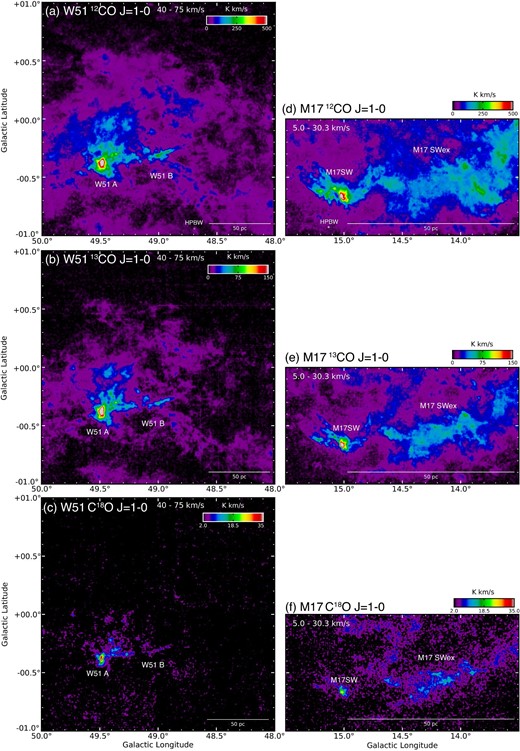
Integrated intensity maps of (a), (d) 12CO, (b), (e) 13CO, and (c), (f) C18O J = 1–0 for the W 51 and M 17 GMC obtained with FUGIN. The integrated velocity range of W 51 and M 17 is from 40 km s−1 to 75 km s−1 and from 5 km s−1 to 30 km s−1, respectively.
Figures 22a, 22b, and 22c show the histograms of the brightness temperatures of 12CO, 13CO, and C18O, which correspond to the brightness distribution function (BDF) introduced by Sawada et al. (2012a, 2012b, 2018). We smoothed the data of M 17 to 110″ in order to achieve the same spatial resolution (∼1 pc) as W 43 and W 51. We normalized the histograms at (figure 22a) 7.3–9.2 K, (figure 22b) 5.0–5.8 K, and (figure 22c) 1.9–2.1 K. The slope for M 17 in 12CO and 13CO (figures 22a and 22b) is shallower than those for W 43 and W 51. M 17 has excess voxels with high Tmb in the BDF. This is consistent with the trend reported by Sawada et al. (2012a, 2012b) that regions containing active star-forming regions show shallower distributions. If the detected emission within the beam is optically thick, the line becomes saturated with Tmb, reflecting the gas excitation temperature. Hence the excess with Tmb higher than ∼30 K indicates the extended warm gas component due to H ii regions with respect to the cloud extent, as is prominent for M 17.

Histogram of the brightness temperature of the voxels in the W 43, W 51, and M 17 GMC from (a) 12CO, (b) 13CO, and (c) C18O J = 1–0, respectively. The frequency is normalized by 7.3–9.2 K, 5.0–5.8 K, and 1.9–2.1 K, respectively. The clipping levels are adopted as 5σ of each region.
However, the histogram of C18O, which is optically thinner than other isotopes, has a different shape to the others, and W 43 has a high proportion of dense gas with a high brightness temperature (see the black arrow in figure 22c). This can be interpreted to mean that the dense gas in the W 43 GMC has a higher column density locally than the W 51 and M 17 GMCs.
5.2 Comparison of the star formation efficiency
We estimated the SFE of these GMCs with the aim of clarifying the present star formation activity of the W 43 GMC complex. The SFE is given by
where Mcloud and M* are the cloud mass and stellar mass, respectively. We derive the molecular mass from the FUGIN data. A detailed explanation of our methods is given in appendix 1. Table 6 shows our results for the SFEs of each GMC complex. The total stellar masses were estimated from the number of earliest O-type star(s) by assuming the number distribution of the Salpeter IMF (dN/dM ∝ M−2.35: Salpeter 1955). The summation range is adopted from 0.08 M|$\odot$| stars. The earliest spectral types are O3.5III in W 43 Main, O5III in W 43 South (G29.96−0.02), O4V in W 51, and O4V in M 17, respectively (see table 1 in Binder & Povich 2018). The masses of these earliest-type stars are adopted by referring to observational O-star parameters (see tables 4 and 5 in Martins et al. 2005). The total stellar mass of W 43 is derived from summing W 43 Main and W 43 South, and that of W 51 is consistent with the results of infrared spectroscopic observations by Bik et al. (2019).
| Name . | |$M^{12}_{\rm x}$| . | |$M^{13}_{\rm LTE}$| . | |$M^{18}_{\rm LTE}$| . | Stellar mass† . | SFE|$_{\rm ^{12}CO}$| . | SFE|$_{\rm ^{13}CO}$| . | SFE|$_{\rm C^{18}O}$| . |
|---|---|---|---|---|---|---|---|
| . | [M|$\odot$|] . | [M|$\odot$|] . | [M|$\odot$|] . | [M|$\odot$|] . | [|$\%$|] . | [|$\%$|] . | [|$\%$|] . |
| (1) . | (2) . | (3) . | (4) . | (5) . | (6) . | (7) . | (8) . |
| W 43 GMC | 1.4 × 10⁷ | 1.1 × 10⁷ | 1.7 × 10⁶ | ∼8 × 10⁴† | ∼0.5 | ∼0.7 | ∼4 |
| W 51 GMC | 2.9 × 10⁶ | 1.9 × 10⁶ | 2.9 × 10⁵ | ∼4 × 10⁴ | ∼1 | ∼2 | ∼12 |
| M 17 GMC | 6.8 × 10⁵ | 6.4 × 10⁵ | 1.6 × 10⁵ | ∼5 × 10⁴ | ∼7 | ∼7 | ∼24 |
*Columns: (1) Name. (2) Total H2 mass from 12CO assuming the X-factor. (3) Total H2 mass from 13CO assuming the LTE. (4) Total H2 mass from C18O assuming the LTE. (5) The total stellar mass derived by assuming the IMF from the earliest spectral type star(s), referring to Binder and Povich (2018). The masses of O-type star(s) are adopted from the observational stellar parameters of tables 4 and 5 in Martins et al. (2005). (6) SFE derived by the total H2 mass from 12CO. (7) SFE derived by the total H2 mass from 13CO. (8) SFE derived by the total H2 mass from C18O.
†The total stellar mass of W 43 is calculated by summing up W 43 Main and W 43 South (G29.96−0.02).
| Name . | |$M^{12}_{\rm x}$| . | |$M^{13}_{\rm LTE}$| . | |$M^{18}_{\rm LTE}$| . | Stellar mass† . | SFE|$_{\rm ^{12}CO}$| . | SFE|$_{\rm ^{13}CO}$| . | SFE|$_{\rm C^{18}O}$| . |
|---|---|---|---|---|---|---|---|
| . | [M|$\odot$|] . | [M|$\odot$|] . | [M|$\odot$|] . | [M|$\odot$|] . | [|$\%$|] . | [|$\%$|] . | [|$\%$|] . |
| (1) . | (2) . | (3) . | (4) . | (5) . | (6) . | (7) . | (8) . |
| W 43 GMC | 1.4 × 10⁷ | 1.1 × 10⁷ | 1.7 × 10⁶ | ∼8 × 10⁴† | ∼0.5 | ∼0.7 | ∼4 |
| W 51 GMC | 2.9 × 10⁶ | 1.9 × 10⁶ | 2.9 × 10⁵ | ∼4 × 10⁴ | ∼1 | ∼2 | ∼12 |
| M 17 GMC | 6.8 × 10⁵ | 6.4 × 10⁵ | 1.6 × 10⁵ | ∼5 × 10⁴ | ∼7 | ∼7 | ∼24 |
*Columns: (1) Name. (2) Total H2 mass from 12CO assuming the X-factor. (3) Total H2 mass from 13CO assuming the LTE. (4) Total H2 mass from C18O assuming the LTE. (5) The total stellar mass derived by assuming the IMF from the earliest spectral type star(s), referring to Binder and Povich (2018). The masses of O-type star(s) are adopted from the observational stellar parameters of tables 4 and 5 in Martins et al. (2005). (6) SFE derived by the total H2 mass from 12CO. (7) SFE derived by the total H2 mass from 13CO. (8) SFE derived by the total H2 mass from C18O.
†The total stellar mass of W 43 is calculated by summing up W 43 Main and W 43 South (G29.96−0.02).
In table 6, we see that W 43 has a low SFE compared to W 51 and M 17 calculated using all isotopes. This indicates that W 43 has a large proportion of molecular to stellar mass. When we estimate the SFE from the dense gas (C18O), W 43 shows |$\sim\!\! 4 \%$|, which is consistent with other nearby star-forming regions (|$3\%$|–|$6\%$|: Evans et al. 2009), and Orion GMC (|$\sim\!\! 4\%$|: Nishimura et al. 2015). Figure 23 presents the C18O/12CO J = 1–0 intensity ratio map, which shows the relatively high-density regions in the W 43 GMC complex. This map shows high ratios (∼0.07–0.08) around W 43 Main and W 43 South, which correspond to the present active star-forming region. Moreover, the W 43 GMC complex has locally high density regions including G30.5. These results indicate that future star formation in W 43 is likely to be more active. Therefore, we suggest that while “the current SFE” of the whole W 43 GMC is |$\sim\!\! 4 \%$|, the star formation activity in W 43 will possibly increase in the future. This possibility is also proposed by Nguyễn Lúóng et al. (2011) and Motte et al. (2017). We discuss the origin of the dense gas with multiple O-type stars in subsections 5.3–5.6, based on the properties of the W 43 GMC complex.
5.3 Interpretation of the multiple clouds in W 43 Main, G30.5, and W 43 South
5.4 Spectral features indicative of cloud–cloud collisions
When two clouds collide, as a natural consequence of momentum exchange, an intermediate velocity component, the so-called “bridge feature,” is expected to appear between the two clouds (e.g., Haworth et al. 2015a, 2015b). We thus carried out a detailed spectral analysis to investigate the bridge features in W 43 Main. Figures 24a and 24b illustrate an example 13CO spectrum and an excess emission as a residual of two Gaussian subtractions from the 13CO J = 3–2 spectrum, respectively. Figure 24c shows their spatial distributions of 13CO J = 3–2, and figure 24d shows the distribution of the J = 3–2/1–0 intensity ratio for the bridge component defined as the excess emission. We defined the bridge features by the following procedures using the 13CO data sets of J = 3–2 and 1–0 lines.
We applied the least-square fittings of the red- and blue-shifted components to the Gaussian functions (figure 24a).
We limited the center velocity (Vcent) and tried the fittings changing the range of Vcent to find the most successful condition. As a result, we set the criteria of subtracting the Gaussian functions if Vcent falls in the range of 77 ≤ Vcent < 83 km s−1 and 92 ≤ Vcent < 100 km s−1 for each component from the original data.
The bridge features are thus defined as the residual excess emission with the integrated velocity range from 82.3 to 88.2 km s−1 as shown in the green area of figure 24b.
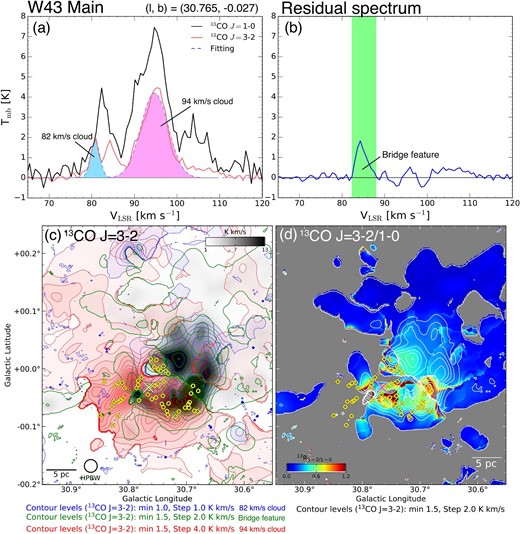
(a) Spectra and the Gaussian fitting results of the 13CO J = 3–2 emission in W 43 Main. (b) The residual spectrum of 13CO J = 3–2. The green area indicates the integrated velocity range of the bridge feature. (c) The spatial distributions of bridges (green contours) superposed on the two clouds (blue and red contours) in W 43 Main. (d) The |$R^{13}_{\rm 3-2/1-0}$| map of bridges in W 43 Main. The clipping level is adopted as 1.5 K km s−1. The data was smoothed to be a spatial resolution of ∼80″. Plots and symbols are the same as figure 1b.
The bridge features (green contours) are almost exclusively distributed in the region where the two clouds (blue and red contours) overlap in W 43 Main. Furthermore, the intensity ratio of the bridge features (|$R^{13}_{\rm 3-2/1-0} \gtrsim 0.7$|) is enhanced from the typical value (|$R^{13}_{\rm 3-2/1-0} \sim 0.3$|) without high-mass star formation in W 43. This result shows that the bridge features have high density and/or high temperature around W 43 Main.
We also tried to apply the same procedures to W 43 South. The spectra are, however, more blended and technically difficult to decompose due to relatively large velocity dispersions of the two components, and also to small velocity separation possibly because of the viewing angle with respect to the relative motion. Hence the bridge features are not identified clearly. The position–velocity diagram better indicates the two velocity components and the bridge feature connecting them (see figure 19). Higher resolution, higher sensitivity, and more optically thin data may help the decomposition to reveal more obvious evidence of the collisional interaction in W 43 South.
According to the cloud–cloud collision model, the interface layer of two clouds is decelerated and has intermediate velocity, and hence corresponds to the bridge feature that is localized in the overlapping region of two clouds on the plane of the sky. The bridge features are also expected to have high density and/or temperature by the collisional shock compression. Therefore, we suggest that the bridge feature in W 43 Main originates from cloud–cloud collisions, and support our hypothesis.
5.5 Interpretation of velocity distributions
We also propose that a cloud–cloud collision hypothesis can explain the origin of the V-shape structure on the position–velocity diagram (figure 19). When two clouds of different sizes collide and merge, a cavity is created in the large cloud. If we make a position–velocity diagram towards the colliding spots in this stage, we can expect to observe a V-shaped velocity distribution (see the middle panel in figure 5 of Haworth et al. 2015a). Indeed, the observations of the isolated compact cluster GM 24 also demonstrated that a cloud–cloud collision can produce the V-shape velocity structure from a comparison to the numerical simulation (see figure 7 of Fukui et al. 2018c). We note that the V-shape in W 43 South exists away from the overlapping region of the 93 km s−1 and 102 km s−1 clouds. We suggest that this shows another collision occurring to the 102 km s−1 cloud. Fujita et al. (2021) indeed argue that the multiple cloud collisions trigger massive star formation in the W 51 GMC.
The stellar feedback might be an alternative interpretation of the complex velocity structures, instead of a cloud–cloud collision. However, we cannot find elliptical velocity distributions on the position–velocity diagram expected for an expanding-shell (e.g., figure 12 of Fukui et al. 2012). Moreover, the ionization effects in W 43 South are likely to be small because of the young high-mass star-forming region (∼0.1 Myr: Watson & Hanson 1997). Indeed, most H ii regions in W 43 South have a compact size (<1 pc: table 6 of Beltrán et al. 2013), and are embedded in the molecular clouds. Dale et al. (2013) reported that the influence of the stellar winds from OB-type stars on molecular clouds is less effective compared to expanding H ii regions. Therefore, we conclude that the velocity structures of the clouds in the W 43 GMC complex is explained better by the cloud–cloud collision rather than the feedback effect.
5.6 Dense gas and multiple O-type star formation scenario in the W 43 GMC complex
Figure 25a shows our proposed model of the top-view schematic images of the W 43 GMC complex. The light blue represents the low-density gas traced by 12CO of the Scutum Arm. Our proposed model shows that more small-scale clouds (∼10–20 pc) collide with each other, and produce the local dense gas. If we roughly assume the colliding cloud size as 20–30 pc and the velocity difference of the cloud as 10–20 km s−1, the collisional time scale is derived as 20–30 pc/(10–20) km s−1 ∼1–3 Myr. This value is consistent with the age of O-type stars in W 43 Main (1–6 Myr: Motte et al. 2003; Bally et al. 2010). The stellar age of W 43 South is ∼0.1 Myr (Watson & Hanson 1997), which is shorter than the collisional timescale. This might imply that the star formation in the initial phase is triggered by a cloud–cloud collision.
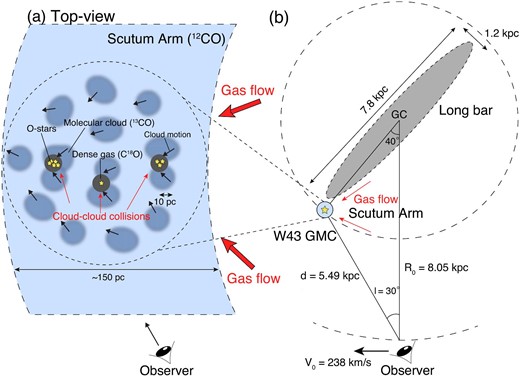
Schematic picture of our proposed dense gas and O-type star formation scenario of the W 43 GMC complex in (a) ∼100 pc scale and (b) the Galactic-scale. The Galactic-scale illustration is based on figure 11 of Sofue et al. (2019). The distance to the Galactic center (R0) and W 43 (d) are adopted from the VLBI astrometry results obtained by Honma et al. (2012) and Zhang et al. (2014), respectively. The solar constant (V0) is adopted from Honma et al. (2012). The long-bar parameters are adopted as 7.8 kpc of the major axis, 1.2 kpc of the minor axis, and 43° of the position angle from the Galactic center–Sun axis based on López-Corredoira et al. (2007).
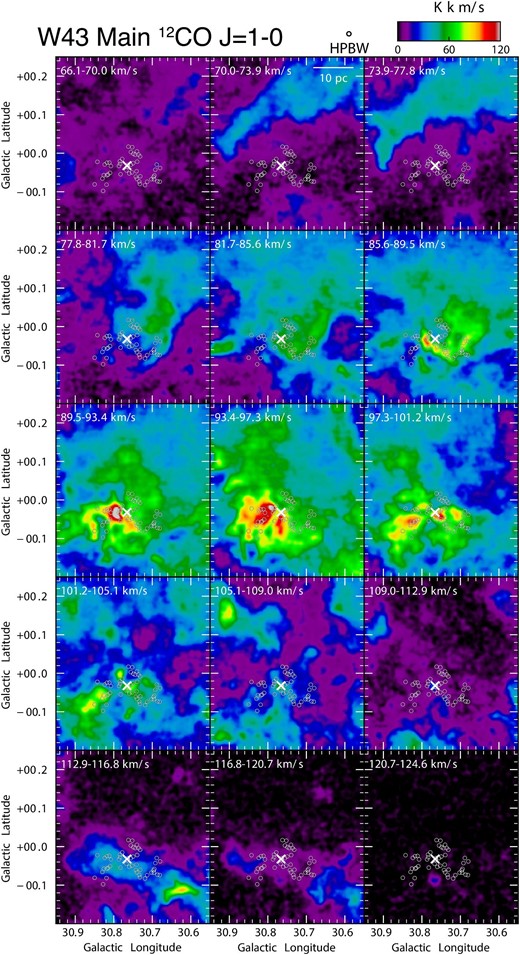
Velocity channel map of the 12CO J = 1–0 emission focused on W 43 Main with a velocity step of 3.9 km s−1. The white crosses indicate the W 43 Main cluster (Blum et al. 1999). The white circles present the 51 compact fragments (W 43 MM1–MM51) cataloged by Motte, Schilke, and Lis (2003). The final beam size after convolution is 40″.
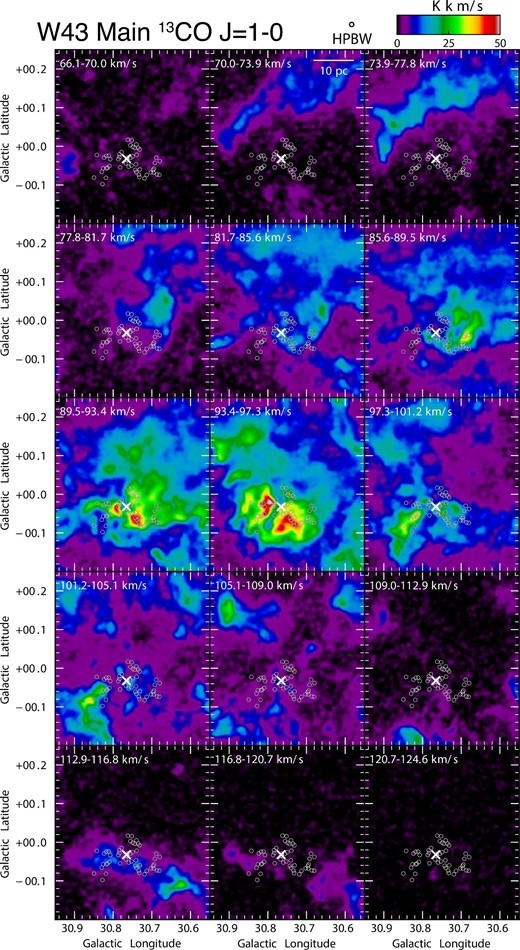
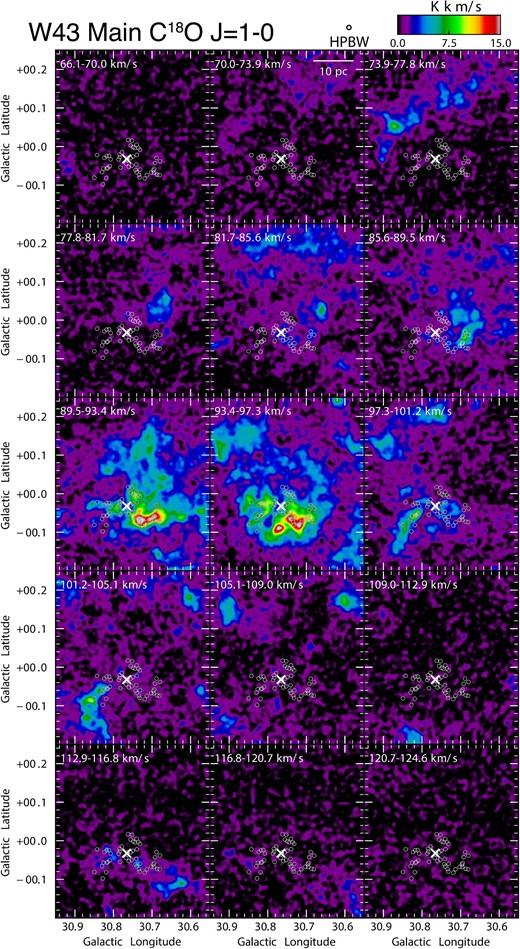
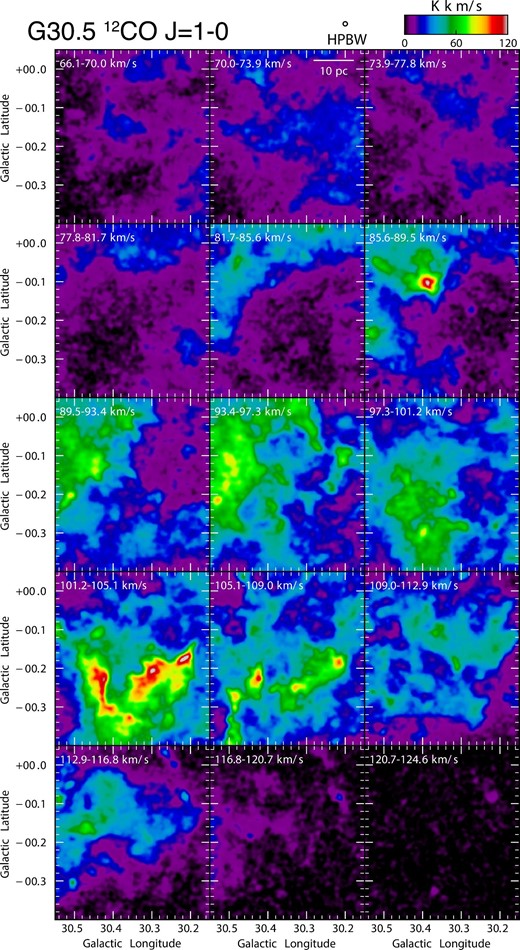
Velocity channel map of the 12CO J = 1–0 emission focused on G30.5 with a velocity step of 3.9 km s−1. The final beam sizes after convolution is 40″.
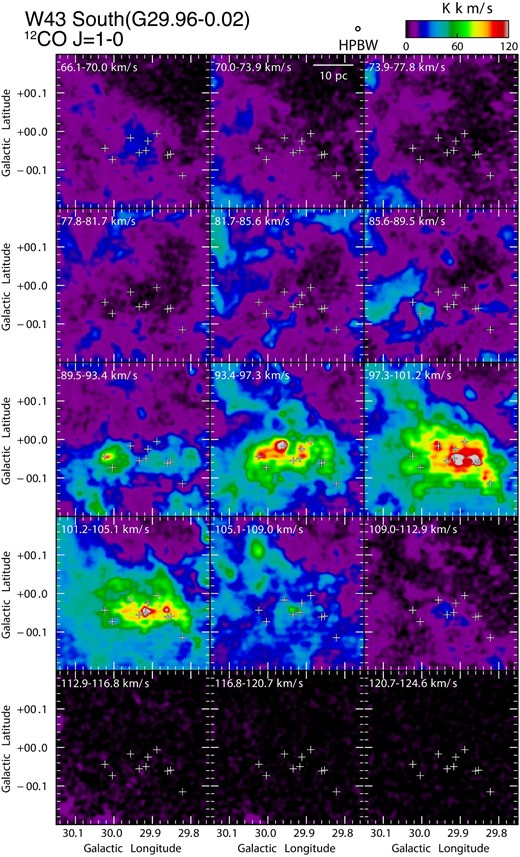
Velocity channel map of the 12CO J = 1–0 emission focused on W 43 South with a velocity step of 3.9 km s−1. The crosses indicate the radio continuum sources identified by the NVSS survey (Condon et al. 1998). The final beam size after convolution is 40″.
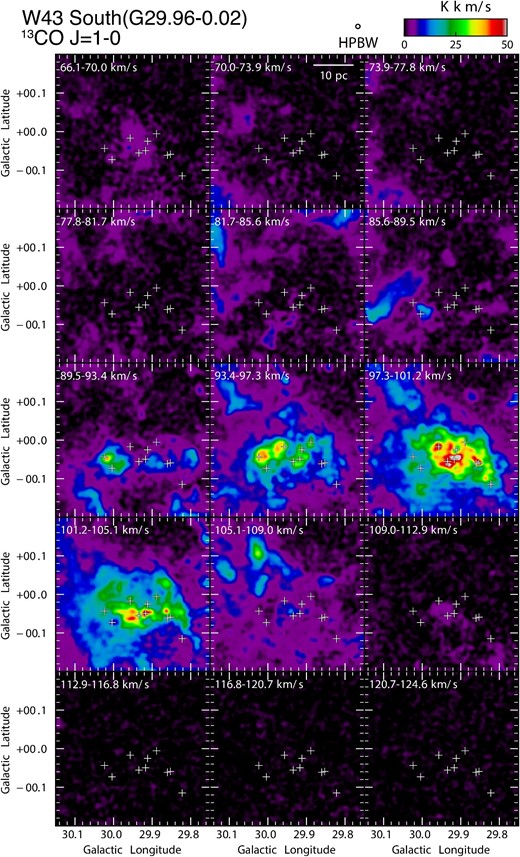
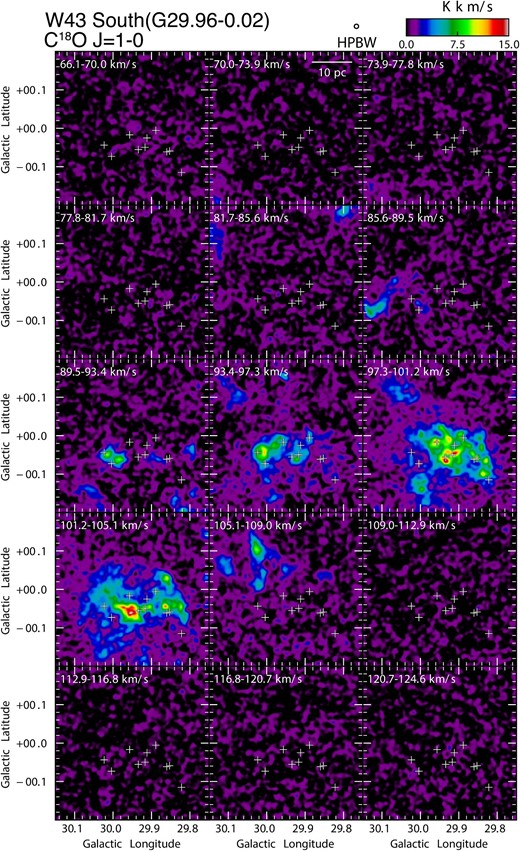
Figure 25b presents the Galactic-scale top-view of the W 43 GMC complex from the North Galactic Pole based on figure 11 of Sofue et al. (2019). The red arrows of figure 25 show the continuous converging flow along the spiral arm and the long bar in the Milky Way. This mechanism, proposed by previous studies, is a possible theory to explain the origin of cloud–cloud collisions in the W 43 GMC complex at the bar-end region (e.g., Nguyễn Lúóng et al. 2011; Motte et al. 2014; Renaud et al. 2015), and common with external barred spiral galaxies (e.g., M 83: Kenney & Lord 1991; NGC 3627: Beuther et al. 2017). We will describe them in a separate paper since it extends beyond the scope of this paper.
We propose that the cloud–cloud collision scenario in the GMC complex might be able to explain the origin of the CMF being shallower than IMF in W 43-MM1 (Motte et al. 2018a). Another super star cluster, NGC 3603, triggered by a cloud–cloud collision (Fukui et al. 2014), was reported to have a top-heavy stellar mass function (Harayama et al. 2008). The Galactic center 50 km s−1 cloud is also suggested to have a similar tendency (e.g., Tsuboi et al. 2015; Uehara et al. 2019). This suggestion is also supported by the MHD simulation (Fukui et al. 2021).
5.7 The frequency of cloud–cloud collisions in the W 43 GMC complex
6 Conclusions
The conclusions of this paper are summarized as follows.
We carried out new large-scale CO J = 1–0 observations of the W 43 GMC complex in the tangential direction of the Scutum Arm as a part of the FUGIN legacy survey. We revealed the spatial distribution of molecular gas and velocity structures.
The low-density gas traced by 12CO is distributed in a region of 150 pc × 100 pc (l × b), and has a large velocity dispersion (20–30 km s−1). The dense gas traced by C18O reveals three high-mass star-forming regions (W 43 Main, G30.5, and W 43 South), with clumpy structures.
We found 2–4 velocity components with velocity differences of ∼10–20 km s−1 in each region. At least two clouds are likely to be physically associated with high-mass star-forming regions from their common high-intensity ratios of |$R^{13}_{\rm 3-2/1-0}$| and their similar distribution to infrared nebulae.
We made brightness temperature histograms of W 43, W 51, and M 17 GMC, revealing the molecular gas properties of the W 43 GMC complex. We showed that localized dense gas has a high brightness temperature compared to that of the W 51 and M 17 GMCs.
“The current SFE” of the entire W 43 GMC has low value (|$\sim\!\! 4\%$|) compared to the W 51 and M 17 GMCs. On the other hand, the W 43 GMC complex has locally high density C18O gas from the brightness distribution function. Therefore, we suggest that the star formation activity in W 43 will possibly increase in the future.
The velocity separation of these clouds in W 43 Main, G30.5, and W 43 South is too large for each cloud to be gravitationally bound. We also find bridging features and a V-shaped structure on the position–velocity diagram. These features are a signpost of cloud–cloud collision, suggested by previous studies. Therefore, we propose that the supersonic cloud–cloud collision hypothesis can explain the origin of dense gas and the local mini-starburst in the W 43 GMC complex.
We argued that the converging gas flow from the Scutum Arm and the long bar causes the highly turbulent condition, which makes frequent cloud–cloud collisions in the W 43 GMC complex.
Acknowledgments
We are grateful to Professor Shu-ichiro Inutsuka of Nagoya University for a useful discussion. The authors are grateful to the referee for thoughtful comments on the paper. We would like to thank Dr. Tom J. L. C. Bakx of Nagoya University for English language editing. We are also grateful to Ms. Kisetsu Tsuge and Mr. Rin Yamada of Nagoya University for useful comments about figures and texts. The Nobeyama 45 m radio telescope is operated by Nobeyama Radio Observatory, a branch of the National Astronomical Observatory of Japan. Data analysis was carried out on the Multi-wavelength Data Analysis System operated by the Astronomy Data Center (ADC), National Astronomical Observatory of Japan. The work is financially supported by a Grant-in-Aid for Scientific Research (KAKENHI, Nos. 15K17607, 15H05694, 17H06740, 18K13580) from MEXT (the Ministry of Education, Culture, Sports, Science and Technology of Japan) and JSPS (Japan Society for the Promotion of Science).
This work is based on observations made with the Spitzer Space Telescope, which is operated by the Jet Propulsion Laboratory, California Institute of Technology under a contract with NASA. Support for this work was provided by NASA.
The James Clerk Maxwell Telescope is operated by the East Asian Observatory on behalf of The National Astronomical Observatory of Japan; Academia Sinica Institute of Astronomy and Astrophysics; the Korea Astronomy and Space Science Institute; Center for Astronomical Mega-Science (as well as the National Key R&D Program of China with No. 2017YFA0402700). Additional funding support is provided by the Science and Technology Facilities Council of the United Kingdom and participating universities in the United Kingdom and Canada.
We would like to thank Editage (www.editage.com) for English language editing.
Software: We utilized Astropy, a community-developed core Python package for astronomy (Astropy Collaboration 2013, 2018), NumPy (van Der Walt et al. 2011), Matplotlib (Hunter 2007), IPython (Peŕez & Grange 2007), and Montage6 software.
Appendix 1 Procedures of the physical parameters of the molecular clouds derived from the FUGIN data
In this section, we introduce the calculation method of the physical parameters of the molecular gas, assuming local thermal equilibrium (LTE) (e.g., Wilson et al. 2009; Mangum & Shirley 2015).
- The radiative transfer equation [Tmb]: The observed brightness temperature [Tmb(v)] at radial velocity [v] is given bywhere J(T), Tex, Tbg, and τ(v) are the Rayleigh–Jeans equivalent temperature, the excitation temperature, the background continuum emissions, and the optical depth, respectively. We adopted Tbg = 2.73 K, which corresponds to the cosmic microwave background emission.(A1)$$\begin{eqnarray} T_{\rm mb} (v) = \left[J(T_{\rm ex})- J(T_{\rm bg})\right]\{1- \exp [-\tau (v)]\}, \end{eqnarray}$$
- The excitation temperature [Tex]: If we assume that the peak temperature of 12CO J = 1–0 is optically thick (τ → ∞), the excitation temperature is given by(A2)$$\begin{eqnarray} T_{\rm ex} &=& 5.5 \bigg / \ln \left[1+ {5.5 \over T_{\rm mb}\left(^{12}\mbox{CO peak}\right)/\mbox{K} + 0.82 }\right]{\:[\mbox{K}]}.\\ \end{eqnarray}$$
- The optical depth [τ13(v)] and [τ18(v)]: If we assume the same excitation temperatures in 12CO, 13CO, and C18O, the optical depths are derived at each voxel from the 13CO and C18O brightness temperatures and the excitation temperature by using the following equations:(A3)$$\begin{eqnarray} &&\tau _{13} (v) =\\ && -\ln \left\lbrace 1-{T_{\rm mb}\left(^{13}\mbox{CO}\right) \over 5.3\:\mbox{K}} \left[ {1 \over \exp \left({\frac{5.3\:{\rm K}} {T_{\rm ex}}}\right)-1}-0.16 \right ] ^{-1} \right\rbrace,\\ \end{eqnarray}$$(A4)$$\begin{eqnarray} &&\tau _{18} (v) = \\ && -\ln \left\lbrace 1-{T_{\rm mb}\left(\mbox{C}^{18}\mbox{O}\right) \over 5.3\:\mbox{K}} \left [ {1 \over \exp \left({\frac{5.3\:{\rm K}} { T_{\rm ex}}}\right)-1}-0.17 \right ] ^{-1} \right\rbrace.\\ \end{eqnarray}$$
- The CO column density N(13CO) and N(C18O): The 13CO and C18O column densities are calculated by summing all velocity channels from the following equations:(A5)$$\begin{eqnarray} && N \left(^{13}\mbox{CO}\right) = 2.4 \times 10^{14}\\ &&\times \sum _v \frac{ {T_{{\rm ex}}/\mbox{K}\ \tau _{13} (v)\ \Delta v \left(^{13}\mbox{CO}\right) /\mbox{km}\:\mbox{s}^{-1}}} {1-\exp \left(-{\frac{5.3\:{\rm K}} {T_{\rm ex}} } \right)} {\: [\mbox{cm}^{-2}]}{,} \end{eqnarray}$$where Δv (13CO) and Δv (C18O) are adopted as the velocity channel resolution of 0.65 km s−1.(A6)$$\begin{eqnarray} && N \left(\mbox{C}^{18}\mbox{O}\right) = 2.5 \times 10^{14} \\ &&\times \sum _v \frac{{T_{{\rm ex}}/\mbox{K}\ \tau _{18} (v)\ \Delta v \left(\mbox{C}^{18}\mbox{O}\right)/\mbox{km}\:\mbox{s}^{-1}}}{1-\exp \left(-{\frac{5.3\:{\rm K}} {T_{\rm ex}} } \right)} {\:[\mbox{cm}^{-2}]}{,} \end{eqnarray}$$
- The H2 column density: The H2 column density is calculated using the following methods, using an X-factor [X(12CO)] and abundance ratios of the isotopes:(A7)$$\begin{eqnarray} N^{12}_{\rm X} (\mbox{H}_2) &= X({^{12}\mbox{CO}}) \times W({^{12}\mbox{CO}}), \end{eqnarray}$$(A8)$$\begin{eqnarray} N^{13}_{\rm LTE} (\mbox{H}_2) &= X[^{13}\mbox{CO}] \times N (^{13}\mbox{CO}), \end{eqnarray}$$We adopted an X-factor of 2.0 × 10²⁰ [(K km s−1)−1 cm−2] with a |$\pm 30\%$| uncertainty (Bolatto et al. 2013). When we converted to the H2 column densities from the 13CO and C18O emission, we utilized the conversion factor of X[13CO] = 7.7 × 10⁵ and X[C18O] = 5.6 × 10⁶. These factors are derived from the isotope abundance ratio of [12C]/[13C] = 77, [16O]/[18O] = 560 (Wilson & Rood 1994), and the CO and H2 abundance ratio of [12CO]/[H2] = 10−4 (e.g., Frerking et al. 1982; Pineda et al. 2010).(A9)$$\begin{eqnarray} N^{18}_{\rm LTE} (\mbox{H}_2) &= X\left[\mbox{C}^{18}\mbox{O}\right] \times N (\mbox{C}^{18}\mbox{O}). \end{eqnarray}$$
- Total molecular mass: The total molecular mass is given by(A10)$$\begin{eqnarray} M = \mu _{\rm H_2} m_{\rm H} D^2 \sum _i {\Omega} N_i \left(\mbox{H}_2\right), \end{eqnarray}$$
where |$\mu _{\rm H_2} \sim 2.8$| is mean molecular weight per hydrogen molecule including the contribution of helium (e.g., appendix A.1. of Kauffmann et al. 2008), mH = 1.67 × 10⁻²⁴ g is the proton mass, D is the distance to each GMC, and Ω is the solid angle of pixel i.
Appendix 2 CO velocity channel maps of W 43 Main, G30.5, and W 43 South with FUGIN
We show the velocity channel maps of the 12CO, 13CO, C18O J = 1–0 emissions toward W 43 Main, G30.5, and W 43 South, respectively. The velocity range is between 66.1 and 124.6 km s−1.


