


Abstract
There are about a dozen symbiotic stars known to produce high-velocity jets during outbursts. MWC 560 (V694 Mon) is a symbiotic star that seems to show a permanent jet. After showing an unexpected brightening in 2018 November, it has continued to brighten until 2021 and is currently in the brightest state ever. We have been conducting long-term high-dispersion spectroscopic monitoring of this object since 2016 March. An emission wing with vFWHM ≈ 700 km s−1 in the hydrogen Balmer line at an unexpected brightening event in 2018 was reported by Ando et al. (2021, PASJ, 73, L1). In subsequent continuous observations, this emission wing was no longer seen on 2019 February 6. The absorption lines seen in the hydrogen Balmer lines are gradually deepening and spreading to the slower side of the velocity, and the outflow velocity is becoming slower. The expanding component generated by the outburst was initially observed in the emission wing just after the 2018 outburst, got gradually cooler, and was observed in the absorption line after 2019.
1 Introduction
Symbiotic stars show irregular variability, and most of the variations show magnitude 2 or 3 amplitude. They are classified as symbiotic novae and classical symbiotic stars based on their activities (Mikolajewska 2011). A symbiotic nova is a nova caused by a thermonuclear runaway reaction of a symbiotic binary star. Various models have also been proposed for the outburst of classical symbiotic stars, and Tomov, Stoyanov, and Zamanov (2016) summarized them as follows: (i) a steady-state burning model in which matter rapidly accretes through a nuclear burning shell (Iben 1982), (ii) thermal pulse or hydrogen shell flash (Kenyon & Truran 1983), (iii) a change in mass transfer and/or instability of accretion disks such as dwarf novae (Mikolajewska et al. 2002), and (iv) a “combination nova” model combining disk instability with increased thermonuclear shell burning on the surface of the accreting white dwarf (Sokoloski et al. 2006).
MWC 560 is a unique symbiotic star discovered by Merrill and Burwell (1943). This object attracted much attention in the beginning of 1990 when it caused the largest outburst ever observed. It was observed at magnitude V = 9.65 on 1990 February 24 and brightened to V = 9.21 on April 2, during this brightening period (Tomov et al. 1990a, 1990b). An outflow of up to −6000 km s−1 was observed in the hydrogen (Hβ) Balmer line. A few months after the peak of the outburst in 1990, a very slow outflow of −130 to −320 km s−1 was observed, followed by an outflow of −1580 to −2140 km s−1 (e.g., Kondratyeva & Rspaev 2012).
Fast jets have been observed in about a dozen objects out of about 200 symbiotic stars (Tomov et al. 2017). The jets can be seen intermittently only during outbursts in some objects, or they seem to be permanent. MWC 560 was considered to be the latter (Tomov & Kolev 1997).
Many observers and professional astronomers have made photometric observations of this object. Doroshenko, Goranskij, and Efimov (1993) found periods of 1930, 4570, and 11410 days, and for these periods of orbital motion, precession of the accretion disk, pulsation of M-type giants, and periodic explosions were considered. Kurochkin (1993) proposed that the accretion rate and disk brightness increase at the pericenter point for short periods of M-type giants with an elliptical orbit when the hot star is moving in an elliptical orbit. Munari et al. (2016) proposed that this object had two fundamental periods (1860 and 331 days), including an orbital period. According to these, the next brightening after 2016 February was expected to be in 2021 March, but a brightening was observed in 2018 December (Goranskij et al. 2018).
We have been conducting long-term monitoring observations since 2018 December 25, which showed an unpredicted brightening of MWC 560. The vFWHM ≈ 700 km s−1 wing component was detected in the hydrogen (Hα) Balmer line, which was not seen in past monitoring observations during the irregular outburst in 2018 (Ando et al. 2021). Since then, it has continued to brighten, and our continuous observations show that the features seen in the Hα line of hydrogen change significantly from season to season. In this study, we summarize the characteristics of the spectra found in each season.
2 Observation and data analysis
2.1 Low-resolution spectroscopic observations
Optical spectra were obtained on 2019 December 27 and 2020 December 12 using the 101 cm telescope at the Ibara Bisei Observatory, Okayama, Japan. The telescope is equipped with a spectrograph and a CCD camera (ANDOR DU-440BV). The resolution is R = 1500, and the wavelength range covers 3800–8200 Å. The exposure time for 2019 December 27 is 180 s and that for 2020 December 12 is 240 s. IRAF and Bespec were used for analyzing the data.
2.2 High-resolution spectroscopic observations
We obtained 19 optical spectra by using HIDES (HIgh Dispersion Echelle Spectrograph; Izumiura 1999) with a fiber feeding system (Kambe et al. 2013) on the 188 cm telescope at the Okayama branch that of the Subaru Telescope of the National Astronomical Observatory of Japan (NAOJ). HIDES is a cross-dispersed echelle spectrometer currently with a mosaic of three 2 k × 4 k CCDs at its focal plane, which enables us to observe simultaneously the wavelength range of 3800–7600 Å, and provides a spectral resolution of R = 50000 for the combination of a 100 μm core fiber and an image slicer for it. Each exposure time was 300 s. The wavelength calibration for each echelle spectrum was done using a Thorium–Argon lamp before and after the science spectrum. The data reduction was performed using the IRAF package. The HIDES observation log is shown in table 1.
Observation log.
| Observation season | Number of observations | |
|---|---|---|
| 1 | 2018/12/25–2019/2/6 | 6 nights |
| 2 | 2019/12/9–2020/4/29 | 5 nights |
| 3 | 2020/9/14–2021/5/1 | 8 nights |
| Observation season | Number of observations | |
|---|---|---|
| 1 | 2018/12/25–2019/2/6 | 6 nights |
| 2 | 2019/12/9–2020/4/29 | 5 nights |
| 3 | 2020/9/14–2021/5/1 | 8 nights |
3 Results
3.1 Light curves from 2010 to 2021
Figure 1 shows the results of photometric observations obtained by the KWS (Kamogata–Kiso–Kyoto Wide-Field Survey), where the shaded areas indicate our HIDES observation seasons 1 to 3.
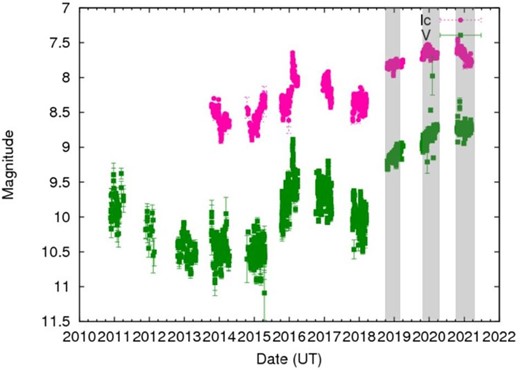
Light curve of MWC 560 from 2010 January 1 to 2021 May 16 reported to the KWS. (Color online)
The photometric observations by KWS show a gradual brightening from V = 9.20 to 8.99 mag from 2018 September to 2019 April (season 1) and a brightening from V = 9.02 to 8.70 mag from 2019 September to 2020 April (season 2). MWC 560 become the brightest during the period from 2020 September to 2021 April (season 3), and it remained almost constant at V = 8.74–8.75 during that season.
The light curves are slightly different between V and Ic bands. They shows a gradual brightening from Ic = 7.87 to 7.84 in season 1, the maximum brightness of Ic = 7.65 in season 2, and a gradual dimming from Ic = 7.65 to 7.77 in season 3.
In the history of MWC 560 observations, its V magnitude is the brightest in season 3, and its Ic magnitude might be the brightest between the end of season 2 and the beginning of season 3.
3.2 The entire visible spectrum of MWC 560
Figure 2 shows the spectra obtained from low-dispersion spectroscopic observations at Bisei Observatory on 2019 December 27 and 2020 December 12. The continuity of the spectra is normalized to unity. The obtained spectra show Balmer lines for hydrogen (Hα, Hβ, Hγ), emission lines at Fe ii (5018, 5169, 5198, 5235, 5317, 5363 Å), NaD, He ii (7178 Å), and 6830 Å.
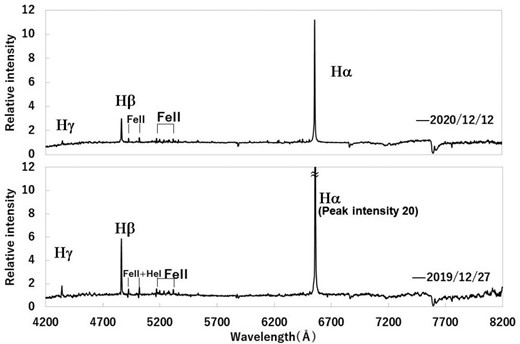
Spectra obtained from observations at Bisei Observatory on 2019 December 27 and 2020 December 12.
Figure 3 shows a close-up view of the area around Hβ (4200–5800 Å), where emission lines and absorption lines of Fe ii and He i are seen in the 2019 spectrum (lower panel) and only emission lines of Fe ii and He i are seen in the 2020 spectrum (upper panel). This feature is similar feature to the spectra reported in Goranskij et al. (2018) for 2017 November 26 and 2018 November 16: only the emission lines were seen on 2017 November 26, and the emission lines and absorption lines were seen on 2018 November 16.
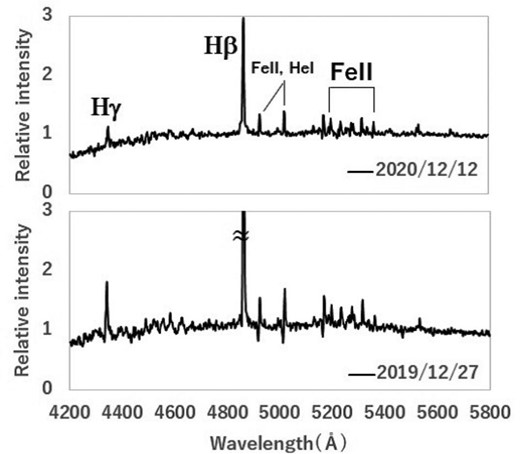
Enlarged views of spectra of figure 2 around 4200–5800 Å.
3.3 Optical high-resolution spectra for the Hα line
In this subsection, we show the results of high-resolution spectroscopic observations. Since the spectra vary greatly depending on the observation season, we will summarize them by season.
3.3.1 Season 1: 2018 December 25–2019 February 6
Ando et al. (2021) summarized the spectral changes during the irregular brightening (season 1), and reported a wing (vFWHM ≈ 700 km s−1 in the Hα emission line) that was not seen before 2018. Figure 4 shows an enlarged view of the Hα emission line on 2019 February 6. The velocity of the emission line peak was adjusted to 0 km s−1. Three components seem to remain in the Hα emission: a bright main component, a blue absorption component, and a weak high-velocity component. The weak high-velocity component is fitted to a Gaussian curve of vFWHM ≈ 700 km s−1 in figure 4. The wing was still seen on 2019 February 6 at the end of season 1.
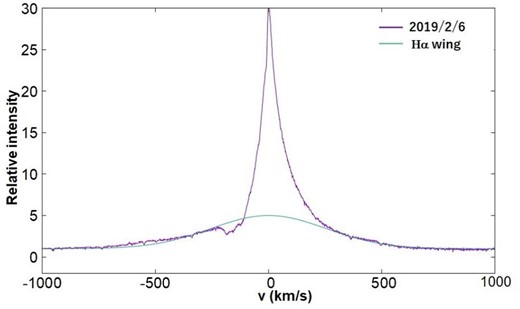
Enlarged view of the Hα emission line on 2019 February 6 obtained by high dispersion spectroscopy (purple line). The horizontal axis is velocity. The vertical axis is relative intensity. The green line is the Gaussian fitting of the Hα line, the new outflow component (wing) identified since 2018 November, with a velocity of about vFWHM ≈ 700 km s−1. (Color online)
3.3.2 Season 2: 2019 December 9–2020 April 29
In season 2, the shape of the absorption line gradually changed with time (figure 5). The absorption line slowed down slightly around the Hα emission peak, and the absorption line became shallower and wider. The velocities of the absorption peaks changed from −230 to −220 km s−1. Figure 6 shows that the wing component seen in season 1 was no longer seen in the spectrum.
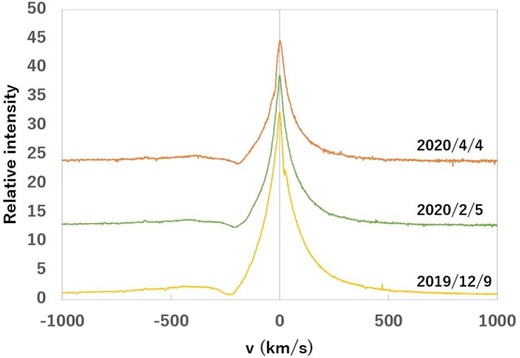
Spectra of MWC 560 from 2019 December 9 to 2020 April 4. The time series is from bottom to top and the y-axis is offset to make the figure easier to read. (Color online)

3.3.3 Season 3: 2020 December 1–2021 February 18
In season 3, a significant change appeared in the absorption lines. As shown in figure 7, the absorption lines became deeper and wider, and the width of the emission lines narrowed.
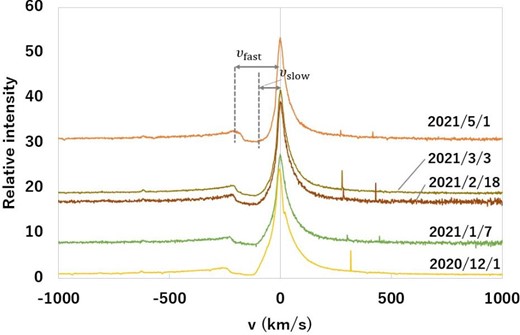
Part of the spectrum from 2020 December 1 to 2021 May 1, when the wing is no longer visible. The spectra were offset according to the number of days elapsed. Bat-pixels are seen between 300 and 500 km s−1. The determination of the fast and slow outflow velocities shown for the spectrum of 2021 May 1 is described in the section 4. (Color online)
4 Discussion
MWC 560 continued to brighten from the irregular rebrightening in 2018 to 2021 May. The spectrum of Hα shows a disappearance of the emission wing and a change in the shape of the absorption lines. In this section, we discuss the implications of this spectral change.
In MWC 560, emission lines and absorption lines are seen simultaneously in the Hα line. The velocity difference between the emission and absorption peaks was used as the outflow velocity (e.g., Tomov et al. 1992). In season 3, the absorption peaks became wider. Then we define two kinds of outflow velocities: vfast and vslow. The fast outflow velocity, vfast, is the velocity difference between the emission peak and the absorption rim (the second emission peak). The slow outflow velocity, vslow, is the velocity difference between the emission peak and the absorption rim, which is just connected to the emission peak and is often the same as the absorption peak. The outflow velocities were vfast ≈ −230 km s−1 and vslow ≈ −100 km s−1 on 2021 May 1, as shown in figure 7.
Figure 8 shows the outflow velocity of vslow from 2018 December to 2021 May. The outflow velocity decreases continuously from season to season, and we performed a linear fitting. If we extrapolate the outflow velocity before season 1, we can expect the outflow velocity to be about −300 km s−1 on 2018 December. This corresponds to the half velocity of the emission wing seen after 2018 December 25.

Outflow velocity from 2018 December 25 to 2021 May. (Color online)
The weak absorption components shown in season 1 would be different from deep and wide absorption components in seasons 2–3. This suggests that small-scale outbursts (classical symbiotic novae) have been occurring repeatedly since the 2016 brightening. The emission wing caused by the 2018 outburst might have cooled gradually and become a new absorption component in season 2. The absorption component would then have continued to grow in season 3, resulting in the broad absorption component seen in 2021.
The spectra in this study are very different from spectra seen in the 1990s (e.g., Tomov et al. 1990a, 1990b; Tomov & Kolev 1997; Iijima 2001, 2002) in the following ways: (a) the emission lines and absorption lines are not detached, (b) the outflow velocity is very low, (c) the change of outflow velocity is continuous, and (d) the emission line component shows asymmetry, but the red wing is stronger than the blue wing throughout the season. On the other hand, we detected a temporal change of emission wing that would be the variable secondary emission components pointed out by Iijima (2001). Our spectra are generally similar to the 2012–2015 quiescence spectra (Lucy et al. 2020) but differ in that the outflow velocities are very low around/after the 2018 brightening, and it remains bright. MWC 560 continues to brighten since its unexpected brightening in 2018. It is still necessary to pay attention to this object in the future.
Acknowledgements
The authors are indebted to all the staff of NAOJ for their continuous support during the observations. This work was supported by Grants-in-Aid of the Ministry of Education, Culture, Sports, Science and Technology 16H02169. We acknowledge with thanks the photometric observations by the Kamogata–Kiso–Kyoto Wide-Field Survey (KWS). We would like to acknowledge all the staff who supported us during our spectroscopic observations at Bisei Observatory. We would like to acknowledge Mr. Hidehiko Akazawa for his help throughout the long-term monitoring observation. We also thank the referee for improving the manuscript.
