


Abstract
Lunar swirls are albedo features associated with magnetic anomalies, and their formation mechanism has long been debated. Because spectral properties of lunar swirls provide information on space weathering environments and surface compositions, differences in the spectra between swirls and background regions can give a clue to their formation. We analyze space weathering for swirls in the lunar highlands and maria using the VIS-NIR spectral slope, 1550 nm reflectance, and 950 nm band depth. We find that highland swirls show lower reddening-to-darkening ratios than off-swirl regions, implying more decreases of nanophase iron relative to microphase iron on swirls. We also use magnetic field data to investigate the influence of the crustal magnetic field on the space weathering of a few selected swirls. The Reiner Gamma swirl becomes more immature as the magnetic field strength increases, although the entire swirl has a high albedo. Especially, the Reiner Gamma tail shows that the stronger magnetic field makes the surface undergo less spectral reddening. Our results support the solar wind stand-off hypothesis, which is that the solar wind deflected by the crustal field determines the optical property of the surface.
1 Introduction
Lunar swirls—bright albedo features without geologic variations—are more immature than their surroundings. It is important to study the space weathering of the swirls because their immature surface would be helpful in speculating about their formation mechanism and the maturation process of the lunar surface. The distribution of the swirls is mostly related to the magnetic anomalies. It is suggested that the distinct surface of the swirls from that of off-swirl regions is caused by the local magnetic field.
Lunar surface exposed to the space environment undergoes physical and chemical weathering processes. The space weathering is mostly related to micrometeorite impacts and solar wind. For micrometeorite impacts, many researchers have reported iron particles generated by nanosecond-pulse lasers simulating the impacts and shown changes of space weathering trends (Sasaki et al. 2001; Brunetto et al. 2006). For solar wind, laboratory experiments irradiating silicate powders and rocks to simulate the solar wind sputtering have demonstrated the space weathering mechanism of the solar wind (Hapke 1973; Dukes et al. 1999; Loeffler et al. 2009). According to these experiments, the thin amorphous coating rims on the regolith grains produced by solar wind and micrometeorite impacts contain small metallic iron particles, referred to as nanophase iron (npFe0). In the past decades, a number of studies have confirmed that the npFe0 causes spectral changes on regolith grains in visible–near-infrared (VIS-NIR) wavelength ranges: reddening, darkening, and reduced absorption features. Lucey and Noble (2008) employed a radiative transfer model with Rayleigh scattering to match spectra measured by Noble, Pieters and Keller (2007), who reported spectral variation according to the size of the metallic iron particles. However, some powders with large iron particles showed discordance between the model and the experimental measurements (Lucey & Noble 2008).
The optical effect of larger iron particles, referred to as microphase iron (mpFe0), was reproduced by Lucey and Riner (2011) with Mie scattering. Their model corresponds with mpFe0 measurements of Noble, Pieters and Keller (2007) that are inconsistent with Lucey and Noble (2008) using a Rayleigh scattering model. It has been proposed that the mpFe0 is created by multiple micrometeorite impacts that make the npFe0 of thin rims re-melt and coagulate together to grow larger during the regolith agglutination (Sasaki et al. 2001; Basu 2005). Accordingly, the mpFe0 is distributed in agglutinates formed by micrometeorite bombardment, unlike npFe0 that is formed in the amorphous rim through the influence of both solar wind and micrometeorites (Keller & Clemett 2001). The relative abundance of the npFe0 on the amorphous rims and the mpFe0 in the agglutinates influences the spectral trends of lunar regolith, including reddening and darkening patterns at VIS-NIR (Trang & Lucey 2019). Investigation of these spectral trends on swirls could provide information on the size of the metallic iron particles within the regolith grains of the swirls.
Based on the solar wind standoff mechanism (Hood & Schubert 1980), which is one of the swirl formation models, the space weathering environment of the swirls is different from that of the off-swirl regions because solar wind is shielded by magnetic anomalies. The differences of spectral properties in wavelengths from ultraviolet (UV) to IR measured with various instruments have been reported alongside speculations regarding their origin (Blewett et al. 2011; Garrick-Bethell et al. 2011; Kramer et al. 2011; Pieters et al. 2014; Glotch et al. 2015; Denevi et al. 2016; Hendrix et al. 2016). Hemingway, Garrick-Bethell, and Kreslavsky (2015) compared spectral trends of mare swirls with latitudinal variation on mare regions because the solar wind flux is reduced as latitude increases. Their results implied that the weathering states of the swirls are derived from the reduced solar wind flux due to the local magnetic field. The magnetic shielding on swirls was also supported by the depletion of water implanted near the surface from the solar wind (Li & Garrick-Bethell 2019).
However, it is challenging to explain the swirl formation mechanism fully by analyzing spectral properties because both space weathering and mineral composition can alter spectral properties. Garrick-Bethell, Head, and Pieters (2011) suggested that spectral trends of the swirls are due to mixtures of mare soils and feldspathic dust. On the other hand, Denevi et al. (2016) showed that some swirls covered by the ejecta of Eratosthenian and Copernican craters preserve the freshness of ejecta, supporting the solar wind standoff model. Also, Trang and Lucey (2019) proposed that swirls and the lunar nearside that are shielded by the local magnetic field and the Earth’s magnetosphere, respectively, show lower npFe0 to mpFe0 ratios by applying the radiative transfer model to the Kaguya Multiband Imager (MI) data. Chrbolková, Kohout, and Ďurech (2019) suggested that mature soils in swirls are different from both mature and fresh soils outside, supporting the solar wind standoff model. They also showed the dichotomy in spectra of swirls in maria and highlands or nearside and farside. In this study, we examine space weathering characteristics of the swirls using spectral slope (reddening), albedo (darkening), and ferrous band depth in order to speculate upon the inherent weathering environments of the swirls and their formation mechanism. Section 2 describes information on the data, studied areas, and analysis methods used in this study. In section 3, we provide distinguishable weathering trends of the swirls from surrounding regions and present weathering trends confined to the swirls according to magnetic field strength. In section 4, we interpret our results with previous research and discuss the swirl formation mechanism.
2 Data and methods
2.1 Swirls and space weathering parameters
We investigated swirls on the lunar surface. In highlands, groups of swirls near the King crater (KC swirl group; figure 1) and the Giordano Bruno crater (GBC swirl group; figures 2a and 2b), the Gerasimovich swirl (figures 2c and 2d), the Airy swirl (figures 2e and 2f), diffused swirls outside Mare Marginis (OMM swirl group; figures 2g and 2h), the Dufay X swirl (figures 2i and 2j), and two diffused swirl regions within the South Pole–Aitken (SPA) basin (SPA1 and SPA2 swirl groups, figure 3) were used. In the maria, we chose the Reiner Gamma swirl only. We note that other mare swirls might have been contaminated by feldspathic ejecta from not only nearby highland craters but also mare craters large enough to excavate highland materials under the mare layers.
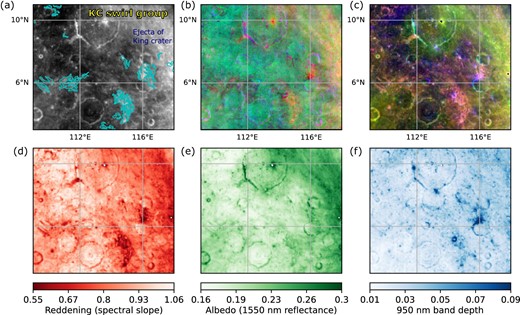
Images of KC swirl group. King crater is outside of the panel boundary. (a) 750 nm reflectance with contour of swirls (cyan lines) provided by Denevi et al. (2016). (b) UV color map constructed following Denevi et al. (2016) (red: 415 nm, green: 321 nm/415 nm, blue: 321 nm/360 nm). (c) VIS-NIR color map in this study indicating space weathering trend comprising (d)–(f). (d) Spectral slope representing reddening (reversed). (e) 1550 nm reflectance as albedo. (f) 950 nm band depth. The ranges of these contrast-stretched images are from 0.5th to 99.5th percentiles. (Color online)
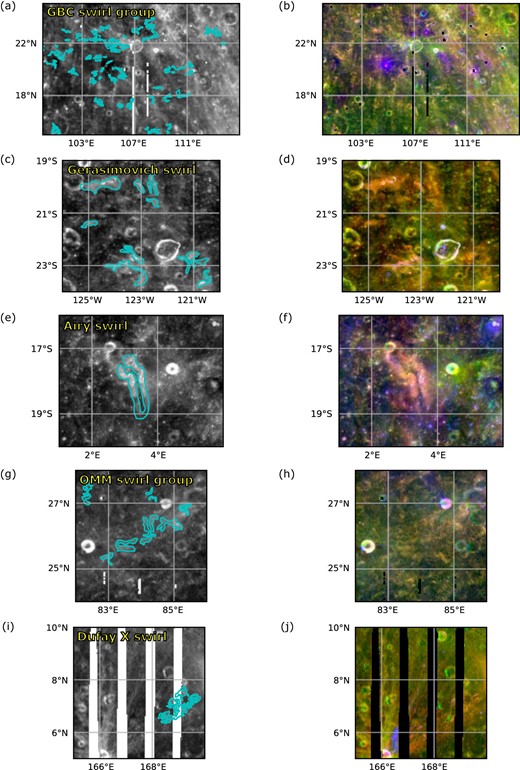
750 nm reflectance with contour of swirls provided by Denevi et al. (2016) (left-hand column) and color maps (right-hand column) of highland swirls within the Feldspathic Highlands Terrane (FHT). (a), (b) GBC swirl group; (c), (d) Gerasimovich swirl; (e), (f) Airy swirl; (g), (h) OMM swirl group; (i), (j) Dufay X. The RGB color composite consists of reddening (reversed-red), albedo (green), and 950 nm band depth (blue). Each image has its own color scale. The ranges of the contrast-stretched images are from 0.5th to 99.5th percentiles. (Color online)
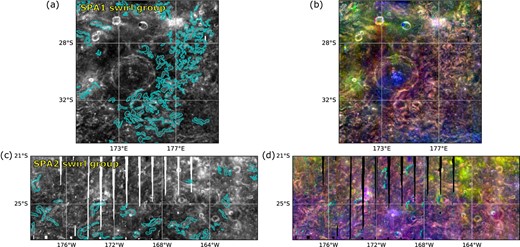
Same as figure 2 but for highland swirls within the South Pole–Aitken Terrane (SPAT). (a), (b) SPA1 swirl group; (c), (d) SPA2 swirl group. (Color online)
In order to examine the space weathering properties of swirls, we used three space weathering parameters listed in table 1: (1) Reddening (spectral slope), (2) Albedo (1550 nm reflectance), and (3) 950 nm band depth. We measured the spectral slope between 750 nm and 1550 nm reflectances (normalized at 750 nm) for the continuum levels with no absorption features to represent the degree of spectral reddening (Le Mouélic et al. 2000). The albedo parameter chosen to estimate the degree of darkening was the reflectance at 1550 nm because short wavelengths are affected through absorption by npFe0. The 950 nm band depth was measured from the interpolated reflectance at 950 nm using 750 nm and 1550 nm reflectances (Fischer & Pieters 1994; Sim et al. 2017). When the highland region was analyzed, the mare surface was excluded using the vector map of lunar maria distribution (Nelson et al. 2014). With swirl distribution provided by Denevi et al. (2016), we compared the properties of the swirl and off-swirl regions using the three parameters listed in table 1. We note that analyzed pixels also contain craters in each studied areas.
Space weathering parameters.
| Parameter | Formulation | Color code |
|---|---|---|
| Reddening* | |$\displaystyle {\frac{R_{1550}-R_{750}}{1550-750} \times \frac{1}{R_{750}}}$| | Red (reversed) |
| Albedo† | R1550 | Green |
| 950 nm band depth‡ | |$1.0 - {\frac{R_{950}}{R_{i,950}}}$| | Blue |
| Parameter | Formulation | Color code |
|---|---|---|
| Reddening* | |$\displaystyle {\frac{R_{1550}-R_{750}}{1550-750} \times \frac{1}{R_{750}}}$| | Red (reversed) |
| Albedo† | R1550 | Green |
| 950 nm band depth‡ | |$1.0 - {\frac{R_{950}}{R_{i,950}}}$| | Blue |
Spectral slope between 750 nm and 1550 nm reflectance (Le Mouélic et al. 2000).
Kaguya MI reflectance at 1550 nm.
2.2 Multi-band images
This study used the data of the Kaguya MI, a high-resolution multi-band imaging camera consisting of a visible sensor with five bands (415, 750, 900, 950, and 1001 nm) and an infrared sensor with another four bands (1000, 1050, 1250, and 1550 nm) (Ohtake et al. 2008). We used the MAP level data that were geometrically and topographically corrected to investigate the swirls on the lunar surface, mitigating the shading effects. We down-sampled the original ∼15 m pixel−1 (2048 pixels-per-degree) data to ∼150 m pixel−1 using bilinear interpolation to reduce the computing time.
For the swirls near the King crater, we reproduced the image of Denevi et al. (2016) from the Lunar Reconnaissance Orbiter Camera (LROC) Wide Angle Camera (WAC) data to know the surface conditions in more detail. The LROC-WAC instrument consists of two ultraviolet (321 and 360 nm) and five visible (415, 565, 605, 645, and 690 nm) filters with a resolution of 384 m pixel−1 and 75 m pixel−1, respectively (Robinson et al. 2010). We used ∼475 m pixel−1 LROC-WAC empirically normalized mosaic (EMP) data that was photometrically corrected (Boyd et al. 2012). In the same way as Denevi et al. (2016), UV spectral properties were synthesized into RGB, comprising 415 nm reflectance (red), a 321 nm/415 nm reflectance ratio (green), and a 321 nm/360 nm reflectance ratio (blue) (figure 1b). In the UV RGB map of the highlands, the exposed crystalline plagioclase appears yellow due to high values of the 415 nm reflectance and the 321 nm/415 nm reflectance ratio, and the mature soils appear green. The agglutinatic glass could also make low, 321 nm/415 nm reflectance ratios (Denevi et al. 2014, 2016).
2.3 Magnetic field data
We used not only spectral data but also magnetic field data to investigate whether space weathering states are correlated with magnetic field strengths. The magnetic field data with a spatial resolution of |${0{^{\circ}_{.}}2}$|, corresponding to ∼7 km pixel−1, are from the surface vector mapping (SVM) model based on Lunar Prospector and Kaguya observations (Tsunakawa et al. 2015). In each studied area we separated the field strength in the swirl into maximum, intermediate, and minimum strengths using the average magnetic field strength (Bavg). The maximum strength region is higher than Bavg + 3 standard deviations (3σ) of the average. The intermediate strength region is in the range between Bavg + 1σ and Bavg + 3σ. The magnetic strength of the minimum region is lower than Bavg + 1σ. The range values of the magnetic field strength at each studied area are described in table 2.
Criteria of surface magnetic field strength.*
| Swirl regions | Strong (nT) | Intermediate (nT) | Weak (nT) |
|---|---|---|---|
| Reiner Gamma swirl | >208.94 | 91.67–208.94 | <91.67 |
| Gerasimovich swirl | >469.49 | 260.10–469.49 | <260.10 |
| GBC swirl group | >45.14 | 25.71–45.14 | <25.71 |
| KC swirl group | >87.25 | 43.21–87.25 | <43.21 |
The surface magnetic field strength is from the SVM model (Tsunakawa et al. 2015).
The spatial resolution of the magnetic field data is considerably lower than that of the Kaguya MI data. In addition, the surface magnetic field estimated from the SVM model was derived from the observed altitudes, and the orbiters could not detect fine structures of the surface magnetic field. The magnetic field strengths could be underestimated (Halekas et al. 2010; Hemingway & Tikoo 2018). Some portions of the Reiner Gamma swirl could also have a stronger magnetic field than expected from the SVM model (Deca et al. 2018). As we used the data just to divide the swirls into three magnetic strength groups, these limitations have little effect on our study.
3 Results
We investigated eight highland swirl areas and the Reiner Gamma swirl, one representative mare swirl far from the highland. Qualitative and quantitative analyses on the weathering properties of these swirls are discussed in subsection 3.1. To evaluate the influence of magnetic anomalies on the weathered states, we examine changes of the spectral properties according to magnetic field strength, confining the region of interest to be inside the swirls, in subsection 3.2.
3.1 Space weathering properties: differences between swirls and surrounding regions
Figure 1 shows the spectral characteristics of the KC swirl group: diffused swirls near the Copernican-aged King crater at |${5{^{\circ}_{.}}0}$|N, |${120{^{\circ}_{.}}5}$|E. Swirls are widely distributed over this highland region, and some of them overlap the fresh ejecta deposits of the King crater. In the UV RGB map (figure 1b), ejecta materials and swirls near the ejecta resemble each other. Regions that show a yellowish color may be covered by fresh crystalline plagioclase (Denevi et al. 2014). The 415 nm reflectance and 321 nm/415 nm reflectance ratio of swirls become lower as the distance from the ejecta increases (Denevi et al. 2016). This means that some swirls near the ejecta were refreshed by being covered with the excavated fresh materials when the King crater was formed. Figure 1 c is an RGB map synthesized with reddening, albedo, and 950 nm band depth in this study. Unlike the UV RGB map of figure 1b, our RGB map shows that most of the swirls are reddish compared to the yellowish ejecta deposits. The color properties of the swirl group are similar regardless of distance from the ejecta deposits (figure 1c). Because the swirls maintain low reddening values relative to the decreasing degree of albedo, they are more reddish than the backgrounds and the ejecta deposits. This implies that the reddening process is more impeded than the darkening process on swirls compared to the fresh ejecta, even on the swirls refreshed by ejecta of the Copernican crater.
We also examined other highland regions including the GBC swirl group, the Gerasimovich swirl, the Airy swirl, the OMM swirl group, the Dufay X swirl, and SPA1 and SPA2 swirl groups. Because of overlying high albedo ejecta from numerous fresh craters, the swirls are indistinguishable at the reflectance maps (left-hand column of figures 2 and 3). There are differences in color properties between the swirls and surrounding fresh materials in our RGB map. While the fresh ejecta deposits near craters are yellowish (right-hand column of figures 2 and 3), most of the swirls are more reddish than off-swirl regions. The violet regions are due to deep 950 nm band depth of mafic minerals.
Because it is difficult to compare between on-swirl and off-swirl at the highland region using only an RGB map, we showed density plots of reddening and albedo in the comparison of the swirls and the backgrounds (figure 4). figure 4 shows that the swirl contours tend to have less reddening than the off-swirl contours at all highland swirl regions used in this study. In the KC swirl group, some portions of off-swirls show comparable albedo values to swirls, and the difference of contour gradients between swirls and off-swirls is more apparent than others. Overall, the Gerasimovich swirl is distinctly separated from off-swirls in contours, whereas the GBC and SPA2 swirl groups show largely overlapped contours of swirls and off-swirls. The difference of the reddening and albedo values between swirls and off-swirls are lower than 0.1 and 0.01, respectively, at both GBC and SPA2 swirl groups. At a representative albedo in each region, all highland swirls have lower median values of the reddening than off-swirls. All differences in reddening values between swirls and off-swirls are bigger than 0.05, although the difference values at the GBC, OMM, and SPA2 swirl groups are 0.052, 0.055, and 0.053, respectively. In particular, the KC swirl group and the Airy swirl have high difference values; 0.129 and 0.149. They also show bimodal density distributions. In the KC swirl group, the Gerasimovich swirl, the Airy swirl, the Dufay X swirl, and the SPA1 swirl group, boxes that indicate the middle |$50\%$| of reddening values are not overlapped with boxes of off-swirls.
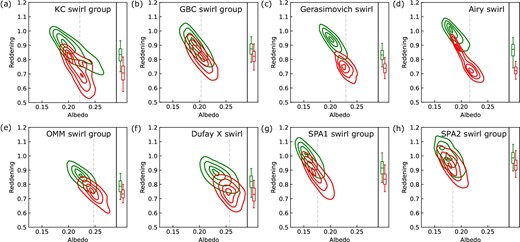
Relationships between the albedo and the reddening for the highland swirls (red) and off-swirls (green). The contour levels are |$5\%$|, |$25\%$|, |$50\%$|, and |$75\%$| from the density peak. Boxes on the right-hand side of each panel are the middle |$50\%$| of reddening values at a representative albedo of each swirl (median value of the swirl; dashed lines). The whiskers indicate the 5th and 95th percentiles. (Color online)
We also analyzed the Reiner Gamma swirl with the three parameters of space weathering, shown in figure 5. In our RGB map, the Reiner Gamma swirl is greenish due to higher albedo than the off-swirl region (figure 5a). It suggests that the Reiner Gamma swirl experiences much less darkening rather than less reddening relative to the off-swirl, opposing the case of highland swirls. In addition, the Reiner Gamma swirl shows higher reddening values than the off-swirl at each arbitrary albedo, while the highland swirls have lower reddening values than the off-swirls (box plots in figures 5f and 6). This implies that highland swirls and a mare swirl, Reiner Gamma, show different aspects of space weathering trends.
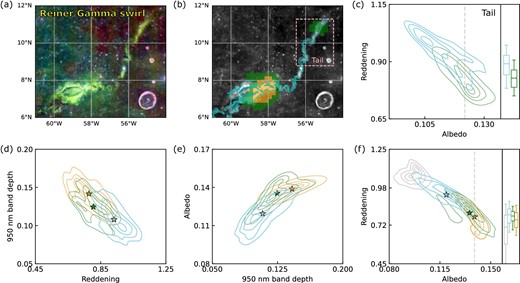
Space weathering trends of the Reiner Gamma swirl. (a) The RGB map; (b) the 750 nm reflectance map with magnetic field strength distribution. Orange and green parts are the regions with the strongest and intermediate field strength, respectively. The rest of the swirl portion is shown in cyan in panels (c)–(f) as the weak magnetic field part. The ranges of magnetic field strengths at each part are provided in table 2. Relationships between the weathering parameters at (c) the tail and (d)–(f) the entire swirl are shown. Each contour corresponds to the same color areas of (b) within the swirl, and the grey shows the off-swirl including some craters outside the swirl. The contour levels are the same as in figure 4. The star symbol is the median value of each part. The boxes shown on the right-hand side of panels (c) and (f) are the middle |$50\%$| of the reddening values at a representative albedo (median value of albedo of the (c) green and (f) orange part; dashed lines). The whiskers indicate the 5th and 95th percentiles. (Color online)

3.2 Space weathering properties: inside of swirls according to magnetic field strength
In addition to the fact that the Reiner Gamma swirl is more greenish than fresh materials at the off-swirl, there is a subtle color difference inside the swirl. One of the most plausible explanations to account for this color difference might be the influence of the magnetic field anomalies overlapping the swirl. In order to investigate the influence of the local magnetic field on the color properties, we divided the swirl into three groups according to magnetic field strength: strong, intermediate, and weak (figures 5b–5f). The strongest magnetic field part within the swirl (orange part in figure 5b) is almost white in our RGB map due to the extremely low reddening, high albedo, and deep 950 nm band depth. The end of the tail, which has a stronger magnetic field than the rest of the tail, is yellowish in this RGB map compared to the remaining, greenish parts of the tail. The weak magnetic field area mostly reveals a clearer greenish color than other parts in the swirl because the albedo is high, although other weathering parameters are mature (figure 5a).
We calculated the correlations between the three weathering parameters in table 1 at each magnetic field strength group. We also considered 950 nm band depth for ferrous absorption because the mare surface contains a high amount of mafic minerals. As shown in figures 5d–5f, all three parameters show an increase in immaturity as the magnetic field strength increases. Among the three parameters, the 950 nm band depth has the clearest relationship with magnetic field strength (figures 5d and 5e). The reddening and albedo of the strongest and intermediate magnetic field parts are similar to each other, although contours of the strongest magnetic field part show an exceptional decrease in the reddening degree at high albedo (figure 5f) . Boxes and whiskers in figure 5f show that the portion with stronger magnetic field strength shows the reddening value becoming lower at an arbitrary albedo, although the difference is insignificant. In the tail of the swirl, the stronger magnetic field part reveals the low reddening degrees at not only the box plot but also the contours in figure 5c.
We applied the same method to the highland swirls. figure 6 displays three highland swirls: the Gerasimovich swirl, the GBC swirl group, and the KC swirl group. The Gerasimovich swirl, which is a highland swirl with the strongest magnetic field on the Moon (Tsunakawa et al. 2015), shows little relationship between reddening degrees and magnetic field strengths. Although slight, the reddening degrees at an arbitrary albedo become lower as the magnetic field strength increases, similar to the Reiner Gamma swirl (figures 6a and 6d). However, the GBC swirl group shows the opposite results, although the difference is also subtle (figures 6b and 6e). Both swirls showed little differences according to magnetic field strength in the contour plots of figure 6d and 6e. The result of the KC swirl group is distinguished from the others. In this region, all orange parts (the strongest magnetic field) and some green parts (intermediate magnetic field) are located near the ejecta deposits of the King crater (figure 6c). These parts show higher albedo and lower reddening values than that of weak magnetic field parts. The stronger the magnetic field strength, the lower the degree of reddening at an arbitrary albedo, as shown in the Reiner Gamma swirl and the Gerasimovich swirl (figure 6f).
4 Discussion and conclusions
We focused on space weathering trends of swirls with reddening, albedo, and 950 nm band depth at VIS-NIR. As shown in figure 4, all highland swirls used in this study have lower reddening values relative to the albedo than the off-swirl regions; the highland swirls undergo less darkening and much less reddening than the off-swirls. As reddening is caused by npFe0 not mpFe0, this suggests that the highland swirls contain less npFe0 relative to mpFe0 compared with the off-swirls. The results are consistent with those of Trang and Lucey (2019) who showed that swirls have a low abundance of npFe0 but have a little sign of subdued mpFe0 abundance using their radiative transfer model with Kaguya MI data.
The KC swirl group shows the distinct difference of density contour gradients between swirls and off-swirls (figure 4a). In this region, large portions are covered by a fresh ejecta blanket of the King crater (figure 1), unlike other highland swirl regions. According to Denevi et al. (2016), the ejecta deposits and a few swirls near the ejecta show high values of 415 nm reflectance and 321 nm/415 nm reflectance ratio (figure 1b), indicating that their component is fresh crystalline plagioclase (Denevi et al. 2014). The swirls far from the ejecta have low 321 nm/415 nm reflectance ratios, which means that those swirls might consist of the agglutinatic glass without npFe0 and mpFe0 (Denevi et al. 2016). In our RGB map, most swirls in this region, including swirls refreshed by the excavated deposits, show a more reddish color than the ejecta deposits (figure 1c). It implies that not only the swirls composed of agglutinatic glass but also those covered by fresh crystalline plagioclase are deficient in npFe0 relative to mpFe0.
Among the highland swirls, at an arbitrary albedo value, there are apparent differences in median reddening values between swirls and off-swirls at not only the KC swirl group but also the Airy swirl. In addition, there are bimodalities in density distribution at both swirl groups. It might be an influence of fresh ejecta from nearby craters. Like the KC swirl group, the Airy swirl is located near the Argelander D crater, whose median values of reddening and albedo in the crater cavity are 0.731 and 0.288, respectively. The upper side of the swirl, which could be affected by the ejecta, is fresher than other portions of the swirl. The density distribution of the Gerasimovich swirl is clearly separated from the off-swirl in general. It could be because the swirl is a highland swirl with the strongest magnetic field (Tsunakawa et al. 2015).
It is suggested that the lunar local magnetic field causes the differences of npFe0 and mpFe0 between swirls and their backgrounds (Trang & Lucey 2019). Stronger magnetic fields might have more influence on the surface than weaker magnetic fields. Most highland swirls used in this study, however, show little differences related with magnetic field strength. The low FeO amount of the highlands might hinder the influence of space weathering states. Because the low FeO amount leads to less abundant neutral iron particles, the highlands could show lower contrast by the weathering than mare regions.
However, the KC swirl group becomes immature as magnetic field strength increases, even though it is located in the highlands (figure 6). In this region, most portions of the strongest magnetic field are covered by the ejecta materials. Thus, the recently excavated materials on the swirls are protected efficiently from solar wind by the strong magnetic field and might keep their freshness. The fresh ejecta coverage could cause the difference from other highland swirls. It is consistent with the explanation of Denevi et al. (2016) that UV color change on the swirls according to the distance from ejecta deposits is due to degrees reached in the steady state of maturity. When the swirls reach equilibrium of the weathering over time, the space weathering trends of this region might become like other highland swirl regions.
The space weathering patterns of the highland swirls, which contain lower npFe0 to mpFe0 ratios than the background, could be explained by this solar wind standoff model (Hood & Schubert 1980). The model describes how the magnetic anomalies retain the soil immature by shielding the solar wind . The npFe0 is formed by both solar wind sputtering and micrometeorite bombardments, where the mpFe0 is only originated by micrometeorite impacts that re-melt and coagulate original npFe0 (Dukes et al. 1999; Sasaki et al. 2001). Because the strength of some local magnetic fields could be strong enough to shield the solar wind, part of the npFe0 formation might be slowed down at the surface of the swirls. Although this would impede the formation of mpFe0 as well, the mpFe0 formation might be less affected by the magnetic shielding than the npFe0 formation because micrometeorite impacts are not interrupted by the magnetic field. This explanation was also mentioned in Trang and Lucey (2019).
Unlike highland swirls, the Reiner Gamma swirl shows extremely high albedo relative to reddening on the whole, which is difficult to explain. Because mpFe0 cause spectra to be darkened regardless of wavelength, unlike npFe0 which causes reddening and darkening effects (Noble et al. 2007), the high albedo of the Reiner Gamma swirl means a much lower abundance of mpFe0 than npFe0. It is contrary to the highland swirls. Blewett et al. (2011), which showed space weathering trends of parts of swirls and off-swirls in a Clementine ratio-reflectance plot, reported that the mare swirls show less darkening relative to reddening than off-swirls. They interpreted that the space weathering trends at mare swirls can be due to the solar wind standoff mechanism. At the highland regions, the weathering trend of the highland swirls was indistinguishable from that of off-swirls. Blewett et al. (2011) explained one of the reasons is that the large FeO amount of the mare regions normally causes the weathering trends at a Clementine ratio-reflectance plot to be steep, so the abnormal weathering trends of the mare swirls can be distinguishable from the off-swirl at the mare regions. The lower FeO amount of the highland regions might reduce the difference between the highland swirls and off-swirls because of the decreased contrast. Our results revealed the distinct difference of reddening values between highland swirls and off-swirls at an arbitrary albedo. It shows that highland swirls experience less reddening relative to darkening, which means that the swirls obviously lack npFe0 and have a small amount of mpFe0 at the highland regions. These results are consistent with the explanations of Trang and Lucey (2019).
There are other mechanisms that can explain the high albedo of mare swirls. Garrick-Bethell, Head, and Pieters (2011) suggested that fine feldspathic dust transported on swirls increases their albedo values. Pieters et al. (2014) reasoned that mobile dust and lack of fairy castle structure on the surface of swirls are the reasons for high albedo. The disrupted micro-structure was also supported by Jeong et al. (2016) using polarimetric observations. Besides these, dielectric breakdown could also form npFe0 and mpFe0 by melting and vaporizing materials, caused by solar energetic particle events. This mechanism might occur more frequently in maria than highlands because mare soils contain more metallic inclusions, which have low electric conductivity. This could make the albedo of mare swirls more apparent than that of highland swirls (Jordan 2021).
In spite of high albedo, the weathering states of the Reiner Gamma swirl are related to magnetic field strength (star symbols in figure 5). This suggests that the strong magnetic field has great efficiency in shielding the solar wind and keeping the regolith grains immature. In the tail, a stronger magnetic field area shows less reddening degrees relative to the albedo than in the weaker parts. The stronger magnetic field impedes npFe0 formation more than the weak magnetic field does in the tail. However, when we analyzed the entire Reiner Gamma swirl region, there was little difference in the reddening-to-darkening ratio as the magnetic field strength changed. This might be because the surface magnetic field used in this study is not accurate enough at the main body of the Reiner Gamma swirl. The SVM map used in this study was extrapolated from measurements at altitudes of 10–45 km (Tsunakawa et al. 2015). Indeed, the derived surface data does not accord with the albedo patterns of this swirl. Garrick-Bethell and Kelley (2019) mentioned that cusp structures of weak horizontal magnetic fields could appear at altitudes of less than 5 km. These subtle structures of magnetic field on the surface, which were not detected by an orbiter, might affect reddening and darkening patterns at the main body of the swirl.
Although the space weathering properties of swirls observed in this study support the solar wind standoff model, we note that one mechanism cannot account for all the spectral properties of swirls. Future in-situ measurements of lunar space environments, surface magnetic field structures, and micro-structures of regolith will improve our understanding of the swirl formation mechanism.
Acknowledgements
We are grateful to the SELENE (KAGUYA) MI team and the SELENE Data Archive (https://darts.isas.jaxa.jp/planet/pdap/selene/). SELENE is a Japanese mission developed and operated by JAXA. The LROC-WAC EMP data is available at the LROC website (http://wms.lroc.asu.edu/lroc/view_rdr/WAC_EMP) and is photometrically normalized by Boyd et al. (2012). The global SVM map by Tsunakawa et al. (2015) is available at the SVM map website (http://www.geo.titech.ac.jp/lab/tsunakawa/Kaguya_LMAG). The shapefiles of swirls (Denevi et al. 2016) and maria boundaries (Nelson et al. 2014) are available at the website (http://lroc.sese.asu.edu/posts/978). This work was supported by the National Research Foundation of Korea (NRF) grant funded by the Korea government [Ministry of Education (No. 2019R1I1A1A01043356; No. 2019R1I1A2A01059953) and Ministry of Science and ICT (2020M1A3B7040417)].
