


Abstract
The narrow-line region (NLR) consists of gas clouds ionized by the strong radiation from the active galactic nucleus (AGN), distributed in the spatial scale of AGN host galaxies. The strong emission lines from the NLR are useful to diagnose physical and chemical properties of the interstellar medium in AGN host galaxies. However, the origin of the NLR is unclear; the gas clouds in NLRs may originally be in the host and photoionized by the AGN radiation, or they may be transferred from the nucleus with AGN-driven outflows. In order to study the origin of the NLR, we systematically investigate the gas density and velocity dispersion of NLR gas clouds using a large spectroscopic data set taken from the Sloan Digital Sky Survey. The [S ii] emission-line flux ratio and [O iii] velocity width of 9571 type-2 Seyfert galaxies and 110041 star-forming galaxies suggest that the gas density and velocity dispersion of NLR clouds in Seyfert galaxies (ne ≈ 194 cm−3 and |$\sigma _{\rm [O\,{\small III}]} \approx 147\:$|km s−1) are systematically larger than those of clouds in H ii regions of star-forming galaxies (ne ≈ 29 cm−3 and |$\sigma _{\rm [O\,{\small III}]} \approx 58\:$|km s−1). Interestingly, the electron density and velocity dispersion of NLR gas clouds are larger for Seyfert galaxies with a higher [O iii]/Hβ flux ratio, i.e., with a more active AGN. We also investigate the spatially-resolved kinematics of ionized gas clouds using the Mapping Nearby Galaxies at the Apache Point Observatory (MaNGA) survey data for 90 Seyfert galaxies and 801 star-forming galaxies. We find that the velocity dispersion of NLR gas clouds in Seyfert galaxies is larger than that in star-forming galaxies at a fixed stellar mass, at both central and off-central regions. These results suggest that gas clouds in NLRs come from the nucleus, probably through AGN outflows.
1 Introduction
There is accumulating evidence of the so-called co-evolution (e.g., Kormendy & Ho 2013) of galaxies and super massive black holes (SMBHs), since the correlation between masses of SMBHs and properties of their host galaxies has been reported observationally (e.g., Ferrarese & Merritt 2000; Gebhardt et al. 2000; McConnell & Ma 2013; Reines & Volonteri 2015). In the study of the physics of the co-evolution, active galactic nuclei (AGNs) are important because SMBHs in AGNs are in a growing phase due to the mass accretion on to the SMBH. AGNs are also important to understand the growth of their host galaxies, because the AGN activity sometimes affects the interstellar medium (ISM) in their host galaxies. Specifically, AGN-driven outflows have been detected at the spatial scale of AGN host galaxies by observations of multi-phase gas (e.g., Villar-Martín et al. 2011; Cicone et al. 2014; Kang & Woo 2018). Such AGN-driven outflows may contribute significantly to the suppression of the star formation in the host galaxy, and accordingly the control of mass accretion to the SMBH (e.g., Cano-Díaz et al. 2012; Heckman & Best 2014; Förster Schreiber et al. 2019), while the AGN-driven outflows may enhance the star formation due to the compression of the gas (e.g., Maiolino et al. 2017; Shin et al. 2019; Zhuang & Ho 2020).
To investigate the co-evolution observationally, the narrow-line region (NLR) is a useful ingredient in the AGN. This is because the NLR in nearby AGNs is spatially resolved observationally (with a typical extension of ∼102–104 pc) and it shows strong emission lines in a wide wavelength range. Therefore the NLR is a powerful factor in the study of the spatial distribution of the physical, chemical, and kinematic properties of gas in AGN host galaxies. The mechanism of the ionization of NLR gas clouds is well understood; they are mostly ionized by the power-law radiation from the AGN (e.g., Davidson & Netzer 1979; Evans & Dopita 1986; Binette et al. 1996; Komossa & Schulz 1997; Nagao et al. 2006), though sometimes fast shocks may also contribute (e.g., Wilson & Raymond 1999; Fu & Stockton 2007; Hashimoto et al. 2011; Terao et al. 2016). On the other hand, the origin of gas clouds in NLRs is not clearly identified. One possible scenario is as follows: Gas clouds originally located in the host galaxy become the NLR when they are ionized by the power-law radiation from the AGN. Another idea is that the NLR clouds are carried in by the AGN-driven outflows from the central region. Wada, Yonekura, and Nagao (2018) showed that the NLR can be explained by high-density gas clouds transferred from the nuclear region to the outer part in the host galaxy through the AGN-driven outflow, based on three-dimensional radiation-hydrodynamical calculations (see also Wada 2012). Although the spatial scale of the NLR simulated by Wada, Yonekura, and Nagao (2018) was limited to a region of ∼10 pc from the nucleus, a more extended NLR can be formed through the same scenario since the velocity of these gas clouds is larger than the escape velocity. In fact, the gas in the NLR is located mostly at the inner surface of the bi-cone in nearby AGNs (e.g., Das et al. 2006; Müller-Sánchez et al. 2011). This is also the case in the theoretical model.
These two possible scenarios for the origin of the NLR clouds can be distinguished by the statistical properties of the gas density and kinematics of NLR gas clouds, because the latter scenario predicts systematically higher gas density and more disturbed kinematics of NLR gas clouds than the ISM in non-AGN galaxies. Zhang, Liang, and Hammer (2013) conducted a statistical study of the gas clouds in NLRs and reported that the typical range of the gas density (traced by the electron density) in NLRs is ∼102–103 cm−3, which is higher than that in H ii regions of star-forming galaxies (∼101–102 cm−3). Zhang, Liang, and Hammer (2013) also investigated the kinematics of NLR gas clouds, and reported that the velocity dispersion and gas density of NLR clouds are not correlated significantly (see also Heckman et al. 1981). This seems to be contrary to the latter scenario of the origin of the NLR described above.
The success of the Sloan Digital Sky Survey (SDSS; York et al. 2000) has enabled us to examine the large spectroscopic data set to investigate the physical and kinematic properties of emission-line galaxies such as AGNs and star-forming galaxies systematically. In addition, the recent development of integral field unit (IFU) spectrographs has allowed us to examine the spatially resolved properties of galaxies. For instance, the Mapping Nearby Galaxies at the Apache Point Observatory (MaNGA; Bundy et al. 2015) is one of the spatially-resolved spectroscopic surveys for nearby galaxies which has made a significant contribution to the understanding of the galaxy evolution (e.g., Belfiore et al. 2016, 2017; Goddard et al. 2017). IFU observations have also played an important role in investigating AGN-driven outflows in detail (e.g., Davies et al. 2016; Mingozzi et al. 2019). Moreover, the development of IFU observations has led to an increase in the number of samples, which allows us to study the effects of AGNs for the host galaxies statistically (e.g., Ilha et al. 2019; Rodríguez del Pino et al. 2019).
In this work, we analyze the SDSS and MaNGA datasets to understand the origin of NLR gas clouds. The paper is structured as follows: In section 2 we introduce the galaxy sample and the data analysis, and explain our approach to investigate the physical properties and ionization states of our emission-line galaxies. The results are described in section 3, and based on that, we discuss in section 4 the origin of the gas clouds in NLRs. We summarize the main results in section 5.
2 Data and analysis
2.1 The Sloan Digital Sky Survey (SDSS) data
2.1.1 Sample selection and classification
We use a spectroscopic data set of nearby emission-line galaxies taken from the SDSS Data Release 8 (Aihara et al. 2011), which covers about a quarter of the entire sky. Those spectra were obtained with 3″-diameter fibers, thus there is no spatially-resolved spectral information in the data. The emission-line properties of SDSS emission-line galaxies, such as fluxes and velocity dispersions, were measured and provided via the Max Planck Institute for Astrophysics and Johns Hopkins University (MPA-JHU) catalog (Kauffmann et al. 2003b; Brinchmann et al. 2004; Tremonti et al. 2004). To exclude duplicated objects in this catalog, we select objects with sciencePrimary=1 from the MPA-JHU catalog. This sciencePrimary flag in the specObjAll table is designed to select the best available unique set of spectra. After resolving the object duplications, we create a “clean sample” by selecting objects whose measurements are reliable according to the following criteria. First, we exclude objects with RELIABLE=0, since spectroscopic parameters of such objects were not reliably measured by the SDSS pipeline. We also require that the redshift measurement was successful (i.e., Z_WARNING=0) and z > 0.02. This redshift limit is adopted to exclude too-nearby galaxies, for which the SDSS fiber covers only a very narrow area around the center of the galaxies. We then remove type-1 AGNs because we cannot measure some key emission-line flux ratios such as [N ii]λ6584/Hα and [O iii]λ5007/Hβ due to the broad component of recombination lines. In removing them, we select only objects whose velocity width (σ) of both forbidden and Balmer lines is less than 500 km s−1. Then we require signal-to-noise ratio (S/N) >7 for some key emission lines (Hα, Hβ, |$[\rm {O}\,{\small III}]\lambda 5007$|, |$\rm{[N\,{\small II}]}\lambda 6584$| and |$\rm{[S\,{\small II}]}\lambda \lambda 6717,\!6731$|) and S/N > 3 for |$\rm{[O\,{\small I}]}\lambda 6300$| (since this emission line is the weakest among the diagnostic emission lines used in this work) for accurate calculations of their flux ratios. As the result of the above selection criteria, we obtain a clean sample that consists of 140320 emission-line galaxies.
Next, we classify these 140320 galaxies using two ionization diagnostic diagrams (so-called BPT diagrams; Baldwin et al. 1981), which use two pairs of emission-line flux ratios to classify emission-line galaxies into Seyfert galaxies, low-ionization nuclear emission-line regions (LINERs), star-forming galaxies, and composite galaxies (figure 1). More specifically, we adopt the following criteria for this classification.
- The empirical classification criterion derived by Kauffmann et al. (2003a);which separates the star-forming galaxies (110041 objects) from the remaining galaxies.(1)$$\begin{eqnarray} \log \left( \frac{\rm{[O\,{\small III}]}}{\rm{H}\beta } \right) > \frac{0.61}{\log (\rm{[N\,{{\small II}}}]/\rm{H}\alpha ) -0.05}+1.3, \end{eqnarray}$$
- The theoretical boundary of the region where star-forming galaxies can be distributed on the BPT diagram, derived by Kewley et al. (2001) by combining stellar population synthesis models and photoionization models,which defines the composite galaxies (18523 objects).(2)$$\begin{eqnarray} \log \left( \frac{\rm{[O\,{\small III}]}}{\rm{H}\beta } \right) > \frac{0.61}{\log (\rm{[N\,{\small II}]}/\rm{H}\alpha ) -0.47}+1.19, \end{eqnarray}$$
- The empirical classification criterion derived by Kewley et al. (2006),which classifies the remaining objects into Seyfert galaxies (9571 objects) and LINERs (2185 objects).(3)$$\begin{eqnarray} \log \left( \frac{\rm{[O\,{\small III}]}}{\rm{H}\beta } \right) > 1.36\log \left( \frac{\rm{[O\,{\small I}]}}{\rm{H}\alpha } \right) + 1.4, \end{eqnarray}$$
![BPT diagrams (upper panel: $[\rm{O\,{{\small III}}}]\lambda 5007/\rm{H}\beta$ vs $\rm {[N\,{\small II}]\lambda 6584/H\alpha }$; lower panel: $[\rm{O\,{{\small III}}}]\lambda 5007/\rm{H}\beta$ vs $\rm {[O\, {\small I}]\lambda 6300/H\alpha }$ vs. $[\rm{O\,{{\small III}}}]\lambda 5007/\rm{H}\beta$), showing the classification criteria for SDSS emission-line galaxies. The solid and dotted lines in the top panel show the criteria selecting star-forming galaxies Kauffmann et al. (2003a) and composite galaxies Kewley et al. (2001), respectively. The dotted line (Kewley et al. 2006) in the lower panel separates the remaining galaxies into Seyfert galaxies and LINERs. Gray, black, green, and yellow dots demote star-forming galaxies, composite galaxies, Seyfert galaxies, and LINERs, respectively. (Color online)](https://oup.silverchair-cdn.com/oup/backfile/Content_public/Journal/pasj/73/4/10.1093_pasj_psab065/2/m_psab065fig1.jpeg?Expires=1749171716&Signature=chLpJs0t4KgNtPZ6aSiDsnGitvLQtBL0lrqDomXty16J1ZImhFSMZtkOBEB~l6uo4lyBHtR~85yJpOlywaAd9bKGJ6qvDmPsJC5zyLWZhHHKGo2Rxc7k7KFaFGrTJfWI0Jdn0SFgQeQCN5FJtgrAIy4~KY0lmwc7oWqH3pWK6nBMw5lZAIeHXRZDhDZhxw~3CrC88Or7hmic~6xK~~b-tuu-kCqLEZCWSf5J7KQ3GwX8Huv3I-JoNFurjpFrJ~T5mVjkblXWrIDq5XcykK3eSA5puKHbF1nRgSoCvLipWwuI3n6G6JYVI-n-JT1uL~1ljhrEgg8v-A9fAqvO1liRLg__&Key-Pair-Id=APKAIE5G5CRDK6RD3PGA)
BPT diagrams (upper panel: |$[\rm{O\,{{\small III}}}]\lambda 5007/\rm{H}\beta$| vs |$\rm {[N\,{\small II}]\lambda 6584/H\alpha }$|; lower panel: |$[\rm{O\,{{\small III}}}]\lambda 5007/\rm{H}\beta$| vs |$\rm {[O\, {\small I}]\lambda 6300/H\alpha }$| vs. |$[\rm{O\,{{\small III}}}]\lambda 5007/\rm{H}\beta$|), showing the classification criteria for SDSS emission-line galaxies. The solid and dotted lines in the top panel show the criteria selecting star-forming galaxies Kauffmann et al. (2003a) and composite galaxies Kewley et al. (2001), respectively. The dotted line (Kewley et al. 2006) in the lower panel separates the remaining galaxies into Seyfert galaxies and LINERs. Gray, black, green, and yellow dots demote star-forming galaxies, composite galaxies, Seyfert galaxies, and LINERs, respectively. (Color online)
Figure 1 shows the BPT diagrams with the result of our classification of the SDSS clean sample. The averages and standard deviations of the redshift of the selected star-forming galaxies, composite galaxies, Seyfert galaxies, and LINERs are 0.077 ± 0.044, 0.095 ± 0.049, 0.104 ± 0.048, and 0.079 ± 0.047, respectively.
2.1.2 Electron density
The expected [S ii] flux ratio is 1.4484 and 0.4375 for electron densities of 1 cm−3 and 100000 cm−3, respectively, which are regarded as the maximum and minimum limits of the [S ii] flux ratio in this work.1 In our sample, 41869 galaxies show larger [S ii] flux ratios than the maximum limit, and four galaxies show smaller [S ii] flux ratios than the minimum limit (figure 2). The reason for this relatively large number of galaxies that have [S ii] flux ratios higher than the maximum theoretical value is that the electron density in many emission-line galaxies is too low to be traced by the [S ii] flux ratio. More specifically, 37308 among 110041 star-forming galaxies (|$\sim\!\! 34\%$|), 3238 among 18523 composite galaxies (|$\sim\!\! 17\%$|), 874 among 9571 Seyfert galaxies (|$\sim\!\! 9\%$|), and 449 among 2185 LINERs (|$\sim\!\! 21\%$|) show [S ii] flux ratio that exceed the maximum limit. Thus the typical gas density of ionized clouds in about one third of star-forming galaxies and LINERs is very low, while the fraction of Seyfert galaxies showing such a low density is much lower. A very minor fraction of the SDSS clean sample (four among 140320 emission-line galaxies; |$\sim\!\! 0.003\%$|) are characterized by a very high density, but our visual inspections of their spectra suggest that such a very high gas density is due to the failure of the fit of emission lines by the SDSS pipeline. Such a low failure rate of the fit by the SDSS pipeline is negligible in the analysis given in the following sections.
![Histogram of the [S ii] flux ratio (R[S II]) for the SDSS clean sample. The blue and red dashed lines denote the maximum and minimum flux ratios, respectively (see the main text). (Color online)](https://oup.silverchair-cdn.com/oup/backfile/Content_public/Journal/pasj/73/4/10.1093_pasj_psab065/2/m_psab065fig2.jpeg?Expires=1749171716&Signature=3FaKKbwtMpIqxvowdyLu2h883d9EBBztiYoHXD01So5iiFG7NQRNYDHVdaVOns8vXq8ECqso4KgEkB~3ZRDTqodFGkvWiCM3FQu9JLg22YtKyD0ku1zYUw6x2jsswT7VM4v2Rye59msezrBDm-s4NsZIwnVoDFlQrvZ~qtCvBq2fGtujvOuept5i0~RRlxiwmGIkQY07AOa4aIqKk9rW9N6ed2PVYmqak~bjN58VNGPe5VN~NRepjYNjRwUvSGmclIji8a-Jp0FCyM9OPi~Wx~2MFY5jqPGWN6rk5zBF~8STU0G29p3WqKXhwriUl6~O4WgDBjWdYHG2V-plrBNHYQ__&Key-Pair-Id=APKAIE5G5CRDK6RD3PGA)
Histogram of the [S ii] flux ratio (R[S II]) for the SDSS clean sample. The blue and red dashed lines denote the maximum and minimum flux ratios, respectively (see the main text). (Color online)
2.1.3 AGN activity
It is generally difficult to assess the AGN luminosity for type-2 AGNs because their central engine is obscured by optically-thick, dusty tori. However, the AGN activity affects the ionization of NLR gas clouds, which can be traced by some emission-line flux ratios. Some previous works studied how photoionization models reproduce emission-line flux ratios of AGNs on the BPT diagrams (e.g., Ho et al. 1993; Groves et al. 2004). Such models show that a higher flux ratio of |$[\rm{O\,{{\small III}}}]\lambda 5007/\rm{H}\beta$| indicates a higher ionization parameter (U), which is the density ratio of the ionizing photon from the AGN to the hydrogen at the irradiated face of NLR gas clouds. In this work, we investigate the electron density and [O iii] velocity dispersion of NLR clouds as a function of the location in the BPT diagram to see how the AGN activity (inferred by the U parameter) affects the properties of NLR gas clouds.
2.2 The Mapping Nearby Galaxies at the Apache Point Observatory (MaNGA) survey data
2.2.1 Sample selection
We use the MaNGA survey data to investigate spatially resolved physical properties of NLRs. The MaNGA survey is one of the three core programs of SDSS-IV (Blanton et al. 2017) and its goal is to map the detailed composition and kinematic structure of ∼ 10000 nearby galaxies (Bundy et al. 2015), obtained with 2″-diameter fibers. The spectral coverage is 3600 Å ≲ λ ≲ 10000 Å with a spectral resolution of R ∼ 2000. Each target is observed by a fiber bundle that consists of 19–127 fibers, which corresponds to the diameter of 12″–32″. This field-of-view covers 1.5 Re (effective radius) and 2.5 Re of targets classified in the primary and secondary samples (|$\sim\!\! 67\%$| and |$\sim\!\! 33\%$| among all MaNGA targets), respectively. In this study, we use both of these two samples. To obtain maps of emission-line fluxes and velocity dispersions, we use the advanced products of the MaNGA Data Analysis Pipeline (DAP; Westfall et al. 2019). The MaNGA DAP is a survey-led software package that analyzes the data produced by the MaNGA data-reduction pipeline (DRP; Law et al. 2016) to reproduce physical properties derived from the MaNGA spectroscopy.
We select the sample from the DAPALL catalog made by the MaNGA DAP, according to the following procedure: The objects with DAPDONE = False, in which cases DAP was not successful, are excluded. After removing the duplicated objects, we obtain the DAP outputs for 4609 galaxies. Note that the DAP provides two kinds of maps with a different spatial sampling. One of the two is VOR10, in which spaxels are binned to achieve S/N ∼ 10 based on the Voronoi binning algorithm (Cappellari & Copin 2003). The other one is the hybrid binning scheme (HYB), in which the emission-line measurement is performed on the original spaxel sampling in the spatial dimension. In this study, we adopt HYB as it provides better spatial sampling for the analysis.
2.2.2 The central and off-central regions of MaNGA galaxies
In the case where galaxies are in the dynamical equilibrium, the velocity dispersion of emission lines from ionized gas clouds is expected to be proportional to the gravitational potential of galaxies. However, if the outflow (either of starburst-driven and AGN-driven) disturbs the ISM of a galaxy, the velocity dispersion is consequently enhanced. In this study, we compare the velocity dispersion of the [O iii] line for Seyfert galaxies and star-forming galaxies with a similar stellar mass. To classify the MaNGA objects, we match the MaNGA sample (4609 objects) and the SDSS clean sample (140320 objects). Here, we focus specifically on star-forming galaxies and Seyfert galaxies to see the possible effects of the AGN activity on the ISM. As a result, 90 and 801 MaNGA objects are classified as Seyfert and star-forming galaxies, respectively. As for the stellar mass, we adopt the median of the stellar-mass probability distribution given in the MPA-JHU catalog.
Here we define the central and off-central regions of MaNGA galaxies, to investigate the possible effect of outflows at the inner and outer parts of galaxies in our sample. The projected galaxy size is characterized by the two-dimensional Petrosian radius Rp (Blanton et al. 2017; Westfall et al. 2019) in the DAP output. We define the off-central region as described below, so that the nuclear emission does not significantly contribute to the off-central region due to the seeing effect in most objects. Figure 3 shows the fractions of sources whose angular radius from the center on the minor axis (R) is larger than |$\sim\!\! {1.^{\prime \prime }5}$|, as a function of R/Rp, for 801 star-forming galaxies and 90 Seyfert galaxies. Since the typical size of the point-spread function (PSF) of the MaNGA data is |$\sim\!\! {2.^{\prime \prime }5}$| in diameter, the boundary between the central and off-central regions should be located at |${1.^{\prime \prime }5}$| from the nucleus at least. Figure 3 shows that the radius from the nucleus on the minor axis at R/Rp = 0.7 is larger than |${1.^{\prime \prime }5}$| in most cases (|$\sim\!\! 89\%$| of Seyfert galaxies and |$\sim \!\!75\%$| of star-forming galaxies). Therefore, we define the region between the ellipses with R/Rp = 0.7 and 1.0 as the off-central region. Then we define the region within the ellipse with R/Rp = 0.7 as the central region. By this definition, the number of spaxels in central and off-central regions becomes almost the same; i.e., roughly the half of the area within the ellipse with R/Rp = 1.0 belongs to the central region (R/Rp < 0.7) and the remaining half belongs to the off-central region (0.7 < R/Rp < 1.0), in each object.
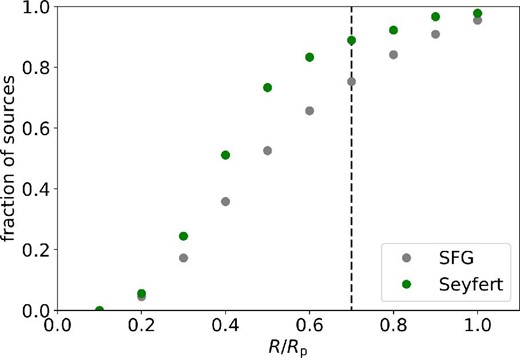
Fractions of sources whose angular radius from the center on the minor axis (R) is larger than |${1.^{\prime \prime }5}$|, as a function of R/Rp. Gray and green dots denote 801 star-forming galaxies and 90 Seyfert galaxies, respectively. The vertical dashed line corresponds to R/Rp = 0.7 (see the main text). (Color online)
Figure 4 shows the examples of three-color SDSS images with g, r, and i bands, and [O iii] velocity dispersion maps for Seyfert and star-forming galaxies, with the ellipses defining the central and off-central regions. To examine a possible contribution of the outflow to the gas dynamics, we measure the velocity dispersion of the central and off-central regions by calculating the 75th percentile of the [O iii] velocity dispersion of all spaxels at R/Rp < 0.7 and 0.7 < R/Rp < 1.0, not the median nor average. This is because the AGN-driven and starburst-driven outflows are sometimes collimated and thus they affect the dynamics of gas only in the (bi-)polar direction with a small filling factor (e.g., Heckman et al. 1990; Falcke et al. 1998; Sun et al. 2018). Consequently, the median and average of the velocity dispersion may not be good indicators to examine the possible contribution of the outflow. In some cases, the number of available spaxels in the central or off-central regions is too small to characterize the velocity dispersion, due to the too-narrow size of the region, a large number of low-S/N (<3) or masked-out spaxels, or a combination of the two. Therefore we remove the objects whose number of available spaxels is less than 10 for both the central region and the off-central region.
![Examples of SDSS cutout gri three-color images (upper panels), [O iii] velocity dispersion maps obtained by the MaNGA survey (middle panels), and BPT maps with NLR, H ii region, LINER, and composite region, colored by brown, blue, yellow, and green (lower panels) for two Seyfert galaxies (left-hand two columns) and two star-forming galaxies (right-hand two columns). The ellipses with R/Rp = 0.7 and 1.0 are shown in each panel. (Color online)](https://oup.silverchair-cdn.com/oup/backfile/Content_public/Journal/pasj/73/4/10.1093_pasj_psab065/2/m_psab065fig4.jpeg?Expires=1749171716&Signature=g8hFTJrnbbsUf8WIAVy5j-anWC1gfAuMxHMSDbUFSp47iyK8BK05XVWkGHCIjxtwijB2Ei0ZfwmbNpGk6eSPfWcneu~Ed7qiM2VdLfsMQ1ItTPXH~9Xf~tD~zd~enEd6~OOb6v9JzUDw3jNu5jjRzE26piSjxnhwKzCpRIgCozW5U0igmYYJ1GYNTmWpU0y1J3OwrXguXSt1amedMp~eqPF7MsANj9a9T~NYcKC1U4KKRPqstHsx7rLoV165XhEWVwEl8er1H9FQo6-RV4CgCbHMejFPW9eUrCfDs1YJbDYuwPjKSLUJ9zpDJuRxV3jNg-1obT0pTXzGI2uiXsqrtw__&Key-Pair-Id=APKAIE5G5CRDK6RD3PGA)
Examples of SDSS cutout gri three-color images (upper panels), [O iii] velocity dispersion maps obtained by the MaNGA survey (middle panels), and BPT maps with NLR, H ii region, LINER, and composite region, colored by brown, blue, yellow, and green (lower panels) for two Seyfert galaxies (left-hand two columns) and two star-forming galaxies (right-hand two columns). The ellipses with R/Rp = 0.7 and 1.0 are shown in each panel. (Color online)
Using [O iii] velocity dispersion for the central region (in 794 star-forming galaxies and 88 Seyfert galaxies) and the off-central region (in 795 star-forming galaxies and 89 Seyfert galaxies) derived by the above method, we will compare the relation between stellar mass and velocity dispersion of Seyfert galaxies and star-forming galaxies (subsection 3.3).
Figure 4 also shows the maps of the BPT classification of emission-line regions (NLR, H ii region, and composite region) for each spaxel. In most star-forming galaxies, the spaxels in both central and off-central regions are classified as the H ii region. Though the spaxels in both central and off-central regions of many Seyfert galaxies are classified as the NLR (as the second object in figure 4), not all spaxels of some Seyfert galaxies are classified as the NLR, especially in off-central regions (as the first object in figure 4). This should be kept in mind during the analyses given in the following sections.
3 Results
3.1 Statistical properties of gas in emission-line galaxies
Table 1 shows the median of the electron density and the [O iii] velocity dispersion measured by the SDSS fiber spectroscopy for each class of emission-line galaxies. Since many objects show the [S ii] flux ratio deviated from the range between the low-density and high-density limits, as shown in sub-subsection 2.1.2 (see also figure 2), table 1 shows the median of the electron density in cases of both including and excluding those objects. In both cases, LINERs and composite galaxies show similar density. Compared with these two classes (LINERs and composite galaxies), Seyfert galaxies and star-forming galaxies show systematically higher and lower gas density, respectively. To clarify these trends, the histograms of the electron density for each class of emission-line galaxies are shown in figure 5. Since those histograms cannot show objects out of the range between the low- and high-density limits, the cumulative distribution function of the gas density is also shown in this figure. The modes of the distribution of the gas density (cm−3) in the logarithmic scale are 2.5 and 1.9 for Seyfert galaxies and star-forming galaxies, respectively; i.e., the gas density in Seyfert galaxies is ∼0.6 dex higher than that in star-forming galaxies. To examine the statistical significance of the difference, we apply the Kolmogorov–Smirnov (KS) statistical test for the frequency distributions of the gas density of Seyfert galaxies and star-forming galaxies. The KS test shows that the probability of these two distributions taken from the same parent distribution is lower than 10−10, suggesting that the difference in the density distribution between Seyfert galaxies and star-forming galaxies is statistically significant.
![Histograms and cumulative distributions of the electron density for Seyfert galaxies, LINERs, and composite galaxies are shown from top to bottom panels, respectively. The gray-dashed line in all panels shows the cumulative distribution for the star-forming galaxies. The cumulative distributions start from non-zero value, because of the presence of objects whose [S ii] flux ratio is higher than the low-density limit. (Color online)](https://oup.silverchair-cdn.com/oup/backfile/Content_public/Journal/pasj/73/4/10.1093_pasj_psab065/2/m_psab065fig5.jpeg?Expires=1749171716&Signature=FA8~9biN7bAkilxm95kSyABaGuT~-KGuQhxdiLVHFJoXHN-JkzVZ8rRPiqNDCIqj6t9A4jIDt0XkRY0UTs5xo0IkK-QMfLugINy05-QPjGtjkDRUE2sl4EooMnrEYFTQk2z5d8-yJBHbhT367MzKYutiES5E8~BHwQSrJqv21nh6n9WWVksNnF18l7BfaSqPgy2vF9-FrpfOAcMyRXyN1fNiiSAHBKVCIcqa9XlmZHfpVZKo8IcWUTS06hBJnLC-cmKVSTKgnCgkLg0QhEYI8TiLWnKbwgwPiClLAcZh8PevZS3AGK~EOF7giPlMdpABOcQrMLAOLccE~0snLnnWAw__&Key-Pair-Id=APKAIE5G5CRDK6RD3PGA)
Histograms and cumulative distributions of the electron density for Seyfert galaxies, LINERs, and composite galaxies are shown from top to bottom panels, respectively. The gray-dashed line in all panels shows the cumulative distribution for the star-forming galaxies. The cumulative distributions start from non-zero value, because of the presence of objects whose [S ii] flux ratio is higher than the low-density limit. (Color online)
Median values of the electron density and [O iii] velocity dispersion for each class of emission-line galaxies.
| ne_A* | ne_B† | |$\sigma _{\rm [O\,{\small III}]5007}$| | ||
|---|---|---|---|---|
| Classification | Number | [cm−3] | [cm−3] | [km s−1] |
| Seyfert | 9571 | 194 | 213 | 147 |
| LINER | 2185 | 104 | 146 | 173 |
| SF | 110041 | 29 | 61 | 58 |
| Composite | 18523 | 108 | 136 | 118 |
| ne_A* | ne_B† | |$\sigma _{\rm [O\,{\small III}]5007}$| | ||
|---|---|---|---|---|
| Classification | Number | [cm−3] | [cm−3] | [km s−1] |
| Seyfert | 9571 | 194 | 213 | 147 |
| LINER | 2185 | 104 | 146 | 173 |
| SF | 110041 | 29 | 61 | 58 |
| Composite | 18523 | 108 | 136 | 118 |
Median value measured including objects with the density above the high-density limit and those below the low-density limit.
Median value measured excluding objects with the density above the high-density limit and those below the low-density limit.
Based on table 1, it is suggested that the [O iii] velocity dispersion of Seyfert galaxies and LINERs is much larger than that of star-forming galaxies, and the [O iii] velocity dispersion of composite galaxies is intermediate among them. Figure 6 shows the frequency distribution of the [O iii] velocity dispersion for each class of emission-line galaxy, displaying the consistent trend. The modes of the distribution of the [O iii] velocity dispersion of Seyfert galaxies and star-forming galaxies are 130 km s−1 and 50 km s−1, respectively, i.e., the [O iii] velocity dispersion in Seyfert galaxies is ∼0.4 dex larger than that in star-forming galaxies. The KS test shows that the probability of these two distributions taken from the same parent distribution is lower than 10−10, so the difference in the distribution of the [O iii] velocity dispersion between Seyfert galaxies and star-forming galaxies is also statistically significant.
![Histograms of the [O iii] velocity dispersion for Seyfert galaxies, LINERs, and composite galaxies are shown from top to bottom, respectively. The histogram drawn with a gray-dashed line shows the distribution for star-forming galaxies. (Color online)](https://oup.silverchair-cdn.com/oup/backfile/Content_public/Journal/pasj/73/4/10.1093_pasj_psab065/2/m_psab065fig6.jpeg?Expires=1749171716&Signature=TYpUVFPippxH0IhT1Lr9FrtYrIG3DbQ~rRQp~z83yJCdg3LtXlZdlqKfsrApPBoobLRz4LmSEDKJXLf0i5vcRlNsAUddLCu22NZtXc5alLMXqw4aHk8MdS0IOxutMzFkluxHNJpo9s83Ky7Q4WEO3~DC-HylsGnropCmODHEiFGq7L7i9vSEnWkv5R7qqOqPdNGkMF0eVQ4AUQ0h6v2X6Tz1V-H-eZ0Kxbdm1LmyEg9Zg0HwHl4vLsNBBdBLhLRJbKGdrRuKmr31tMY~3S5OSWRxufXyo~Oqkz0yh60qx1lCJY8MX3EwC0TzDccSJd84pxALsOWsGmbHsS9nQ9kW4Q__&Key-Pair-Id=APKAIE5G5CRDK6RD3PGA)
Histograms of the [O iii] velocity dispersion for Seyfert galaxies, LINERs, and composite galaxies are shown from top to bottom, respectively. The histogram drawn with a gray-dashed line shows the distribution for star-forming galaxies. (Color online)
3.2 The properties of NLRs as a function of a location in the BPT diagram
In figure 7, we show the electron density of ionized gas clouds as a function of the location in the BPT diagram. This figure is drawn by calculating the median value for each grid with a width of 0.05 dex on the BPT diagram. Here, the objects with an [S ii] flux ratio that deviates from the range between the low-density and high-density limits are also included in order to draw the contour of the electron density. In the region where star-forming galaxies are distributed, the electron density is low, typically ne < 102 cm−3. On the other hand, in the region where AGNs (Seyfets galaxies and LINERs) and composites are distributed, the value of the electron density is ne ∼ 102–103 cm−3. Interestingly, we found that the electron density is higher at the region with the higher ratio |${[\rm{O\,{{\small III}}}]}\lambda 5007/\rm{H}\beta$| (i.e., the upper right-hand side in the BPT diagram), reaching up to ∼102.7 cm−3 at |$\log ({[\rm{O\,{{\small III}}}]}\lambda 5007/\rm{H}\beta ) \sim 1$|. In addition, objects characterized by a systematically high electron density are seen also at the lower edge of the distribution of composite galaxies, showing ne ≳ 102.5 cm−3.
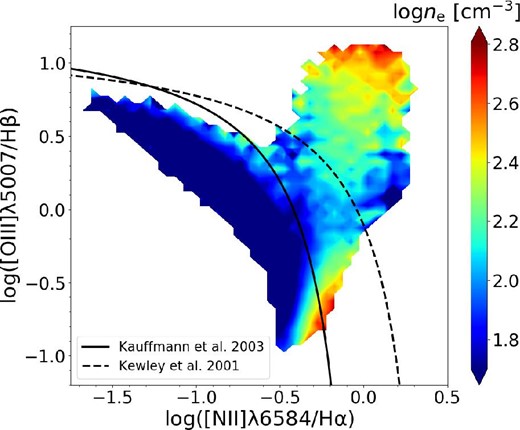
Contour of the electron density on the BPT diagram for all galaxies in the SDSS clean sample. The median electron density for each 0.05 dex × 0.05 dex bin is shown with a color, the scale for which is shown in the right side of the panel. Bins with <5 galaxies are not shown. The dashed and solid lines on the top panel represent, respectively, the limitation line showing the distribution region of star-forming galaxies from Kewley et al. (2001) and the empirical line by Kauffmann et al. (2003a) that separates star-forming and composite galaxies. (Color online)
Next, we investigate the [O iii] velocity dispersion as a function of the location in the BPT diagram (figure 8). Below the criterion of Kauffmann et al. (2003b), the velocity dispersion is low, typically less than |$\sigma _{[\rm {O\,{\small III}}]}=100\:$|km s−1. The velocity dispersion is higher in the upper right-hand direction in the BPT diagram, reaching up to ∼250 km s−1 at |$\log ({[\rm{O\,{{\small III}}}]}\lambda 5007/\rm{H}\beta ) \sim 1$|. At |$\log ([\rm{N\,{{\small II}}}]/\rm{H}\alpha ) > 0.0$| and |$\log ([\rm{O\,{{\small III}}}]/\rm{H}\beta ) = 0.0$|–0.5, where LINERs are distributed, the velocity dispersion is moderately high (∼200 km s−1) though the electron density is low (figure 7). The high-velocity dispersion of LINERs is naturally expected by the fact that LINERs are preferentially seen in massive elliptical galaxies (e.g., Heckman 1980; Ho et al. 2003) and sometimes associated with fast shocks (e.g., Dopita et al. 1997; Rich et al. 2010, 2011). At the lower edge of the distribution of composite galaxies, the velocity dispersion is not specifically high (i.e., ∼100 km s−1), which is contrary to the distribution of the electron density shown in figure 7.
![Same as figure 7 but for the velocity dispersion of the ${[\rm{O\,{{\small III}}}]}\lambda 5007$ emission line. (Color online)](https://oup.silverchair-cdn.com/oup/backfile/Content_public/Journal/pasj/73/4/10.1093_pasj_psab065/2/m_psab065fig8.jpeg?Expires=1749171716&Signature=M-aMKUK9xHqxVz7F7loIx5Mbf~-qTzZcq-tymGx~H9tZEkWJGD7JivAKMlWfx7sIKndVhUX~AYrOUJvQRmJ~ECt3NgvuARp9gs1et8-8a-RvHSdci6UsNAb6nhLkKCn5MxGUD5i9BuAnReq6FCuQ1Mk~p9vgzMaUhSWhkMfddHFYGGuybVyzapiXfj4ICK-LSX1RyC-lasqsmsP8EXXimC8oy6D7tmmhuRJpRcipq~P~qKHWq1DKWkevzOet0afN~unUVkS4hXcLIGI0ohE3rl1-m4ZjdOLj03jl4huc9p~P9TfofAAEUBao3~G~4Nl~DepkVRqtkyPSHuND60FFxA__&Key-Pair-Id=APKAIE5G5CRDK6RD3PGA)
Same as figure 7 but for the velocity dispersion of the |${[\rm{O\,{{\small III}}}]}\lambda 5007$| emission line. (Color online)
3.3 [O iii] velocity dispersion vs. stellar mass in the central and off-central regions
In subsection 3.2, it is clearly shown that the velocity dispersion is larger in Seyfert galaxies than in star-forming galaxies (figure 8). However, it is unclear whether this is caused by the AGN outflow, because the velocity dispersion is largely affected by the stellar mass of galaxies and thus a mass-matched comparison is needed to study the effect of the AGN outflow. Even if the larger velocity dispersion of Seyfert galaxies is attributable to the AGN outflow, it is unclear where the AGN outflow makes the velocity dispersion larger in their host galaxies because the SDSS fiber spectroscopic data lack the spatial information. Therefore, we study the velocity dispersion of ionized gas clouds by using the spatially-resolved spectroscopic data of MaNGA for 90 Seyfert galaxies and 801 star-forming galaxies (sub-subsection 2.2.2), and compare them in a mass-matched way.
Figure 9 shows the relation between the [O iii] velocity dispersion and the stellar mass for the Seyfert galaxies and the star-forming galaxies on the central region (left-hand panel; R/Rp < 0.7) and the off-central region (right-hand panel; 0.7 < R/Rp < 1.0), respectively. For both Seyfert galaxies and star-forming galaxies, the positive correlation between the [O iii] velocity dispersion and the stellar mass is seen for both the central and off-central regions, as expected. Interestingly, at a given stellar mass, Seyfert galaxies systematically show a larger velocity dispersion than star-forming galaxies, for both the central and off-central regions. This is clearly shown by the regression lines in figure 9. This result is consistent with a previous work by Woo et al. (2016), who reported an excess of the gas velocity dispersion with respect to the stellar velocity dispersion for SDSS type-2 Seyfert galaxies. In the central region (R/Rp < 0.7), the slope of the regression line is steeper for Seyfert galaxies than that for star-forming galaxies, suggesting that the excess in the velocity dispersion of Seyfert galaxies is more significant in objects with a larger stellar mass. Here we note that the results do not depend significantly on the threshold separating the central and off-central regions. The obtained results are qualitatively the same if we adopt R/Rp = 0.3, 0.5, or 0.8, instead of R/Rp = 0.7 as the boundary between the central and off-central regions.
![Velocity dispersion of ${[\rm{O\,{{\small III}}}]}\lambda 5007$ vs. stellar mass for 90 Seyfert galaxies and 801 star-forming galaxies from MaNGA sample. In the left-hand panel, the [O iii] velocity dispersion is derived by measuring the 75th percentile of all spaxels in the central region (R/Rp < 0.7). On the other hand, in the right-hand panel, the [O iii] velocity dispersion is derived by measuring the 75th percentile of all spaxels in the offset region (0.7 < R/Rp < 1.0). The green and grey lines show the regression line for Seyfert galaxies and that for star-forming galaxies, respectively. The green and grey shading show the $95\%$ confidence interval estimated by using the bootstrap method for Seyfert galaxies and for star-forming galaxies, respectively. (Color online)](https://oup.silverchair-cdn.com/oup/backfile/Content_public/Journal/pasj/73/4/10.1093_pasj_psab065/2/m_psab065fig9.jpeg?Expires=1749171716&Signature=OY5~fifJQMWC7GqbEnL3vmT3kCNoq5-kanyybB-dO~8xWqOQNJFonJwr-KxJt4stbJnQeNMjctEbBJDLUR~An-ikWZrHXzVAwUZNatqv199Ywk5VXioxuw-jKem2D5ovEGyKNOemqHEFBZtW7sMmJ3awX2o9uCwVOvGK548baj04E9gMMZuV8zLiR~SykcRR9epYSNc0l4ziUBIlr4im4BXGk8BJSs7hRzo0CKT6Ng3dc1USGQ2ZhdiNeiNGQug3JXUI4NzR9I6iYXFT9bwOs~qG-mi8p0Y2XJ3BuWrem9LN7ANbIKVzfJXAb8~G9xDFmFS-VNsvKZ3T7yrkXXnnug__&Key-Pair-Id=APKAIE5G5CRDK6RD3PGA)
Velocity dispersion of |${[\rm{O\,{{\small III}}}]}\lambda 5007$| vs. stellar mass for 90 Seyfert galaxies and 801 star-forming galaxies from MaNGA sample. In the left-hand panel, the [O iii] velocity dispersion is derived by measuring the 75th percentile of all spaxels in the central region (R/Rp < 0.7). On the other hand, in the right-hand panel, the [O iii] velocity dispersion is derived by measuring the 75th percentile of all spaxels in the offset region (0.7 < R/Rp < 1.0). The green and grey lines show the regression line for Seyfert galaxies and that for star-forming galaxies, respectively. The green and grey shading show the |$95\%$| confidence interval estimated by using the bootstrap method for Seyfert galaxies and for star-forming galaxies, respectively. (Color online)
The [O iii] velocity dispersion of one Seyfert galaxy (Mrk 622) is too large to be displayed within the range used in figure 9. The stellar mass of Mrk 622 is log (M*/M⊙) = 10.3, and its velocity dispersions at central and off-central regions are |$\sigma _{\rm {[O\,{\small III}]}} = 455\:$|km s−1 and 411 km s−1, respectively. Figure 10 shows the MaNGA [O iii] velocity dispersion map of Mrk 622. The velocity dispersion is very large (400–500 km s−1) at almost all spaxels in the central and off-central regions, i.e., not only at the nucleus of Mrk 622. Benítez et al. (2019) found that Mrk 622 has double or triple AGNs, which suggests that the galaxy has experienced a merger. Such merging events may enhance the velocity dispersion of gas clouds in the entire region of Mrk 622. Thus this object is very interesting in the study of the relation between the galaxy merger and AGN activity. We do not discuss this object further because this is beyond the scope of this paper.
![[O iii] velocity dispersion map of the Seyfert galaxy Mrk 622. The ellipses with R/Rp = 0.7 and 1.0 are shown on this map. (Color online)](https://oup.silverchair-cdn.com/oup/backfile/Content_public/Journal/pasj/73/4/10.1093_pasj_psab065/2/m_psab065fig10.jpeg?Expires=1749171716&Signature=OookDZRIwEP-eBF2zwkEsr6tFYjovE3Xpmqb4AIuPkS9WPHu6L4tts7lCX69v0-AGriXSJE143rKes2gQTgu-o1JwbwC9M4e0xTL9HaGhHN2HJTvfNXBRT9NlblPa6-4yPp6In3SNJ-qZB4mHnPaoTVAi7PypvFSfS-TzOY56mX-y9D8-ekoXcOM~9fcDsbKHWJO4aER0vh2vwbRZJ0QIn-7aF-CeSxj~o8MiNa-bdzUUTT0t3OiirZJIbS1DWOjYXyIahpXd1xtq6Ww~Na6alUBj4zYRZnykK2tpt1ifztUbVzjnzLdAxXH29BdgiIsRqwssugAhwp2BYlL0NOhpQ__&Key-Pair-Id=APKAIE5G5CRDK6RD3PGA)
[O iii] velocity dispersion map of the Seyfert galaxy Mrk 622. The ellipses with R/Rp = 0.7 and 1.0 are shown on this map. (Color online)
4 Discussion
4.1 Where do gas clouds in narrow-line regions come from?
In this study, using the large spectroscopic data set of the SDSS, we showed that the electron density and [O iii] velocity dispersion of gas clouds in NLRs of Seyfert galaxies are systematically higher than those in H ii regions of star-forming galaxies. Among Seyfert galaxies, objects with a higher [O iii]|$/$|Hβ flux ratio (inferring a larger ionization parameter) show higher electron density and [O iii] velocity dispersion. Here, we note that the trend of the velocity dispersion may be due to the bias of the stellar mass, because the stellar mass of AGNs is systematically higher than that of star-forming galaxies in our sample. Specifically, the averages and standard deviations of the stellar mass of the selected star-forming galaxies, composite galaxies, Seyfert galaxies, and LINERs are log (M*/M⊙) = 9.84 ± 0.58, log (M*/M⊙) = 10.59 ± 0.37, log (M*/M⊙) = 10.73 ± 0.35, and log (M*/M⊙) = 10.90 ± 0.36, respectively. To examine this concern, we separate the SDSS clean sample into stellar mass bins with Δlog (M*/M⊙) = 0.5, and then make a contour of the [O iii] velocity dispersion on the BPT diagram for each bin. As shown in figure 11, the [O iii] velocity dispersion of AGNs is systematically larger than that of star-forming galaxies by a factor of >2 even when objects with a similar stellar mass are 72.1 km s−1 and 117.6 km s−1 for the range of 10.0 < log (M*/M⊙) < 10.5 and 98.2 km s−1 and 148.8 km s−1 for 10.5 < log (M*/M⊙) < 11.0, respectively. Note that the [O iii] velocity dispersion of Seyfert galaxies with 10.0 < log (M*/M⊙) < 10.5 is larger than that of star-forming galaxies with 10.5 < log (M*/M⊙) < 11.0 (see also figure 11), suggesting that the higher velocity dispersion of Seyfert galaxies compared to star-forming galaxies cannot be explained only by the effect of the stellar mass.
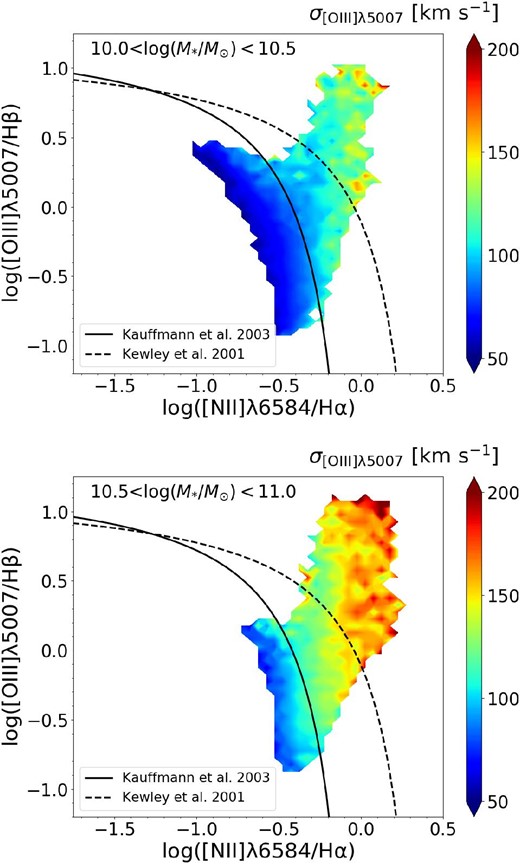
Same as figure 8, but only for galaxies with 10.0 < log (M*/M|$_\odot$|) < 10.5 (upper panel) and 10.5 < log (M*/M|$_\odot$|) < 11.0 (lower panel). (Color online)
The higher gas density and velocity dispersion of NLRs in Seyfert galaxies than those of H ii regions in star-forming galaxies cannot be easily explained by the picture that the origin of the NLR in Seyfert galaxies is gas clouds originally located there and ionized by the nuclear ionizing radiation. Instead, the observed properties of the NLR are more naturally understood by the scenario that the NLR gas clouds are originated at a much closer part of their nucleus, plausibly transferred by the AGN outflow. Wada, Yonekura, and Nagao (2018) theoretically showed that the spectral properties and the morphology of the NLR in the Circinus galaxy (a nearby archetypal type-2 Seyfert galaxy) can be explained by their radiation-driven fountain model, where the NLR gas clouds are transferred from the nucleus through the radiation-driven AGN outflow. In this model, the gas density and ionization parameter of the simulated NLR are typically ne ∼ 300–1500 cm−3 and U ∼ 0.01. The U parameter predicted by Wada, Yonekura, and Nagao (2018) corresponds to |$\log ({ [\rm{O\,{{\small III}}}]\lambda 5007/\rm{H}\beta })\sim 1$| (e.g., Groves et al. 2004), and therefore the simulated NLR properties are similar to the observed NLR properties of Seyfert galaxies specifically at the upper right-hand side of the BPT diagram (subsection 3.2; see also figure 7). Though this similarity supports the idea that the NLR clouds are originated in the AGN-driven outflow, the NLR simulated by the radiation-driven fountain model of Wada, Yonekura, and Nagao (2018) is much more compact (∼10 pc from the nucleus) than the NLRs in our SDSS sample. Further theoretical simulations for NLRs with a larger spatial scale are required to understand the origin of NLR gas clouds in more detail.
In subsection 3.3, we showed that the [O iii] velocity dispersion of Seyfert galaxies is systematically larger than that of star-forming galaxies at a given stellar mass. If this is due to the AGN-driven outflow, NLRs with the enhanced velocity dispersion should be characterized by a higher density than NLRs whose velocity dispersion is not large. To test this idea, we define “Seyfert galaxies with the enhanced velocity dispersion” as Seyfert galaxies whose [O iii] velocity dispersion at the off-central region is larger than +1σ from the typical velocity dispersion of star-forming galaxies (i.e., Seyfert galaxies above the dashed line in the left-hand panel of figure 12). Here we focus on the off-central region because the enhancement of the velocity dispersion of Seyfert galaxies in the off-central region is expected to be linked to the AGN outflow in the entire host-galaxy scale. According to this definition, the samples of Seyfert galaxies with and without the enhanced velocity dispersion consist of 53 and 34 objects, respectively. The right-hand panel of figure 12 shows the histograms of the electron density for both of these two samples. Here we show the two cases corresponding to different measurements of the electron density; measurements for the MaNGA central region (R/Rp < 0.7) and off-central region (0.7 < R/Rp < 1.0) at the 75th percentile of the electron density, respectively. Both cases show that the electron density of the sample with a higher velocity dispersion is systematically higher than that of the other sample. The medians of the electron density distribution in the logarithmic scale (cm−3) for the samples with and without the enhanced velocity dispersion are 2.42 and 2.25 in the case of the measurement for the MaNGA central region and 2.32 and 2.02 in the case of the measurement for the MaNGA off-central region, respectively. The p-values from the KS test for the two cases of the electron density measurement are 0.0039 and 0.0002 for the MaNGA central and off-central measurement, respectively. This suggests that the difference in the electron density is statistically significant in the case of the MaNGA off-central measurement, though the difference is statistically marginal in the case of the MaNGA central measurement. This result is consistent with the picture that the AGN outflow transfers high-density gas clouds from the nucleus to the host-galaxy scale that results in a high electron density and the velocity dispersion at the off-central region of Seyfert galaxies. However, it is also suggested that such AGN outflow does not work for all Seyfert galaxies, since some Seyfert galaxies show comparable velocity dispersion to star-forming galaxies with a similar stellar mass, in which cases the electron density of the NLR is not significantly high. The inferred relationship between the gas density and velocity dispersion of NLR clouds seems contrary to the result reported in Zhang, Liang, and Hammer (2013) (see section 1). This discrepancy is probably due to the effect of the stellar mass on the velocity dispersion, which is taken into account during our analysis but not in Zhang, Liang, and Hammer (2013).
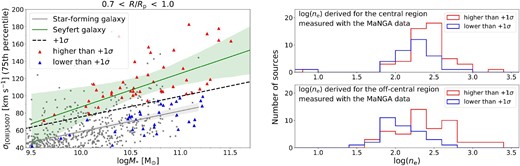
(Left) Same as the right-hand panel in figure 9 but the 1σ standard deviation above the regression line for star-forming galaxies is shown with a dashed line. (Right) Histograms of the electron density in Seyfert galaxies, derived for the central region (0.0 < R/Rp < 0.7; upper panel) and for the off-central region (0.7 < R/Rp < 1.0; lower panel) measured with the MaNGA data, taken at the 75 percentile. The red and blue lines denote the histograms for Seyfert galaxies whose velocity dispersion is larger and smaller than the +1σ relation (the dashed line in the left-hand panel), respectively. (Color online)
4.2 High-density gas in low-excitation composite galaxies
As shown in figure 7, composite galaxies with a low |$[\rm{O\,{{\small III}}}]\lambda 5007/\rm{H}\beta$| flux ratio show a significantly higher electron density, which is comparable to the electron density of Seyfert galaxies with a high |$[\rm{O\,{{\small III}}}]\lambda 5007/\rm{H}\beta$| flux ratio. Because the low |$[\rm{O\,{{\small III}}}]\lambda 5007/\rm{H}\beta$| flux ratio suggests a small ionization parameter, gas clouds in those composite galaxies are not exposed by the strong AGN power-law ionizing radiation. Therefore, it may be difficult to explain the density enhancement in those composite galaxies by the powerful AGN outflow.
One idea to explain this density enhancement is the gas compression by the radio jet (e.g., Wagner et al. 2012; Gaibler et al. 2012; Cresci et al. 2015), which is seen more frequently in AGNs with a low activity characterized by a low Eddington ratio (e.g., Sikora et al. 2007). To examine this possibility, we investigate the contribution of radio jets by using the data set of the Faint Images of the Radio Sky at Twenty cm survey (FIRST; Becker et al. 1995) which covers almost all (|$\sim\!\! 95\%$|) of the SDSS sky coverage. For simplicity, we here define the radio-loud AGN as an object whose rest-frame 1.4 GHz radio luminosity is higher than 1023 W Hz−1 (Best et al. 2005). Figure 13 shows the fraction of radio-loud objects as a function of location in the BPT diagram. First, it is clearly shown that the radio-loud fraction of star-forming galaxies is very low, as expected. A high radio-loud fraction is seen in Seyfert galaxies with a large |$[\rm{O\,{{\small III}}}]\lambda 5007/\rm{H}\beta$| flux ratio (located at the upper right-hand edge in the BPT diagram) and LINERs with a small |$[\rm{O\,{{\small III}}}]\lambda 5007/\rm{H}\beta$| flux ratio (at the lower right-hand edge in the BPT diagram). These two populations of radio-loud AGNs plausibly correspond to the dichotomy of high- and low-excitation radio galaxies (e.g., Best & Heckman 2012; Janssen et al. 2012; Pracy et al. 2016), given the clear difference in the |$[\rm{O\,{{\small III}}}]\lambda 5007/\rm{H}\beta$| flux ratio. Thus the observed high gas density of Seyfert galaxies with a large [O iii]|$/$|Hβ ratio (see figure 7) may be partly affected also by the gas compression due to the radio jet, not only by the transfer of high-density gas clouds from the nucleus (see subsection 4.1). On the other hand, the radio-loud fraction of composite galaxies with a low |$[\rm{O\,{{\small III}}}]\lambda 5007/\rm{H}\beta$| flux ratio is quite small, suggesting that the AGN radio jet is not the main contributor to the enhanced electron density of low-excitation composite galaxies. To understand the physical origin of the density enhancement in low-excitation composite galaxies, more thorough analyses based on multiple emission-line diagnostics including much fainter lines than the standard BPT lines will be required.
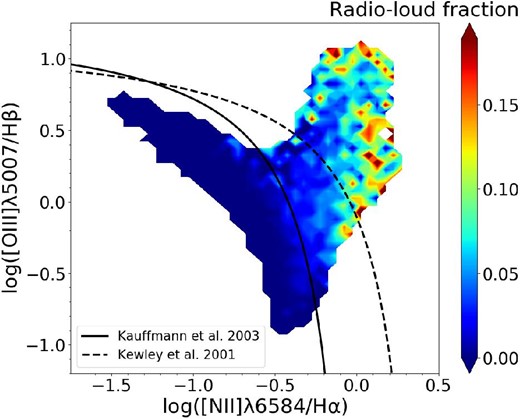
Same as figure 7 but for the radio-loud fraction. (Color online)
5 Summary
By utilizing large data sets of fiber-aperture and IFU spectroscopic data of low-redshift emission-line galaxies taken from the SDSS DR8 and MaNGA surveys, we investigated the physical and dynamical properties of ionized gas clouds. We summarize the main results as follows:
The SDSS spectroscopic data suggest that Seyfert galaxies are characterized by a higher electron density and [O iii] velocity dispersion than star-forming galaxies, while LINERs and composite galaxies show intermediate properties between Seyfert galaxies and star-forming galaxies.
The electron density and [O iii] velocity dispersion in NLRs of Seyfert galaxies are positively correlated with the |$[\rm{O\,{{\small III}}}]\lambda 5007/\rm{H}\beta$| flux ratio, suggesting that powerful AGN activity causes the enhanced electron density and velocity dispersion.
The [O iii] velocity dispersion in both central and off-central regions is higher than that of star-forming galaxies at a fixed stellar mass.
In the off-central region of Seyfert galaxies, a higher electron density is seen in Seyfert galaxies with an enhanced velocity dispersion than in those without an enhanced velocity dispersion.
All of these results support the idea that the gas clouds in NLRs of Seyfert galaxies come from the nucleus plausibly through the AGN outflow, as predicted by theoretical models such as the radiation-driven fountain model.
Acknowledgements
We thank the anonymous referee, whose comments were very useful to improve this paper. We also thank S. Koyama, A. Noboriguchi, and N. Tamada, for their fruitful comments. This research is financially supported by the Japan Society for the Promotion of Science (JSPS) KAKENHI 16H03958, 17H01114, 19H00697, and 20H01949. This research made use of ASTROPY, a community-developed core Python package for astronomy.
Funding for the Sloan Digital Sky Survey III (SDSS-III) and IV (SDSS-IV, in which the MaNGA survey was carried out) has been provided by the Alfred P. Sloan Foundation, the U.S. Department of Energy Office of Science, the National Science Foundation, and the Participating Institutions. SDSS-IV acknowledges support and resources from the Center for High-Performance Computing at the University of Utah. The SDSS web site is www.sdss.org. SDSS-III and SDSS-IV are managed by the Astrophysical Research Consortium for the Participating Institutions of the SDSS Collaboration including University of Arizona, the Brazilian Participation Group, Brookhaven National Laboratory, the Carnegie Institution for Science, Carnegie Mellon University, the Chilean Participation Group, University of Florida, the French Participation Group, the German Participation Group, Harvard-Smithsonian Center for Astrophysics, Instituto de Astrofísica de Canarias, the Michigan State/Notre Dame/JINA Participation Group, The Johns Hopkins University, Kavli Institute for the Physics and Mathematics of the Universe (IPMU)/University of Tokyo, the Korean Participation Group, Lawrence Berkeley National Laboratory, Leibniz Institut für Astrophysik Potsdam (AIP), Max-Planck-Institut für Astronomie (MPIA Heidelberg), Max-Planck-Institut für Astrophysik (MPA Garching), Max-Planck-Institut für Extraterrestrische Physik (MPE), National Astronomical Observatories of China, New Mexico State University, New York University, University of Notre Dame, Observatário Nacional / MCTI, The Ohio State University, Pennsylvania State University, University of Portsmouth, Princeton University, Shanghai Astronomical Observatory, the Spanish Participation Group, United Kingdom Participation Group, Universidad Nacional Autónoma de México, University of Arizona, University of Colorado Boulder, University of Oxford, University of Portsmouth, University of Utah, Vanderbilt University, University of Virginia, University of Washington, University of Wisconsin, Vanderbilt University, and Yale University.
Footnotes
The gas density of some NLR clouds significantly exceeds 104 cm−3 in some specific situations, such as at the innermost part of the NLR and in the high-redshift Universe (e.g., Ferguson et al. 1997; Nagao et al. 2001; Araki et al. 2012). Though such high-density clouds are not traced by the [S ii] doublet, we consider that such high-density NLR clouds are not abundant at the host-galaxy scale in the low-redshift Universe.
