-
PDF
- Split View
-
Views
-
Cite
Cite
Yasumasa Yamasaki, Sho Masui, Hideo Ogawa, Hiroshi Kondo, Takeru Matsumoto, Masanari Okawa, Koki Yokoyama, Taisei Minami, Ryotaro Konishi, Sana Kawashita, Ayu Konishi, Yuka Nakao, Shimpei Nishimoto, Sho Yoneyama, Shota Ueda, Yutaka Hasegawa, Shinji Fujita, Atsushi Nishimura, Takafumi Kojima, Keiko Kaneko, Ryo Sakai, Alvaro Gonzalez, Yoshinori Uzawa, Toshikazu Onishi, Development of a new wideband heterodyne receiver system for the Osaka 1.85 m mm–submm telescope: Corrugated horn and optics covering the 210–375 GHz band, Publications of the Astronomical Society of Japan, Volume 73, Issue 4, August 2021, Pages 1116–1127, https://doi.org/10.1093/pasj/psab062
Close - Share Icon Share
Abstract
The corrugated horn is a high-performance feed often used in radio telescopes. There has been a growing demand for wideband optics and corrugated horns in millimeter- and submillimeter-wave receivers as they improve observation efficiency and allow us to observe important emission lines such as CO in multiple excited states simultaneously. However, in the millimeter/submillimeter band, it has been challenging to create a conical corrugated horn with a fractional bandwidth of ∼60% because the wavelength is very short, making it difficult to make narrow corrugations. In this study we designed a conical corrugated horn with good return loss, low cross-polarization, and symmetric beam pattern in the 210–375 GHz band (56% fractional bandwidth) by optimizing the dimensions of the corrugations. The corrugated horn was installed on the Osaka 1.85 m mm–submm telescope with matched frequency-independent optics, and simultaneous observations of 12CO, 13CO, and C18O (J = 2–1, 3–2) were successfully made. We describe the new design of the corrugated horn and report the performance evaluation results including the optics.
1 Introduction
We have been conducting survey observations of 12CO, 13CO, and C18O (J = 2–1) in the Galactic plane using the Osaka 1.85 m mm–submm telescope at Nobeyama Radio Observatory (Onishi et al. 2013; Nishimura et al. 2015, 2020). As a new project, we are planning to extend the frequency band of the receiver to make maps of 12CO, 13CO, and C18O (J = 3–2) at the same time in addition to the previous observation lines. Our goal is to get closer to understanding the star formation process by statistically studying the physical properties of molecular clouds (kinetic temperature, hydrogen density, etc.). For this purpose, we are developing a wideband receiver that covers the frequencies 210–375 GHz (56% of the fractional bandwidth), where the above emission lines can be obtained simultaneously. The overall receiver development is described in Masui et al. (2021). This paper focuses on the horn and the optics, and describes their performance when installed on the telescope.
A typical optics in radio astronomy is the Cassegrain-type reflector antenna, and it is important to illuminate the sub-reflector with an appropriate edge taper, low cross-polarization, and low sidelobe level to achieve high aperture efficiency. To meet this request, we often use a corrugated horn as a feed (Olver et al. 1994). The corrugated horn produces a hybrid mode HE11 in which 98% of the radiation pattern is a fundamental Gaussian beam (Teniente et al. 2003). It has a low sidelobe level and low cross-polarization intensity, making it a suitable feed for millimeter- and submillimeter-wave optics. However, the corrugated horn has at least a few corrugations within a wavelength in the direction along the axis of symmetry with a depth of about 1/2 to 1/4 wavelength or sometimes deeper, and it is thus difficult to manufacture the corrugated horn, particularly in the millimeter and submillimeter band. It has been manufactured by electroforming or machining using an L-shaped tool. If the corrugation width is smaller and the aspect ratio, the depth over the width, is larger, machining becomes more difficult. Kimura et al. (2008) achieved high performance in the development in the 150 GHz band by cutting the throat section separately and press-fitting the product into the remaining part. This method is applied to the ALMA Band 4 receivers (Asayama et al. 2014). Corrugated horns with wider frequency bands are desired for the next-generation radio telescopes, and it is also important to accurately reproduce and fabricate the horns for broadband applications.
Corrugated horns are generally classified into conical (Zhang et al. 1993), which has a tapered structure, and profiled (Olver & Xiang 1988), which has a curved basic structure and normally has a more compact structure than a conical corrugated horn. Profiled corrugated horns have a more compact structure and a higher degree of freedom than conical corrugated horns, so that the profiled corrugated horn can be extended to a wider frequency range with intensive optimization. For example, in Lee et al. (2020), the design and measurement of a 275–500 GHz-band profiled corrugated horn (fractional bandwidth of ∼60%) were reported. The higher degree of freedom indicates the high complexity of the design. In addition, the frequency dependence does not follow clear patterns. It is a matter of the particular design, and therefore we need to be very careful in considering lots of frequencies in the design. On the other hand, the behavior is more “monotonic” in a conical corrugated horn.
The optics characteristics of a conical corrugated horn, such as the beam size and beam curvature radius, can be easily determined from the basic parameters: the flare angle of the horn and aperture size. Therefore, it is possible to control the Gaussian beam emitted by a conical corrugated horn regardless of the frequency. In the case of a profiled horn, a simulation is required for matching with the optics. Moreover, the manufacturing process for a conical corrugated horn is simple and time-saving, requiring only a cutting tool to hollow out a metal block and an L-shaped tool to cut the corrugations. Recent numerical simulation shows that a wideband conical or profiled corrugated horn with a fractional bandwidth of 50% or more can be realized by changing the depth (Gonzalez et al. 2017). A conical corrugated horn designed according to this idea has also been reported in the 67–116 GHz band (Yagoubov et al. 2020).
With this simplicity of design and fabrication, we adopt the conical corrugated horn for the broadband receiver system covering 210–375 GHz. In section 2, the frequency-independent optics of the 1.85 m telescope is presented. In section 3, the detailed design of the corrugated horn is described. In section 4, the measurement performance results are given, and commissioning observations on the telescopes are given in section 5.
2 Optics
The optics of the 1.85 m radio telescope is a beam propagation system based on the Nasmyth–Cassegrain focus (Onishi et al. 2013). It consists of a main reflector with a diameter of 1.85 m, a sub-reflector, two plane mirrors, and two ellipsoidal mirrors (figure 1). In order to cover the new frequency band, we updated the optics as shown below, and the physical parameters of the new optics are shown in table 1.
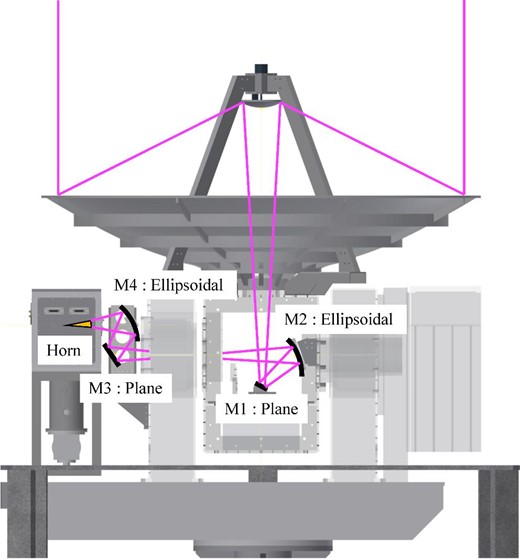
CAD drawing of the 1.85 m mm–submm telescope optics. The telescope is enclosed in a radome to protect it from rain, wind, and sunlight, and to minimize temperature changes that can degrade the performance. (Color online)
| Parameter . | Value (mm) . |
|---|---|
| Main reflector and sub-reflector: | |
| Focal length of main reflector | 740.00 |
| Diameter of sub-reflector | 185.00 |
| Interfocal distance of primary and secondary focus | 1180.00 |
| Distances: | |
| Sub-reflector to M1 (plane) | 1197.83 |
| M1 to M2 (ellipsoidal) | 202.17 |
| M2 to M3 (plane) | 825.00 |
| M3 to M4 (ellipsoidal) | 150.00 |
| M4 to horn aperture | 160.00 |
| Focal lengths of ellipsoidal mirrors: | |
| M2 | 192.28 |
| M4 | 131.93 |
| Horn parameters: | |
| Diameter of horn aperture | 8.00 |
| Slant length of horn | 32.49 |
The beam propagation system is required to couple the corrugated horn with the system without depending on the frequency. By keeping the beam size and radius of curvature of the Gaussian beam constant at the sub-reflector and horn aperture independent of the frequency it is possible to maintain high aperture efficiency throughout the bandwidth. We used the frequency-independent matching technique of Chu (1983), one of the design methods for frequency-independent optics. The beam size and radius of curvature at the sub-reflector and the diameter of the horn aperture were used as initial conditions for the design. The distances between the sub-reflector and M2, between M2 and M4, and between M4 and the horn were used as variables to find the optimal value of the radius of curvature at the horn aperture. As a result, the beam radius at the horn aperture was calculated to be 2.57 mm, and the radius of curvature 32.5 mm (Yamasaki et al. 2020). When using a conical corrugated horn with a tapered structure, the coupling rate with the most basic Gaussian beam is highest when the ratio of the radius of the Gaussian beam to the aperture radius in the aperture plane is 0.64, and the slant length is matched to the radius of curvature (see details in Goldsmith 1998). From these conditions, the aperture diameter of the corrugated horn was calculated to be 8 mm. The semi-flare angle can be calculated from the horn diameter and the slant length (see figure 3 for the definitions of the parameters) and was estimated to be 7.°07. Figure 2 shows the relationship between the distance from the sub-reflector and the beam sizes at 210, 290, and 370 GHz. It is confirmed that the beam sizes at the sub-reflector and the horn aperture are constant regardless of the frequency.
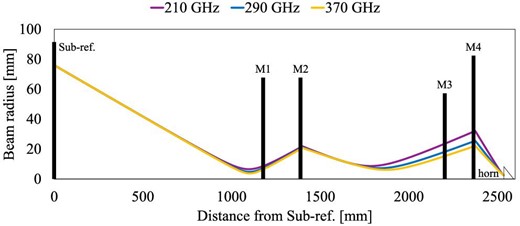
Beam radius at 1/e of the electric field peak of the Gaussian beam as a function of the distance from the sub-reflector to the horn. At the sub-reflector and the horn aperture, the beam radii of 210, 290, and 370 GHz are all equal. (Color online)
3 Corrugated horn
The aperture size and semi-flare angle of the corrugated horn were determined by the optics, as described in the previous section. The remaining basic structural parameter is the inner diameter of the circular waveguide. It determines the cutoff frequency of the propagating electromagnetic wave mode, which greatly affects the frequency response. If the diameter is small, the cutoff frequency shifts to a higher value, causing degradation of characteristics and low return loss on the lower-frequency side. Note that the return loss is a measure of the effectiveness of power delivery from a transmission line to a load (for the definition, see Bird 2009). Therefore, the higher the return loss, the better the circuit is matched, i.e. the reflected power is lower. On the other hand, if the diameter is large, the cutoff frequency of higher-order modes shifts to a lower value, causing higher-order modes on the high-frequency side. It is also necessary to match with the waveguide diplexer (Masui et al. 2020, 2021) connected immediately after the horn. As a result of the optimization based on the above, the diameter of the circular waveguide was set to 0.91 mm. The cutoff frequency of the basic mode TE11 is thus 192 GHz.
Next, the design procedure for the corrugation part is described. In the design of corrugated horns for radio telescopes, high return loss, low cross-polarization, and beam symmetry are required in order to efficiently irradiate the sub-reflector. The structure of the corrugations and their distribution determine the properties. Here, we set the goals of a return loss of 25 dB or better and a maximum cross-polarization of −30 dB or less at the simulation stage. When the mode propagation of the corrugated horn is “balanced hybrid,” the cross-polarized component is almost zero and an axisymmetric and low cross-polarized beam is emitted. The condition for this is the presence of a sufficient number of corrugations that are narrow and have a depth of about a quarter of the wavelength (Clarricoats & Olver 1984). In this design, the choice of the depths of the corrugation is not straightforward because we will cover a wide frequency range; the optimum length of a quarter of the wavelength depends on the frequency. A depth of less than a quarter of a wavelength will result in an induced reactance, leading to the propagation of the EH11 mode (Abbas-Azimi et al. 2009), so the lowest frequency of 210 GHz, corresponding to a wavelength of ∼1.4 mm, is assumed in the depth calculation. There are about 70 corrugations in total, and it is not realistic to analyze all the corrugations simultaneously, including their depth, width, and pitch. The corrugated horn can be divided into two parts (figure 3): the mode-conversion section that converts the TE11 mode in the circular waveguide to the HE11 mode in the corrugations, and the flare section that determines the radiation characteristics of the horn. The first part is important for the matching bandwidth, whereas the second part is important to achieve the cross-polarization bandwidth. We optimized the mode-conversion section and the flare section separately in order to achieve the target performance over a fractional bandwidth of 56%. A detailed analysis of each of these is discussed in the following sections. For these analyses we used CHAMP (TICRA), simulation software dedicated to corrugated horns and smooth-walled conical horns, which performs analyses based on the mode-matching method. With the software we can calculate S11 of the S-parameter, which is the negative of the return loss, and the beam pattern. The final horn parameters are summarized in table 2, and a photo is shown in figure 4.
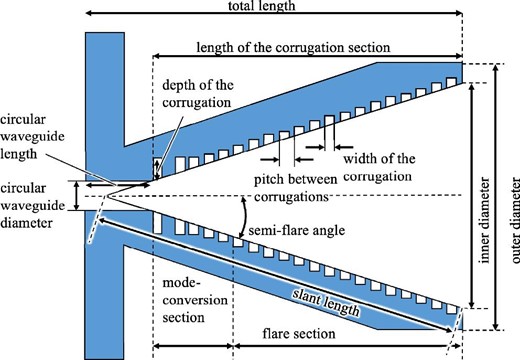
Model drawing of the cross-section of a corrugated horn. The number of corrugations shown is different from the actual number. The whole structure is divided into a mode-conversion section and a flare section. The definition of each parameter is shown. (Color online)
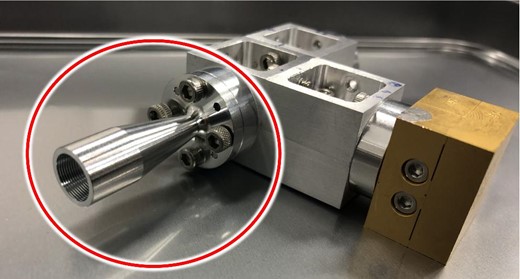
Photograph of the corrugated horn attached to the multiplexer described in Masui et al. (2021). (Color online)
| Parameter . | Value . |
|---|---|
| Total length | 31.44 mm |
| Aperture outer diameter | 10.00 mm |
| Aperture inner diameter | 8.00 mm |
| Corrugation section length | 28.44 mm |
| Semi-flare angle | 7.°07 |
| Circular waveguide length | 3.00 mm |
| Circular waveguide diameter | 0.91 mm |
| Corrugation pitch at flare section | 0.40 mm |
| Corrugation width at flare section | 0.25 mm |
| Corrugation pitch at mode-conversion section | 0.17–0.46 mm |
| Corrugation width at mode-conversion section | 0.13–0.27 mm |
3.1 Mode-conversion section
The propagation of electromagnetic waves is reciprocal. We consider here the input of a radio wave from a circular waveguide to a horn. The input electric field mode is considered to be the fundamental mode TE11 of the circular waveguide. The first five corrugations, which are the mode-conversion section, have a depth of λ/2–λ/4. When TM11 is excited in the section, and the ratio of the TE11 and TM11 modes becomes 85% to 15%, the axisymmetric hybrid mode HE11 is formed. The section also plays the role of impedance matching with the waveguide. The surface impedance of a corrugated waveguide with a corrugation depth of λ/4 is infinite, but that of a circular waveguide is zero, resulting in a large reflection. In the mode-conversion section, the first corrugation should have a depth of ∼λ/2, where the impedance is zero. Therefore, the depth of the mode-conversion section should change smoothly from λ/4 to λ/2 until reaching the flare section, which also affects how the mode conversion occurs. The basic concept of the corrugated horn was described, for example, by James (1981) and Dragone (1977). The mode-conversion section thus determines the overall performance of a corrugated horn. In particular, it was found to be decisive for the reflection characteristics, so we first optimized the return loss, i.e. impedance matching with the waveguide. When the pitch and width of the corrugations are constant, the maximum point of return loss is at 330 GHz, as shown in figure 5. The return loss is evident at lower frequencies close to the cutoff frequency. Therefore, we decided to change all the pitches, widths, and depths of the corrugations to optimize the performance. The depths, widths, and pitches of the mode-conversion section (number of corrugations: five) were parametrically analyzed by CHAMP to find the optimum values while the depth of the flare section was kept constant. We also set the constraint of the maximum aspect ratio, depth/width, of the corrugations. If the aspect ratio is large, the cutting error will be large because a thin tool needs to be inserted deeper. Therefore, when optimizing the depth, we set the condition that the aspect ratio should be less than 4. The optimized values from the automatic parametric analysis are presented in figure 5. The return loss is simulated to be higher than 25 dB over the fractional bandwidth of ∼56%. The detailed parameters of the optimized mode-conversion section (see figure 6 for a clear definition) are shown in table 3.
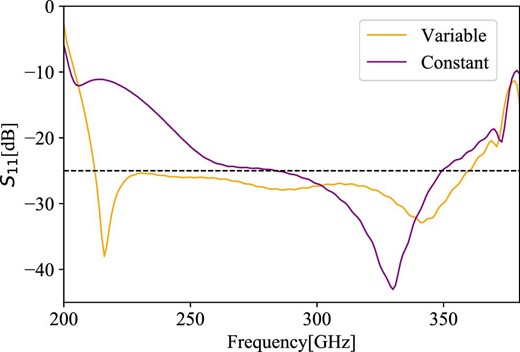
Frequency response of S11 when the width and pitch of the corrugations of the mode-conversion section are kept constant and when they are varied. In the constant case the return loss is poorer, especially at lower frequencies, but in the variable case it is improved. The vertical axis is S11 of an S-parameter from the CHAMP simulation, which is the negative of the return loss. (Color online)
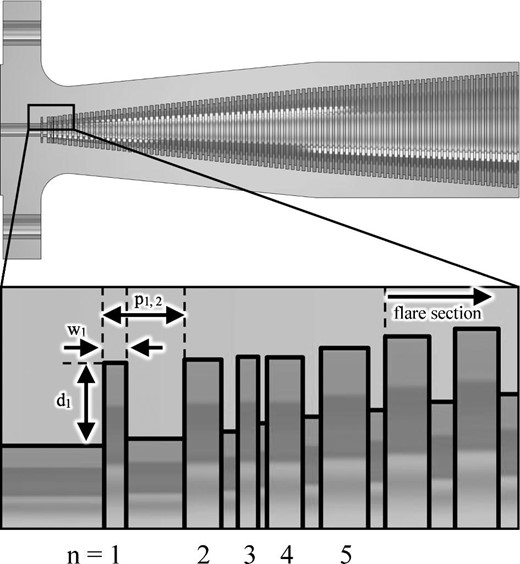
CAD drawing of the cross-section of the optimized mode-conversion section. It has variable pitches and widths. See table 3 for detailed corrugation parameters.
| n . | dn [mm] . | wn [mm] . | pn, n+1 [mm] . |
|---|---|---|---|
| 1 | 0.481 | 0.129 | 0.465 |
| 2 | 0.457 | 0.214 | 0.308 |
| 3 | 0.432 | 0.119 | 0.170 |
| 4 | 0.383 | 0.205 | 0.309 |
| 5 | 0.396 | 0.275 | 0.374 |
| n . | dn [mm] . | wn [mm] . | pn, n+1 [mm] . |
|---|---|---|---|
| 1 | 0.481 | 0.129 | 0.465 |
| 2 | 0.457 | 0.214 | 0.308 |
| 3 | 0.432 | 0.119 | 0.170 |
| 4 | 0.383 | 0.205 | 0.309 |
| 5 | 0.396 | 0.275 | 0.374 |
See figure 6 for the definitions.
| n . | dn [mm] . | wn [mm] . | pn, n+1 [mm] . |
|---|---|---|---|
| 1 | 0.481 | 0.129 | 0.465 |
| 2 | 0.457 | 0.214 | 0.308 |
| 3 | 0.432 | 0.119 | 0.170 |
| 4 | 0.383 | 0.205 | 0.309 |
| 5 | 0.396 | 0.275 | 0.374 |
| n . | dn [mm] . | wn [mm] . | pn, n+1 [mm] . |
|---|---|---|---|
| 1 | 0.481 | 0.129 | 0.465 |
| 2 | 0.457 | 0.214 | 0.308 |
| 3 | 0.432 | 0.119 | 0.170 |
| 4 | 0.383 | 0.205 | 0.309 |
| 5 | 0.396 | 0.275 | 0.374 |
See figure 6 for the definitions.
The outstanding feature of the optimized design is that the first corrugation is as narrow as 129 μm and is distant from the second corrugation. When the width and pitch were kept constant, and the depth is smoothly varied from λ/2 to λ/4, our simulation found that a narrower first corrugation resulted in a higher return loss at low frequencies. This may be because a narrower width results in better impedance matching with the circular waveguide, which improves the performance at low frequencies close to the cutoff frequency (see discussion in Zhang et al. 1993). A simple formulation of the design of the corrugations after the second corrugations is difficult, but it seems that complex fine-tuning is performed in the simulation to keep the insertion loss low over the whole bandwidth.
The fabrication accuracy was measured to be ±5 μm in the depth direction and ±10 μm in the axial direction. We also performed a tolerance analysis to check whether cutting errors will have a significant impact on the performance of the design. In order to assess the impact on the performance due to such errors, we first carried out a simulation by decreasing the depth of all the mode-conversion sections by 20 μm compared with the optimized design above as an example. In this case, the maximum return loss decrease is about 1 dB around 225 GHz. When the depth is 20 μm larger, the return loss falls short of 23 dB in the frequency band above 350 GHz. These results indicate that, considering the current machining performance, the performance degradation due to cutting error is small.
3.2 Flare section
After passing through the mode-conversion section, the signal enters the flare section. With the depth of the corrugation in the flare section fixed at the value of the last corrugation depth of the mode-conversion section, the maximum cross-polarization level was found to exceed −25 dB at 350–360 GHz. In order to improve this cross-polarization characteristic, the following three models were developed and compared through simulations (figure 7).
Constant: model with constant depth at the flare section.
Linear: model in which the depth decreases linearly at the flare section.
Gaussian: model in which the depth of a corrugation changes in proportion to the size of a Gaussian beam on the z-plane, assuming free-space propagation inside a corrugated horn.

Flare depth model used for optimization. The x-axis represents the number of corrugations counted from the waveguide side, and the first five are the mode-conversion section. The subsequent corrugation depths are shown for each of three models: “constant,” “linear,” and “gaussian.” (Color online)
“Gaussian” is a model based on the Gaussian-profiled horn antenna (GPHA). Salimi, Maghoul, and Abbasid (2013) optimized the GPHA model to follow and profile the propagation of Gaussian beams to achieve low sidelobes and maximum cross-polarization levels below −28 dB at 10–17 GHz. This idea is applied to the depth of the flare section. Assuming that the pitch and width of the flare are constant, three models are compared to achieve simulation results of higher than 25 dB return loss and less than −30 dB maximum cross-polarization.
The return loss is almost the same for “constant” and “gaussian,” but slightly lower for “linear” at low frequencies (20 dB; see figure 8). On the other hand, for cross-polarization, only “gaussian” achieved the target value over the entire band (figure 9). We thus adopted “gaussian” for the depths of the flare section.
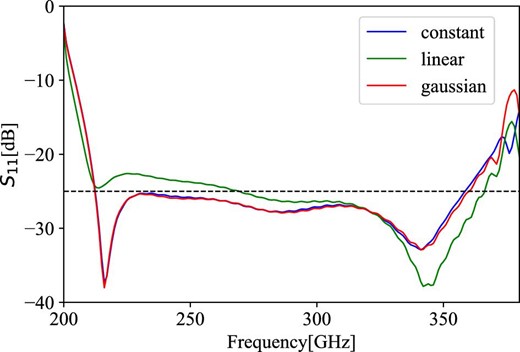
Comparison results of S11, the negative of the return loss, in which the flare depth was simulated by three models: “constant” model in blue, “linear” in green, and “gaussian” in red. (Color online)
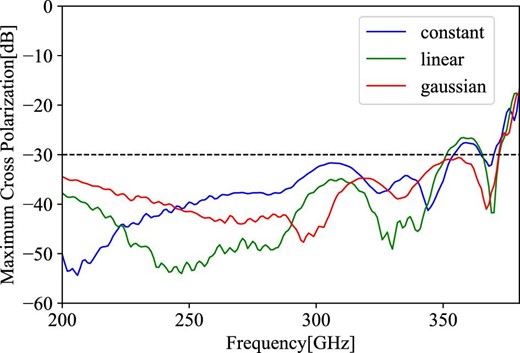
Frequency response of the maximum cross-polarization for the three simulated models: “constant” model in blue, “linear” in green, and “gaussian” in red. (Color online)
4 Performance of the corrugated horn
4.1 Return loss
We measured the S-parameter using a vector network analyzer (PNA-X) at the National Institute of Information and Communications Technology (NICT). The measurement system consisted of an signal generator (SG) that outputs in the 10–20 GHz band and an extender that multiplies them. Then, a short-open-load-through (SOLT) calibration, which is a standard calibration method for an S-parameter measurement system, of the two ports was performed. A black body inclined by 45° was placed at a distance of about 5 cm from the horn aperture at the measurement. The measurement system is different for frequencies lower and higher than 330 GHz. A WR-3.4 (0.864 × 0.432 mm) extender and a waveguide transition from WR-3.4 to a diameter of 0.91 mm, the diameter of the circular waveguide of the corrugated horn, were used for the measurement in 220–330 GHz. A WR-2.2 (0.570 × 0.285 mm) extender and waveguide transitions from WR-2.3 (0.580 × 0.290 mm) to WR-2.8 (0.710 × 0.356 mm) and WR-2.8 to a diameter of 0.91 mm were used in 330–380 GHz. Therefore, the result of the measured return loss is affected by the waveguide transitions, and is slightly different from the simulation result of the horn alone.
Here, we compare the measurement result with the simulated one. The red line in figure 10 shows the measurement results. The result of the S11 simulation of the corrugated horn is shown as the solid red line in figure 8. Although the measured S11 roughly matches the simulated one, there is a periodic response in the measured S11. This is because the waveguide transitions are attached to the corrugated horn, causing standing waves. We thus used WASP-NET from the Microwave Innovation Group for the simulation with the waveguide transitions included. In figure 10, the black broken line is the result of the simulation for the corrugated horn alone, which is confirmed to be identical to the CHAMP simulation in figure 8. The blue and green broken lines include the waveguide transitions, which roughly reproduces the standing wave by the waveguide transitions. The measured result is thus consistent with the simulation, and the return loss is measured to be 20 dB or better over the frequency range of 220–372 GHz.
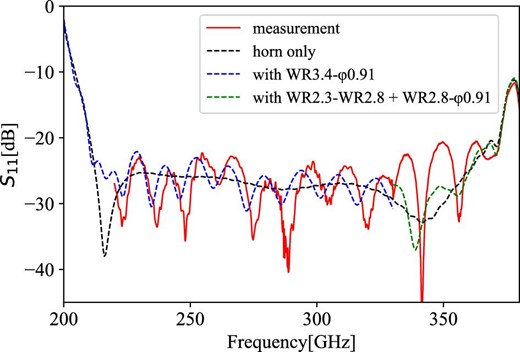
Comparison of measurement with simulation. The red line is the measured frequency response of S11, the negative of the return loss, and the broken lines are the simulation results by WASP-NET. Black shows the result without waveguide transitions, and blue and green with the waveguide transitions for 220–330 GHz and 330–380 GHz, respectively. (Color online)
4.2 Beam pattern of the horn
A reconfigurable beam measurement system (Gonzalez et al. 2016) in the Advanced Technology Center of the National Astronomical Observatory of Japan was used to measure the beam patterns (figure 11). The measurements were performed at three points: 230 and 345 GHz, which are the emission line frequencies of the 12CO molecule, and 285 GHz in between. The beam patterns of the far-field are obtained by Fourier transformation of the measured beam patterns of the near-field. The beam maps in the azimuth–elevation plane are shown in figure 12, and the cut patterns with three different cut angles (0°, 45°, and 90°) are shown in figure 13. The simulation results and measurements of the maximum cross-polarization level and half-power beam widths (HPBWs) are summarized in table 4. The V–H difference of the HPBW is less than 0.°2, which can be considered to be symmetric with respect to the axis and is in good agreement with the simulation. The cross-polarization levels are a bit higher than the simulation values; some are slightly above −30 dB, although this is not a level that affects the observation performance.
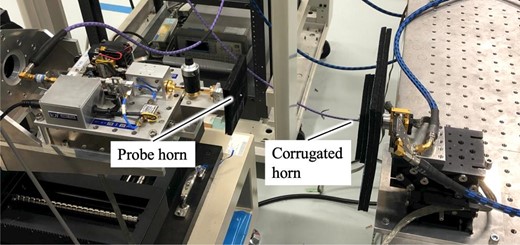
Photograph of the near-field beam pattern measurement. (Color online)
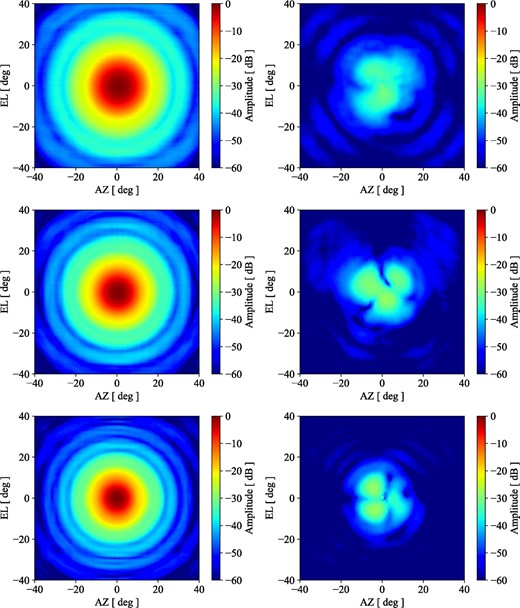
Measured beam patterns of the corrugated horn in azimuth and elevation axes. From top to bottom: measurement results at frequencies of 230, 285, and 345 GHz. The left panel is the pattern of the co-polarization, and the right panel the cross-polarization. (Color online)
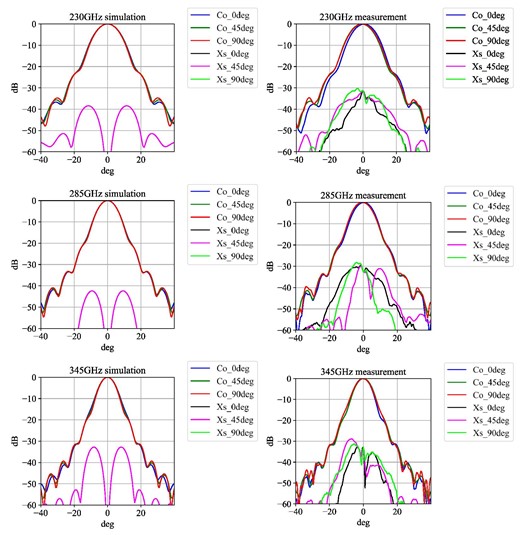
Cut patterns of figure 12 with three different cut angles (0°, 45°, and 90°). From top to bottom: measurement results at frequencies of 230, 285, and 345 GHz. The left panel is from the simulation, and the right panel is from the measurement. “Co” in the legend represents “co-polarization,” “Xs” is “cross-polarization,” and the cut angle follows. (Color online)
Parameters of the far-field beam patterns of the corrugated horn. Maximum cross-polarization levels [dB] and half-power beam width [°] in the V–H plane.
| Frequency . | 230 GHz . | 285 GHz . | 345 GHz . | |||
|---|---|---|---|---|---|---|
| . | Sim . | Mes . | Sim . | Mes . | Sim . | Mes . |
| Max Xs. pol | −38 | −30 | −43 | −28 | −33 | −28 |
| HPBW (V) | 6.2 | 6.0 | 5.0 | 5.0 | 4.1 | 4.1 |
| HPBW (H) | 6.3 | 6.1 | 5.1 | 5.0 | 4.3 | 4.3 |
| Frequency . | 230 GHz . | 285 GHz . | 345 GHz . | |||
|---|---|---|---|---|---|---|
| . | Sim . | Mes . | Sim . | Mes . | Sim . | Mes . |
| Max Xs. pol | −38 | −30 | −43 | −28 | −33 | −28 |
| HPBW (V) | 6.2 | 6.0 | 5.0 | 5.0 | 4.1 | 4.1 |
| HPBW (H) | 6.3 | 6.1 | 5.1 | 5.0 | 4.3 | 4.3 |
5 Evaluation of the corrugated horn and the optics on the 1.85 m telescope
We installed the horn/optical system developed in this study on the 1.85 m telescope and undertook simultaneous observation of six molecular lines (J = 2–1, 3–2) of CO isotopologues. The spectra toward Orion KL and the on-the-fly (OTF) mapping results are shown in Masui et al. (2021). Here, we derive the beam characteristics of the present system from the results of the commissioning observations from 2020 December to 2021 January with remote operation.
The peak antenna temperature in 12CO(J = 2–1) toward Orion KL observed by the present system is ∼45 K (Masui et al. 2021), which is the same as Nishimura et al. (2015) with a fluctuation of a few percent. The OTF mapping results in 12CO, 13CO, and C18O(J = 2–1) are also consistent, including the temperature scale with the fluctuation. For observations toward IRC +10216, which is significantly compact for the beam size, the peak antenna temperatures are the same, at about 1.2 K, within 10% for both the previous and the present systems, which indicates that both beam size and main beam efficiency are virtually unchanged at 230 GHz.
Next, we performed scan observations of the solar continuum level. By differentiating the intensity distribution at the edge of the Sun, it is possible to estimate the beam size (figure 14). As a result of the measurement, the HPBW was measured to be |$180^{\prime \prime } \pm {6{^{\prime \prime}_{.}}4}$| at 230 GHz and |$134^{\prime \prime } \pm {7{^{\prime \prime}_{.}}6}$| at 345 GHz. It is to be noted that saturation can occur at the SIS mixer or the IF chain because they are not designed for calibration with the Sun. Since the antenna temperature of the Sun observed in the 345 GHz band is obviously lower than in the 230 GHz band (figure 14), the output at 345 GHz may have been largely saturated. We also note that beam measurements by planet scan could not be carried out due to the continuum level instability. The estimated 230 GHz beam size from the solar scan is thus found to be consistent with the comparison with the previous CO observations described above. For 345 GHz, since there are no previous 345 GHz observations with the 1.85 m telescope that can be directly compared with the present observations, we check the beam efficiency and size at 345 GHz by comparing the present results with those of other telescopes below.

Upper panels: Azimuthal scans of the continuum level of the Sun. The vertical axis is the antenna temperature derived by the chopper-wheel method, and the horizontal axis is the displacement from the Sun center in arcminutes. The output from Board 2, covering 12CO(J = 2–1), is in the upper left, and Board 4, covering 12CO(J = 3–2), in the upper right. The numbering of the Boards is from Masui et al. (2021). Lower panels: Beam shapes derived by differentiating the upper results for Board 2 and Board 4. (Color online)
We compared our results with the 12CO(J = 3–2) observations toward IRC +10216 on a telescope with a relatively similar beam size (Tauber et al. 1989) to check the beam size at 345 GHz. The beam size in their observations was 87″, and the source is considered to be sufficiently smaller than the beam size. The integrated intensity map of IRC +10216 obtained with the 1.85 m telescope is shown in figure 15. The radial profile of the intensity of IRC +10216 can be assumed to be almost Gaussian, and its FWHM is 157″. From figure 4 of Tauber et al. (1989), the FWHM in their observation is ∼120″. If we subtract the contribution of their deconvolved size of the target from our FWHM of 157″, we obtain our beam size of 134″, which is consistent with that from the solar scan. Assuming the main beam efficiency of the telescope to be 60%, the peak antenna temperature expected from the model for an 87″ beam is ∼2.6 K (figure 6 in Tauber et al. 1989). Since the peak antenna temperature for sufficiently small targets is inversely proportional to the beam area, the peak antenna temperature for observations with a beam size of 134″ is estimated to be 1.1 K. The peak antenna temperature of the present observation is measured to be ∼1.0 K with an uncertainty of ∼10%, which corresponds to a main beam efficiency of ∼55% with an uncertainty of ∼10%.
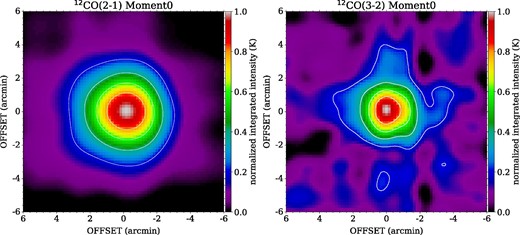
CO(J = 2–1 and 3–2) simultaneous on-the-fly observation results of IRC +10216 using the receiver with the corrugated horn and optics we developed. (Color online)
Next, to obtain the main beam efficiency at 345 GHz independently, we compare it with the peak antenna temperature of 12CO(J = 3–2) toward Orion KL with the Mount Fuji telescope, which has a beam size of 132″ and a Tmb of 67.8 K (Ikeda et al. 1999). By smoothing our OTF mapping results to the Mount Fuji telescope beam size, the peak antenna temperature is calculated to be ∼36.6 K, and thus the main beam efficiency is estimated to be ∼54%.
These results are summarized as follows; the beam size is ∼180″ and the main beam efficiency is ∼71% in the 230 GHz band, and the beam size is ∼134″ and the main beam efficiency ∼54% in the 345 GHz band. The designed values of the beam size at 230 GHz and 345 GHz are 172″ and 112″, respectively. The beam size at 230 GHz is consistent within 5%, while that at 345 GHz is about 20% larger.
To investigate the cause of this large beam size at 345 GHz, we simulated the effect of displacement of the sub-reflector with respect to the main reflector. The beam size and beam efficiency are more affected by the displacement of the sub-reflector at higher frequencies. In the simulation, the displacement of the sub-reflector that makes the beam size 134″ at 345 GHz is 0.7 mm. Based on the aperture efficiencies with the displacement, the main beam efficiencies at 230 GHz and 345 GHz are calculated to be 84% and 76%, respectively, using the formula of Maddalena (2010) and assuming ηR = 1. The degradation of the main beam efficiencies is caused by the surface roughness of the main reflector, misalignment of the optics, and the radome’s transmission loss. Here, we assume all of these factors are caused by the mirror surface’s roughness and determine the surface accuracy. Using the Ruze formula (Ruze 1966) and assuming a surface accuracy of 39 μm, the main beam efficiencies at 230 GHz and 345 GHz are calculated to be 73% and 55%, respectively, consistent with the present measurement results. The displacement of the sub-reflector this time seems to be due to the adjustment at 230 GHz, where the atmospheric condition at 345 GHz is far worse at Nobeyama Radio Observatory. If the sub-reflector can be set in the optimal location, the main beam efficiency is expected to be 69% and the beam size 112″ at 345 GHz. In summary, the measurement results on the beam are consistent with the designed performance when incorporating the sub-reflector displacement and the surface accuracy.
6 Summary
We developed a broadband conical corrugated horn and the corresponding optical system for the Osaka 1.85 m millimeter–submillimeter telescope covering the 210–375 GHz band, and demonstrated observations by using the system. The results of this paper can be summarized as follows:
By applying the frequency-independent matching technique, a beam propagation system with high aperture efficiency independent of frequency was designed. The semi-flare angle, aperture, and waveguide size of the conical corrugated horn were determined by the optics and subsequent components of the receiver.
A corrugated waveguide with a bandwidth of 210–375 GHz (56% fractional bandwidth) was designed. For a corrugated horn, it is necessary to carve corrugations sufficiently smaller than the wavelength, and since the wavelength is short in the mm–submm range, the flexibility in designing the corrugation is very limited. This makes the design of a wideband corrugated horn difficult in this frequency band. Therefore, we set a realistic limit on the corrugation design and focused on the following points. The return loss of the horn is improved by optimizing the width, pitch, and depth of the corrugations in the mode-conversion section consisting of the first five corrugations. The optimization was done by automated parametric analysis due to the large number of corrugation parameters. It was found that a narrower width of the first corrugation is important for smooth impedance matching, and the subsequent corrugation parameters need to be fine-tuned to have a better frequency response throughout the entire frequency range. The cross-polarization was reduced by changing the depths of the flare section with a Gaussian shape.
The fabricated corrugated horn measurements indicate that the return loss is better than 20 dB, and the cross-polarization lower than −25 dB throughout the frequency range of 220–372 GHz.
The developed system was installed on the Osaka 1.85 m mm–submm telescope, and simultaneous observations of 12CO, 13CO, and C18O (J = 2–1, 3–2) were successfully made. The beam size is ∼180″ and the main beam efficiency ∼71% in the 230 GHz band, and the beam size is ∼134″ and the main beam efficiency ∼54% in the 345 GHz band. The measurement results on the beam are consistent with the designed performance when incorporating the sub-reflector displacement and the surface accuracy. If the sub-reflector can be set in the optimal location, the main beam efficiency is expected to be 69% and the beam size 112″ at 345 GHz.
Funding
This work is supported by JSPS KAKENHI Grant Numbers JP18H05440, JP20J23670, JP15K05025, and JP26247026. This work was also supported by a Joint Development Research grant supported by the Research Coordination Committee, National Astronomical Observatory of Japan (NINS).
Acknowledgements
The authors are grateful to Issei Watanabe and Satoshi Ochiai of NICT for measuring the S-parameter of the corrugated horn. We are also grateful to Masanori Ishino of Kawashima Manufacturing Co., Ltd. (KMCO) for conducting the high-precision fabrication of the corrugated horn. We wish to thank the entire staff of the NRO, and all members of the 1.85 m telescope team, for installing and operating the receiver system. We would like to thank the referee, Dr. Noriyuki Kawaguchi, for helpful comments.


