


Abstract
The Galactic Center Lobe (GCL) is a peculiar object widely protruding from the Galactic plane toward the positive Galactic latitude, which had been found toward the Galactic Center (GC) in the early days of the radio observation. The peculiar shape has suggested a relation with historical events, star burst, large explosion, and so on in the GC. However, the issue of whether the GCL is a single large structure located in the GC region is not yet settled conclusively. In the previous observations, the silhouette against the low-frequency emission was found in the western part of the GCL (WPGCL); this suggests that the part is located in front of the GC region. On the other hand, the Local Standard of Rest (LSR) velocity of the radio recombination line toward it was found to be as low as 0 km s−1. However, these observations cannot determine the exact position on the line-of-sight. There is still another possibility that it is in the near-side area of the GC region. In this analysis, we compare these results with the visual extinction map toward the GC. We found that the distribution of the visual extinction larger than 4 mag clearly corresponds to the silhouette of the WPGCL. The WPGCL must be located at most within a few kpc from us and not in the GC region. This would be a giant H ii region in the Galactic disk.
1 Introduction
Peculiar objects have been observed toward the Galactic center (GC) region in wide wavelength regimes since the early days of the observation. Some of them are really located in the GC region and they provide irreplaceable information for the investigation of the structure and activity of the region. However, the other objects are not really located in the GC region. Although the objects are ordinary objects in the regions where they are really located, the misunderstanding that they are located in the GC makes them falsely identified as peculiar objects.
The Galactic Center Lobe (GCL) is a large-scale object found in the GC region (Sofue & Handa 1984). Its peculiar shape has suggested a relation with historical events, star burst, large explosion, and so on in the GC. However, it has also been advocated that the GCL is not a single large structure in the GC region, based on some circumstantial evidences. Especially, it is not yet settled conclusively where the western part of the GCL (WPGCL) is located in the line of sight (e.g., Tsuboi et al. 1986; Law et al. 2009; Nagoshi et al. 2019). Recently, new large radio telescopes at low frequency (MWA, MeerKAT, and so on) have started observing. The GC region has often been selected as their early observation targets. The peculiar shape of the GCL is imaged fascinatingly in their new maps (e.g., Heywood et al. 2019; Hurley-Walker et al. 2019). In these cases, improper discussions originating from the ambiguity of the location may waste our research resources. In order to dispel this anxiety, we attempt to solve this long-standing issue, making the best use of now-available data including the visual extinction (AV), in this Letter. Throughout this work, we adopt 8 kpc as the distance to the GC (e.g., Boehle et al. 2016); 1″ then corresponds to about 0.04 pc at that distance.
2 Existing observational results of the Galactic Center Lobe
The GCL has been observed by various telescopes since discovery. However, all the observational results obtained so far are not always consistent with each other. Here, we re-examine them.
2.1 Radio continuum images
Figure 1a shows the 3° × 3° continuum image at 10 GHz of the Galactic center region by the Nobeyama (NRO) 45 m telescope (Handa et al. 1987). The GCL had been found in the 10 GHz continuum image (Sofue & Handa 1984). The GCL is widely protruding from the Galactic plane toward the positive Galactic latitude as an Ω-shaped structure (broken line curves). This figure also shows the linear polarized intensity at 10 GHz (contours). The eastern part of the GCL (EPGCL) overlaps the positive latitude part of the polarized plumes (or polarized lobes; PPs) (Tsuboi et al. 1985, 1986; Seiradakis et al. 1985). On the other hand, the WPGCL seems to be rooted around Sgr C (also see figure 1c). Figure 1b shows the image of the degree of linear polarization (DLP) at 10 GHz (Tsuboi et al. 1986). Although the galactic plane is not polarized except for several spots, a high DLP up to DLP > 25% has been detected in the PPs. The EPGCL is mainly a non-thermal structure. The degree of linear polarization in the WPGCL is very low; DLP < 2%. The low DLP may be originated by Faraday depolarization of the foreground ionized gas, or the WPGCL may be the H ii region in the near-side region of the GC.
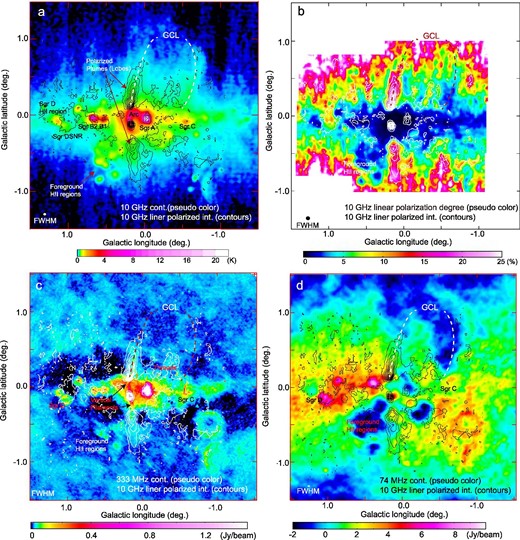
(a) 3° × 3° continuum image at 10 GHz of the Galactic center region by the Nobeyama 45-m telescope (Handa et al. 1987). The beam size in FWHM is 3′ × 3′ shown in the bottom left-hand corner. The contours show the linear polarized intensity at 10 GHz (Tsuboi et al. 1986). The first contour and interval are both 50 mJy beam−1 (0.019 K in TB). The broken line curves indicate the Galactic Center Lobe. (b) Image of the degree of linear polarization at 10 GHz (Tsuboi et al. 1986). (c) Continuum image at 333 MHz by VLA (LaRosa et al. 2000). The beam size in FWHM is 43″ × 24″, PA = 65° shown in the bottom left-hand corner. The 1 Jy beam−1 corresponds to 10700 K in TB. (d) Continuum image at 74 MHz by VLA (Brogan et al. 2003). The beam size in FWHM is 114″ × 60″ shown in the bottom left-hand corner. The 1 Jy beam−1 corresponds to 32600 K in TB. (Color online)
Figure 1c shows the continuum image of the Galactic center region at 333 MHz by the Karl G. Jansky Very Large Array (VLA) (LaRosa et al. 2000). The vertical filaments (VFs) of the Galactic Center Arc (Yusef-Zadeh et al. 1984; Yusef-Zadeh & Morris 1987), threads (e.g., Morris & Yusef-Zadeh 1985), and the linear non-thermal filaments of Sgr C (Liszt 1985) are clearly seen in the figure. The VFs have also been observed to interact with the Galactic center molecular clouds (GCMCs) (e.g., Yusef-Zadeh & Morris 1987; Tsuboi et al. 1997). Both of the inside ends of PPs connect to both ends of the VFs, which are located in the GC region or at least in the vicinity of the region. Although the southernmost part of the WPGCL positionally corresponds to the linear filaments of Sgr C, the WPGCL has no close connection with the other Galactic center objects, including the GCMCs and so on. The figure has negative emission areas around the strong positive emission areas because of the shortage of the short-baseline data. Nevertheless, the WPGCL is not identified as either a faint emission nor a silhouette feature against the extended continuum emission of the GC (Rickert et al. 2014). This disappearance of the WPGCL may be caused by the intensity difference between the WPGCL and surrounding emission decreasing at this frequency. Note that the WPGCL is detected as an emission at ∼1.3 GHz (Heywood et al. 2019) and as a silhouette at ∼150 MHz (Hurley-Walker et al. 2019).
Figure 1d shows the continuum image of the Galactic center region at 74 MHz by VLA (Brogan et al. 2003). The WPGCL is detected as a curved silhouette feature against the continuum emission at 74 MHz. On the other hand, the EPGCL has no such feature except for a weak feature on the negative longitude side of the PPs (Nagoshi et al. 2019, also see figure 9 in Hurley-Walker et al. 2019). Because the large part of the continuum emission at 74 MHz would come from the GC region through the non-thermal process and the temperature of the ionized gas in the WPGCL is low compared with the brightness temperature of the background continuum emission, the silhouette feature suggests that the WPGCL is located in front of the GC region or at least on the near side of the region. This is consistent with other silhouette features of the foreground H ii regions.
2.2 Ionized and molecular gas images
Figure 2a shows the image at 8.3 μm by the Midcourse Space Experiment (MSX) (Price et al. 2001). The contours indicate the silhouette features at 74 MHz (see figure 1d). The IR counterpart of the WPGCL can be identified (black arrow). This also corresponds to AFGL 5376, which is around |$l\sim - {0{^{\circ}_{.}}5}, b\sim {0{^{\circ}_{.}}5}$| in IR maps. Meanwhile, the EPGCL has no clear counterpart, although the “Double Helix Nebula” is identified (white arrow; Morris et al. 2006).
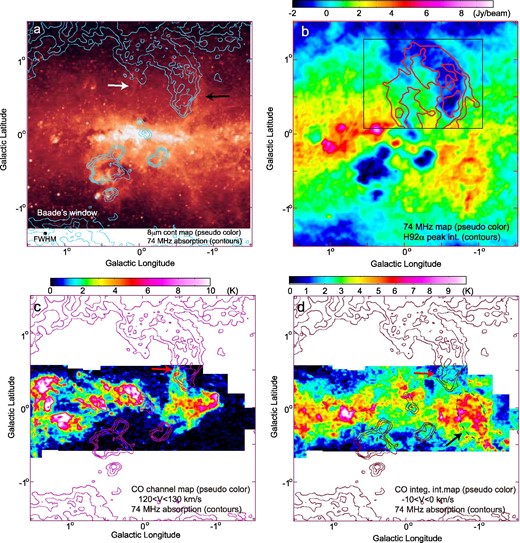
(a) 8 μm image of the Galactic center region by Midcourse Space Experiment (Price et al. 2001). The contours show silhouette features against the continuum emission at 74 MHz. (b) Continuum image at 74 MHz by VLA (Brogan et al. 2003). The contours show the distribution of the H92α radio recombination line (RRL) (Nagoshi et al. 2019). (c) Integrated intensity map with the velocity range of VLSR = 120–130 km s−1 in the CO J = 1–0 emission line by the NRO 45-m telescope (Oka et al. 1998). The contours show silhouette features against the continuum emission at 74 MHz. (d) Integrated intensity map with the velocity range of VLSR = −10–0 km s−1 in the CO J = 1–0 emission line. The contours show silhouette features against the continuum emission at 74 MHz. (Color online)
Figure 2b shows the comparison between the silhouette feature of the WPGCL at 74 MHz and the distribution of the H92α radio recombination line (RRL) (Nagoshi et al. 2019). The Local Standard of Rest (LSR) velocity of the H92α RRL is measured to be VLSR ∼ −4–10 km s−1 (also see Law et al. 2009). The distribution of the RRL clearly corresponds to the silhouette feature (Nagoshi et al. 2019). The velocity of ∼0 km s−1 in the WPGCL allows the possibility that it is in the area intervening between the GC and us, for example, foreground spiral arms. In addition, LSR velocity of the H 70α RRL toward the Sgr C H ii region has been observed to be VLSR ∼ −65 km s−1 (Liszt & Spiker 1995). The Sgr C H ii region is observed to be associated with the GCMCs with around this velocity (e.g., Tsuboi et al. 1991; Liszt & Spiker 1995). The velocity is different from that of the RRL toward the WPGCL as mentioned above. This suggests that there is no physical connection between the WPGCL and Sgr C.
Figure 2c shows the integrated intensity map with the LSR velocity range of VLSR = 120–130 km s−1 in the CO J = 1–0 emission line by the NRO 45 m telescope (Oka et al. 1998). The contours show the silhouette feature at 74 MHz. There is a molecular cloud positionally corresponding to the southernmost part of the WPGCL or AFGL 5376 (red arrow in figure 2c). The molecular cloud is identified in the velocity range of VLSR ∼ 110–140 km s−1 (Uchida et al. 1990); see also Oka et al. 1998). The large positive velocity suggests that the molecular cloud is located in the GC region. However, the velocity is different from the velocity of the RRL toward the WPGCL, VLSR ∼ −4–10 km s−1 (Nagoshi et al. 2019). This suggests that there is no physical connection between the WPGCL and the molecular cloud. On the other hand, figure 2d shows the integrated intensity map with the velocity range of VLSR = −10–0 km s−1. A faint molecular cloud in this channel map (red arrow) would exist around |$l\sim -{0{^{\circ}_{.}}5 }, b\sim {0{^{\circ}_{.}}5 }$| or the southernmost part of the WPGCL. The velocity of the molecular cloud is consistent with the velocity of the ionized gas in the WPGCL. The molecular cloud is extended up to |$b\sim {0{^{\circ}_{.}}8 }$| (see figure 4 in Takeuchi et al. 2010). This is thought to be the counterpart of the WPGCL. Another molecular cloud is located around |$l=-{0{^{\circ}_{.}}8 }, b=-{0{^{\circ}_{.}}2 }$| (broken line oval). This may be the negative latitude extension of the WPGCL.
3 Comparison with AV map
Figure 3 shows the AV map of the GC region based on the “Digitized Sky Survey” (DSS) (pseudocolor, Dobashi et al. 2005). The contours show the silhouette features at 74 MHz. There is an AV feature (black arrow) clearly corresponding to the silhouette of the WPGCL. The AV feature and silhouette must be different aspects of the same object. The DSS is the survey observation using visible light. The containing stars are located at most within a few kpc from us toward the GC because the farther stars are not seen by strong visual extinction near the galactic plane. Therefore the object which makes the AV feature must be located at most within a few kpc. That is, the WPGCL is not located in the nearside region of the GC because the distance to the GC is 8 kpc. In addition, another AV feature connecting the WPGCL is located around |$l=-{0{^{\circ}_{.}}8 }, b=-{0{^{\circ}_{.}}2}$| (broken line oval). This feature is thought to be the CO negative latitude extension of the WPGCL as mentioned in the previous section.


Acknowledgements
This work is supported in part by the Grant-in-Aids from the Ministry of Eduction, Sports, Science and Technology (MEXT) of Japan, No.16K05308 and No.19K03939. We are grateful to Dr. C. L. Brogan at NRAO for providing the FITS file of the continuum data by VLA at 74 MHz. This paper is partly based on the Av database by Prof. K. Dobashi at Tokyo Gakugei University. We thank him very much for providing the FITS file. This paper is partly based on the Southern H-Alpha Sky Survey Atlas.
References
