


Abstract
We investigated the chromospheric activity of 60 pre-main-sequence (PMS) stars in four molecular clouds and five moving groups. It is considered that strong chromospheric activity is driven by the dynamo processes generated by stellar rotation. In contrast, several researchers have pointed out that the chromospheres of PMS stars are activated by mass accretion from their protoplanetary disks. In this study, the Ca ii infrared triplet (IRT) emission lines were investigated utilizing medium- and high-resolution spectroscopy. The observations were conducted with Nayuta/MALLS and Subaru/HDS. Additionally, archive data obtained by Keck/HIRES, VLT/UVES, and VLT/X-Shooter were used. The small ratios of the equivalent widths indicate that Ca ii IRT emission lines arise primarily in dense chromospheric regions. Seven PMS stars show broad emission lines. Among them, four PMS stars have more than one order of magnitude brighter emission line fluxes compared to the low-mass stars in young open clusters. The four PMS stars have a high mass accretion rate, which indicates that the broad and strong emission results from a large mass accretion. However, most PMS stars exhibit narrow emission lines. No significant correlation was found between the accretion rate and flux of the emission line. The ratios of the surface flux of the Ca ii IRT lines to the stellar bolometric luminosity, |$R^{\prime }_{\rm IRT}$|, of the PMS stars with narrow emission lines are as large as the largest |$R^{\prime }_{\rm IRT}$| of the low-mass stars in the young open clusters. This result indicates that most PMS stars, even in the classical T Tauri star stage, have chromospheric activity similar to zero-age main-sequence stars.
1 Introduction
The chromosphere of a star is the region between the photosphere and corona. The temperature of the chromosphere gradually increases with radial distance from the photosphere; in the case of the Sun, it is from almost 4000 K at the bottom to 8000 K at the top (Vernazza et al. 1981). Because of these high temperatures, atoms emit some permitted lines like H α and Ca ii. Several high-spatial-resolution observations of the Sun have shown that in the chromosphere the abovementioned emission lines form under the influence of strong magnetic fields, such as faculae and plages near dark spots (Linsky 2017). The Hinode satellite has obtained space- and time-resolved images of the solar chromosphere and revealed its energetic activity (Katsukawa et al. 2007). Over a 30 yr period, Livingston (2007) showed that the fluxes of the Ca ii K, Hα, and He i lines were strong when the solar magnetic activity was high. These observations revealed the relationship between the emission line strengths and the chromospheric activity induced by the magnetic field.
For main-sequence stars, chromospheric activity is often discussed in relation to stellar rotation. It is claimed that chromospheric activity is driven by the magnetic field, which is generated by the dynamo process. Wilson (1978) showed that chromospheric activity analogous to that associated with the solar magnetic activity cycle is ubiquitous in stars along the lower main sequence. As mentioned in Noyes et al. (1984), rotation is not the only parameter related to the dynamo process: the stellar mass, spectral type, depth of convection zone, and convective turnover time (τc) are also related. These five parameters are included in the Rossby number (NR), which is defined as Pobs/τc, where Pobs is the stellar rotational period. According to the standard dynamo theory in Parker (1955), the magnetic activity at the stellar surface becomes stronger with increasing rotation speed and strength of differential rotation.
It is well established that young stars are fast rotators (e.g., Bouvier et al. 1990). Skumanich (1972) found that the luminosity of the Ca ii emission lines and the rotational velocity of solar-mass stars with an age of 107 yr are one order of magnitude larger than those of stars with age 1010 yr. Soderblom et al. (1993) revealed strong emission lines of the Ca ii infrared triplet (IRT; λλ8498, 8542, 8662 Å) of low-mass stars in a young open cluster, M45 (age 130 ± 20 Myr, 0.6–1.4 M⊙). Marsden, Carter, and Donati (2009) observed low-mass stars in young open clusters, IC 2391 and IC 2602, including rapidly rotating stars. The ages of IC 2391 and IC 2602 are 50 ± 5 Myr and 30 ± 5 Myr, respectively (Stauffer et al. 1997; Barrado y Navascués et al. 2004). The cluster members are considered to be on the zero-age main sequence (ZAMS) or in the last phase of evolving to ZAMS with a mass between 0.8 M⊙ and 1.5 M⊙. Soderblom et al. (1993) and Marsden, Carter, and Donati (2009) calculated |$R^{\prime }_{\rm IRT}$| from the equivalent widths (EQWs). |$R^{\prime }_{\rm IRT}$| describes the ratio of the surface flux of the Ca ii IRT emission lines to the stellar bolometric luminosity. They found that |$R^{\prime }_{\rm IRT}$| is constant at levels of around |$\log R^{\prime }_{\lambda 8498} \sim -4.4$|, |$\log R^{\prime }_{\lambda 8542} \sim -4.2$|, and |$\log R^{\prime }_{\lambda 8662} \sim -4.3$| for stars with log NR ≤ −1.1. These regions are called the saturated regime. For stars with log NR ≥ −1.1, |$R^{\prime }_{\rm IRT}$| decreases with increasing NR. This region is called the unsaturated regime. Marsden, Carter, and Donati (2009) suggested that the chromosphere is completely filled by the emitting region for stars in the saturated regime.
The idea that the activity of the chromospheres is driven by the dynamo process is widely accepted not only for low-mass main-sequence stars but also for pre-main-sequence (PMS) stars. However, several previous studies showed that a certain proportion of T Tauri stars (TTSs) are slow rotators. Vogel and Kuhi (1981) found that low-mass PMS stars (≤1.5 M⊙) generally rotate at less than 25 km s−1. White and Basri (2003) revealed that all of the low-mass TTSs in the Taurus–Auriga star-forming region are slowly rotating (vsin i < 30 km s−1). Hartmann et al. (1986) confirmed and extended the findings of Vogel and Kuhi (1981); they found that about 30% of the 0.5–1.0 M⊙ TTSs in Taurus have rotational velocities at or below 10 km s−1, and half have vsin i values between 10 and 15 km s−1. However, previous studies also showed that a fraction of TTSs exhibit strong Ca ii emission lines (Hartmann et al. 1986). Batalha and Basri (1993) constructed models of photosphere and chromosphere to fit the observed profiles of the Ca ii IRT emission line for TTSs with low accretion rates but null veiling. Those deep chromosphere models explain the emission characteristics of TTSs, showing a narrow emission profile over a broad absorption feature (Calvet et al. 1984; Batalha et al. 1996). Calvet and Gullbring (1998) found that shock heating of the photosphere by emission of chromosphere results in a temperature inversion and the temperature increases in the chromosphere, as shown by deep chromospheric models. In contrast, Moto’oka and Itoh (2012) found no clear correlation between the EQWs of the Ca ii IRT emission lines and stellar rotation velocity. As mentioned above, the rotation velocity is not the only parameter expected to be related to the dynamo process. The effective temperature (Teff), τc, and the spectral distribution of the continuum flux change as PMS stars evolve.
Another indicator for chromospheric activity of PMS stars is mass accretion from their protoplanetary disks. Moto’oka and Itoh (2012) found that the EQWs of the Ca ii IRT emission lines decrease with stellar evolution from classical TTSs (CTTSs), transitional disk objects, weak-line TTSs (WTTSs), to ZAMS stars. They also revealed that PMS stars with high mass accretion rates have strong Ca ii emission lines. Mohanty, Jayawardhana, and Basri (2005) investigated the chromospheric activity of CTTSs, very low-mass young stars (0.075 ≤ M* < 0.15 M⊙), and young brown dwarfs (M* ≤ 0.075 M⊙). The surface flux of the Ca ii emission line at λ8662 Å, |$F^{\prime }_{\lambda 8662}$|, exhibited correlation with the associated mass accretion rate, |$\dot{M}$|, for approximately four orders of magnitude. Hence, Mohanty, Jayawardhana, and Basri (2005) claimed that the Ca ii emission line is an excellent quantitative measure for the accretion rate. Hamann and Persson (1992) carried out optical spectroscopy for 53 TTSs and 32 Herbig Ae/Be stars. They interpreted narrow emission lines such as Ca ii and Mg i generated in the stellar chromosphere. The Ca ii IRT emission lines of several TTSs and Herbig Ae/Be stars also have a broad line component. This profile can be explained well by the magnetospheric accretion model (e.g., Muzerolle et al. 1998).
In this study we investigate the Ca ii IRT emission lines of 60 PMS stars with medium- and high-resolution spectral data. We compare the rotation–activity relationship of the PMS stars with that of low-mass stars in young open clusters. The chromospheric activity of the cluster members is considered to be induced by dynamo activity. In the next section we describe the observation and the data reduction procedures. In section 3 we present the results, and in section 4 we discuss the origin of the Ca ii IRT emission lines and the emitting region on the stellar surface.
2 Observations and data reduction
2.1 Stellar parameters
All the targets investigated in this study are listed in table 1. These 60 objects are associated with four molecular clouds or five moving groups; the Taurus–Auriga molecular cloud, the Orionis OB 1c association, the Upper Scorpius association, the Perseus molecular cloud, the TW Hydrae association, the η Chamaeleontis cluster, the “Cha-Near” region, the β Pictoris moving group, and the AB Doradus moving group. Hereafter, objects belonging to both molecular clouds and moving groups are called “low-mass PMS stars.” We did not observe binaries or triplets listed in Ghez, Neugebauser, and Matthews (1993), Leinert et al. (1993), Neuhauser et al. (1995), Kraus et al. (2009, 2012), Zuckerman and Song (2004), and Wahhaj et al. (2010).
Physical parameters of the PMS stars.*
| Object name | i | (B − V)0 | AV | L/L⊙ | T eff | Dist | vsin i | τc | |$\log \dot{M}$| | M * | M conv | Age | Telescope |
|---|---|---|---|---|---|---|---|---|---|---|---|---|---|
| [mag] | [mag] | [mag] | [K] | [pc] | [km s−1] | [×106 s] | [M⊙ yr−1] | [M⊙] | [M⊙] | [Myr] | |||
| (1) | (2)* | (3)* | (4)* | (5)* | (6)* | (7)* | (8)* | (9) | (10)* | (11) | (12) | (13) | (14)† |
| Taurus–Auriga molecular cloud | |||||||||||||
| AA Tau | 12.7 | 0.82 | 0.74 | 0.74 | 4060 | 136 | 12.7 | 20 | −8.48 | 0.5 | 0.0 | 1.0 | V |
| BP Tau | 11.0 | 1.01 | 0.34 | 0.46 | 4320 | 128 | 10.9 | 14 | −7.54 | 0.9 | 0.2 | 5.0 | V |
| CX Tau | 11.9 | 1.31 | 0.80 | 0.28 | 3417 | 127 | 19.1 | 19 | −8.97 | 0.3 | 0.0 | 1.0 | K |
| CoKu Tau4 | 12.6 | 1.30 | 1.75 | 0.11 | 4070 | 170 | 25.8 | 11 | −10.0 | 0.6 | 0.2 | 20.0 | K |
| DF Tau | 10.4 | 0.75 | 0.45 | 0.93 | 3665 | 124 | 18.4 | 19 | −7.62 | 0.3 | 0.0 | 0.3 | V |
| DG Tau | 11.5 | 0.54 | 1.30 | 0.34 | 3731 | 120 | 21.7 | 19 | −6.30 | 0.4 | 0.0 | 1.0 | N |
| DL Tau | 11.6 | 0.53 | 2.00 | 0.44 | 3998 | 158 | 19.0 | 21 | −6.79 | 0.6 | 0.0 | 2.0 | N |
| DM Tau | 12.6 | 0.82 | 1.10 | 0.18 | 3769 | 144 | 10.0 | 22 | −7.95 | 0.5 | 0.0 | 5.0 | K |
| DR Tau | 10.8 | 0.46 | 0.61 | 0.86 | 4327 | 194 | 10.0 | 21 | −6.50 | 0.7 | 0.0 | 1.0 | V |
| DS Tau | 11.3 | 0.78 | 0.34 | 0.43 | 4040 | 158 | 11.2 | 21 | −7.89 | 0.6 | 0.0 | 2.0 | K |
| FN Tau | 11.8 | 1.27 | 1.40 | 0.14 | 4250 | 130 | 6.4 | 7 | — | 0.7 | 0.5 | 30.0 | K |
| FP Tau | 12.0 | 1.55 | 0.20 | 0.24 | 3486 | 128 | 27.9 | 19 | −9.45 | 0.3 | 0.0 | 1.0 | K |
| GH Tau | 11.5 | 1.41 | 0.40 | 0.79 | 3580 | 140 | 25.2 | 19 | −7.92 | 0.3 | 0.0 | 0.5 | K |
| GM Aur | 11.2 | 1.10 | 0.31 | 0.55 | 4338 | 158 | 12.6 | 14 | −8.02 | 0.9 | 0.2 | 5.0 | K |
| GO Tau | 13.1 | 1.10 | 1.20 | 0.08 | 3984 | 143 | 19.2 | 4 | −7.93 | 0.6 | 0.5 | 70.0 | K |
| HBC 374 | 11.0 | 1.65 | 0.00 | 0.43 | 4007 | 125 | 12.9 | 21 | — | 0.6 | 0.0 | 2.0 | S |
| HBC 376 | 11.4 | 1.08 | 0.00 | 0.28 | 4389 | 121 | 68.0 | 5 | −8.92 | 0.8 | 0.6 | 30.0 | S |
| HBC 407 | 11.9 | 1.03 | 0.00 | 0.16 | 4649 | 125 | 8.8 | 3 | — | 0.7 | 0.6 | 70.0 | V |
| HBC 427 | 10.7 | 1.21 | 0.20 | 0.87 | 4249 | 148 | 10.0 | 21 | — | 0.7 | 0.0 | 1.0 | K |
| HD 285778 | 9.7 | 0.72 | 0.23 | 1.18 | 5358 | 119 | 17.6 | 6 | −8.03 | 1.3 | 1.0 | 7.0 | S |
| HP Tau | — | 1.55 | 0.39 | 0.29 | 3688 | 176 | 100.0 | 20 | −8.47 | 0.4 | 0.0 | 2.0 | V |
| IT Tau | 12.5 | 1.18 | 3.10 | 0.18 | 3913 | 161 | — | 13 | — | 0.7 | 0.2 | 10.0 | K |
| LkCa 04 | 11.3 | 1.38 | 0.35 | 0.40 | 3621 | 129 | 26.1 | 19 | −8.73 | 0.4 | 0.0 | 1.0 | K |
| LkCa 14 | 10.8 | 1.21 | 0.00 | 0.58 | 4218 | 127 | 21.9 | 22 | −8.85 | 0.7 | 0.0 | 2.0 | K |
| LkCa 15 | 11.0 | 1.08 | 0.60 | 0.64 | 4201 | 158 | 12.5 | 22 | −8.87 | 0.7 | 0.0 | 2.0 | K |
| LkCa 19 | 10.0 | 0.96 | 0.00 | 1.63 | 4784 | 158 | 19.8 | 16 | −10.0 | 1.2 | 0.2 | 2.0 | K |
| RY Tau‡ | 9.3 | 0.86 | 1.50 | 6.30 | 5750 | 133 | 48.8 | 3 | −7.11 | 1.8 | 1.7 | 5.0 | N |
| SU Aur | 8.9 | 0.58 | 0.90 | 4.31 | 4359 | 157 | 65.0 | 20 | −8.25 | 0.6 | 0.0 | 0.2 | V |
| UX Tau | 10.0 | 0.92 | 0.36 | 0.59 | 4427 | 139 | 9.9 | 19 | −9.00 | 0.9 | 0.1 | 3.0 | K |
| V1023 Tau | 11.0 | 1.24 | 1.35 | 0.43 | 4007 | 125 | 12.9 | 21 | −7.78 | 0.6 | 0.0 | 2.0 | N |
| V1204 Tau | 10.1 | 0.88 | 0.31 | 1.05 | 4800 | 138 | 22.5 | 9 | — | 1.2 | 0.6 | 5.0 | S |
| V1297 Tau | 10.8 | 0.72 | 0.28 | 0.44 | 5039 | 117 | 17.5 | 2 | — | 0.9 | 0.9 | 50.0 | K |
| V1321 Tau | 12.0 | 1.35 | 0.70 | 0.22 | 4042 | 146 | 11.2 | 7 | — | 0.7 | 0.5 | 30.0 | K |
| V1348 Tau | 11.3 | 1.09 | 0.00 | 0.41 | 4441 | 155 | 4.8 | 12 | — | 0.9 | 0.3 | 7.0 | K |
| V1840 Ori | 11.1 | 0.97 | 0.20 | 0.59 | 4617 | 149 | 14.5 | 10 | — | 1.0 | 0.5 | 7.0 | S |
| V830 Tau | 11.1 | 1.22 | 0.30 | 0.44 | 4020 | 130 | 26.6 | 21 | −8.10 | 0.6 | 0.0 | 2.0 | K |
| V836 Tau | 12.4 | 1.00 | 1.70 | 0.40 | 3631 | 168 | 13.4 | 19 | −8.98 | 0.4 | 0.0 | 1.0 | K |
| ZZ Tau | 11.9 | 1.22 | 1.00 | 0.16 | 4130 | 134 | 21.4 | 7 | — | 0.7 | 0.5 | 30.0 | K |
| Orionis OB 1c association | |||||||||||||
| HBC 167 | 10.4 | 0.70 | 0.00 | 7.32 | 5504 | 406 | 18.0 | 13 | — | 2.0 | 0.6 | 1.0 | V |
| Upper Scorpius association | |||||||||||||
| 1RXS J161951.4−215431 | 11.1 | 1.40 | 0.00 | — | 3746 | — | — | 2 | — | — | — | — | K |
| Perseus molecular cloud | |||||||||||||
| LkHα 86 | 14.4 | 1.44 | 0.00 | 0.14 | 3657 | 321 | 6.8 | 20 | — | 0.4 | 0.0 | 5.0 | K |
| LRL 72|$^{\S}$| | — | 2.24 | 0.00 | 0.51 | 3488 | 249 | 9.3 | 19 | — | 0.3 | 0.0 | 0.7 | K |
| AB Doradus moving group | |||||||||||||
| HIP 17695 | 9.8 | 1.51 | 0.00 | 0.04 | 3349 | 16 | 18.0 | 19 | — | 0.2 | 0.0 | 20.0 | V |
| β Pictoris moving group | |||||||||||||
| HD 197481 | 7.4 | 1.46 | 0.04 | 0.10 | 3652 | 9 | 8.0 | 21 | — | 0.4 | 0.0 | 10.0 | V |
| η Chamaeleontis cluster | |||||||||||||
| RECX 04 | 11.4 | 1.43 | 0.00 | 0.21 | 4023 | 99 | 6.0 | 13 | — | 0.7 | 0.2 | 10.0 | V |
| RECX 06 | 12.4 | 1.42 | 0.00 | 0.10 | 3525 | 97 | 20.9 | 19 | — | 0.3 | 0.0 | 5.0 | V |
| RECX 07 | 10.0 | 1.15 | 0.00 | 0.71 | 4325 | 98 | 30.0 | 22 | — | 0.8 | 0.0 | 3.0 | V |
| RECX 09 | 12.8 | 1.46 | 0.00 | 0.10 | 3933 | 97 | — | 9 | −10.4 | 0.6 | 0.3 | 30.0 | V |
| RECX 10 | 11.3 | 1.42 | 0.00 | 0.21 | 4088 | 97 | 9.0 | 7 | — | 0.8 | 0.5 | 20.0 | V |
| RECX 11 | 10.3 | 1.18 | 0.00 | 0.45 | 4392 | 98 | 13.0 | 12 | −9.77 | 0.9 | 0.3 | 7.0 | V |
| RECX 15 | 12.7 | 0.83 | 0.00 | 0.06 | 3719 | 91 | 28.0 | 11 | −9.09 | 0.5 | 0.2 | 30.0 | V |
| “Cha-Near” region | |||||||||||||
| RX J1147.7−7842 | 11.6 | 1.54 | 0.00 | 0.16 | 3881 | 106 | — | 9 | — | 0.7 | 0.4 | 20.0 | V |
| RX J1204.6−7731 | 11.8 | 1.52 | 0.00 | 0.16 | 3584 | 100 | 6.0 | 20 | — | 0.4 | 0.0 | 3.0 | V |
| TW Hydrae association | |||||||||||||
| TWA 01 | 10.0 | 0.89 | 0.27 | 0.26 | 4235 | 59 | 14.0 | 9 | −8.74 | 0.9 | 0.5 | 10.0 | V |
| TWA 06 | 10.3 | 1.23 | 0.27 | 0.21 | 4268 | 65 | — | 7 | — | 0.8 | 0.5 | 20.0 | V |
| TWA 07 | 10.0 | 1.46 | 0.00 | 0.08 | 4017 | 33 | 4.4 | 9 | — | 0.6 | 0.3 | 30.0 | V |
| TWA 14 | 11.3 | 1.27 | 0.10 | 0.20 | 3852 | 91 | — | 20 | — | 0.6 | 0.0 | 7.0 | V |
| TWA 22 | 11.3 | 1.73 | 0.00 | 0.01 | 2843 | 19 | 9.7 | 2 | — | 0.0 | 0.0 | 0.7 | V |
| TWA 23 | 10.6 | 1.50 | 0.05 | 0.14 | 3508 | 55 | — | 19 | — | 0.3 | 0.0 | 3.0 | K |
| TWA 25 | 9.9 | 1.34 | 0.24 | 0.22 | 4019 | 53 | 12.9 | 7 | — | 0.8 | 0.5 | 20.0 | V |
*References of parameters. (2) i-mag: UCAC4 Catalogue (Zacharias et al. 2013). (3) B − V: van Leeuwen (2007), Mayne et al. (2007), Manoj et al. (2006), Henden et al. (2016), Herbig and Bell (1988), Hanson (2003), and Davies et al. (2014). (4) AV: Kraus et al. (2009), Manoj et al. (2006), and Wahhaj et al. (2010). (5) and (6) Luminosity and Teff: Gaia DR2 (Gaia Collaboration 2018), Palla and Stahler (2002), Kenyon and Hartmann (1995), and Pecaut and Mamajek (2013). (7) Distance: Gaia DR2 (Bailer-Jones et al. 2018). (8) vsin i: Glebocki and Gnacinski (2005), Nguyen et al. (2012), Torres et al. (2006), and Messina et al. (2011). (10) |$\dot{M}$|: Najita, Strom, and Muzerolle (2007), Gullbring et al. (1998), White and Ghez (2002), Hartmann et al. (1998), Lawson, Lyo, and Muzerolle (2004), Calvet et al. (2004), and Ingleby et al. (2013).
†(14) The telescopes used for the observations. N: Nayuta Telescope; S: Subaru Telescope; K: Keck Telescope; V: VLT.
‡For RY Tau, AV, L/L⊙, Teff, and the distance were taken from Garufi et al. (2019).
§The original name is “Cl* IC 348 LRL 72.”
Figure 1 presents the Hertzsprung–Russell (HR) diagram of the PMS stars investigated. The filled circle symbols indicate PMS stars in molecular clouds. The open circles represent PMS stars in moving groups. The luminosity, Teff, and distance of the objects were taken from Gaia DR2 (Bailer-Jones et al. 2018). For objects whose Teff is not listed in Gaia DR2 (Bailer-Jones et al. 2018), we referred to other sources: Palla and Stahler (2002) for AA Tau, Kenyon and Hartmann (1995) for GH Tau, and Pecaut and Mamajek (2013) for HD 197481, RECX 09, and TWA 22. The solid lines indicate Canuto and Mazzitelli Alexander evolutionary tracks (D’Antona & Mazzitelli 1994). The stellar masses, M*, masses of the bottom of the convective zone, Mconv, and ages of the target stars were estimated from their evolutionary tracks. For example, objects with Mconv = 0 M⊙ are fully convective.
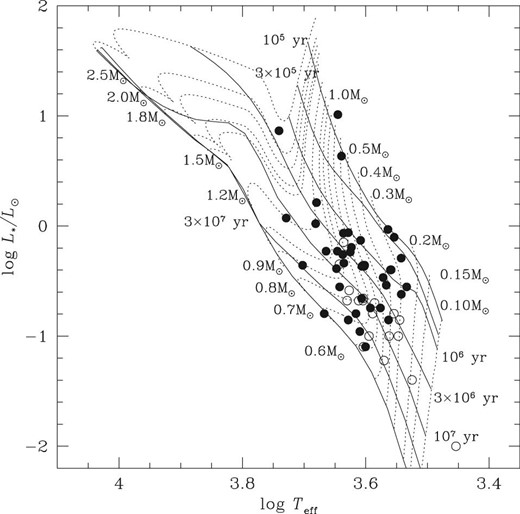
HR diagram of the PMS stars investigated. The solid lines are Canuto and Mazzitelli Alexander evolutionary tracks (D’Antona & Mazzitelli 1994). The filled circle symbols and the open circles indicate PMS stars in molecular clouds and moving groups, respectively.
2.2 Observations
The observations were conducted with the Medium And Low Long slit Spectrograph (MALLS) mounted on the 2.0 m Nayuta Telescope at the Nishi-Harima Astronomical Observatory (NHAO), Japan. The data for four PMS stars were obtained between 2017 December 5 and 2019 February 6 with the |${0{^{\prime \prime}_{.}}8}$|-width slit or the |${1{^{\prime \prime}_{.}}2}$|-width slit using the 1800 l mm−1 grating. These instrument settings achieved a wavelength coverage between 8350 Å and 9360 Å and a spectral resolution between 7500 and 9000. The integration time for each object was between 600 s and 1200 s.
High-resolution spectroscopic observations of five PMS stars were conducted on 2007 September 18 with the High Dispersion Spectrograph (HDS; Noguchi et al. 2002) mounted on the Subaru Telescope. The data were obtained using the StdNIRb mode and with the |${0{^{\prime \prime}_{.}}6}$|-width slit. These instrument settings achieved a wavelength coverage between 6650 Å and 9360 Å and a spectral resolution of 60000. The integration time for each object was between 600 s and 1500 s.
Archive data of 26 PMS stars and 5 standard stars obtained with HIRES mounted on the Keck Telescope was also used. The observer, date of the observations, wavelength coverage, and integration times are listed in table 2. The spectral resolution was 70000. The archive data of six PMS stars obtained with the UVES (R ∼ 40000) mounted on the Very Large Telescope (VLT) was also used. The program IDs, principal investigators, and dates of the observations are listed in table 2. The wavelength coverage was between 5655 Å and 9496 Å. The integration time for each object was between 10 s and 600 s. In addition, the archive data of 19 PMS stars obtained with the X-Shooter (R ∼ 8000) mounted on the VLT was also used. The wavelength coverage was between 5337 Å and 10200 Å. The integration time for each object was between 2 s and 600 s.
Details of the archive data from Keck/HIRES, VLT/UVES, and VLT/X-Shooter.
| Program ID | PI-observers | Observation dates | Wavelength | Integration time |
|---|---|---|---|---|
| Keck / HIRES | [Å] | [s] | ||
| C05H | N. Reid | 1999-06-16 | 7600–9910 | 100 |
| C77H | L. Hillenbrand | 1999-12-06, 07 | 6240–8680 | 1200–1500 |
| C109H | L. Hillenbrand | 2000-01-10, 11 | 6240–8680 | 300–900 |
| C240Hr | S. E. Dahm | 2007-11-30 | 4880–9380 | 460–1800 |
| C095Hr | S. E. Dahm | 2008-12-03, 04 | 4450–8900 | 10–1200 |
| N107Hr | I. Pascucci | 2012-12-01 | 4880–9380 | 300–3710 |
| C252Hr | L. Hillenbrand | 2013-12-26, 27 | 4880–9380 | 150–600 |
| C247Hr | J. Carpenter | 2015-06-01, 02 | 4880–9380 | 305–424 |
| C250Hr | L. Hillenbrand | 2016-05-17 | 4880–9380 | 22 |
| C226Hr | L. Hillenbrand | 2017-01-13 | 4880–9380 | 130 |
| VLT/UVES | ||||
| 075.C-0321(A) | M. Hempel | 2005-08-26 | 5655–9496 | 200 |
| 082.C-0005(B) | A. Scholz | 2008-10-02, 2009-01-08, 18 | 5655–9496 | 10–600 |
| VLT/X-Shooter | ||||
| 084.C-1095(A) | G. Herczeg | 2010-01-19, 2010-01-20 | 5337–10200 | 2–388 |
| 085.C-0238(A) | J. M. Alcala | 2010-04-06, 07 | 5337–10200 | 20–480 |
| 086.C-0173(A) | J. M. Alcala | 2010-01-12, 13 | 5337–10200 | 100–400 |
| 094.C-0327(A) | S. Alencar | 2015-01-16 | 5337–10200 | 120 |
| 094.C-0805(A) | G. Herczeg | 2015-01-15, 2015-03-07 | 5337–10200 | 24–600 |
| 094.C-0913(A) | C. F. Manara | 2014-12-05 | 5337–10200 | 320–400 |
2.3 Data reduction
The Image Reduction and Analysis Facility (IRAF) software package1 was used for data reduction. Overscan subtraction, dark subtraction, flat fielding, wavelength calibration using an Fe–Ne–Ar lamp, removal of scattered light, extraction of a spectrum, and continuum normalization were conducted for all the spectra obtained by MALLS.
The HDS data was reduced with overscan subtraction, bias subtraction, flat fielding, removal of scattered light, extraction of a spectrum, wavelength calibration using a Th–Ar lamp, and continuum normalization. A detailed description of the data reduction methods used here is presented in Takagi et al. (2011). The HIRES data was reduced with the Mauna Kea Echelle Extraction (MAKEE) package. The UVES data and X-Shooter data had already been reduced.
All object spectra were shifted to match the rest radial velocity. Therefore, we measured the wavelengths of two unblended Fe i absorption lines (λλ8468.404, 8621.598 Å), then shifted the wavelength of all spectra by the average of the difference between the measured wavelengths and laboratory wavelength.
In this study, inactive stars with a spectral type similar to that of the target object were used as template stars (the inactive stars library; Yee et al. 2017; Passegger et al. 2018). We obtained the Keck archive data of five inactive stars, ι Psc (F7), 16 Cyg (G3), HD 166 (G8), HD 88230 (K6), and GJ 412a (M1). For the correction of the rotational broadening, the spectra of the template stars were convolved with a Gaussian kernel to match the width of the absorption lines of each object. To estimate the amount of veiling, we measured the EQWs of Ti i, Fe i, and Cr i photospheric absorption lines between 8420 and 8700 Å (table 3). In table 3, absorption lines of several stars could not be measured because of the varying wavelength ranges of the individual data archives. If the amount of the veiling was estimated for more than five absorption lines, we calculated their mean values and residuals. Basri and Batalha (1990) claimed that the veiling is constant around 8500 Å. We assumed that each of the Ca ii IRT emission lines has the same veiling value as all the others. We substituted the EQW of the lines of the PMS spectrum for W, that of the template star for W0, and then obtained the amount of veiling for each absorption line. The average value of V and standard deviation σV were calculated (table 4). In the case that V − σ was negative or the veiling values were measured for less than five absorption lines, we regarded V as 0.
Absorption lines for estimating the amount of veiling.
| Wavelength [Å] | |
|---|---|
| Ti i | 8426.497 |
| Ti i | 8450.871 |
| Cr i | 8455.288 |
| Fe i | 8468.404 |
| Fe i | 8621.598 |
| Fe i | 8632.412 |
| Ti i | 8682.988 |
| Fe i | 8688.600 |
| Ti i | 8692.326 |
| Wavelength [Å] | |
|---|---|
| Ti i | 8426.497 |
| Ti i | 8450.871 |
| Cr i | 8455.288 |
| Fe i | 8468.404 |
| Fe i | 8621.598 |
| Fe i | 8632.412 |
| Ti i | 8682.988 |
| Fe i | 8688.600 |
| Ti i | 8692.326 |
EQWs, FWHMs of the Ca ii IRT emission lines (λλ8498, 8542, 8662 Å) and the veiling value.
| Object name | W IRT [Å] | FWHM [km s−1] | Veiling | ||||
|---|---|---|---|---|---|---|---|
| λ8498 | λ8542 | λ8662 | λ8498 | λ8542 | λ8662 | ||
| Taurus–Auriga molecular cloud | |||||||
| AA Tau | 0.65 ± 0.04 | 0.77 ± 0.04 | 0.61 ± 0.04 | 20 | 23 | 20 | 1.29 ± 1.20 |
| BP Tau | 1.05 ± 0.07 | 1.68 ± 0.12 | 1.15 ± 0.11 | 24 | 32 | 26 | 0.56 ± 0.40 |
| CX Tau | 0.59 ± 0.03 | 0.77 ± 0.04 | 0.72 ± 0.05 | 31 | 35 | 36 | −0.11 ± 0.20 |
| CoKu Tau4 | 0.53 ± 0.03 | 0.83 ± 0.04 | 0.6 ± 0.04 | 37 | 42 | 38 | — |
| DF Tau | 1.14 ± 0.15 | 2.02 ± 0.25 | 1.38 ± 0.19 | 33 | 55 | 45 | — |
| DG Tau | 49.49 ± 1.58 | 46.83 ± 1.74 | 51.39 ± 2.50 | 185 | 221 | 211 | — |
| DL Tau | 53.88 ± 8.14 | 50.65 ± 9.21 | 39.37 ± 7.89 | 249 | 271 | 250 | — |
| DM Tau | 1.02 ± 0.06 | 1.29 ± 0.09 | 1.07 ± 0.09 | 16 | 22 | 19 | −0.19 ± 0.18 |
| DR Tau | 53.1 ± 0.73 | 59.83 ± 0.75 | 49.03 ± 0.30 | 126 | 163 | 153 | 2.64 ± 1.48 |
| DS Tau | 0.75 ± 0.04 | 1.19 ± 0.06 | 1.05 ± 0.04 | 26 | 35 | 35 | 0.35 ± 0.32 |
| FN Tau | 1.32 ± 0.10 | — | 1.49 ± 0.14 | 20 | — | 28 | −0.18 ± 0.29 |
| FP Tau | 0.55 ± 0.04 | — | 0.55 ± 0.06 | 45 | — | 41 | — |
| GH Tau | 0.62 ± 0.04 | 0.72 ± 0.04 | 0.56 ± 0.03 | 38 | 40 | 37 | — |
| GM Aur | 0.73 ± 0.02 | 1.41 ± 0.02 | 1.15 ± 0.02 | 27 | 42 | 38 | 0.31 ± 0.16 |
| GO Tau | 0.62 ± 0.04 | 0.86 ± 0.05 | 0.72 ± 0.05 | 19 | 23 | 22 | −0.20 ± 0.16 |
| HBC 374 | 0.57 ± 0.03 | 0.97 ± 0.06 | — | 23 | 33 | — | — |
| HBC 376 | 0.67 ± 0.08 | 0.90 ± 0.08 | — | 95 | 111 | — | — |
| HBC 407 | 0.26 ± 0.01 | 0.33 ± 0.01 | 0.27 ± 0.01 | 24 | 27 | 25 | — |
| HBC 427 | 0.44 ± 0.02 | 0.58 ± 0.03 | 0.52 ± 0.04 | 25 | 32 | 31 | 0.07 ± 0.17 |
| HD 285778 | 0.24 ± 0.02 | 0.39 ± 0.04 | — | 26 | 41 | — | — |
| HP Tau | 0.56 ± 0.04 | 0.84 ± 0.05 | 0.72 ± 0.03 | 84 | 110 | 90 | — |
| IT Tau | 0.81 ± 0.03 | 1.05 ± 0.03 | 0.88 ± 0.06 | 55 | 61 | 58 | 0.12 ± 0.23 |
| LkCa 04 | 0.62 ± 0.05 | 0.92 ± 0.06 | 0.83 ± 0.07 | 51 | 68 | 67 | — |
| LkCa 14 | 0.54 ± 0.04 | 0.74 ± 0.04 | 0.62 ± 0.04 | 29 | 32 | 29 | — |
| LkCa 15 | 0.56 ± 0.02 | 0.58 ± 0.02 | 0.56 ± 0.05 | 22 | 26 | 23 | 0.25 ± 0.17 |
| LkCa 19 | 0.37 ± 0.02 | 0.51 ± 0.03 | 0.38 ± 0.03 | 32 | 36 | 31 | 0.40 ± 0.18 |
| RY Tau | 6.53 ± 1.57 | 4.94 ± 1.47 | 4.21 ± 1.17 | 222 | 220 | 170 | — |
| SU Aur | 1.11 ± 0.16 | 1.87 ± 0.19 | 1.51 ± 0.26 | 117 | 179 | 113 | — |
| UX Tau | 0.37 ± 0.02 | 0.49 ± 0.02 | 0.43 ± 0.03 | 40 | 41 | 45 | — |
| V1023 Tau | 0.88 ± 0.24 | 1.32 ± 0.29 | — | 43 | 53 | — | — |
| V1204 Tau | 0.37 ± 0.04 | 0.39 ± 0.03 | — | 35 | 36 | — | — |
| V1297 Tau | 0.30 ± 0.04 | 0.36 ± 0.04 | 0.28 ± 0.05 | 29 | 30 | 28 | — |
| V1321 Tau | 0.54 ± 0.02 | 0.73 ± 0.04 | 0.62 ± 0.04 | 19 | 24 | 22 | −0.32 ± 0.16 |
| V1348 Tau | 0.40 ± 0.04 | 0.54 ± 0.05 | 0.42 ± 0.05 | 18 | 25 | 20 | 0.31 ± 0.33 |
| V830 Tau | 0.75 ± 0.04 | 1.17 ± 0.06 | 0.79 ± 0.04 | 43 | 46 | 40 | −0.37 ± 0.14 |
| V836 Tau | 0.68 ± 0.05 | 0.84 ± 0.05 | 0.81 ± 0.06 | 28 | 40 | 34 | 0.08 ± 0.35 |
| ZZ Tau | 0.62 ± 0.07 | 0.84 ± 0.07 | 0.56 ± 0.08 | 28 | 33 | 35 | — |
| Orionis OB 1c association | |||||||
| HBC 167 | 1.93 ± 0.05 | 3.28 ± 0.08 | 2.43 ± 0.05 | 67 | 85 | 80 | 0.13 ± 0.26 |
| Upper Scorpius association | |||||||
| 1RXS J161951.4−215431 | 0.55 ± 0.06 | 0.84 ± 0.07 | 0.69 ± 0.06 | 43 | 52 | 43 | — |
| Perseus molecular cloud | |||||||
| LkHα 86 | 0.62 ± 0.04 | 0.85 ± 0.06 | 0.68 ± 0.06 | 15 | 20 | 18 | −0.24 ± 0.18 |
| LRL 72 | 0.47 ± 0.04 | 0.58 ± 0.08 | 0.44 ± 0.07 | 15 | 20 | 21 | −0.21 ± 0.19 |
| AB Doradus moving group | |||||||
| HIP 17695 | 0.42 ± 0.03 | 0.58 ± 0.06 | 0.41 ± 0.07 | 29 | 33 | 32 | — |
| β Pictoris moving group | |||||||
| HD 197481 | 0.57 ± 0.02 | 0.69 ± 0.03 | 0.56 ± 0.03 | 15 | 19 | 18 | — |
| η Chamaeleontis cluster | |||||||
| RECX 04 | 0.61 ± 0.07 | 0.84 ± 0.11 | 0.63 ± 0.08 | 23 | 31 | 25 | 0.08 ± 0.38 |
| RECX 06 | 0.59 ± 0.08 | 0.71 ± 0.12 | 0.51 ± 0.10 | 38 | 43 | 40 | — |
| RECX 07 | 0.58 ± 0.05 | 0.83 ± 0.07 | 0.67 ± 0.04 | 54 | 58 | 59 | — |
| RECX 09 | 0.49 ± 0.11 | 0.92 ± 0.15 | 0.66 ± 0.11 | 57 | 85 | 78 | — |
| RECX 10 | 0.52 ± 0.08 | 0.67 ± 0.09 | 0.51 ± 0.07 | 54 | 62 | 52 | 0.02 ± 0.21 |
| RECX 11 | 0.59 ± 0.03 | 0.87 ± 0.05 | 0.72 ± 0.05 | 52 | 63 | 61 | 0.41 ± 0.83 |
| RECX 15 | 9.28 ± 0.58 | 9.46 ± 0.58 | 7.32 ± 0.52 | 204 | 226 | 222 | 0.11 ± 0.40 |
| “Cha-Near” region | |||||||
| RX J1147.7−7842 | 0.57 ± 0.08 | 0.94 ± 0.09 | 0.63 ± 0.05 | 104 | 112 | 94 | — |
| RX J1204.6−7731 | 0.64 ± 0.05 | 0.87 ± 0.07 | 0.64 ± 0.05 | 21 | 27 | 22 | — |
| TW Hydrae association | |||||||
| TWA 01 | 1.03 ± 0.07 | 1.96 ± 0.08 | 1.72 ± 0.10 | 26 | 38 | 35 | 0.37 ± 0.55 |
| TWA 06 | 0.56 ± 0.03 | 0.90 ± 0.04 | 0.72 ± 0.05 | 80 | 85 | 83 | — |
| TWA 07 | 0.62 ± 0.04 | 0.73 ± 0.05 | 0.55 ± 0.06 | 19 | 24 | 20 | — |
| TWA 14 | 0.75 ± 0.05 | 1.15 ± 0.07 | 0.85 ± 0.07 | 66 | 81 | 76 | 0.03 ± 0.33 |
| TWA 22 | 0.55 ± 0.12 | 1.06 ± 0.18 | 0.80 ± 0.18 | 32 | 56 | 74 | — |
| TWA 23 | 0.36 ± 0.04 | 0.48 ± 0.06 | 0.29 ± 0.04 | 18 | 22 | 19 | −0.22 ± 0.19 |
| TWA 25 | 0.62 ± 0.02 | 0.82 ± 0.03 | 0.72 ± 0.03 | 24 | 27 | 26 | — |
For objects indicating a significant veiling value, we made a veiled spectrum of the template star. First, we added the veiling value V to the normalized spectrum of the template star. Then, the continuum component was normalized again to unity by dividing by (1 + V). The veiled spectrum of the template star was subtracted from that of the target star indicating a significant veiling value. For objects indicating V = 0, the spectrum of the template star which was not veiled was subtracted.
Figure 2 shows the procedures of the spectral subtraction of the Ca ii IRT lines of AA Tau. The solid line at the top of the panel shows the observed spectrum of AA Tau before subtraction of the spectrum of the template star. In this case, the Ca ii IRT lines display emission profiles over a broad absorption feature. The dotted line is the fitted spectrum of the veiled template star. The continuum components of both spectra were normalized to unity. The solid line in the bottom of the panel represents the observed spectrum of AA Tau after subtracting the spectrum of the template star. Any broad absorption feature was removed completely, and only the emission component remained. Unfortunately, any absorption lines (table 3) to measure the veiling value are not shown in figure 2. The spectra of most objects only contain emission components after this subtraction has been performed. The subtraction of the template spectrum is necessary for correct measurement of the EQWs for the Ca ii IRT emission lines.
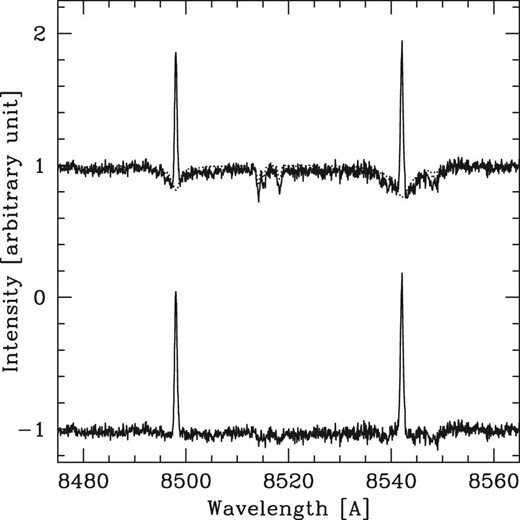
Emission profiles of the Ca ii IRT lines (λλ8498, 8542 Å). The observed spectrum of AA Tau is shown in the top of the panel with a solid line. The dotted line is the fitted inactive star, a K6 template star. The difference between the observed and template spectra is shown in the bottom of the panel, where the Ca ii IRT narrow lines appear in the emission. The difference between the AA Tau spectrum and the template star’s spectrum is shown shifted by −1.0 for display purposes. Note that all nine absorption lines used for estimating the amount of the veiling (table 3) are out of range for this figure.
Before measuring the EQWs, the continuum component of the spectra was added to unity. To obtain the EQWs of the Ca ii IRT emission lines, the area of the emission profile was directly integrated. We also measured their full width at half maximum (FWHM) by fitting with a Gaussian function. The EQW errors were estimated by multiplying the standard deviation of the continuum by the wavelength range of the emission line. The wavelength range for measuring standard deviation is λλ8483–8492 Å for the Ca ii λλ8498, 8542 Å lines and λλ8623–8632 Å for the Ca ii λ8662 line. These ranges are free from any emission and absorption lines. Also, for our discussion we only consider emission profiles with S/N larger than 3 for calculating EQWs, FWHMs, etc.
3 Results
The EQWs of the Ca ii IRT emission lines and their errors are listed in table 4. Seven objects have broad emission lines of Ca ii λ8498 Å (FWHM >100 km s−1), while most PMS stars exhibit narrow emission lines (FWHM ≤100 km s−1). Figure 3 shows the spectra of the λ8498 Å emission line after subtracting the photospheric absorption. The emission lines of DG Tau, DL Tau, and DR Tau are broad and strong (WIRT ∼ 50 Å), while those of RY Tau, SU Aur, RECX 15, and RX J1147.7−7842 are broad but not strong (WIRT < 10 Å). All EQWs of narrow emission lines are weaker than 5 Å. We note that part of the narrow emission component of the PMS stars could be buried by the photospheric absorption before removal. In our sample, most objects that belong to the moving group only have absorption lines before removal of the photospheric absorption.
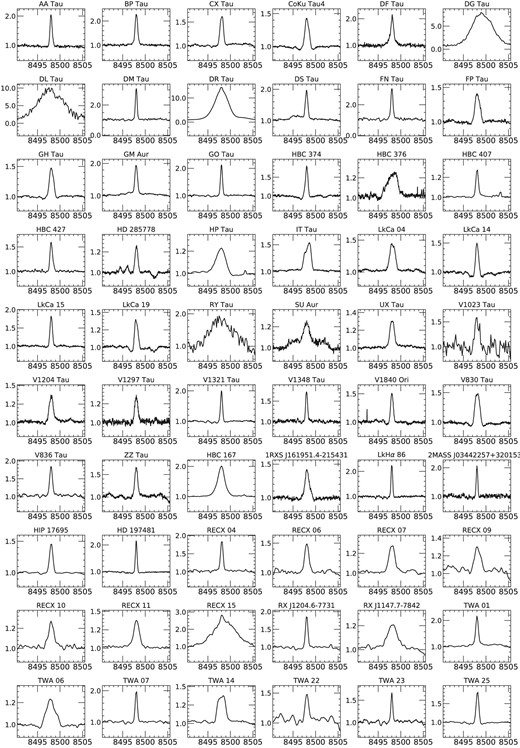
Ca ii IRT emission lines (λ8498 Å) of all the PMS stars. The spectra are normalized to unity. Photospheric absorption lines have already been subtracted.
We obtained the amount of veiling for 27 objects. Among them, the amount of veiling was measured in the previous studies for 13 objects. The correlation coefficient between the literature values and our measured values is 0.84. The literature value was found to be within the uncertainty of the measured V for eight objects. We note that on multiple occasions variation of the veiling value has been reported (Basri & Batalha 1990; Batalha et al. 1996; Hartigan et al. 1989, 1991).
4 Discussion
4.1 Emission line ratios of the Ca ii IRT lines
The ratios of the EQWs Wλ8542/Wλ8498 and Wλ8662/Wλ8498 are sensitive to the conditions of the emitting plasma. It has been shown that solar chromospheric plages and flares have the ratio of 1 ≤ Wλ8542/Wλ8498 ≤ 2 (Herbig & Soderblom 1980). In contrast, optically thin emission sources such as solar prominences have a high value of this ratio, Wλ8542/Wλ8498 > 4. In several studies (Herbig & Soderblom 1980; Hamann & Persson 1992), TTSs showed small line ratios of the Ca ii IRT emission lines, indicating dense chromospheric regions such as plages and flares.
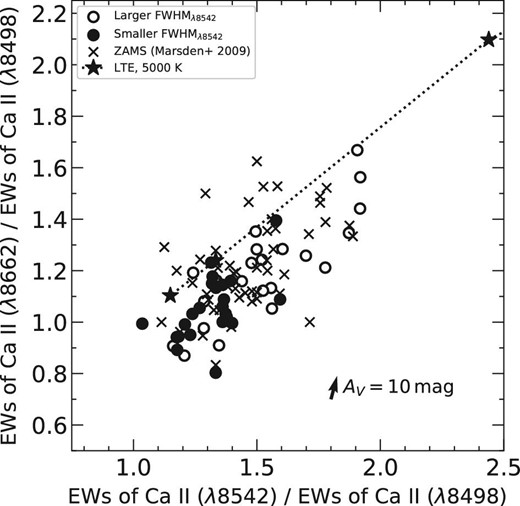
Ratios of the EQWs of the Ca ii IRT emission lines. The circle symbols represent the PMS stars in the molecular clouds and moving groups. The PMS stars are separated into two groups by the median of their FWHMλ8542; the open circles show the group of PMS stars with a broader FWHMλ8542 than the median. The filled circles represent the narrower group. The low-mass stars in the young open clusters IC 2391 and IC 2602 are plotted as cross symbols (Marsden et al. 2009). The dotted line represents isothermal slabs (T = 5000 K) in LTE (Herbig & Soderblom 1980; Hamann & Persson 1992). The black star symbols on the line correspond to slab optical depths of 10, 100, and 1000, beginning from the upper right. The arrow in the lower right is the redding vector with AV = 10 mag.
As shown in figure 4, the values of Wλ8542/Wλ8498 are 1.0–2.0 and Wλ8662/Wλ8498 are 0.7–1.7 for both the PMS samples and cluster members. This suggests that the emission originates from regions such as chromospheric plages and flares. Moreover, there is a tendency for emission lines showing relatively large Wλ8542/Wλ8498 to be broad. The large FWHM of the line suggests a large turbulent velocity (Hamann & Persson 1992).
Our results for the PMS stars are consistent with Herbig and Soderblom (1980), Hamann and Persson (1992), and Frasca et al. (2017). Frasca et al. (2017) investigated the ratio of the line flux, Fλ8542/Fλ8498, of Class II and Class III objects in the Lupus star-forming region. These objects have a low ratio of 1 < Fλ8542/Fλ8498 < 2. Not only the PMS stars in our sample but also the cluster members in IC 2391 and IC 2602 show a ratio of Wλ8542/Wλ8498 of 1.0–2.0, indicating that the Ca ii IRT emission lines are emitted from regions analogous to solar plages and flares.
The relationship between optical thickness and line broadening has been studied for the Ca ii HK emission lines. Hamann and Persson (1989, 1992) noticed that the Ca ii HK emission lines of the TTSs are stronger and broader than the Ca ii IRT emission lines. Their interpretation was that the Ca ii HK emission lines are optically thicker than the Ca ii IRT emission lines because the Ca ii HK emission lines are generally stronger than the Ca ii IRT emission lines. Cram and Giampapa (1987) calculated the Ca ii K line profile in the non-LTE chromospheric model. According to this model, with a small chromospheric mass column density, the Ca ii K line shows a narrow and weak emission. In the case where the mass column density increases, the Ca ii K line exhibits not only stronger but also broader emissions. Batalha and Basri (1993) constructed photospheric and chromospheric models to match the Ca ii HK and IRT emission line profiles of six PMS stars. They found that the lines are shaped by the mass and temperature of the photosphere, the chromospheric temperature and microturbulence, and the temperature gradient of the lower chromosphere. A broad absorption line with a narrow emission core at the line center was successfully reproduced in both CTTSs and WTTSs with the chromospheric models.
4.2 Chromospheric activity and mass accretion rate
We compared the strengths of the Ca ii IRT emission lines and mass accretion rates to discuss whether the chromosphere is activated by mass accretion from the protoplanetary disk.
Mohanty, Jayawardhana, and Basri (2005) investigated the chromospheric activity of CTTSs, very low-mass young stars (0.075 ≤ M* < 0.15 M⊙) and young brown dwarfs (M* ≤ 0.075 M⊙). They selected “accretors” by applying a number of accretion diagnostics, such as an Hα 10% width ≥200 km s−1. For the accretors, the surface flux of the Ca ii emission line, |$F^{\prime }_{\lambda 8662}$|, showed a positive correlation with their mass accretion rate, |$\dot{M}$|, for approximately four orders of magnitude. Hence, they claim that the mass accretion rate can be estimated using the strength of the broad components of the Ca ii IRT emission lines. In Mohanty, Jayawardhana, and Basri (2005), the mass accretion rates of CTTSs were taken from Muzerolle, Hartmann, and Calvet (1998) and White and Basri (2003), in which the rates were estimated from the amount of veiling in the U, V, and RC bands. For the very low-mass young stars and the young brown dwarfs, the mass accretion rates were taken from Muzerolle et al. (2003), in which the rates were estimated from the EQWs of the Hα emission lines.
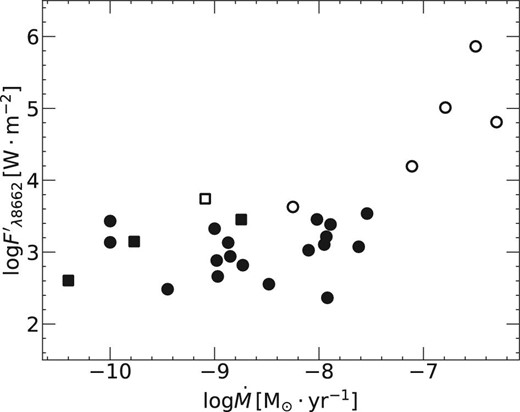
Surface flux of the Ca ii emission line, |$F^{\prime }_{\lambda 8662}$|, as a function of mass accretion rate, |$\dot{M}$|. The circle symbols represent the PMS stars in the molecular clouds, and the square symbols are the PMS stars in the moving groups. The open symbols show the objects with a broad Ca ii IRT emission line (FWHM > 100 km s−1), and the filled symbols represent the objects with a narrow Ca ii IRT emission line (FWHM ≤ 100 km s−1).
In figure 5, the circle symbols represent the PMS stars in the molecular clouds and the square symbols are the PMS stars in the moving groups. The open symbols show objects with a broad Ca ii IRT emission line (FWHM >100 km s−1) and the filled symbols represent the objects with a narrow Ca ii IRT emission line (FWHM ≤ 100 km s−1). As mentioned above, the broad line components are explained well by the magnetospheric accretion model in Muzerolle, Hartmann, and Calvet (1998), while the narrow Ca ii lines are generated in the stellar chromosphere (Hamann & Persson 1992).
We can see two groups among the PMS stars. High mass accretion rate PMS stars (|$\dot{M} \gtrsim 10^{-7}\, {M_{\odot } \, {\rm yr}^{-1}}$|) have a broad Ca ii IRT emission line. DG Tau, DL Tau, and DR Tau belong to this group. Those are classified as accretors based on the accretion diagnosis of Mohanty, Jayawardhana, and Basri (2005). The relationship between the mass accretion rate and the surface flux of the Ca ii IRT emission line is consistent with that for the accretors (Mohanty et al. 2005). The mass accretion rate does not show any correlation with |$F^{\prime }_{\lambda 8662}$| for the objects with a narrow emission and almost all objects have |$\log F^{\prime }_{\lambda 8662} \sim 3$| with a flat distribution to |$\dot{M}$|. Those do not meet the accretor criteria presented by Mohanty, Jayawardhana, and Basri (2005). Most objects in our sample, including CTTSs, belong to this group. All the investigated PMS stars with a low mass accretion rate, except SU Aur and RECX 15, do not show broad Ca ii IRT emission lines. The difference in |$F^{\prime }_{\rm IRT}$| between the two groups is more than one order of magnitude. We found that there is a significant difference between the group of objects with a broad Ca ii IRT emission line and the group of objects with a narrow Ca ii IRT emission line. This is a well-established difference between accretors and non-accretors reported by some studies, and our results support that.
The Ca ii IRT emission lines of PMS stars vary with time (e.g., Johns-Krull & Basri 1997). We present the EQWs and profiles of the Ca ii IRT emission lines of BP Tau in table 5. In this work, BP Tau shows narrow emissions superposed on broad absorption features. The Wλ8662 of BP Tau in this study is 1.15 Å. In contrast, the Ca ii IRT lines in Mohanty, Jayawardhana, and Basri (2005) are broad and Wλ8662 is 7.8 Å. Mohanty, Jayawardhana, and Basri (2005) referred to the EQWs of the Ca ii IRT emission lines in Muzerolle, Hartmann, and Calvet (1998); BP Tau as observed in 1996 has strong |$F^{\prime }_{\lambda 8662}$|, similar to DG Tau, DL Tau, and DR Tau. In Mohanty, Jayawardhana, and Basri (2005), objects with broad Ca ii IRT emission lines as classified by Muzerolle, Hartmann, and Calvet (1998) show a positive correlation with the mass accretion rate. Most objects in this study have narrow components, so that their |$F^{\prime }_{\lambda 8662}$| has no correlation with the mass accretion rate.
Time variation of the profiles of the CTTS, BP Tau.
| Observation date | Profiles | W λ8662 [Å] | Reference* |
|---|---|---|---|
| 1993 | Narrow emission (λ8498) | Not measured | [1] |
| 1996 | Broad emission + narrow emission (λ8542) | 7.8 | [2] |
| 2006 | Broad emission + narrow emission (λλ8498, 8542, 8662) | 6.44 | [3] |
| 2008 | Narrow emission + photospheric abrorption (λλ8498, 8542, 8662) | 1.15 | [4] |
| + Photospheric abrorption (λλ8498, 8542, 8662) |
4.3 Rotation–activity relation
We estimate τc of our PMS stars using the pre-main-sequence evolutionary tracks and convective turnover time of stars with 0.065–5.0 M⊙ presented in Jung and Kim (2007). The convective turnover time of a solar-mass PMS is between 300 and 100 d for the CTTS phase, and between a few hundred days and several dozens of days for the WTTS phase. The convective turnover time of an object near and on ZAMS remains stable at a few dozen days. In Jung and Kim (2007), the τc of low-mass stars near the main sequence was not calculated. For objects whose τc was not calculated in Jung and Kim (2007), we apply the approximation from Noyes et al. (1984) when calculating τc with (B − V)0. (B − V)0 was calculated from B − V (Herbig & Bell 1988; Hanson 2003; Manoj et al. 2006; van Leeuwen 2007; Mayne et al. 2007; Davies et al. 2014; Henden et al. 2016) and AV in Kraus et al. (2009), Manoj et al. (2006), and Wahhaj et al. (2010).
|$F^{\prime }_{\rm IRT}$| and |$R^{\prime }_{\rm IRT}$| of the Ca ii IRT emission lines (λλ8498, 8542, 8662 Å).
| Object name | |$\log F^{\prime }_{\lambda 8498}$| | |$\log F^{\prime }_{\lambda 8542}$| | |$\log F^{\prime }_{\lambda 8662}$| | |$\log R^{\prime }_{\lambda 8498}$| | |$\log R^{\prime }_{\lambda 8542}$| | |$\log R^{\prime }_{\lambda 8662}$| | log NR | Note* |
|---|---|---|---|---|---|---|---|---|
| [W m−2] | [W m−2] | [W m−2] | ||||||
| Taurus–Auriga molecular cloud | ||||||||
| AA Tau | 2.58 | 2.65 | 2.55 | −4.61 | −4.54 | −4.63 | −1.71 | NC |
| BP Tau | 3.50 | 3.70 | 3.54 | −3.80 | −3.59 | −3.76 | −1.57 | NC |
| CX Tau | 2.57 | 2.69 | 2.66 | −4.32 | −4.20 | −4.23 | −1.75 | NC |
| CoKu Tau4 | 3.38 | 3.57 | 3.43 | −3.81 | −3.62 | −3.76 | −2.00 | NC |
| DF Tau | 2.99 | 3.24 | 3.07 | −4.02 | −3.77 | −3.94 | −1.53 | NC |
| DG Tau | 4.79 | 4.77 | 4.81 | −2.25 | −2.27 | −2.23 | −1.85 | BC |
| DL Tau | 5.15 | 5.12 | 5.01 | −2.01 | −2.04 | −2.15 | −1.83 | BC |
| DM Tau | 3.08 | 3.19 | 3.11 | −3.98 | −3.87 | −3.95 | −1.71 | NC |
| DR Tau | 5.90 | 5.95 | 5.86 | −1.40 | −1.35 | −1.44 | −1.81 | BC |
| DS Tau | 3.24 | 3.44 | 3.38 | −3.94 | −3.74 | −3.79 | −1.68 | NC |
| FN Tau | 3.78 | — | 3.83 | −3.49 | — | −3.44 | −1.17 | NC |
| FP Tau | 2.49 | — | 2.48 | −4.44 | — | −4.44 | −1.97 | NC |
| GH Tau | 2.41 | 2.47 | 2.36 | −4.56 | −4.50 | −4.61 | −1.68 | NC |
| GM Aur | 3.26 | 3.54 | 3.45 | −4.04 | −3.76 | −3.85 | −1.55 | NC |
| GO Tau | 3.15 | 3.29 | 3.21 | −4.00 | −3.86 | −3.94 | −1.57 | NC |
| HBC 374 | 2.85 | 3.08 | — | −4.32 | −4.08 | — | −1.67 | NC |
| HBC 376 | 3.50 | 3.63 | — | −3.82 | −3.69 | — | — | NC |
| HBC 407 | 2.82 | 2.91 | 2.83 | −4.61 | −4.52 | −4.60 | −1.03 | NC |
| HBC 427 | 2.83 | 2.95 | 2.90 | −4.44 | −4.32 | −4.37 | −1.45 | NC |
| HD 285778 | 3.06 | 3.27 | — | −4.61 | −4.40 | — | −1.33 | NC |
| HP Tau | — | — | — | — | — | — | −2.54 | NC |
| IT Tau | 3.57 | 3.67 | 3.60 | −3.56 | −3.45 | −3.52 | −1.33 | NC |
| LkCa 04 | 2.69 | 2.86 | 2.82 | −4.30 | −4.13 | −4.17 | −1.87 | NC |
| LkCa 14 | 2.88 | 3.02 | 2.94 | −4.37 | −4.24 | −4.31 | −1.90 | NC |
| LkCa 15 | 3.13 | 3.15 | 3.13 | −4.11 | −4.10 | −4.12 | −1.66 | NC |
| LkCa 19 | 3.13 | 3.27 | 3.14 | −4.34 | −4.21 | −4.34 | −1.68 | NC |
| RY Tau | 4.38 | 4.26 | 4.19 | −3.41 | −3.53 | −3.60 | −1.19 | BC |
| SU Aur | 3.49 | 3.72 | 3.63 | −3.82 | −3.59 | −3.68 | −1.92 | BC |
| UX Tau | 3.26 | 3.39 | 3.33 | −4.08 | −3.95 | −4.01 | −1.52 | NC |
| V1023 Tau | 3.30 | 3.47 | — | −3.87 | −3.69 | — | −1.67 | NC |
| V1204 Tau | 3.08 | 3.11 | — | −4.40 | −4.37 | — | −1.54 | NC |
| V1297 Tau | 3.04 | 3.11 | 3.02 | −4.52 | −4.45 | −4.55 | −1.01 | NC |
| V1321 Tau | 2.99 | 3.12 | 3.04 | −4.19 | −4.06 | −4.13 | −1.28 | NC |
| V1348 Tau | 2.95 | 3.08 | 2.98 | −4.39 | −4.26 | −4.37 | −1.09 | NC |
| V830 Tau | 3.00 | 3.20 | 3.03 | −4.17 | −3.97 | −4.14 | −1.98 | NC |
| V836 Tau | 2.81 | 2.90 | 2.88 | −4.19 | −4.09 | −4.11 | −1.58 | NC |
| ZZ Tau | 3.24 | 3.37 | 3.20 | −3.98 | −3.85 | −4.02 | −1.65 | NC |
| Orionis OB 1c association | ||||||||
| HBC 167 | 3.96 | 4.19 | 4.06 | −3.75 | −3.52 | −3.65 | −1.26 | NC |
| Upper Scorpius association | ||||||||
| 1RXS J161951.4−215431 | — | — | — | — | — | — | — | NC |
| Perseus molecular cloud | ||||||||
| LkHα 86 | 2.65 | 2.79 | 2.69 | −4.36 | −4.22 | −4.32 | −1.54 | NC |
| LRL 72 | — | — | — | — | — | — | −1.32 | NC |
| AB Doradus moving group | ||||||||
| HIP 17695 | 2.21 | 2.36 | 2.21 | −4.64 | −4.49 | −4.64 | −2.15 | NM |
| β Pictoris moving group | ||||||||
| HD 197481 | 2.56 | 2.64 | 2.56 | −4.44 | −4.36 | −4.45 | −1.70 | NM |
| η Chamaeleontis cluster | ||||||||
| RECX 04 | 2.83 | 2.97 | 2.85 | −4.34 | −4.20 | −4.33 | −1.30 | NM |
| RECX 06 | 2.50 | 2.58 | 2.44 | −4.44 | −4.36 | −4.51 | −2.04 | NM |
| RECX 07 | 2.94 | 3.10 | 3.00 | −4.36 | −4.20 | −4.29 | −2.01 | NM |
| RECX 09 | 2.48 | 2.75 | 2.60 | −4.66 | −4.39 | −4.53 | −1.79 | NM |
| RECX 10 | 2.80 | 2.91 | 2.79 | −4.40 | −4.29 | −4.41 | −1.22 | NM |
| RECX 11 | 3.06 | 3.23 | 3.15 | −4.27 | −4.10 | −4.18 | −1.50 | NM |
| RECX 15 | 3.85 | 3.85 | 3.74 | −3.19 | −3.18 | −3.29 | −2.11 | BM |
| “Cha-Near” region | ||||||||
| RX J1147.7−7842 | 2.85 | 3.07 | 2.90 | −4.26 | −4.04 | −4.21 | — | BM |
| RX J1204.6-7731 | 2.62 | 2.76 | 2.62 | −4.35 | −4.22 | −4.35 | −1.44 | NM |
| TW Hydrae association | ||||||||
| TWA 01 | 3.23 | 3.51 | 3.45 | −4.03 | −3.75 | −3.81 | −1.53 | NM |
| TWA 06 | 3.03 | 3.24 | 3.14 | −4.24 | −4.04 | −4.13 | −2.21 | NM |
| TWA 07 | 2.89 | 2.96 | 2.84 | −4.28 | −4.21 | −4.33 | −1.20 | NM |
| TWA 14 | 2.87 | 3.05 | 2.92 | −4.23 | −4.05 | −4.18 | −2.57 | NM |
| TWA 22 | 1.99 | 2.27 | 2.15 | −4.58 | −4.30 | −4.42 | −1.05 | NM |
| TWA 23 | 2.34 | 2.46 | 2.24 | −4.60 | −4.47 | −4.69 | −2.34 | NM |
| TWA 25 | 2.95 | 3.07 | 3.01 | −4.22 | −4.10 | −4.16 | −1.36 | NM |
*This column shows the groups based on the FWHM of the Ca ii emission lines (λ8498 Å) and the membership of the objects. NC: Narrow emission objects belonging to the molecular clouds. BC: Broad emission objects belonging to the molecular clouds. NM: Narrow emission objects belonging to the moving groups. BM: Broad emission objects belonging to the moving groups.
The chromospheric activity of ZAMS stars is considered to be induced by dynamo activity. Marsden, Carter, and Donati (2009) investigated the Ca ii IRT emission lines of low-mass stars in the young open clusters IC 2391 and IC 2602. For stars with log NR ≤ −1.1, |$R^{\prime }_{\rm IRT}$| is constant at levels of |$\log R^{\prime }_{\lambda 8498} \sim -4.4$|, |$\log R^{\prime }_{\lambda 8542} \sim -4.2$|, and |$\log R^{\prime }_{\lambda 8662} \sim -4.3$|. These regions are called the saturated regime. For stars with log NR ≥ −1.1, |$R^{\prime }_{\rm IRT}$| decreases with increasing NR. This region is called the unsaturated regime. Marsden, Carter, and Donati (2009) suggested that the chromosphere is completely filled by the emitting region for stars in the saturated regime.
Figure 6 shows |$R^{\prime }_{\rm IRT}$| as a function of NR. The circle symbols represent PMS stars in molecular clouds, and the square symbols are PMS stars in moving groups. The open circles and squares show objects with a broad Ca ii IRT emission line, and the filled circles and squares represent objects with a narrow Ca ii IRT emission line. The cross symbols represent low-mass stars in IC 2391 and IC 2602, as studied in Marsden, Carter, and Donati (2009).
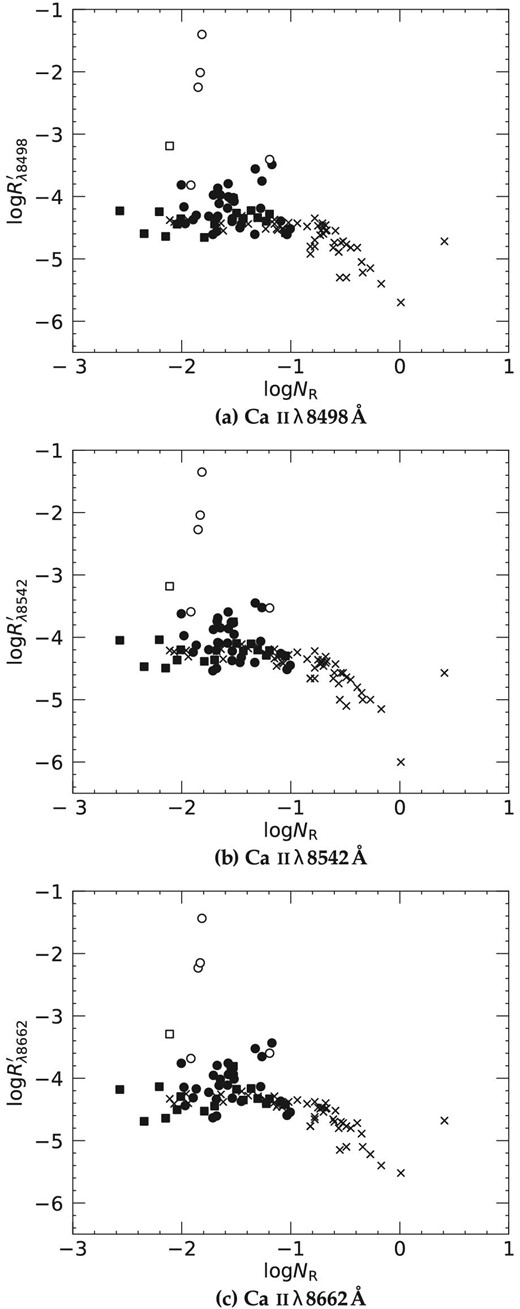
Relation between the ratio of the surface flux of the Ca ii IRT line to the stellar bolometric luminosity, |$R^{\prime }_{\rm IRT}$|, and the Rossby number, NR. The circle symbols represent PMS stars in molecular clouds, and the square symbols indicate PMS stars in moving groups. The filled symbols represent PMS stars with narrow Ca ii IRT emission lines, and the open symbols show PMS stars with broad Ca ii IRT emission lines. The cross symbols represent low-mass stars in the young open clusters IC 2391 and IC 2602, as studied in Marsden, Carter, and Donati (2009).
Most PMS stars have NR and |$R^{\prime }_{\rm IRT}$| similar to those of the cluster members in the saturated regime. We claim that the chromospheres of the PMS stars are activated by the magnetic field generated by the dynamo process, and that the chromospheres of these stars are completely filled by the emitting region. This is consistent with the previous studies indicating that PMS stars have optically thick Ca ii IRT emission lines (e.g., Hamann & Persson 1992; Batalha & Basri 1993), and our results support them. In contrast, three PMS stars with strong and broad emission lines (DG Tau, DL Tau, and DR Tau) have |$R^{\prime }_{\rm IRT}$| two orders of magnitude larger than the cluster members. We consider that strong emission lines are caused by heavy mass accretion from their protoplanetary disks.
Several researchers have pointed out that low-mass dwarfs showing strong Ca ii emission lines also have strong X-ray emissions (Hodebine et al. 2017) and strong magnetic fields (Valenti & Johns-Krull 2001; Linsky 2017), and that the flux variation of the Ca ii lines is related to the coverage of their faculae or spots. Some of these features have already been found in low-mass PMS stars. Furthermore, it has to be investigated whether low-mass PMS stars have these other features.
5 Conclusion
We have investigated the Ca ii infrared triplet lines (λλ8498, 8542, 8662 Å) of 60 PMS stars. The observations were conducted with Nayuta/MALLS and Subaru/HDS. Archived data obtained from Keck/HIRES, VLT/UVES, and VLT/X-Shooter were also used.
The ratios of the equivalent widths of the Ca ii IRT emission lines Wλ8542/Wλ8498 are 1.0–2.0 and Wλ8662/Wλ8498 are 0.7–1.7 for both PMS stars and the low-mass stars in the young open clusters (Marsden et al. 2009). This suggests that the Ca ii IRT emission lines originate from the regions analogous to solar plages and flares.
Seven PMS stars (DG Tau, DL Tau, DR Tau, RY Tau, SU Aur, RECX 15, and RX J1147.7−7842) have broad Ca ii IRT emission lines. It is suggested that their broad emissions result from heavy mass accretion from their protoplanetary disks.
Most PMS stars have narrow Ca ii IRT emission lines similar to low-mass stars in young open clusters. The emissions of these objects indicate no correlation with the mass accretion rate. The ratio of the surface flux of the Ca ii IRT emission lines to the stellar bolometric luminosity, |$R^{\prime }_{\rm IRT}$|, of these objects is as large as the largest |$R^{\prime }_{\rm IRT}$| of the cluster members. Most PMS stars have chromospheric activity similar to zero-age main-sequence stars. The chromospheres of these stars are completely filled by the Ca ii emitting region.
Acknowledgements
This research has made use of the Keck Observatory Archive (KOA), which is operated by the W. M. Keck Observatory and NASA Exoplanet Science Institute (NExScI), and it is under contract with the National Aeronautics and Space Administration, and is based on observations made with ESO Telescopes at La Silla Paranal Observatory under programmes ID 075.C-0321, 082.C-0005, 084.C-1095, 085.C-0238, 086.C-0173, 094.C-0327, 094.C-0805, and 094.C-0913. Y. I. is supported by JSPS KAKENHI grant number 17K05390.
Footnotes
IRAF is distributed by the National Optical Astronomy Observatories, which are operated by the Association of Universities for Research in Astronomy, Inc., under cooperative agreement with the National Science Foundation.
References
