


Abstract
W 48 A core H-2a is one of the young massive protostellar objects in the W 48 region. We conducted multi-epoch astrometric observations of the water (H2O) masers associated with the W 48 A core H-2a with VLBI Exploration of Radio Astrometry (VERA). The trigonometric annual parallax of W 48 A core H-2a was measured to be 0.433 ± 0.026 mas, corresponding to a distance of |$2.31^{+0.15}_{-0.13}$| kpc. This agrees with the revised parallax of 0.412 ± 0.014 mas by Wu et al. (2019, ApJ, 874, 94). We obtained the systemic proper motion and local standard of rest velocity to be (μαcos δ, μδ) = (0.26 ± 0.73, −3.87 ± 0.33) mas yr−1 and vLSR = 41.9 ± 0.9 km s−1, respectively. The distribution of the H2O masers covers an area of 70 mas × 80 mas, corresponding to 160 au × 180 au at the distance of 2.31 kpc. The internal proper motions of the H2O masers trace an east–west bipolar outflow. With the recent absolute position measurement of the 6.7 GHz methanol (CH3OH) masers and their elliptical distribution, whose major axis is perpendicular to the axis of the bipolar outflow, we suggest the presence of a disk outflow system in core H-2a. The spectral energy distribution (SED) of the driving source of core H-2a was previously reported to yield a luminosity and envelope mass of 8000 ± 1000 |$W_{\odot}$| and 170 ± 30 |$M_{\odot}$|, respectively. Refitting the SED with the new distance, we obtained the luminosity to be 3100 ± 388 |$L_{\odot}$| and derived the zero age main sequence (ZAMS) stellar mass to be 9 ± 1 |$M_{\odot}$|. Using our distance measurement, we derived the peculiar motion of W 48 A to be (Us, Vs, Ws) = (1 ± 4, 5 ± 6, −15 ± 5) km s−1.
1 Introduction
Disk outflow systems are gradually becoming common among high-mass protostars (Cesaroni et al. 2006; Torrelles et al. 2011; Hirota et al. 2017; Ilee et al. 2018). Theoretical models support the notion of the existence of circumstellar disks to aid accretion against radiation pressure from the protostellar object (Krumholz et al. 2009). Hirota et al. (2017) unveiled a disk-driven rotating bipolar outflow in Orion source I, showing how bipolar outflows play a key role in resolving the angular momentum problem. Most of the disk outflow systems are revealed through millimeter observations; however, a number of compact bipolar outflows and rotating disk structures have been detected with very long baseline interferometric observations of the interstellar masers associated with the regions (Chibueze et al. 2012; Sugiyama et al. 2014).
W 48 A (also known as G35.20−01.74) is natal home to several massive protostellar objects, multiple H ii regions, and a known photodissociation region (Wood & Churchwell 1989; Onello et al. 1994; Roshi et al. 2005). Pillai et al. (2011) and Rygl et al. (2014) explored the millimeter dust and line emission properties of W 48 A. The focus of this paper will be on core H-2a in clump H2 as classified in Rygl et al. (2014). The core is associated with 6.7 GHz methanol (CH3OH) maser emission pointing to the presence of a massive protostar in the core (Caswell et al. 1995; Minier et al. 2000; Sugiyama et al. 2008; Breen et al. 2015). The envelope mass of the core is estimated to be 170 ± 30 |$M_{\odot}$| and the dust temperature is 27 ± 9 K. The bolometric luminosity of the core is estimated as 8000 ± 1000 |$L_{\odot}$| at an age of 8 × 10⁵ yr (Rygl et al. 2014). The parallax distance measurement by Zhang et al. (2009) puts the distance to the core at 3.27 ± 0.49 kpc (with about 15% error). Recently, Wu et al. (2019) revised the parallax distance to 2.19|$^{+0.09}_{-0.20}$| kpc. The existence of two conflicting parallax measurements pushed us to an independent verification of the distance. Our parallax distance measurement reported in this paper is in agreement with the value of Wu et al. (2019), but it differs from that of Zhang et al. (2009).
There is a direct link between accurate distance measurements of star-forming regions and the effort to understand the formation of high-mass stars. The very long baseline interferometry (VLBI) trigonometric parallax measurement technique is currently the most accurate way of deriving the distances to Galactic masing objects, including star-forming clouds (Honma et al. 2012; Reid et al. 2014). However, a number of factors can negatively affect the accuracy of VLBI astrometric results. These may include phase errors due to tropospheric delay, resolved structures in the phase calibrator, extended structures in the detected maser emission, use of too few observation epochs in the parallax fitting, and mistaken identification of the same maser feature across adjacent epochs. Nevertheless, VLBI parallax distances are much more accurate than photometric and kinematic distances.
Masers not only serve as a signpost for star formation but they can also be used to trace gas motion around forming stars. Examples of the use of masers to trace collimated and wide-angle outflows as well as rotation and infall motions abound (Torrelles et al. 2011; Chibueze et al. 2012; Sugiyama et al. 2014 and references therein). In the case of a symmetric distribution of the maser proper motions, the dynamical center of maser kinematics can provide a clue to the probable location of the driving source, that is, the (proto)star.
In this paper we report the results of multiple epoch VLBI Exploration of Radio Astrometry (VERA) observations of W 48 A. The measured parallax distance, peculiar motion, and compact outflow traced by the H2O maser internal motion are discussed. We have also compared the kinematics of the H2O masers with the 6.7 GHz methanol maser distribution (Sugiyama et al. 2008; Surcis et al. 2012; Reid et al. 2019).
2 Observations and data reduction
VLBI observations of the 22.235080 GHz H2O masers in W 48 A were made with VERA between 2010 January and 2011 February. The observation dates are listed in table 1. The position reference source was the International Celestial Reference Frame 2 (ICRF2)1 source, J1907+0127. The separation angle between W 48 A and J1907+0127 is 1|${_{.}^{\circ}}$|38 with a position angle of 81°. The coordinates of the target and the reference source are reported in table 2. J1907+0127 was detected at the peak intensity of 0.12–0.17 Jy beam−1 in our observations. The target and the reference source were simultaneously observed using the dual-beam system of VERA. The observed data was recorded with magnetic tapes at the rate of 1 Gbps with two-bit quantization. This provided a total bandwidth of 256 MHz composed of sixteen 16 MHz-wide IF (intermediate frequency) bands. One IF band was assigned to the target maser source, W 48 A, and the remaining 15 IF bands were assigned to the continuum source, J1907+0127. The correlation was performed at the Mitaka FX correlator. The correlation accumulation period was 1 s. The spectral resolution was set to 250 kHz for the continuum source and 15.625 kHz (0.21 km s−1) for the maser source. The clock offset and rate were calibrated using the bright fringe finder, J2015+3710 (∼2 Jy), in the correlation process.
Observation information.
| Epoch | Observation code | Date (yyyy mm dd) |
|---|---|---|
| 1 | r10018b | 2010 01 18 |
| 2 | r10140a | 2010 05 20 |
| 3 | r10271a | 2010 09 28 |
| 4 | r10337a | 2010 12 03 |
| 5 | r11043b | 2011 02 12 |
| Epoch | Observation code | Date (yyyy mm dd) |
|---|---|---|
| 1 | r10018b | 2010 01 18 |
| 2 | r10140a | 2010 05 20 |
| 3 | r10271a | 2010 09 28 |
| 4 | r10337a | 2010 12 03 |
| 5 | r11043b | 2011 02 12 |
Source information.
| Name | RA (J2000.0) | Dec (J2000.0) |
|---|---|---|
| W 48 A | |$19^{\rm h}01^{\rm m}45{_{.}^{\rm s}}5423$| | |$+01^{\circ }13^{\prime }32{_{.}^{\prime\prime}}573$| |
| J1907+0127 | |$19^{\rm h}07^{\rm m}11{_{.}^{\rm s}}996263$| | |$+01^{\circ }27^{\prime }08{_{.}^{\prime\prime}}96316$| |
| Name | RA (J2000.0) | Dec (J2000.0) |
|---|---|---|
| W 48 A | |$19^{\rm h}01^{\rm m}45{_{.}^{\rm s}}5423$| | |$+01^{\circ }13^{\prime }32{_{.}^{\prime\prime}}573$| |
| J1907+0127 | |$19^{\rm h}07^{\rm m}11{_{.}^{\rm s}}996263$| | |$+01^{\circ }27^{\prime }08{_{.}^{\prime\prime}}96316$| |
Data reduction was performed using the NRAO Astronomical Image Processing System (AIPS). The delay difference between the dual beams is measured and calibrated by the horn-on-dish method, in which artificial noise sources are mounted on the antenna feedhorn base and a wideband radio noise is injected into the dual-beam receivers after reflection by a subreflector (Honma et al. 2008a). The tropospheric delay is calibrated using the tropospheric zenith delay measured by Global Positioning System (GPS) (Honma et al. 2008b). The ionospheric delay is calibrated using the Global Ionosphere Maps produced by Center for Orbit Determination in Europe (CODE). These delays were converted to AIPS SN table format and applied to the visibility data. The fringe search was done using the reference source J1907+0127. The fringe phases are obtained every 30 s with the averaging time of a single data sample being 120 s. J1907+0127 could be detected on individual baselines with signal-to-noise ratios typically between 5 and 10. The self-calibration of J1907+0127 was made to solve for the amplitude and phase variation owing to structural effects. Figure 1 shows the self-calibration map of J1907+0127. The core jet-like structure corresponding to the central bright component and the weak northeast component can be seen. A similar structure is also seen in 2.3 GHz and 8.4 GHz radio continuum maps obtained by the VLBA calibrator survey (Beasley et al. 2002). The station-based phase solutions obtained by the fringe search and the self-calibration of J1907+0127 were applied to the target source W 48 A. When applying the corrections, the frequency difference between the position reference source and the target maser was considered. After accurate delay calibration and phase-referencing by J1907+0127, synthesis imaging of the target source W 48 A was performed using the AIPS task “IMAGR,” producing images with a field of view of 100 mas × 100 mas. The synthesized beam size was typically 1.4 mas × 0.8 mas at a position angle of −36°. The peak position and intensity of each maser spot were obtained by a two-dimensional Gaussian fit of its emission in the corresponding calibrator-referenced channel map. The noise level of the calibrator-referenced image was typically 0.1–0.2 Jy beam−1 on individual channels. A signal-to-noise (S/N) detection threshold of 7 was adopted for the detection criteria of the maser spots.
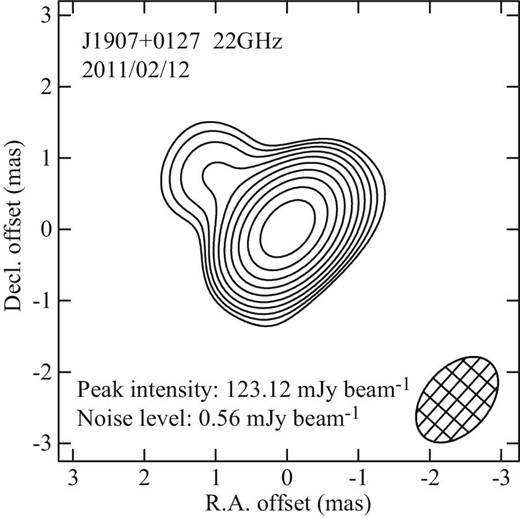
Self-calibration map of the position reference source J1907+0127. The contours are plotted at the level of σrms × 5 × √2n (n = 1, 2, 3, …), where σrms is the noise level.
The fringe search and self-calibration of the target maser source were performed to measure the internal motions of the maser spots. The local standard of rest (LSR) velocity channels at vLSR = 40.7 km s−1 for the first and second epochs and vLSR = 43.9 km s−1 for the third to the fifth epochs were used. They were detected at the peak intensity of ∼50 Jy beam−1. After applying the self-calibration solution, velocity channels were imaged over wide fields of view of 8″ × 8″ and the brightness peaks were searched. For each peak, a CLEANed image with a small field of view of 100 mas × 100 mas was produced. We selected the maser spot at vLSR = 46.4 km s−1, which was detected at all five epochs, as a position reference. Table 3 shows a comparison of the maser- and the calibrator-referenced images. The peak intensity and the noise level obtained by the two methods for the reference maser spot at vLSR = 46.4 km s−1 are shown. The maser calibration improved the peak intensities by factors of 1.0–1.6 and reduced the noise levels by factors of 0.5–0.7. A higher dynamic range, an improvement by factors of 1.5–2.2, was obtained compared with the calibrator-referenced images.
Comparison of the maser and calibrator referencing for the reference spot at v = 46.4 km s−1.*
| Epoch | I m | σm | I c | σc | I m/Ic | σm/σc |
|---|---|---|---|---|---|---|
| (Jy beam−1) | (Jy beam−1) | |||||
| 1 | 3.89 | 0.07 | 2.48 | 0.09 | 1.6 | 0.7 |
| 2 | 5.81 | 0.11 | 5.96 | 0.16 | 1.0 | 0.7 |
| 3 | 6.02 | 0.14 | 4.56 | 0.20 | 1.3 | 0.7 |
| 4 | 6.32 | 0.11 | 4.46 | 0.18 | 1.4 | 0.6 |
| 5 | 8.11 | 0.08 | 8.33 | 0.16 | 1.0 | 0.5 |
*Column 1 lists the epoch number. Columns 2 and 3 list the peak intensity (Im) and the noise level (σm) obtained by maser referencing. Columns 3 and 4 list the peak intensity (Ic) and the noise level (σc) obtained by calibrator referencing. Columns 5 and 6 list their ratios for comparison.
3 Results
We detected 57 maser spots persistent for more than two epochs; they are listed in table 4. Several maser spots are detected at similar positions and consecutive velocity channels. We define such a cluster of spots as a feature. We grouped the 57 maser spots into 8 features labeled “a, b, c, d, e, f, g, h” in table 4. The relative proper motions with respect to the reference maser spot of vLSR = 46.4 km s−1 (3a in table 4) were obtained by assuming a uniform linear motion. The position offsets at the first epoch of detection (Δαcos δ, Δδ) and relative proper motions (μαcos δ, μδ) are summarized in table 4. The internal motions of individual maser spots were derived to correct the bias from the relative proper motions. They are shown as (Δvx, Δvy) in table 4, obtained by |$\Delta v = (\mu - \bar{\mu }) \cdot a \cdot D$|, where μ is the relative proper motion, |$\bar{\mu }$| is the bias of the relative proper motions, a = 4.74 km s−1 kpc−1 mas−1 is the conversion constant from mas yr−1 to km s−1 for a distance of 1 kpc, and D = 2.31 kpc is the source distance. The bias of the relative proper motions was derived from the average of the relative proper motions of the eight features to be (−0.56, −0.34) mas yr−1 in the RA and Dec directions.
List of the H2O maser spots in W 48 A.*
| ID | Δαcos δ | Δδ | μαcos δ | μδ | Δvx | Δvy | v LSR | I peak (Jy) | Epoch |
|---|---|---|---|---|---|---|---|---|---|
| (mas) | (mas) | (mas yr−1) | (mas yr−1) | (km s−1) | (km s−1) | (km s−1) | (beam−1) | ||
| 1a | 26.58 ± 0.05 | 94.39 ± 0.06 | 0.10 ± 0.03 | −0.14 ± 0.02 | 7.2 ± 0.3 | 2.2 ± 0.2 | 46.8 | 0.5–1.3 | 10011 |
| 2a | 26.53 ± 0.01 | 94.48 ± 0.02 | 0.04 ± 0.05 | −0.06 ± 0.08 | 6.6 ± 0.5 | 3.1 ± 0.9 | 46.6 | 1.6–4.3 | 11111 |
| 3a | 26.48 ± 0.01 | 94.53 ± 0.01 | 0.00 ± 0.00 | 0.00 ± 0.00 | 6.1 ± 0.0 | 3.7 ± 0.0 | 46.4 | 3.9–8.1 | 11111 |
| 4a | 26.38 ± 0.01 | 94.68 ± 0.01 | 0.02 ± 0.02 | −0.03 ± 0.03 | 6.4 ± 0.2 | 3.4 ± 0.3 | 46.2 | 4.9–8.5 | 11111 |
| 5a | 26.25 ± 0.01 | 94.85 ± 0.01 | 0.10 ± 0.04 | −0.10 ± 0.04 | 7.2 ± 0.4 | 2.6 ± 0.4 | 46.0 | 2.8–4.1 | 11111 |
| 6a | 26.20 ± 0.02 | 95.95 ± 0.03 | 0.20 ± 0.10 | −0.29 ± 0.15 | 8.3 ± 1.1 | 0.5 ± 1.6 | 45.8 | 0.8–1.4 | 11011 |
| avr | 26.40 ± 0.02 | 94.65 ± 0.04 | 0.08 ± 0.03 | −0.10 ± 0.04 | 7.0 ± 0.3 | 2.6 ± 0.4 | 46.3 | ||
| 7b | −2.83 ± 0.01 | 15.78 ± 0.01 | 2.81 ± 0.42 | 0.28 ± 0.42 | 36.9 ± 4.6 | 6.8 ± 4.6 | 45.1 | 2.4–8.8 | 11000 |
| 8b | −2.80 ± 0.01 | 15.79 ± 0.01 | 2.88 ± 0.42 | 0.29 ± 0.42 | 37.7 ± 4.6 | 6.9 ± 4.6 | 44.9 | 5.5–15.2 | 11000 |
| 9b | −2.79 ± 0.01 | 15.79 ± 0.01 | 3.04 ± 0.42 | 0.36 ± 0.42 | 39.4 ± 4.6 | 7.7 ± 4.6 | 44.7 | 8.1–18.2 | 11000 |
| 10b | −2.80 ± 0.01 | 15.78 ± 0.01 | 3.23 ± 0.42 | 0.60 ± 0.42 | 41.5 ± 4.6 | 10.3 ± 4.6 | 44.5 | 7.5–16.4 | 11000 |
| 11b | −2.82 ± 0.01 | 15.77 ± 0.01 | 3.99 ± 0.42 | 2.35 ± 0.42 | 49.8 ± 4.6 | 29.5 ± 4.6 | 44.3 | 6.4–11.7 | 11000 |
| avr | −2.81 ± 0.01 | 15.78 ± 0.00 | 3.19 ± 0.19 | 0.78 ± 0.36 | 41.1 ± 2.1 | 12.2 ± 3.9 | 44.7 | ||
| 12c | −1.23 ± 0.02 | 16.79 ± 0.02 | 1.57 ± 0.78 | −1.74 ± 0.78 | 23.3 ± 8.5 | −15.3 ± 8.5 | 45.1 | 1.0–3.5 | 00110 |
| 13c | −1.20 ± 0.01 | 16.76 ± 0.01 | 1.72 ± 0.78 | −2.20 ± 0.78 | 25.0 ± 8.5 | −20.4 ± 8.5 | 44.9 | 0.9–8.8 | 00111 |
| 14c | −1.16 ± 0.01 | 16.62 ± 0.01 | 1.59 ± 0.02 | −1.33 ± 0.11 | 23.5 ± 0.2 | −10.8 ± 1.2 | 44.7 | 2.4–18.2 | 00111 |
| 15c | −1.09 ± 0.01 | 16.47 ± 0.01 | 1.46 ± 0.04 | −0.89 ± 0.02 | 22.1 ± 0.4 | −6.0 ± 0.2 | 44.5 | 5.4–36.3 | 00111 |
| 16c | −1.08 ± 0.01 | 16.43 ± 0.01 | 1.45 ± 0.13 | −0.85 ± 0.16 | 22.0 ± 1.4 | −5.6 ± 1.8 | 44.3 | 10.9–53.7 | 00111 |
| 17c | −1.38 ± 0.01 | 16.86 ± 0.01 | 1.13 ± 0.13 | −1.01 ± 0.09 | 18.5 ± 1.4 | −7.3 ± 1.0 | 44.1 | 8.8–60.0 | 01111 |
| 18c | −1.39 ± 0.01 | 16.78 ± 0.01 | 1.16 ± 0.12 | −0.89 ± 0.11 | 18.8 ± 1.3 | −6.0 ± 1.2 | 43.9 | 9.8–67.6 | 01111 |
| 19c | −1.45 ± 0.01 | 16.55 ± 0.01 | 1.26 ± 0.07 | −0.57 ± 0.30 | 19.9 ± 0.8 | −2.5 ± 3.3 | 43.7 | 11.8–70.3 | 01111 |
| 20c | −1.47 ± 0.01 | 16.45 ± 0.01 | 1.32 ± 0.04 | −0.43 ± 0.42 | 20.6 ± 0.4 | −1.0 ± 4.6 | 43.5 | 14.8–65.4 | 01111 |
| 21c | −1.47 ± 0.01 | 16.42 ± 0.01 | 1.37 ± 0.03 | −0.39 ± 0.45 | 21.1 ± 0.3 | −0.5 ± 4.9 | 43.3 | 12.6–51.2 | 01111 |
| 22c | −1.47 ± 0.01 | 16.41 ± 0.01 | 1.39 ± 0.04 | −0.37 ± 0.46 | 21.4 ± 0.4 | −0.3 ± 5.0 | 43.0 | 7.2–30.3 | 01111 |
| 23c | −1.51 ± 0.02 | 16.40 ± 0.02 | 1.48 ± 0.03 | −0.40 ± 0.48 | 22.3 ± 0.3 | −0.7 ± 5.3 | 42.8 | 2.7–13.9 | 01111 |
| 24c | −1.04 ± 0.01 | 16.55 ± 0.01 | 1.66 ± 0.07 | −1.11 ± 0.52 | 24.3 ± 0.8 | −8.4 ± 5.7 | 42.6 | 3.1–5.5 | 00111 |
| avr | −1.30 ± 0.05 | 16.58 ± 0.04 | 1.43 ± 0.05 | −0.94 ± 0.15 | 21.8 ± 0.5 | −6.5 ± 1.6 | 43.9 | ||
| 25d | −6.38 ± 0.01 | 30.57 ± 0.01 | 0.24 ± 0.42 | 0.48 ± 0.42 | 8.8 ± 4.6 | 9.0 ± 4.6 | 42.6 | 5.4–9.8 | 11000 |
| 26d | −6.38 ± 0.01 | 30.57 ± 0.01 | 0.25 ± 0.42 | 0.43 ± 0.42 | 8.9 ± 4.6 | 8.4 ± 4.6 | 42.4 | 8.1–10.1 | 11000 |
| 27d | −6.38 ± 0.01 | 30.56 ± 0.01 | 0.11 ± 0.04 | 0.63 ± 0.03 | 7.3 ± 0.4 | 10.6 ± 0.3 | 42.2 | 1.3–10.0 | 11110 |
| 28d | −6.39 ± 0.01 | 30.57 ± 0.01 | 0.13 ± 0.03 | 0.60 ± 0.04 | 7.6 ± 0.3 | 10.3 ± 0.4 | 42.0 | 1.5–9.7 | 11110 |
| 29d | −6.36 ± 0.01 | 30.59 ± 0.02 | 0.10 ± 0.02 | 0.58 ± 0.02 | 7.2 ± 0.2 | 10.1 ± 0.2 | 41.8 | 1.3–7.1 | 11110 |
| 30d | −6.30 ± 0.02 | 30.72 ± 0.02 | 0.09 ± 0.39 | 0.68 ± 0.39 | 7.1 ± 4.3 | 11.2 ± 4.3 | 41.6 | 3.5–3.7 | 01100 |
| avr | −6.37 ± 0.01 | 30.60 ± 0.02 | 0.15 ± 0.03 | 0.57 ± 0.04 | 7.8 ± 0.3 | 9.9 ± 0.4 | 42.1 | ||
| 31e | −35.28 ± 0.01 | 21.90 ± 0.01 | −2.70 ± 0.42 | −0.65 ± 0.42 | −23.4 ± 4.6 | −3.4 ± 4.6 | 41.6 | 1.9–14.4 | 11000 |
| 32e | −35.29 ± 0.01 | 21.90 ± 0.01 | −2.70 ± 0.42 | −0.61 ± 0.42 | −23.4 ± 4.6 | −3.0 ± 4.6 | 41.4 | 6.3–40.8 | 11000 |
| 33e | −35.28 ± 0.01 | 21.89 ± 0.01 | −2.82 ± 0.42 | −0.56 ± 0.42 | −24.7 ± 4.6 | −2.4 ± 4.6 | 41.1 | 19.7–64.2 | 11000 |
| 34e | −35.25 ± 0.01 | 21.87 ± 0.01 | −2.96 ± 0.42 | −0.48 ± 0.42 | −26.3 ± 4.6 | −1.5 ± 4.6 | 40.9 | 41.1–69.3 | 11000 |
| 35e | −35.19 ± 0.01 | 21.82 ± 0.01 | −3.10 ± 0.42 | −0.40 ± 0.42 | −27.8 ± 4.6 | −0.7 ± 4.6 | 40.7 | 56.2–57.8 | 11000 |
| 36e | −35.06 ± 0.01 | 21.73 ± 0.01 | −3.29 ± 0.42 | −0.28 ± 0.42 | −29.9 ± 4.6 | 0.7 ± 4.6 | 40.5 | 37.9–47.3 | 11000 |
| 37e | −34.64 ± 0.01 | 21.46 ± 0.01 | −3.36 ± 0.42 | −0.38 ± 0.42 | −30.7 ± 4.6 | −0.4 ± 4.6 | 40.3 | 20.6–28.3 | 11000 |
| avr | −35.14 ± 0.08 | 21.80 ± 0.06 | −2.99 ± 0.09 | −0.48 ± 0.05 | −26.6 ± 1.0 | −1.5 ± 0.5 | 40.9 | 11000 | |
| 38f | −34.16 ± 0.01 | 21.19 ± 0.01 | −2.27 ± 0.42 | −1.19 ± 0.42 | −18.7 ± 4.6 | −9.3 ± 4.6 | 40.1 | 23.9–34.5 | 11000 |
| 39f | −34.08 ± 0.01 | 21.16 ± 0.01 | −2.09 ± 0.42 | −1.33 ± 0.42 | −16.8 ± 4.6 | −10.8 ± 4.6 | 39.9 | 29.3–47.6 | 11000 |
| 40f | −34.06 ± 0.01 | 21.15 ± 0.01 | −2.09 ± 0.42 | −1.31 ± 0.42 | −16.8 ± 4.6 | −10.6 ± 4.6 | 39.7 | 25.1–49.9 | 11000 |
| 41f | −34.03 ± 0.01 | 21.16 ± 0.01 | −2.15 ± 0.42 | −1.29 ± 0.42 | −17.4 ± 4.6 | −10.4 ± 4.6 | 39.5 | 13.4–39.2 | 11000 |
| avr | −34.08 ± 0.01 | 21.17 ± 0.01 | −2.15 ± 0.04 | −1.28 ± 0.03 | −17.4 ± 0.4 | −10.3 ± 0.3 | 39.8 | ||
| 42g | −36.06 ± 0.01 | 20.41 ± 0.01 | −1.55 ± 0.78 | −1.46 ± 0.78 | −10.8 ± 8.5 | −12.3 ± 8.5 | 39.9 | 33.9–65.5 | 00110 |
| 43g | −36.08 ± 0.01 | 20.41 ± 0.01 | −1.58 ± 0.03 | −1.61 ± 0.09 | −11.2 ± 0.3 | −13.9 ± 1.0 | 39.7 | 16.9–84.2 | 00111 |
| 44g | −36.14 ± 0.01 | 20.43 ± 0.01 | −1.62 ± 0.05 | −1.57 ± 0.03 | −11.6 ± 0.5 | −13.5 ± 0.3 | 39.5 | 25.2–84.7 | 00111 |
| 45g | −36.22 ± 0.01 | 20.46 ± 0.01 | −1.50 ± 0.09 | −1.61 ± 0.00 | −10.3 ± 1.0 | −13.9 ± 0.0 | 39.2 | 27.3–75.7 | 00111 |
| 46g | −36.26 ± 0.01 | 20.48 ± 0.01 | −1.47 ± 0.02 | −1.63 ± 0.04 | −10.0 ± 0.2 | −14.1 ± 0.4 | 39.0 | 23.9–56.9 | 00111 |
| 47g | −36.28 ± 0.01 | 20.48 ± 0.01 | −1.53 ± 0.14 | −1.62 ± 0.13 | −10.6 ± 1.5 | −14.0 ± 1.4 | 38.8 | 19.8–52.0 | 00111 |
| 48g | −36.25 ± 0.01 | 20.47 ± 0.01 | −1.63 ± 0.36 | −1.56 ± 0.25 | −11.7 ± 3.9 | −13.4 ± 2.7 | 38.6 | 15.4–48.1 | 00111 |
| 49g | −36.71 ± 0.01 | 20.30 ± 0.01 | −0.78 ± 0.73 | −2.08 ± 0.73 | −2.4 ± 8.0 | −19.1 ± 8.0 | 38.4 | 11.5–40.2 | 00011 |
| 50g | −36.74 ± 0.01 | 20.31 ± 0.01 | −0.62 ± 0.73 | −2.05 ± 0.73 | −0.7 ± 8.0 | −18.7 ± 8.0 | 38.2 | 8.4–31.1 | 00011 |
| 51g | −36.76 ± 0.01 | 20.32 ± 0.01 | −0.41 ± 0.73 | −2.14 ± 0.73 | 1.6 ± 8.0 | −19.7 ± 8.0 | 38.0 | 5.9–21.1 | 00011 |
| 52g | −36.75 ± 0.01 | 20.31 ± 0.01 | −0.47 ± 0.73 | −2.04 ± 0.73 | 1.0 ± 8.0 | −18.6 ± 8.0 | 37.8 | 4.1–11.6 | 00011 |
| 53g | −36.78 ± 0.01 | 20.33 ± 0.01 | −0.49 ± 0.73 | −2.02 ± 0.73 | 0.8 ± 8.0 | −18.4 ± 8.0 | 37.6 | 2.4–5.3 | 00011 |
| 54g | −36.79 ± 0.01 | 20.32 ± 0.03 | −0.39 ± 0.73 | −1.71 ± 0.73 | 1.9 ± 8.0 | −15.0 ± 8.0 | 37.4 | 1.4–2.2 | 00011 |
| avr | −35.45 ± 0.08 | 20.39 ± 0.02 | −1.08 ± 0.14 | −1.78 ± 0.07 | −5.7 ± 1.6 | −15.7 ± 0.7 | 38.6 | ||
| 55h | −38.67 ± 0.01 | 25.49 ± 0.01 | −2.96 ± 0.42 | 0.26 ± 0.42 | −26.3 ± 4.6 | 6.6 ± 4.6 | 39.0 | 4.2–6.3 | 11000 |
| 56h | −38.69 ± 0.01 | 25.52 ± 0.01 | −2.95 ± 0.42 | 0.20 ± 0.42 | −26.2 ± 4.6 | 5.9 ± 4.6 | 38.8 | 4.6–8.2 | 11000 |
| 57h | −38.74 ± 0.01 | 25.63 ± 0.02 | −3.39 ± 0.37 | 1.06 ± 0.71 | −31.0 ± 4.1 | 15.3 ± 7.8 | 38.6 | 2.5–10.1 | 11100 |
| avr | −38.70 ± 0.02 | 25.55 ± 0.03 | −3.10 ± 0.12 | 0.51 ± 0.23 | −27.8 ± 1.3 | 9.3 ± 2.5 | 38.8 |
*Column 1 lists the spot ID: “avr” means the average of the spots which represents the values of the feature. Columns 2 and 3 list the position offset in the RA and Dec direction, respectively, with respect to the source coordinate listed in table 2. Columns 4 and 5 list the relative proper motion with respect to to the reference spot 3a in the RA and Dec direction, respectively. Columns 6 and 7 list the internal proper motion in the RA and Dec direction, respectively, derived by |$\Delta v = (\mu -\bar{\mu }) \cdot a \cdot D$|. Here, μ is the relative proper motion listed in Column 3 and 4, |$\bar{\mu }$| is the average of the relative proper motion of |$(\bar{\mu }_\alpha \cos \delta , \bar{\mu }_\delta ) = (-0.56, -0.34)$| mas yr−1, a = 4.74 km s−1 kpc−1 mas−1 yr is the conversion constant from mas yr−1 to km s−1 at 1 kpc, and D = 2.31 kpc is the source distance (see text). Column 8 lists the LSR velocity. Column 9 lists the peak intensity in detected epochs. Column 10 lists the detected epochs: “1” for detection and “0” for non-detection.
The spatial distribution of H2O maser spots in W 48 A is shown in figure 2. The H2O masers are distributed within an area of 70 mas × 80 mas corresponding to 160 au × 180 au at a distance of 2.31 kpc. These maser spots are associated with the core H-2a identified via CH3CN line observations by (Rygl et al. 2014). The red-shifted maser spots are distributed on the eastern side and move towards the east direction, while the blue-shifted maser spots are distributed on the western side and move towards the west direction. The most red-shifted H2O maser feature is offset to the northeast and co-located with the most red-shifted 6.7 GHz CH3OH masers. Assuming the CH3OH masers to be tracing a rotating disk structure, then the most red-shifted H2O maser could be tracing the shocks associated with such rotation. These distributions and internal motions suggest the presence of a bipolar outflow emerging from the W 48 A core H-2a. The velocity dispersions in the RA, Dec, and line-of-sight directions are calculated to be (σvx, σvy, σvz) = (24.2, 10.3, 2.9) km s−1, respectively. The velocity dispersion in the RA direction is the largest.
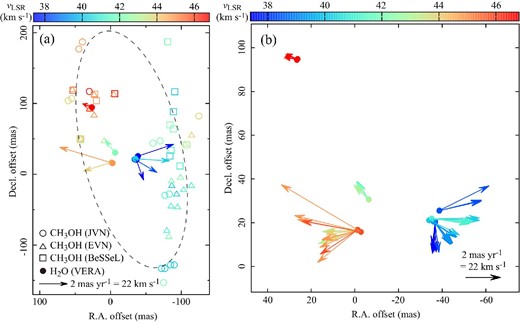
(a) H2O maser feature distribution with internal motion (filled circles with arrows); 2 mas yr−1 corresponds to 22 km s−1 at a distance of 2.31 kpc. The coordinate of the map origin is shown in table 2. The open circles, triangles, and squares represent the positions of the 6.7 GHz CH3OH masers observed by JVN (Sugiyama et al. 2008), EVN (Surcis et al. 2012), and BeSSeL (Reid et al. 2019), respectively. The ellipse (dashed line) is the best fit of the morphology of the distribution of the 6.7 GHz CH3OH masers, assuming that they are associated with a disk-like structure. (b) Enlarged view of the H2O maser area. The internal motions of individual H2O maser spots are shown.
The annual parallax of W 48 A was obtained to be 0.433 ± 0.026 mas from the combined fitting using the three spots at vLSR = 46.4, 43.9, and 42.0 km s−1 (3a, 18c, and 28d in table 4). These spots, selected from the features a, c, and d, were persistently detected for more than four epochs. The selected spots have high relative intensity and their structure was relatively compact. The result of the fitting is summarized in table 5. The parallax motions of the three spots are shown in figure 3. The phase-referencing images are shown in figure 4. The spot at 46.4 km s−1 was detected over all five epochs, while the spots at 43.9 and 42.0 km s−1 were detected in epochs 2 to 5 and 1 to 4, respectively. The post-fit residual rms is 0.033 mas in RA and 0.068 mas in Dec. The formal position error was estimated at each epoch and for each spot by σfor ≈ 0.5 · θbeam/(S/N). Its value is 0.020 mas in the average of all epochs and spots, 0.008 mas in the best case, and 0.076 mas in the worst case. The residual is two to four times larger than the formal error, and the reduced χ2 value is as large as 10, if we adopt only the formal error. This suggests that the true position errors are underestimated. Therefore, a systematic position error (σsys) of 0.030 mas in RA and 0.060 mas in Dec is added in quadrature to the formal position error to achieve a reduced χ2 value of unity. This adjusted error, |$\surd (\sigma _{\rm for}^2+\sigma _{\rm sys}^2)$|, is shown with the error bars of figure 3.
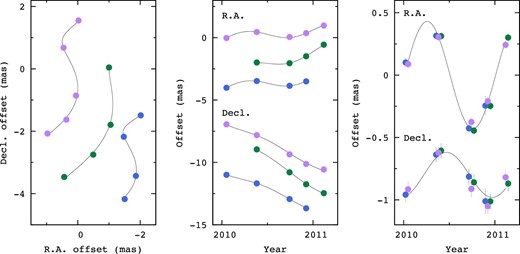
Parallax and proper motion fits of the maser spot at vLSR = 46.4 (purple), 43.9 (green), and 42.0 km s−1 (blue). Left panel: Positional variation on the sky. Middle panel: Positional variation versus time. Right panel: Same as the middle, but the proper motion has been removed, allowing the effects of only the parallax to be seen.
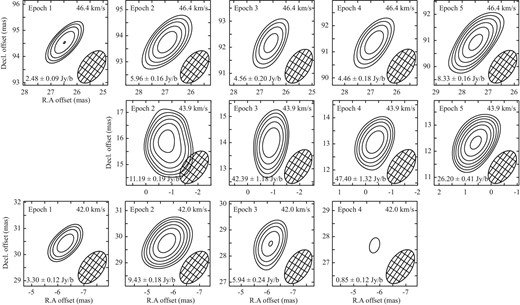
Phase-referencing images of H2O maser spots at vLSR = 46.4, 43.9, and 42.0 km s−1. The contours are plotted at the level of σrms × 5 × √2n (n = 1, 2, 3, …). The peak intensity, Ipeak, and the rms noise level, σrms, are shown in the bottom left corner of each panel by Ipeak ± σrms.
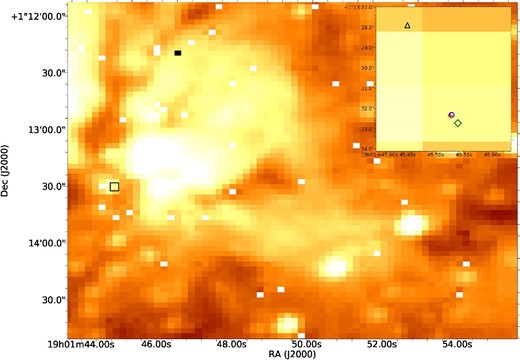
WISE band 1 (3.4 μm) image of W 48 A. The inset shows a zoomed image of the black rectangular region in the main plot. In the inset, the black open triangle, red cross, and blue open circle represent the 6.7 GHz CH3OH maser position of Caswell et al. (1995) also adopted by Minier, Booth, and Conway (2000) and Sugiyama et al. (2008), the new position reported by Reid et al. (2019), also consistent with Breen et al. (2015), and our H2O maser absolute position, respectively, while the green diamond indicates the position of the CH3CN emission (showing that core H-2a is a hot molecular core) reported by Rygl et al. (2014).
Parallax and proper motion fits.*
| v LSR | π | μαcos δ | μδ | Δαcos δ | Δδ | σα | σδ |
|---|---|---|---|---|---|---|---|
| (km s−1) | (mas) | (mas yr−1) | (mas yr−1) | (mas) | (mas) | (mas) | (mas) |
| 46.4 | 0.395 ± 0.016 | 0.78 ± 0.03 | −3.49 ± 0.11 | 26.48 ± 0.02 | 94.53 ± 0.08 | 0.020 | 0.091 |
| 43.9 | 0.458 ± 0.011 | 1.98 ± 0.03 | −4.40 ± 0.10 | −1.16 ± 0.01 | 15.65 ± 0.05 | 0.014 | 0.051 |
| 42.0 | 0.443 ± 0.013 | 1.00 ± 0.03 | −3.01 ± 0.04 | −6.40 ± 0.01 | 30.60 ± 0.02 | 0.021 | 0.026 |
| Combine | 0.433 ± 0.026 | 0.032 | 0.068 |
*Column 1 lists the LSR velocity. Column 2 lists the parallax. Columns 3 and 4 list the absolute proper motion in the RA and Dec direction, respectively. Columns 5 and 6 list the position offset in the RA and Dec direction, respectively, with respect to the source coordinate listed in table 2. Columns 7 and 8 list the post-fit residual in the RA and Dec direction, respectively.
The obtained parallax of 0.433 ± 0.026 mas corresponds to a distance of |$2.31^{+0.15}_{-0.13}$| kpc. This is close to the near kinematic distance of 2.6 kpc, which is estimated using vLSR = 43 km s−1 (Roshi et al. 2005), values for the Galactic constants R0 = 8.0 kpc, Θ0 = 230 km s−1, and a flat rotation curve (VERA Collaboration, et al. 2020). The parallax of this source was measured to be 0.306 ± 0.045 mas with VLBA 12 GHz CH3OH maser astrometry by Zhang et al. (2009). This was revised to 0.412 ± 0.014 mas by Wu et al. (2019). Our measured parallax is consistent with that of Wu et al. (2019) within the errors. The difference between our value and that of Wu et al. (2019) is 0.021 ± 0.030 mas (0.7 σ), and is not statistically significant.
The systemic proper motion was estimated by subtracting the internal motion from the absolute proper motion. In this estimation, the absolute proper motions of the three spots at vLSR = 46.4, 43.9, and 42.0 km s−1 in table 5 and their internal motions in table 4 (3a, 18c, 28d) were used. The systemic proper motion was estimated individually using the three spots to be (μαcos δ, μδ) = (0.22 ± 0.03, −3.83 ± 0.11), (0.26 ± 0.12, −3.85 ± 0.15), and (0.31 ± 0.04, −3.95 ± 0.06) mas yr−1, respectively. These are consistent within 0.1 mas yr−1, corresponding to 1 km s−1 at a distance of 2.31 kpc. To obtain the best estimate of the systemic proper motion, we took the average of the three spots, yielding (μαcos δ, μδ)sys = (0.26 ± 0.73, −3.87 ± 0.33) mas yr−1. The reported error is the standard error estimated by σ/√N, where σ is the standard deviation of the internal motions and N = 8 is the number of features. The proper motion of the 12 GHz CH3OH masers was measured to be (−0.68 ± 0.44, −3.60 ± 0.44) mas yr−1 (Wu et al. 2019). The difference between the systemic proper motions from our results and Wu et al. (2019) is (0.94 ± 0.85, −0.27 ± 0.55) mas yr−1, corresponding to 1 σ. Therefore, it is not statistically significant. The average LSR velocity of the eight maser features is calculated to be |$\bar{v}_{\rm LSR} = 41.9\pm 0.9$| km s−1. This is consistent with the LSR velocity of the core H-2a, 42.7 ± 0.2 km s−1, observed in the CH3CN emission (Rygl et al. 2014).
4 Discussion
4.1 H2O maser bipolar outflow in W 48 A core H-2a
4.2 The disk outflow system of W 48 A core H-2a
We compared our H2O maser map and the 6.7 GHz CH3OH maser maps obtained by JVN (Sugiyama et al. 2008), EVN (Surcis et al. 2012), and the BeSSeL (Reid et al. 2019) first epoch result.2 The BeSSeL result provides the absolute position of the CH3OH maser. Since the absolute positions of both H2O and CH3OH masers were obtained by phase-referencing observations using reference sources with accurate positions, we can align them with uncertainties of a few mas. The position reference source J1907+0127 was used in our observations. The four position reference sources J1857−0048, J1904+0110, J1903+0145, and J1907+0127 were used in the BeSSeL observations. The position uncertainties of these sources are approximately 0.1–0.5 mas according the VLBA Calibrator Source List.3 We superimposed the three CH3OH maser maps of JVN, EVN, and BeSSeL using the reference maser spot at vLSR = 43.6 km s−1 detected in three observations, and this is plotted at (Δαcos δ, Δδ) = (43, 50) mas in figure 2a.
From figure 2a, the orientation of the ellipse is close to perpendicular to the bipolar outflow traced by the H2O masers, whose axis, as indicated by the VVCM analysis, is directed approximately east–west. While there is no proper motion measurement of the 6.7 GHz CH3OH masers in W 48, there are examples showing that they trace rotating structures/disks (Sugiyama et al. 2014). We will be assuming that the 6.7 GHz CH3OH masers fitted with the ellipse in figure 2a are tracing a rotating disk-like structure in W 48 A core H-2a. We do have a small amount of evidence supporting the assumption. The most red-shifted H2O maser in figure 2a is located northeast of the rest of the H2O masers and close to the red-shifted CH3OH maser; this could be an indication that they share similar motion. Therefore, we suggest the existence of a disk outflow system in core H-2a. Assuming that gravitational force is dominant in the innermost part of the core, traced by the CH3OH masers, we used its spatial scale (200 mas corresponding to 460 au) and VLSR dispersion (4 km s−1) to derive the inner mass to be 8 |$M_{\odot}$|. The derived mass is consistent with the mass we obtained from the SED fitting.
The Wide-field Infrared Space Exploration (WISE) band 1 image of W 48 A is shown in figure 5 with the positions of its associated masers and CH3CN emission. Using the updated parallax distance of W 48 A and assuming an envelope model with embedded ZAMS star (Molinari et al. 2008), we fitted the spectral energy distribution (SED) of the W 48 A core H-2a (see figure 6). From our SED results, the YSO in core H-2a has a luminosity of 3100 ± 388 |$L_{\odot}$| and a mass of 9 ± 1 |$M_{\odot}$|. The difference between our SED fit and that of Rygl et al. (2014) is that they fitted the SED of core H-2a with no data point at wavelengths lower than 10 μm. Instead, we obtained 2MASS, UKIDSS, and WISE infrared magnitudes for the point sources associated with the core. Rygl et al. (2014) adopted the distance reported by Zhang et al. (2009) of 3.27 ± 0.49 kpc (which has been revised), while we used our distance which agrees with the revised distance.
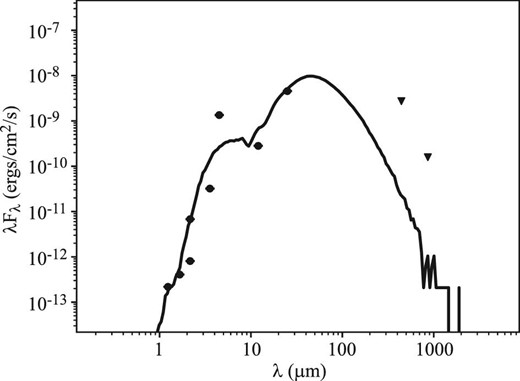
Spectral energy distribution of W 48 A core H-2a recalculated with the revised distance. Filled triangles are used for upper limits.
4.3 Galactic location of W 48 A
W 48 A appears to be located in the Sagittarius spiral arm. The distance of W 48 A (|$2.31^{+0.15}_{-0.13}$| kpc) is close to the distances of G035.02+00.34 (|$2.32^{+0.24}_{-0.20}$| kpc) and G035.19−00.74 (|$2.19^{+0.24}_{-0.20}$| kpc), which are two star-forming regions located near W 48 A on the sky and placed in the Sagittarius spiral arm (Wu et al. 2019). The peculiar motion of W 48 A is calculated to be (Us, Vs, Ws) = (1 ± 4, 5 ± 6, −15 ± 5) km s−1 from our astrometric results of |$D=2.31^{+0.15}_{-0.13}$| kpc, (μαcos δ, μδ)sys = (0.26 ± 0.73, −3.87 ± 0.33) mas yr−1, and |$\bar{v}_{\rm LSR} = 41.9\pm 0.9$| km s−1, using the method of Reid et al. (2009). In this calculation, the Galactic fundamental parameters of R0 = 8.0 kpc and Θ0 = 230 km s−1 (VERA Collaboration et al. 2020) and the solar motion of (|$U_{\odot}$|, |$V_{\odot}$|, |$W_{\odot}$|) = (10.3, 15.3, 7.7) km s−1 (Kerr & Lynden-Bell 1986) were used, and a flat Galactic rotation curve assumed. The derived peculiar motion of W 48 A is less than 15 km s−1.
5 Summary and conclusions
Our results highlight the importance of maser astrometric observations in the study of star formation. Based on our VERA observations, we make the following conclusions:
The trigonometric annual parallax of W 48 A core H-2a was measured to be 0.433 ± 0.026 mas, placing it at a distance of |$2.31^{+0.15}_{-0.13}$| kpc. Its peculiar motion was obtained as (Us, Vs, Ws) = (1 ± 4, 5 ± 6, −15 ± 5) km s−1.
The H2O masers cover an area of 70 mas × 80 mas, corresponding to 160 au × 180 au, and trace an east–west bipolar outflow.
W 48 A core H-2a likely hosts a disk outflow system, with the 6.7 GHz CH3OH masers tracing the disk and the H2O masers tracing the bipolar outflow.
Acknowledgements
We acknowledge all the VERA staff for both operating the VERA telescope and data correlation and providing all the necessary tables for the data calibration and imaging. JOC acknowledges support by the Italian Ministry of Foreign Affairs and International Cooperation (MAECI Grant Number ZA18GR02) and the South African Department of Science and Technology’s National Research Foundation (DST-NRF Grant Number 113121) as part of the ISARP RADIOSKY2020 Joint Research Scheme. We would also like to thank the anonymous referee for all the valuable comments that helped improve the manuscript. This publication makes use of data products from the Two Micron All Sky Survey, which is a joint project of the University of Massachusetts and the Infrared Processing and Analysis Center/California Institute of Technology, funded by the National Aeronautics and Space Administration and the National Science Foundation. The United Kingdom Infrared Telescope is operated by the Joint Astronomy Centre on behalf of the U.K. Particle Physics and Astronomy Research Council. This publication makes use of data products from the Wide-field Infrared Survey Explorer, which is a joint project of the University of California, Los Angeles, and the Jet Propulsion Laboratory/California Institute of Technology, funded by the National Aeronautics and Space Administration.
Footnotes
References
