


Abstract
We present observational data of a molecular line survey toward the nearby galaxies NGC 1068, NGC 253, and IC 342 at wavelengths of 3 mm (∼85–116 GHz) obtained with the Nobeyama 45 m radio telescope. Regarding IC 342, a line survey with high spectral resolution in the 3 mm region was reported for the first time. NGC 1068 is a nearby gas-rich galaxy with X-rays from an active galactic nucleus (AGN), and NGC 253 and IC 342 are nearby gas-rich galaxies with prototypical starbursts. These galaxies are useful for studying the impacts of X-rays and ultraviolet radiation on molecular abundances. The survey was carried out with a resulting rms noise level of a few mK (|$T\rm {_A^*}$|). As a result we could obtain almost complete data of these galaxies in the 3 mm region: we detected 19–23 molecular species, depending on the galaxies, including several new detections (e.g., cyclic-C3H2 in IC 342). We found that the intensities of HCN, CN, and HC3N relative to 13CO are significantly strong in NGC 1068 compared with those in NGC 253 and IC 342. On the other hand, CH3CCH was not detected in NGC 1068. We obtained these results with the narrow beam (|${15{^{\prime\prime}_{.}}2}$|–|${19{^{\prime\prime}_{.}}1}$|) of the 45 m telescope, among single-dish telescopes, and in particular selectively observed molecular gas close to the circumnuclear disk (CND) in NGC 1068. The present line intensities in NGC 1068 were compared with those obtained with the IRAM 30 m radio telescope already reported. As a result, the intensity ratio of each line was found to have information on the spatial distribution. Our observations revealed the line intensities and stringent constraints on the upper limit for the three galaxies with such a narrow beam; consequently, the present data will be a basis for further observations with high spatial resolution.
1 Introduction
Recent progress of radio telescopes and related instruments enabled us to conduct observations with high sensitivity and with wide-band spectroscopy. The progress of receivers, intermediate-frequency (IF) systems, analog-to-digital (AD) converters, and digital spectrometers achieved, for example, simultaneous observations of an ∼16 GHz bandwidth in total for the upper and lower sidebands. As a result, our knowledge concerning interstellar molecules and atoms is drastically increasing. Their spectral lines are indispensable as probes of astrophysical phenomena, particularly deep inside of dust-obscured regions. Such lines are also indispensable for astrochemical and astrobiological studies.
So far, about 200 molecular species have been detected in interstellar space and circumstellar envelopes [e.g., The Cologne Database for Molecular Spectroscopy (CDMS): Müller et al. 2001, 2005; Endres et al. 2016]. A significant fraction of them has also been detected in external galaxies. Galaxies show a wide range of environments such as active galactic nuclei (AGNs), starbursts, arm-interarms, bars, mergers, and different metallicities. The effects of such environments on molecular and atomic gas are very important in proving them, and in studying their chemistry, which seems to be different from those in quiescent object in our Galaxy. In particular, AGNs and starbursts are highly energetic phenomena, which do not exist in our Galaxy. The effects of such energetic environments on molecules and atoms are main topics to search for good probes of AGNs and/or starbursts, and to study molecular and atomic processes with X-rays and ultraviolet radiation. Many observational studies of such environments have already been reported (e.g., Jackson et al. 1993; Kohno et al. 1996, 2003; Usero et al. 2004; van der Werf et al. 2010; Nakajima et al. 2011; Rangwala et al. 2011; Aladro et al. 2013; Izumi et al. 2013; García-Burillo et al. 2014; Rangwala et al. 2014; Takano et al. 2014; Viti et al. 2014; Aladro et al. 2015; Martín et al. 2015; Nakajima et al. 2015; Imanishi et al. 2016; Izumi et al. 2016a; Kelly et al. 2017; Qiu et al. 2018).
In galaxies with AGNs, high HCN/CO and HCN/HCO+ intensity ratios have been reported (e.g., Jackson et al. 1993; Kohno et al. 1996, 2003; Krips et al. 2008; as well as related references in Takano et al. 2014). Recently, data of submillimeter lines of HCN, HCO+, and CS became available, and consequently Izumi et al. (2013, 2016a) concluded that the intensity ratios of HCN (J = 4–3)/HCO+ (J = 4–3) and/or HCN (J = 4–3)/CS (J = 7–6) are enhanced in circumnuclear disks (CNDs) around AGNs, based on data from their observations, the ALMA (Atacama Large Millimeter/submillimeter Array) archive and literature. In addition, recent high spatial-resolution observations with ALMA have revealed detailed distributions of the HCN/HCO+ intensity ratio. In the Seyfert galaxies NGC 1068 and NGC 1097, ratios are generally high in the CND, but the maximum ratios are seen at surrounding regions of the AGN positions, not at the AGN positions (García-Burillo et al. 2014; Viti et al. 2014; Martín et al. 2015). Salak et al. (2018) reported on a similar situation in the starburst galaxy NGC 1808 with a weak AGN. In Cen A the ratios are found to be not high (∼0.5) in its central regions (Espada et al. 2017). As shown above, the interpretation of ratios is still not straightforward.
Furthermore, Herschel observations opened new wavelength/frequency ranges of submillimeter and THz regions. Such observations show relatively strong intensities of reactive ions OH+ and H2O+ (e.g., van der Werf et al. 2010; Rangwala et al. 2011), and relatively high CH/CO ratios of the column density in galaxies with AGNs (Rangwala et al. 2014).
In addition, many studies of molecular abundances have been carried out regarding galaxies with starbursts, such as NGC 253 and M 82 (e.g., Mauersberger & Henkel 1991; Takano et al. 1995; Meier & Turner 2005; Martín et al. 2006; Meier & Turner 2012; Aladro et al. 2013, 2015; Meier et al. 2015). Recently, Aladro et al. (2015) carried out systematic line survey observations toward eight nearby galaxies with starbursts, AGNs, and ultra-luminous infrared emission to study the effects of nuclear activity. These studies have often been made with unbiased line-survey observations in the frequency axis. Line surveys are of fundamental importance in astronomy not only for a complete understanding of molecular and atomic abundances in representative sources, but also for finding new observational tools (spectral lines) for probing astrophysical phenomena.
We carried out a new line survey project in the 3 mm wavelength region between 2007 December and 2012 May (Takano et al. 2013) as one of the legacy projects with the Nobeyama 45 m radio telescope. The target objects of this project include Galactic and extragalactic sources. The project was subdivided into four sub-projects: (1) low-mass star forming region L 1527 (Yoshida et al. 2019), (2) interacting shocked region L 1157 B1 between the outflow and the ambient clouds (Sugimura et al. 2011; Yamaguchi et al. 2011, 2012), (3) infrared dark cloud G28.34+0.06 (Liu et al. 2013), and (4) galaxies NGC 1068, NGC 253, and IC 342 (Nakajima et al. 2011, 2018). The present sub-project surveyed lines from extragalactic objects. The purpose of this extragalactic sub-project has been to study molecular abundances in nearby galaxies with AGNs and/or starbursts. The data obtained from the galaxies were compared with one another to extract the characteristics of the effects of AGNs and starbursts. The additional purpose of this sub-project was to prepare for the ALMA early science by taking an inventory of spectral lines with accurate flux information: single-dish telescopes, such as the Nobeyama 45 m, can reveal accurate flux, even if the distributions of the spectral lines are spatially more extended than the telescope beam.
Three well-studied nearby galaxies, NGC 1068, NGC 253, and IC 342, were selected for this sub-project as gas-rich extragalactic sources (e.g., Young et al. 1995) with AGNs and/or starbursts. The effects of AGNs and starbursts were expected to be studied by comparing data among the central regions of these three galaxies, and then by comparing them with chemical model calculations. The three galaxies are briefly introduced below.
NGC 1068 (M 77) is a nearby (14.4 Mpc: Tully 1988; Bland-Hawthorn et al. 1997) well-studied Seyfert 2 galaxy. The CND consists of an eastern knot and a western knot with a separation of about 3″. This CND is surrounded by starburst ring/arms with a diameter of about 30″. So far, several line survey observations have been reported toward the center of NGC 1068 (Snell et al. 2011; Costagliola et al. 2011; Kamenetzky et al. 2011; Spinoglio et al. 2012; Aladro et al. 2013, 2015) using single-dish telescopes. In these observations, emission from the CND and the starburst ring/arms is not well separated owing to the relatively large telescope beams compared with the diameter of the starburst ring/arms (∼30″), except for the cases of the short wavelength regions of the two telescopes: Herschel observations (17″ at 194 μm, Spinoglio et al. 2012) and the IRAM 30 m observations (22″ at ∼112 GHz, Costagliola et al. 2011; 21″ at ∼116 GHz, Aladro et al. 2013, 2015). The relatively small beam of the 45 m telescope (|${15{^{\prime\prime}_{.}}2}$|–|${19{^{\prime\prime}_{.}}1}$|) in the 3 mm region can mainly observe the CND (see also section 2). The beam sizes of the Nobeyama 45 m and the IRAM 30 m radio telescopes are overlaid on the 13CO image of NGC 1068 in figure 1 for comparison.
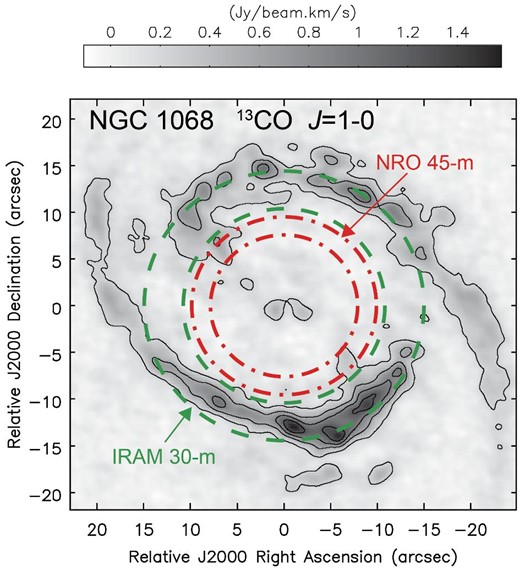
Distribution of the 13CO J = 1–0 line in the central region of NGC 1068 (Tosaki et al. 2017) overlaid with beam sizes at the 3 mm wavelength of the Nobeyama 45 m telescope (|${15{^{\prime\prime}_{.}}2}$|–|${19{^{\prime\prime}_{.}}1}$|, dot-dashed lines) and the IRAM 30 m telescope (21″–29″, dashed lines) (Aladro et al. 2015).
NGC 253 is a nearby (3.5 Mpc: e.g., Rekola et al. 2005, Mouhcine et al. 2005), almost edge-on barred spiral galaxy with prototypical starbursts. It has exceptionally rich gas with many molecular species in high abundance (e.g., Mauersberger & Henkel 1991). The first extragalactic line survey was reported by Martín et al. (2006) toward the center of this galaxy in the 2 mm wavelength region with the IRAM 30 m radio telescope. Subsequently, several line survey observations have been reported toward the center of NGC 253 using single-dish telescopes and ALMA (Snell et al. 2011; Rosenberg et al. 2014; Meier et al. 2015; Aladro et al. 2015). Although Snell et al. (2011) and Aladro et al. (2015) observed with two single-dish telescopes, the FCRAO 14 m and the IRAM 30 m, respectively, at the same wavelength of 3 mm with our observations, our beam (|${15{^{\prime\prime}_{.}}2}$|–|${19{^{\prime\prime}_{.}}1}$|) is smaller than their beams (47″–70″ for the FCRAO 14 m and 21″–29″ for the IRAM 30 m).
IC 342 is a nearby (3.93 Mpc: Tikhonov & Galazutdinova 2010), almost face-on, barred spiral galaxy with prototypical starbursts. This galaxy is also known to have rich molecular gas (e.g., Henkel et al. 1988). Limited line survey observations have been reported toward the center of IC 342 (Snell et al. 2011; Rigopoulou et al. 2013) using single-dish telescopes. Since IC 342 is situated in the northern celestial sphere, it cannot be observed with ALMA, but it can be observed with NOEMA (Northern Extended Millimeter Array) for example. Although Snell et al. (2011) observed with the FCRAO 14 m radio telescope in the same wavelength of 3 mm as in our observations, our beam is also smaller (∼1/3) than their beams, and our velocity resolution is about 10 times higher than their resolution (∼100 km s−1). Rigopoulou et al. (2013) observed with Herschel in the wavelength range of 196–671 μm. The properties of NGC 1068, NGC 253, and IC 342 are listed in table 1.
Properties of the observed galaxies.
| Galaxy | α (J2000.0) | δ (J2000.0) | Distance | V LSR | Morphology | Activity |
|---|---|---|---|---|---|---|
| (Mpc) | (km s−1) | |||||
| NGC 1068 | |${2^{\rm h}42^{\rm m}40{^{\rm s}_{.}}798}$|* | |${-00D00^{\prime }{47^{\prime\prime}_{.}938}}$|* | 14.4† | 1150* | SA(rs)b‡ | AGN and circumnuclear starburst |
| NGC 253 | |${0^{\rm h}47^{\rm m}33{^{\rm s}_{.}}3}$| § | |${-25D17^{\prime }{23^{\prime\prime}}}$| § | 3.5‖ | 230 | SAB(s)c‡ | Nuclear starburst |
| IC 342 | |${3^{\rm h}46^{\rm m}48{^{\rm s}_{.}}9}$| ♯ | |${68D05^{\prime }{46^{\prime\prime}_{.}0}}$| ♯ | 3.93** | 32†† | SAB(rs)cd‡ | Nuclear starburst |
The initial results of NGC 1068 and the entire line-survey project were already reported by Nakajima et al. (2011) and Takano et al. (2013), respectively. In this article, we present data for the three galaxies obtained with the 45 m telescope. We then discuss results immediately recognized from the data. Analyses employing rotational diagrams and the discussion on the molecular abundances were already reported in a separate paper by Nakajima et al. (2018) (hereafter, “analysis paper”).
2 Observations
The observations were carried out with the 45 m telescope at Nobeyama Radio Observatory (NRO)1 between 2009 February and 2011 May (three observational seasons). Out of the total allocated time ∼500 hr, about 204 hr were used for the main observations for the galaxies (about 87, 41, and 76 hr for NGC 1068, NGC 253, and IC 342, respectively) excluding the time for receiver tunings, telescope pointings, intensity calibrations, system troubles, and poor weather conditions. The frequency covered was from ∼85 to ∼116 GHz: however, there are some gaps in the frequency coverage owing to the reason of frequency settings. We tried to place the gaps in frequency regions without expected significant lines (except HN13C, see sub-subsection 4.1.3). Dual-polarization and sideband-separating (2SB) receivers T100 for the 3 mm region (Nakajima et al. 2008) were used. They can observe both linear polarizations (T100H and T100V) with two sidebands simultaneously, and with higher sensitivity than in the previous observations with the old SIS receivers. The system temperature was typically 150–300 K, including the atmospheric noise, depending on the elevation, weather, and frequency. The image-sideband rejection ratio was typically >10 dB. The ratio was measured by injecting an artificial signal from the top of the receiver optics after each tuning of the receivers (Nakajima et al. 2010). The beam sizes were |${15{^{\prime\prime}_{.}}2}$|–|${19{^{\prime\prime}_{.}}1}$| [half power beam width (HPBW)] for 115–86 GHz. An intensity calibration for obtaining the antenna temperature (|$T_{\rm A}^*$|) was carried out with the chopper-wheel method. We employed the main beam efficiencies of the T100 receivers for each year to convert the intensity scale to the main beam temperature (Tmb). The variation of the efficiency during our observational period was not significant: the main beam efficiencies at 86, 110, and 115 GHz in the final year of our observations were respectively 42%, 42%, and 36% for T100H, and 43%, 42%, and 36% for T100V.
Before 2010 December the backend used was digital spectrometers AC45 (Sorai et al. 2000). Eight spectrometers with the instantaneous bandwidth of 512 MHz each and with a resolution of 605 kHz were used simultaneously. Since 2010 December, a new IF system, new AD converters (4 GHz sampling rate with 3 bits), new digital spectrometers SAM45 (Spectral Analysis Machine for the 45 m telescope, sixteen spectrometers with an instantaneous bandwidth of ∼1.6 GHz each at the maximum bandwidth), and their new related softwares have been available. This new system (Kuno et al. 2011; Iono et al. 2012) accelerated our survey. SAM45 was made based on the technology of the correlator for the ALMA Atacama Compact Array (Morita Array) (Kamazaki et al. 2012). The resolution of SAM45 was set at 488.28 kHz. In addition, the Doppler tracking of the two sidebands for the 2SB type receivers was carried out by software after data acquisition. Such software was implemented when 2SB-type receivers were installed (Takahashi et al. 2010).
The central position of each galaxy was observed. The coordinates and the systemic velocities employed were as follows: RA(J2000.0) = |${2^{\rm h}42^{\rm m}40{^{\rm s}_{.}}798}$|,2 Dec(J2000.0) = |${-0D00^{\prime }{47^{\prime\prime}_{.}938}}$|, and 1150 km s−1 for NGC 1068 (Schinnerer et al. 2000); |${0^{\rm h}47^{\rm m}33{^{\rm s}_{.}}3}$|, |${-25D17^{\prime }{23^{\prime\prime}}}$| (Martín et al. 2006), and 230 km s−1 for NGC 253, |${03^{\rm h}46^{\rm m}48{^{\rm s}_{.}}9}$|, |${68D05^{\prime }{46^{\prime\prime}_{.}}}$| (Falco et al. 1999), and 32 km s−1 (Crosthwaite et al. 2000) for IC 342. These parameters are summarized in table 1. Position switching was employed. The integration time was 10–20 s for both the ON and OFF positions. The OFF positions were +5″ of the azimuthal angle for the three galaxies. The telescope pointing was checked every 1–1.5 hr by using the nearby SiO maser sources (v = 1 and/or 2, J = 1–0): o Cet for NGC 1068, R Aqr for NGC 253, and T Cep and IRC +60092 for IC 342. The pointing deviations were typically within 5″.
3 Data reduction
Data reduction was carried out using a package of software for the spectral lines, NewStar (Ikeda et al. 2001). All individual scans were visually inspected, and bad data (e.g., bad baselines) were flagged manually. The data were then integrated, baseline-subtracted, and binned to obtain the final spectra. Linear baselines were usually subtracted. The lines were Gaussian-fitted to obtain the intensity, line-of-sight velocity, and width (full width at half intensity). The integrated intensities were obtained by numerically summing up the intensity at each spectral channel with significant intensity above the baselines.
The obtained spectra are presented in this article. The spectra had already been analyzed to obtain the rotational temperatures and column densities in the analysis paper, where the beam dilutions were taken into account.
4 Results
Spectra in the range from ∼85 GHz to ∼116 GHz toward the nearby external galaxies NGC 1068, NGC 253, and IC 342 were obtained. The whole-compressed spectra of the three galaxies are presented in figure 2. The spectra were made with the velocity resolution of 20 km s−1 for NGC 1068 and NGC 253, and with 10 km s−1 for IC 342. As a result, the achieved rms noise levels (in |$T{\rm _A^*}$|) are 1.2–2.6 mK for NGC 1068, 1.8–4.8 mK for NGC 253, and 0.8–2.5 mK for IC 342.
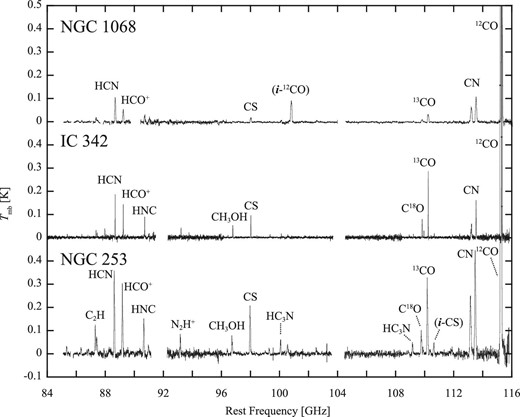
Compressed spectra obtained from the line survey observations toward NGC 1068, IC 342, and NGC 253. HCN, HCO+, and CN line intensities relative to 13CO are strong in NGC 1068 among the three galaxies. A line with “i” and a name of the molecule in parentheses indicates a signal of the corresponding molecule leaked from the other sideband of the receiver.
The spectra with the 4 GHz width are presented in figures 3–10. The line parameters, such as the intensity, are listed in tables 2–4, where the rest frequency was obtained from Lovas (2004). During line identification (see subsection 4.1), we found that lines of 12CO, 13CO, CN, CS, and CH3OH leaked out from the other sideband of the receivers. They are indicated in the spectra. In addition, the AD converters during the period of our observations generated spurious lines (a few moving features during observations along the frequency axis per each 1.6 GHz instantaneous bandwidth). Significant features of such spurious lines (sometimes broad features after integration) are also indicated in the spectra.
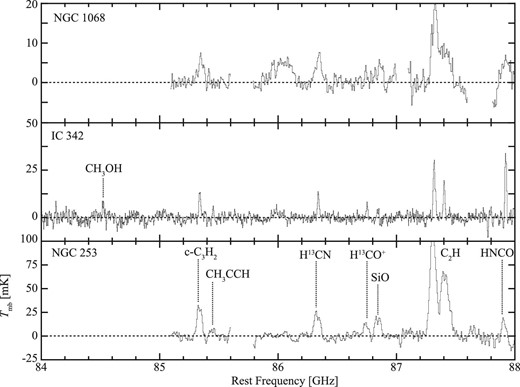
Spectra obtained from the line survey observations toward NGC 1068, IC 342, and NGC 253 at 84–88 GHz. A broad feature at ∼86.0 GHz in the spectra of NGC 1068 is caused by the baseline fluctuation.
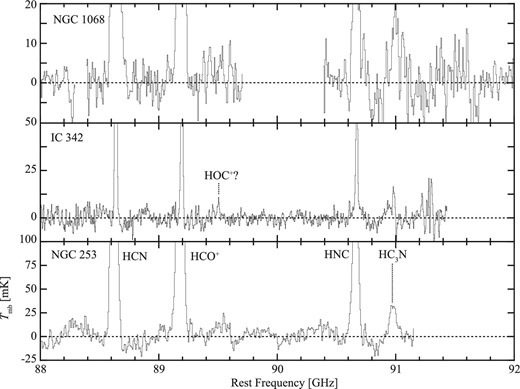
Spectra obtained from the line survey observations toward NGC 1068, IC 342, and NGC 253: 88–92 GHz.
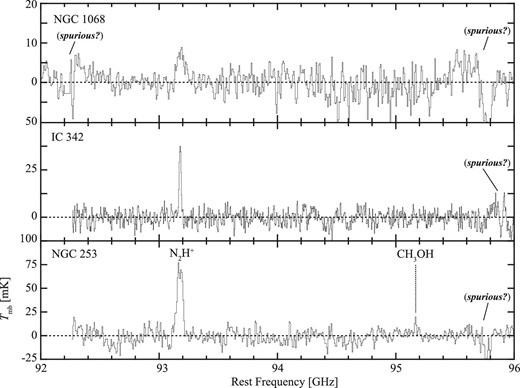
Spectra obtained from the line survey observations toward NGC 1068, IC 342, and NGC 253: 92–96 GHz.
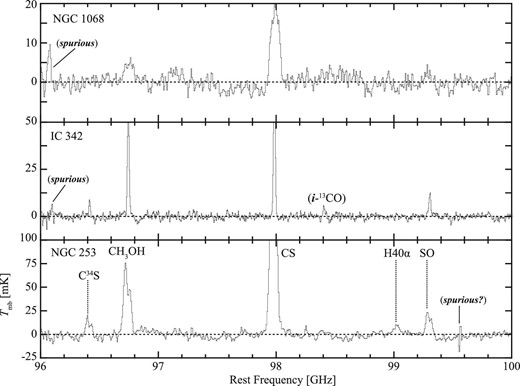
Spectra obtained from the line survey observations toward NGC 1068, IC 342, and NGC 253: 96–100 GHz. A line with “i” and a name of the molecule in parentheses indicates a signal of the corresponding molecule leaked from the other sideband of the receiver.
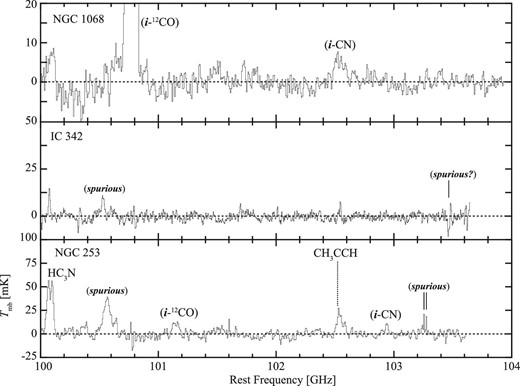
Spectra obtained from the line survey observations toward NGC 1068, IC 342, and NGC 253: 100–104 GHz. A line with “i” and a name of the molecule in parentheses indicates a signal of the corresponding molecule leaked from the other sideband of the receiver.
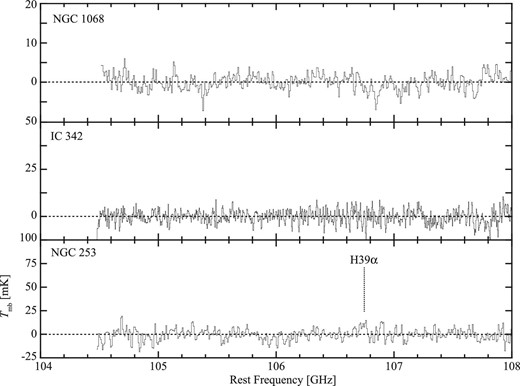
Spectra obtained from the line survey observations toward NGC 1068, IC 342, and NGC 253: 104–108 GHz.
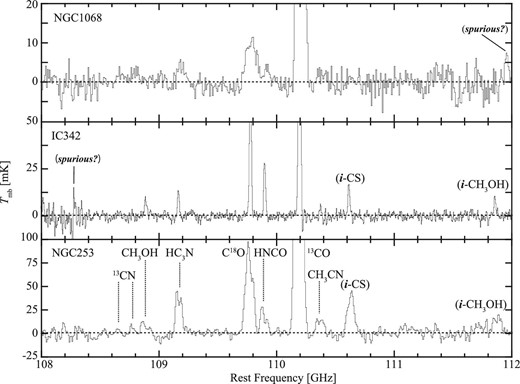
Spectra obtained from the line survey observations toward NGC 1068, IC 342, and NGC 253: 108–112 GHz. A line with “i” and a name of the molecule in parentheses indicates a signal of the corresponding molecule leaked from the other sideband of the receiver.
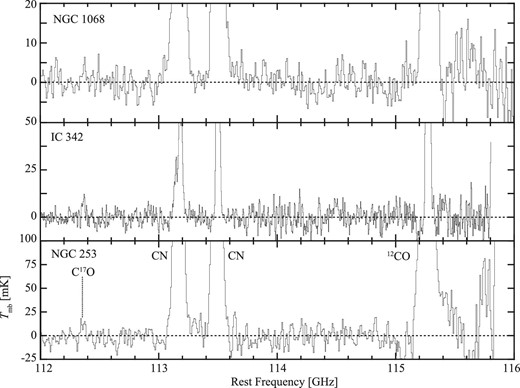
Spectra obtained from the line survey observations toward NGC 1068, IC 342, and NGC 253: 112–116 GHz.
Parameters of the lines in NGC 1068.*
| Frequency† | Molecule | Transition | T mb | V LSR | FWHM | ∫Tmbdv | Comment |
|---|---|---|---|---|---|---|---|
| (MHz) | (mK) | (km s−1) | (km s−1) | (K km s−1) | |||
| 85338.906 | cyclic-C3H2 | 21, 2–10, 1 | 5 ± 1 | 1148 ± 17 | 176 ± 40 | 1.2 ± 0.1 | |
| 85457.299 | CH3CCH | JK = 5K–4K | — | — | — | <0.14 | Upper limit |
| 86340.167 | H13CN | J = 1–0 | 7 ± 1 | 1126 ± 9 | 196 ± 20 | 1.4 ± 0.2 | |
| 86754.330 | H13CO+ | J = 1–0 | — | — | — | <0.15 | Upper limit |
| 86847.010 | SiO | J = 2–1 | 5 ± 1 | 1092 ± 19 | 176 ± 46 | 0.8 ± 0.2 | |
| 87316.925 | C2H | N = 1–0 | 20 ± 2 | 1117 ± 11 | 187 ± 24 | 4.4 ± 0.3 | Partially blended |
| J = 3/2–1/2 | with J = 1/2–1/2 | ||||||
| 87402.004 | C2H | N = 1–0 | 9 ± 1 | 1110 ± 31 | 313 ± 80 | 2.6 ± 0.3 | |
| J = 1/2–1/2 | |||||||
| 87925.238 | HNCO | 40, 4–30, 3 | 6 ± 3 | 1134 ± 57 | 250 ± 134 | 1.6 ± 0.2 | |
| 88631.847 | HCN | J = 1–0 | 108 ± 2 | 1117 ± 3 | 233 ± 6 | 26.4 ± 0.6 | |
| 89188.526 | HCO+ | J = 1–0 | 55 ± 2 | 1132 ± 5 | 236 ± 11 | 13.3 ± 0.7 | |
| 90663.574 | HNC | J = 1–0 | 28 ± 2 | 1138 ± 7 | 200 ± 17 | 5.6 ± 0.4 | |
| 90978.989 | HC3N | J = 10–9 | 16 ± 4 | 1078 ± 33 | 254 ± 77 | 4.7 ± 1.0 | |
| 93173.777 | N2H+ | J = 1–0 | 8 ± 1 | 1112 ± 16 | 245 ± 37 | 2.1 ± 0.4 | |
| 96741.377 | CH3OH | JK = 2K–1K | 5 ± 1 | 1104 ± 16 | 225 ± 40 | 1.1 ± 0.2 | |
| 97980.953 | CS | J = 2–1 | 22 ± 1 | 1123 ± 5 | 242 ± 12 | 5.4 ± 0.2 | |
| 99299.905 | SO | JN = 32–21 | 4 ± 1 | 1194 ± 26 | 219 ± 62 | 0.8 ± 0.2 | |
| 100076.385 | HC3N | J = 11–10 | 9 ± 2 | 1094 ± 19 | 171 ± 46 | 1.6 ± 0.3 | |
| 108651.297 | 13CN | N = 1–0 | 2 ± 1 | 1076 ± 21 | 191 ± 50 | 0.4 ± 0.1 | |
| J = 1/2–1/2 | |||||||
| 108780.201 | 13CN | N = 1–0 | 3 ± 1 | 1099 ± 21 | 197 ± 50 | 0.5 ± 0.1 | |
| J = 3/2–1/2 | |||||||
| 109173.638 | HC3N | J = 12–11 | 5 ± 1 | 1103 ± 16 | 229 ± 36 | 1.3 ± 0.1 | |
| 109782.173 | C18O | J = 1–0 | 11 ± 1 | 1127 ± 10 | 320 ± 24 | 3.3 ± 0.2 | |
| 109905.753 | HNCO | 50, 5–40, 4 | 4 ± 1 | 1133 ± 15 | 209 ± 48 | 0.9 ± 0.1 | |
| 110201.353 | 13CO | J = 1–0 | 36 ± 1 | 1143 ± 5 | 241 ± 11 | 8.9 ± 0.2 | |
| 110383.522 | CH3CN | JK = 6K–5K | 3 ± 1 | 1123 ± 31 | 287 ± 73 | 1.0 ± 0.2 | |
| 112358.988 | C17O | J = 1–0 | ∼5 | — | — | — | Tentative detection |
| 113191.317 | CN | N = 1–0 | 63 ± 1 | 1191 ± 3 | 275 ± 7 | 18.5 ± 0.3 | |
| J = 1/2–1/2 | |||||||
| 113490.982 | CN | N = 1–0 | 110 ± 2 | 1119 ± 2 | 239 ± 5 | 27.6 ± 0.4 | |
| J = 3/2–1/2 | |||||||
| 115271.202 | CO | J = 1–0 | 638 ± 16 | 1143 ± 3 | 237 ± 7 | 155 ± 1 |
*Errors correspond to 1σ.
†Frequencies are taken from Lovas (2004). In the case of a blended line owing to fine and/or hyperfine structures, a frequency of the strongest component is listed.
Parameters of the lines in NGC 253.*
| Frequency† | Molecule | Transition | T mb | V LSR | FWHM | ∫Tmbdv | Comment |
|---|---|---|---|---|---|---|---|
| (MHz) | (mK) | (km s−1) | (km s−1) | (K km s−1) | |||
| 85338.906 | cyclic-C3H2 | 21, 2–10, 1 | 33 ± 2 | 230 ± 6 | 155 ± 13 | 5.1 ± 0.4 | |
| 85457.299 | CH3CCH | JK = 5K–4K | 10 ± 2 | 208 ± 20 | 218 ± 48 | 2.3 ± 0.2 | |
| 86340.167 | H13CN | J = 1–0 | 24 ± 2 | 250 ± 8 | 184 ± 18 | 4.4 ± 0.7 | |
| 86754.330 | H13CO+ | J = 1–0 | 12 ± 4 | 268 ± 18 | 123 ± 43 | 1.6 ± 0.3 | |
| 86847.010 | SiO | J = 2–1 | 17 ± 2 | 227 ± 12 | 179 ± 28 | 3.0 ± 0.3 | |
| 87316.925 | C2H | N = 1–0 | 122 ± 3 | 252 ± 2 | 176 ± 6 | 24 ± 1 | Partially blended |
| J = 3/2–1/2 | with J = 1/2–1/2 | ||||||
| 87402.004 | C2H | N = 1–0 | 67 ± 2 | 200 ± 5 | 286 ± 14 | 19 ± 1 | |
| J = 1/2–1/2 | |||||||
| 87925.238 | HNCO | 40, 4–30, 3 | 23 ± 4 | 279 ± 11 | 172 ± 28 | 4.2 ± 0.7 | |
| 88631.847 | HCN | J = 1–0 | 341 ± 7 | 268 ± 2 | 194 ± 4 | 70 ± 1 | |
| 89188.526 | HCO+ | J = 1–0 | 279 ± 6 | 264 ± 2 | 200 ± 5 | 59 ± 1 | |
| 90663.574 | HNC | J = 1–0 | 146 ± 5 | 246 ± 3 | 195 ± 7 | 30 ± 1 | |
| 90978.989 | HC3N | J = 10–9 | 32 ± 3 | 251 ± 10 | 214 ± 24 | 7.6 ± 0.8 | |
| 93173.777 | N2H+ | J = 1–0 | 75 ± 5 | 237 ± 6 | 175 ± 13 | 14 ± 1 | |
| 95169.516 | CH3OH | 80, 8–71, 7A + | 11 ± 3 | 249 ± 21 | 170 ± 49 | 2.0 ± 0.3 | |
| 96412.961 | C34S | J = 2–1 | 17 ± 2 | 258 ± 10 | 158 ± 24 | 2.9 ± 0.3 | |
| 96741.377 | CH3OH | JK = 2K–1K | 70 ± 3 | 264 ± 5 | 202 ± 11 | 14.5 ± 0.3 | |
| 97980.953 | CS | J = 2–1 | 208 ± 5 | 245 ± 2 | 197 ± 5 | 42.8 ± 0.4 | |
| 99022.96 | H atom | H40α | 10 ± 1 | 224 ± 15 | 244 ± 35 | 2.5 ± 0.2 | |
| 99299.905 | SO | JN = 32–21 | 25 ± 2 | 247 ± 5 | 168 ± 12 | 4.2 ± 0.3 | |
| 100076.385 | HC3N | J = 11–10 | 55 ± 3 | 237 ± 5 | 176 ± 11 | 9.9 ± 0.2 | |
| 102547.983 | CH3CCH | JK = 6K–5K | 22 ± 3 | 283 ± 9 | 144 ± 22 | 2.8 ± 0.5 | |
| 106737.36 | H atom | H39α | 11 ± 4 | 219 ± 28 | 162 ± 66 | 2.0 ± 0.3 | |
| 108651.297 | 13CN | N = 1–0 | 6 ± 2 | 224 ± 14 | 98 ± 33 | 0.5 ± 0.3 | |
| J = 1/2–1/2 | |||||||
| 108780.201 | 13CN | N = 1–0 | 6 ± 1 | 234 ± 11 | 111 ± 23 | 0.9 ± 0.2 | |
| J = 3/2–1/2 | |||||||
| 108893.929 | CH3OH | 00, 0–1−1, 1E | 11 ± 2 | 289 ± 16 | 177 ± 37 | 1.9 ± 0.5 | |
| 109173.638 | HC3N | J = 12–11 | 42 ± 3 | 239 ± 6 | 166 ± 14 | 7.0 ± 0.3 | |
| 109782.173 | C18O | J = 1–0 | 90 ± 4 | 268 ± 4 | 198 ± 9 | 19 ± 1 | |
| 109905.753 | HNCO | 50, 5–40, 4 | 25 ± 3 | 281 ± 8 | 162 ± 20 | 4.2 ± 0.3 | |
| 110201.353 | 13CO | J = 1–0 | 299 ± 8 | 267 ± 2 | 196 ± 6 | 60.6 ± 0.4 | |
| 110383.522 | CH3CN | JK = 6K–5K | 16 ± 2 | 258 ± 12 | 189 ± 29 | 3.2 ± 0.2 | |
| 112358.988 | C17O | J = 1–0 | 13 ± 5 | 238 ± 23 | 121 ± 55 | 1.5 ± 0.6 | |
| 113191.317 | CN | N = 1–0 | 243 ± 6 | 293 ± 3 | 236 ± 6 | 61 ± 1 | |
| J = 1/2–1/2 | |||||||
| 113490.982 | CN | N = 1–0 | 422 ± 9 | 247 ± 2 | 200 ± 5 | 89 ± 1 | |
| J = 3/2–1/2 | |||||||
| 115271.202 | CO | J = 1–0 | 4241 ± 71 | 277 ± 2 | 193 ± 4 | 870 ± 3 | |
| 115556.253 | NS | J = 5/2–3/2 (2Π1/2) | — | — | — | — | Tentative detection |
| Partially blended with CO |
*Errors correspond to 1σ.
Parameters of the lines in IC 342.*
| Frequency† | Molecule | Transition | T mb | V LSR | FWHM | ∫Tmbdv | Comment |
|---|---|---|---|---|---|---|---|
| (MHz) | (mK) | (km s−1) | (km s−1) | (K km s−1) | |||
| 84521.206 | CH3OH | 5−1–40E | 7 ± 2 | 25 ± 9 | 67 ± 22 | 0.5 ± 0.1 | |
| 85338.906 | cyclic-C3H2 | 21, 2–10, 1 | 15 ± 1 | 30 ± 3 | 59 ± 7 | 0.9 ± 0.4 | |
| 85457.299 | CH3CCH | JK = 5K–4K | 8 ± 1 | 48 ± 5 | 53 ± 11 | 0.5 ± 0.1 | |
| 86340.167 | H13CN | J = 1–0 | 14 ± 1 | 33 ± 2 | 55 ± 6 | 0.8 ± 0.1 | |
| 86754.330 | H13CO+ | J = 1–0 | 7 ± 2 | 39 ± 5 | 49 ± 13 | 0.4 ± 0.1 | |
| 86847.010 | SiO | J = 2–1 | 8 ± 1 | 51 ± 6 | 71 ± 11 | 0.7 ± 0.1 | |
| 87316.925 | C2H‡ | N = 1–0 | 28 ± 2 | 32 ± 4 | 50 ± 5 | 2.1 ± 0.1§ | Partially blended |
| J = 3/2–1/2 | with F = 1–0 | ||||||
| F = 2–1 | |||||||
| 87328.624 | C2H‡ | N = 1–0 | 11 ± 4 | 32 ± 4 | 50 ± 5 | — | |
| J = 3/2–1/2 | |||||||
| F = 1–0 | |||||||
| 87402.004 | C2H‡ | N = 1–0 | 15 ± 5 | 32 ± 4 | 50 ± 5 | 1.1 ± 0.1§ | Blended with F = 0–1 |
| J = 1/2–1/2 | |||||||
| F = 1–1 | |||||||
| 87407.165 | C2H‡ | N = 1–0 | 6 ± 6 | 32 ± 4 | 50 ± 5 | — | |
| J = 1/2–1/2 | |||||||
| F = 0–1 | |||||||
| 87446.512 | C2H‡ | N = 1–0 | 4 ± 2 | 32 ± 4 | 50 ± 5 | 0.3 ± 0.1 | |
| J = 1/2–1/2 | |||||||
| F = 1–0 | |||||||
| 87925.238 | HNCO | 40, 4–30, 3 | 37 ± 4 | 39 ± 3 | 49 ± 6 | 1.9 ± 0.1 | |
| 88631.847 | HCN | J = 1–0 | 183 ± 3 | 33 ± 1 | 59 ± 1 | 11.6 ± 0.1 | |
| 89188.526 | HCO+ | J = 1–0 | 140 ± 3 | 33 ± 1 | 55 ± 2 | 8.4 ± 0.1 | |
| 89487.414 | HOC+ | J = 1–0 | ∼10 | — | — | — | Tentative detection |
| 90663.574 | HNC | J = 1–0 | 82 ± 3 | 29 ± 1 | 50 ± 2 | 4.5 ± 0.1 | |
| 90978.989 | HC3N | J = 10–9 | 17 ± 3 | 41 ± 5 | 58 ± 12 | 1.1 ± 0.2 | |
| 93173.777 | N2H+ | J = 1–0 | 40 ± 3 | 37 ± 2 | 60 ± 5 | 2.7 ± 0.2 | |
| 96412.961 | C34S | J = 2–1 | 10 ± 1 | 35 ± 2 | 40 ± 6 | 0.4 ± 0.1 | |
| 96741.377 | CH3OH | JK = 2K–1K | 53 ± 1 | 36 ± 1 | 53 ± 2 | 2.8 ± 0.1 | |
| 97980.953 | CS | J = 2–1 | 96 ± 1 | 32.6 ± 0.3 | 51 ± 1 | 5.1 ± 0.1 | |
| 99299.905 | SO | JN = 32–21 | 13 ± 1 | 30 ± 2 | 60 ± 5 | 0.9 ± 0.1 | |
| 100076.385 | HC3N | J = 11–10 | 17 ± 2 | 37 ± 2 | 38 ± 5 | 0.7 ± 0.1 | |
| 102547.983 | CH3CCH | JK = 6K–5K | 8 ± 1 | 54 ± 7 | 72 ± 16 | 0.6 ± 0.1 | |
| 108893.929 | CH3OH | 00, 0–1−1, 1E | 7 ± 1 | 35 ± 6 | 74 ± 15 | 0.6 ± 0.1 | |
| 109173.638 | HC3N | J = 12–11 | 13 ± 1 | 39 ± 3 | 53 ± 6 | 0.7 ± 0.1 | |
| 109782.173 | C18O | J = 1–0 | 77 ± 2 | 32 ± 1 | 51 ± 1 | 4.2 ± 0.1 | |
| 109905.753 | HNCO | 50, 5–40, 4 | 30 ± 2 | 40 ± 1 | 46 ± 3 | 1.5 ± 0.1 | |
| 110201.353 | 13CO | J = 1–0 | 294 ± 3 | 32.4 ± 0.3 | 52 ± 1 | 16.2 ± 0.1 | |
| 110383.522 | CH3CN | JK = 6K–5K | 8 ± 2 | 39 ± 6 | 66 ± 15 | 0.6 ± 0.1 | |
| 112358.988 | C17O | J = 1–0 | 9 ± 3 | 26 ± 9 | 65 ± 20 | 0.7 ± 0.2 | |
| 113191.317 | CN | N = 1–0 | 23 ± 3 | — | 74 ± 13 | — | 3 hyperfine components |
| J = 1/2–1/2 | 58 ± 2 | — | 103 ± 7 | 8.2 ± 0.3§ | are partially blended | ||
| 113490.982 | CN | N = 1–0 | 149 ± 4 | 21 ± 1 | 77 ± 2 | 12.2 ± 0.2 | |
| J = 3/2–1/2 | |||||||
| 115271.202 | CO | J = 1–0 | 2671 ± 18 | 32.3 ± 0.2 | 56.3 ± 0.4 | 160.0 ± 0.4 |
*Errors correspond to 1σ.
†Frequencies are taken from Lovas (2004). In the case of a blended line owing to fine and/or hyperfine structures, a frequency of the strongest component is listed.
‡Five detected fine and hyperfine components of C2H are Gaussian-fitted with a common VLSR and linewidth. The differences in frequency were fixed in the fitting.
§Sum of the (partially) blended features.
4.1 Line identification
4.1.1 Detected Lines
The detected lines were identified based on the literature of spectral line surveys, referred to in section 1, and also on databases of molecular spectroscopy, CDMS, JPL Catalog (Pickett et al. 1998), NIST Recommended Rest Frequencies (e.g., Lovas 2004), and Splatalogue (e.g., Remijan et al. 2016). We judged detections based not only on the intensity, but also on the quality of the data, such as the characteristics of the noise (random or not) and the characteristics of the baseline (flat or fluctuated).
Numbers of lines detected for NGC 1068, NGC 253, and IC 342 are 25, 34, and 31, respectively. As a result, their numbers of atomic and molecular species (distinguishing isotopologues) identified are 19, 24, and 22. Atomic hydrogen was the only atomic species detected recombination lines, and it was detected only in NGC 253.
The molecules detected in NGC 1068 for the first time in this survey (C2H, cyclic-C3H2, and H13CN) had already been reported in our paper of the initial results (Nakajima et al. 2011). In NGC 253, molecules detected in this survey have already been reported in the literature (e.g., Mauersberger & Henkel 1991; Aladro et al. 2015). In IC 342, cyclic-C3H2, SO, and C17O were detected for the first time.
4.1.2 Tentative detections
In NGC 1068 a possible weak, broad emission feature is seen at the frequency of the J = 1–0 transition of C17O (112358.988 MHz) (figure 10). Since its signal-to-noise ratio (SN) is low (∼2), this is a tentative detection. In NGC 253 the spectral profile of the J = 1–0 transition of 12CO has a shoulder at the higher frequency side (figure 10). It may correspond to the J = 5/2–3/2 transition (2Π1/2) of NS (115556.253 MHz), but the characteristic of the baseline seems not to be good. It is, therefore, a tentative detection in our spectra. Actually, this line was detected with ALMA in NGC 253 (Meier et al. 2015). In IC 342 a weak emission feature is seen at the frequency of the J = 1–0 transition of HOC+ (89487.414 MHz) (figure 4). Since its SN is low (∼2), this is a tentative detection. It is not clear whether this line is detected in NGC 1068 and NGC 253 in our spectra owing to the large noise and to the bad baseline, respectively. These lines are not counted as identified lines in sub-subsection 4.1.1
4.1.3 Important non-detections
CH3CCH is known to be abundant in some starburst galaxies (see subsection 5.1). In this work it was not detected in NGC 1068, but it was detected in NGC 253 and IC 342. The non-detection in NGC 1068 is already reported by Aladro et al. (2013, 2015) based on the IRAM 30 m telescope. In our observations with the NRO 45 m telescope, this result was further studied toward the CND with the smaller beam. Very recently, Qiu et al. (2018) reported on the detection of CH3CCH (JK = 50–40) with the IRAM 30 m telescope by conducting deep observations. These results are discussed in subsection 5.1.
In NGC 1068, Aladro et al. (2013) detected the J = 5/2–3/2 transition (2Π1/2) of NS with the IRAM 30 m telescope. In our spectra the frequency region of this line is noisy, and the line is not seen. In addition, Aladro et al. (2015) tentatively detected HCO (11, 0–01, 0), HN13C (J = 1–0), HOC+ (J = 1–0), and C34S (J = 2–1) in NGC 1068 with the IRAM 30 m telescope. The lines of HCO are not seen in our spectra, though they are generally not easy to detect due to blending with other lines, as mentioned above. In the case of HN13C the frequency of this line (87090.859 MHz) is in the gap of our spectra. HOC+ is not detected in our spectra, as mentioned above in sub-subsection 4.1.2. C34S is not detected in our spectra either, though the spectra show relatively low noise and a stable baseline. The emission of CS (J = 2–1) is known to be distributed in both the CND and the starburst ring based on interferometric observations (see subsection 5.4). Therefore, it is probable that the IRAM 30 m telescope is advantageous for the detection of C34S (J = 2–1), because its beam covers the emission from both the CND and the starburst ring.
4.2 Characteristics of integrated intensity (normalized by CS or 13CO)
Here, we compare the integrated intensities among the three galaxies to understand their immediately recognized characteristics. For this comparison, the integrated intensities normalized by the integrated intensity of CS (J = 2–1) or 13CO (J = 1–0) were used for canceling the difference in the amount of gas among these galaxies. CS is one of the typical molecules used to trace dense molecular gas. On the other hand, 13CO (J = 1–0) traces gas, including relatively low-density gas (e.g., Wilson et al. 2013), and its optical depth is much lower than that of 12CO.
The comparisons of the integrated intensities among the three galaxies normalized by those of CS and 13CO are shown in figures 11 and 12, respectively. In these figures, we noticed the strongest normalized integrated intensities of HCN, CN, etc. in NGC 1068. This characteristic is very remarkable, and is immediately recognized also in the compressed spectra shown in figure 2: The HCN and CN lines are significantly stronger than that of 13CO in NGC 1068. In addition to these figures, selected normalized integrated intensities of focused molecular lines in this section are listed in table 5.
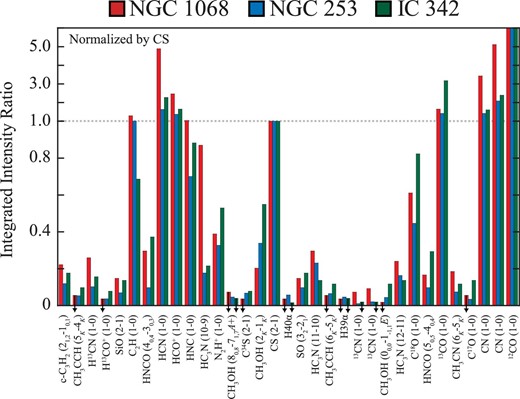
Comparisons in integrated intensity toward NGC 1068, NGC 253, and IC 342 (normalized by CS). The horizontal axis shows names of molecules and their transitions in order of transition frequency. The vertical axis shows integrated intensity ratios in two different linear scales (0 to 1.0 below the dotted line and 1.0 to 6.0 above the dotted line). The arrows indicate upper limits.
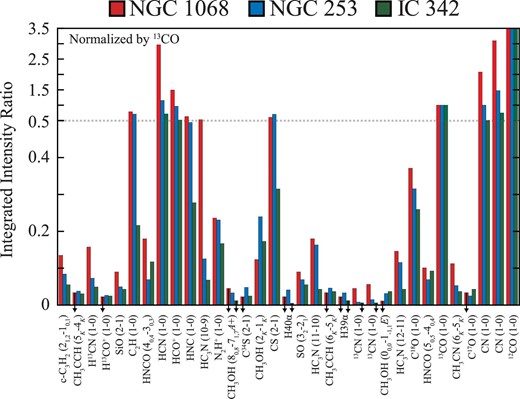
Comparisons in integrated intensity toward NGC 1068, NGC 253, and IC 342 (normalized by 13CO). The horizontal axis shows names of molecules and their transitions in order of transition frequency. The vertical axis shows integrated intensity ratios in two different linear scales (0 to 0.5 below the dotted line and 0.5 to 3.5 above the dotted line). The arrows indicate upper limits.
Normalized integrated intensity.*
| Molecule | Normalized by CS (J = 2–1) | Normalized by 13CO (J = 1–0) | ||||
|---|---|---|---|---|---|---|
| NGC 1068 | NGC 253 | IC 342 | NGC 1068 | NGC 253 | IC 342 | |
| HCN (J = 1–0) | 4.9 ± 0.2 | 1.64 ± 0.03 | 2.27 ± 0.05 | 2.97 ± 0.09 | 1.16 ± 0.02 | 0.72 ± 0.01 |
| HCO+ (J = 1–0) | 2.5 ± 0.2 | 1.38 ± 0.03 | 1.65 ± 0.04 | 1.49 ± 0.09 | 0.97 ± 0.02 | 0.52 ± 0.01 |
| H13CN (J = 1–0) | 0.26 ± 0.04 | 0.10 ± 0.02 | 0.16 ± 0.02 | 0.16 ± 0.02 | 0.07 ± 0.01 | 0.05 ± 0.01 |
| CN (N = 1–0, J = 3/2–1/2) | 5.1 ± 0.2 | 2.08 ± 0.03 | 2.39 ± 0.06 | 3.10 ± 0.08 | 1.47 ± 0.02 | 0.75 ± 0.01 |
| 13CN (N = 1–0, J = 3/2–1/2) | 0.09 ± 0.02 | 0.021 ± 0.005 | — | 0.06 ± 0.01 | 0.015 ± 0.003 | — |
| HC3N (J = 10–9) | 0.9 ± 0.2† | 0.18 ± 0.02 | 0.22 ± 0.04 | 0.5 ± 0.1† | 0.13 ± 0.01 | 0.07 ± 0.01 |
| HC3N (J = 11–10) | 0.30 ± 0.06 | 0.23 ± 0.01 | 0.14 ± 0.02 | 0.18 ± 0.03 | 0.163 ± 0.004 | 0.04 ± 0.01 |
| HC3N (J = 12–11) | 0.24 ± 0.02 | 0.16 ± 0.01 | 0.14 ± 0.02 | 0.15 ± 0.01 | 0.12 ± 0.01 | 0.04 ± 0.01 |
*Errors correspond to 1σ.
†Low signal-to-noise ratio of HC3N (J = 10–9) in NGC 1068.
4.2.1 HCN (J = 1–0) and H13CN (J = 1–0) intensities
The integrated intensities of HCN and H13CN normalized by that of CS or 13CO are significantly stronger in NGC 1068 than the corresponding intensities in NGC 253 and IC 342, as listed in table 5. Since the optical depth of H13CN is much lower than that of HCN (cf. Nakajima et al. 2018), the comparison using H13CN should be more reliable for comparing the HCN intensities among the galaxies, and furthermore for comparing the HCN column densities. The normalized integrated intensity of H13CN in NGC 1068 is about 1.6–3.2 times stronger than those in NGC 253 and IC 342 (table 5).
4.2.2 CN (N = 1–0) and 13CN (N = 1–0) intensities
The integrated intensities of CN normalized by those of CS and 13CO are significantly stronger in NGC 1068 than the corresponding intensities in NGC 253 and IC 342. This tendency is also seen for 13CN intensities between NGC 1068 and NGC 253 (non-detection in IC 342). Since the optical depth of 13CN is much lower than that of CN (cf. Nakajima et al. 2018), the comparison using 13CN should be more reliable, though the intensity is rather weak. The normalized integrated intensity of 13CN in NGC 1068 is about 4 times stronger than that in NGC 253 (table 5).
The CN N = 1–0 transition has both fine and hyperfine structures. Two lines owing to the fine structure (J = 3/2–1/2 and 1/2–1/2) are mainly resolved as broad lines of the external galaxies.
4.2.3 HC3N intensities
The three transitions (J = 10–9, 11–10, and 12–11) were detected in this survey. The integrated intensities of HC3N, normalized by those of CS and 13CO, are relatively stronger in NGC 1068 than the corresponding intensities in NGC 253 and IC 342 (table 5). Since the SN of the J = 10–9 transition in NGC 1068 is low (2–3), the reliability of the corresponding ratios is low.
The normalized integrated intensities of the J = 11–10 and 12–11 transitions in NGC 1068 are 1.1–1.5 times stronger than those in NGC 253. On the other hand, they are 1.7–4.5 times stronger than those in IC 342. Therefore, the characteristic of HC3N is relatively weak between NGC 1068 and NGC 253 when compared with those of HCN and CN. We can alternatively interpret that the normalized intensities in NGC 1068 and NGC 253 are similar, and that the normalized intensities in IC 342 are relatively low.
4.3 Characteristics of integrated intensity ratio
4.3.1 HCN (J = 1–0)/HCO+ (J = 1–0) integrated intensity ratios
The HCN/HCO+ integrated intensity ratios are listed in table 6. The obtained values are 1.98 ± 0.11, 1.19 ± 0.03, and 1.38 ± 0.02 for NGC 1068, NGC 253, and IC 342, respectively, where the errors are 1σ. Therefore, the ratio in NGC 1068 is significantly high among the three galaxies.
Integrated intensity ratio HCN/HCO+ and ratios between isotopic species.*
| Ratio (J = 1–0) | NRO 45 m (present study) | IRAM 30 m (Aladro et al. 2015) | |||
|---|---|---|---|---|---|
| NGC 1068 | NGC 253 | IC 342 | NGC 1068 | NGC 253 | |
| HCN/HCO+ | 1.98 ± 0.11 | 1.19 ± 0.03 | 1.38 ± 0.02 | 1.64 ± 0.03 | 1.18 ± 0.02 |
| H13CN/H13CO+ | >3.1† | 2.8 ± 0.7 | 2.0 ± 0.6 | —‡ | 1.2 ± 0.1 |
| CO/13CO | 17.4 ± 0.4 | 14.4 ± 0.1 | 9.88 ± 0.07 | 6.2 ± 0.1 | 13.2 ± 0.2 |
| CO/C18O | 47 ± 3 | 46 ± 2 | 38.1 ± 0.9 | 20.8 ± 0.5 | 48 ± 1 |
| HCN/H13CN | 19 ± 3 | 16 ± 3 | 15 ± 2 | 30 ± 3 | 14.5 ± 0.4 |
*Errors correspond to 1σ.
†An upper limit of the H13CO+ (J = 1–0) integrated intensity is used. See sub-subsection 4.1.3.
‡H13CO+ (J = 1–0) is not detcted [or blended with SiO (J = 2–1)].
The normalized integrated intensities of HCN and H13CN in NGC 1068 are significantly stronger than those in NGC 253 and IC 342 as mentioned in sub-subsection 4.2.1. On the other hand, the normalized integrated intensity of HCO+ in NGC 1068 is also significantly stronger than those in NGC 253 and IC 342, as listed in table 5, but it is not so strong as in the cases of HCN and H13CN. The characteristic of the HCN/HCO+ integrated intensity ratios mentioned above is caused by this balance of the intensities.
The H13CN/H13CO+ integrated intensity ratio should, in principle, be more reliable for studying the HCN/HCO+ integrated intensity ratios without the effect of the large optical depth and the HCN/HCO+ column density ratios, because the optical depths of the H13CN and H13CO+ lines are much lower (cf. Nakajima et al. 2018). The obtained ratios for NGC 1068, NGC 253, and IC 342 are >3.1, 2.8 ± 0.7, and 2.0 ± 0.6, respectively, as listed in table 6, where the errors are 1σ. Therefore, the ratio in NGC 1068 is high among the three galaxies, but the reliability is still insufficient due to the low SN of the lines and to non-detection of H13CO+ in NGC 1068.
4.3.2 Integrated intensity ratios between isotopic species (J = 1–0)
The integrated intensity ratios between isotopic species, CO/13CO, CO/C18O, and HCN/H13CN, are listed in table 6. The ratios calculated from the data of NGC 1068 and NGC 253, obtained with the IRAM 30 m telescope (Aladro et al. 2015), are also listed with those obtained with the NRO 45 m telescope. The ratios in NGC 1068 obtained with both of the telescopes look significantly different from each other. On the other hand, the ratios in NGC 253 obtained with both of the telescopes are similar. A possible reason is the difference of the central gas distribution between NGC 1068 and NGC 253. The details are discussed in sub-subsection 5.3.2.
In addition, the optical depth of each line can be calculated from the integrated intensity ratio of the isotopic species using the elemental isotopic ratios. The results were presented in the analysis paper (Nakajima et al. 2018).
4.4 Comparison of integrated intensities in NGC 1068, obtained with NRO 45 m and IRAM 30 m telescopes
NGC 1068 has the CND and the surrounding ring-like starburst region with a diameter of about 30″, as already mentioned in section 1 with figure 1. The observed line intensities should, therefore, sensitively reflect the coupling of the beams and the distributions of the molecules (in the CND and/or the starburst region).
Regarding this point of view, our line intensities were compared with those obtained with the IRAM 30 m telescope (Aladro et al. 2013, 2015) to estimate the distributions. The results of the integrated intensity ratios (NRO 45 m/IRAM 30 m) are presented in figure 13. In this figure, the ratios larger than unity indicate that the integrated intensities obtained with the 45 m telescope are stronger than the corresponding values obtained with the 30 m telescope. The ratios larger than unity are for the molecules 13CN, HC3N, H13CN, SO, CH3CN, CS, SiO, CN, HCN, and N2H+ in descending order. On the other hand, the ratios smaller than unity are for the molecules HCO+, 12CO, C2H, C18O, HNC, CH3OH, 13CO, and C34S in descending order.
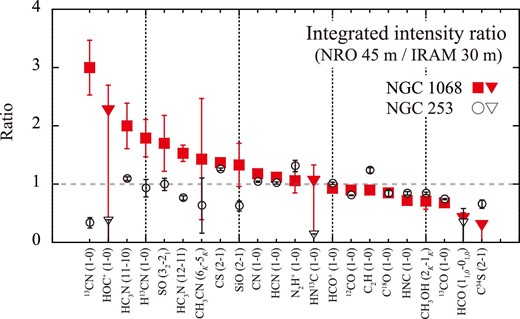
Comparison of integrated intensity ratios (NRO 45 m/IRAM 30 m) obtained with the Nobeyama 45 m and the IRAM 30 m telescopes toward NGC 1068 (filled squares and filled triangles) and NGC 253 (open squares and open triangles). Triangles indicate upper limits. The error was calculated based on both the 1σ error of the integrated intensity obtained with the 45 m telescope and the reported error of the integrated intensity obtained with the 30 m telescope. Regarding NGC 1068 the data of 12CO and 13CN taken with the 30 m telescope are from Aladro et al. (2013), and those of other molecules are from Aladro et al. (2015). Regarding NGC 253 the data taken with the 30 m telescope are from Aladro et al. (2015). Since the baselines in the frequency regions of HOC+ and HN13C obtained toward NGC 253 with the 45 m telescope seem not to be good, the upper limits of HOC+ and HN13C may be underestimated. (Color online)
Similar ratios in NGC 253 were overlaid in figure 13 for comparison. The ratios in NGC 253 are between ∼0.3–1.3 except their upper limits. This trend is significantly different from that in NGC 1068. The obtained ratios in both of the galaxies and their relation to the distributions are discussed later in subsection 5.4.
5 Discussion
5.1 Implication for detection and non-detection
Hydrogen recombination lines (H39α and H40α) are detected in NGC 253, but not detected in NGC 1068 and IC 342. In NGC 253 their detections have already been reported with single-dish telescopes and interferometers (e.g., Puxley et al. 1997; Martín et al. 2006; Aladro et al. 2015; Bendo et al. 2015; Meier et al. 2015; Nakanishi et al. 2015). In NGC 1068 no lines had been detected so far at millimeter or submillimeter wavelengths (Puxley et al. 1991; Izumi et al. 2016b), but very recently Qiu et al. (2018) reported on a detection of the H42α line at 85695.0 MHz, which is in the gap of our frequency settings, observed with the IRAM 30 m telescope. They suggested that the H42α line likely comes from the spiral arms, considering its central velocity and the results of Izumi et al. (2016b). In IC 342, recombination lines in the 5 and 6.7 GHz regions (C-band) and in the 34 and 35 GHz regions (Ka-band) were recently detected by averaging the spectra obtained with the Jansky Very Large Array (Balser et al. 2017).
It is interesting to note that the ionized gas in or close to the CND of NGC 1068 does not emit radio recombination lines with any detectable intensity, and that the H ii regions in the starburst regions in NGC 253 emit the significantly strong lines. The expected intensity of the lines at the submillimeter wavelength from the broad line region in NGC 1068 can be detectable according to a model (Scoville & Murchikova 2013), although no detection is reported so far as shown by Izumi et al. (2016b). The limited observations of the recombination lines in IC 342 could be due to the relatively small amount of the total activity of the H ii regions: the Hα emission in IC 342 is about 4.9 times weaker than that in NGC 253 (Kennicutt et al. 2008).
CH3CCH is often detected in starburst galaxies, but not in galaxies with AGNs (e.g., Mauersberger & Henkel 1991; Martín et al. 2006; Aladro et al. 2011a, 2011b, 2013, 2015). In the present study, CH3CCH is not detected in NGC 1068 with the relatively small beam of the NRO 45 m telescope as single-dish telescopes, but it is detected in NGC 253 and IC 342. Consequently, it is possible to conclude, more strictly than before, that the CND in NGC 1068 is not in a favorable condition to maintain the abundance of CH3CCH. Therefore, the molecule CH3CCH can be useful for judging whether the origin of activity in galaxies is the starburst region or AGN, as already discussed in Aladro et al. (2013, 2015) and Nakajima et al. (2018). As mentioned in sub-subsection 4.1.3, Qiu et al. (2018) reported on the detection of CH3CCH (JK = 50–40) with the IRAM 30 m telescope. In the context above, its emission may come from the starburst ring, which is covered with the beam of the IRAM 30 m telescope. High spatial-resolution data will be necessary for studying the distribution of CH3CCH.
Recently, Watanabe et al. (2017) and Nishimura et al. (2017) reported on mapping spectral line surveys toward the Galactic active star-forming regions W 51 and W 3(OH), respectively. They detected CH3CCH in the active regions, such as the hot core in W 51 and W 3(OH), but its line is found to be missing in the averaged spectra over all of the observed areas. The areas are 39 pc × 47 pc for W 51 and 9.0 pc × 9.0 pc for W 3(OH). On the other hand, our beam at 86 GHz corresponds to the linear scales of ∼320 pc for NGC 253 and ∼360 pc for IC 342. These results suggest that the starburst regions in NGC 253 and IC 342 are not masses of Galactic active star-forming regions, like W 51 and W 3(OH): the starburst regions are suggested to be masses of Galactic hot-core-like regions.
5.2 Characteristics of integrated intensity (normalized by CS or 13CO)
5.2.1 HCN (J = 1–0) and H13CN (J = 1–0) intensities
In NGC 1068, HCN (J = 1–0) is distributed mainly in the CND, as already reported based on interferometric observations including both the CND and the starburst ring in the field of view (e.g., Kohno et al. 2008) (see also subsection 5.4).
On the other hand, Meijerink et al. (2011) reported on model calculations in extreme environments with the effects of cosmic rays and mechanical heating (e.g., supernova-driven turbulence). According to their results, the HCN abundance does not show a strong response to enhanced cosmic-ray rates, but the abundance is enhanced by the mechanical heating.
These situations are almost in accord with the proposed high-temperature chemistry in another Seyfert galaxy NGC 1097, based on the enhanced HCN (J = 4–3) line intensity (Izumi et al. 2013). Since this galaxy has a low X-ray luminosity AGN (L2 − 10keV = 4.4 × 1040 erg s−1: Nemmen et al. 2006), the effect of X-rays is thought not to be efficient (cf. L2 − 10keV = 1 × 1043–1044 erg s−1 for NGC 1068: Iwasawa et al. 1997; Colbert et al. 2002).
Our results concerning the enhancement of the normalized intensity of HCN and H13CN in NGC 1068 could be also interpreted as the effect of these mechanisms above. One of the origins of mechanical heating in the CND in NGC 1068 could be an AGN-driven outflow, which was identified by García-Burillo et al. (2014), based on an analysis of the velocity field of CO (J = 3–2).
Izumi et al. (2013) proposed that the intensity ratio of HCN (J = 4–3)/CS (J = 7–6) can be used for knowing whether the power source of galaxies is AGN or starburst. Our intensities shown in the (2nd–4th) columns in table 5 are normalized by the intensities of CS (J = 2–1) instead of CS (J = 7–6). As already shown, the intensity ratios of HCN (J = 1–0)/CS (J = 2–1) in NGC 1068 are higher than those in NGC 253 and IC 342. Therefore, the intensity ratio of HCN/CS is generally useful, but we should note that the ratios obtained from the high excitation lines, HCN (J = 4–3)/CS (J = 7–6), are more sensitive to the excitation conditions than those obtained from the low excitation lines, HCN (J = 1–0)/CS (J = 2–1), as already discussed by Martín et al. (2015).
5.2.2 CN (N = 1–0) and 13CN (N = 1–0) intensities
The normalized integrated intensities of CN are significantly stronger in NGC 1068 than the corresponding intensities in NGC 253 and IC 342, as already mentioned in sub-subsection 4.2.2. The enhancement of the CN abundance in X-ray irradiated regions is predicted by model calculations (e.g., Krolik & Kallman 1983; Lepp & Dalgarno 1996; Harada et al. 2013). On the other hand, the CN abundance is not enhanced under high-temperature conditions (Harada et al. 2010, 2013). Therefore, the present results of the strong intensity of CN and 13CN can be mainly due to X-ray radiation. According to the ALMA observations of CN (N = 3–2) in NGC 1068 (Nakajima et al. 2015), which resolves the CND and the starburst ring, CN is distributed only in the CND. This result does not contradict the formation mechanism above. We are analyzing the N = 1–0 lines of CN in NGC 1068 obtained with ALMA, and the results will be presented elsewhere.
5.2.3 HC3N intensities
As explained in sub-subsection 4.2.3, the normalized integrated intensity of HC3N can be relatively strong in NGC 1068. According to model calculations in high-temperature and/or with AGN (Harada et al. 2010, 2013), the abundance of HC3N is high in the mid-plane in the CND shielded from X-ray radiation. The relatively strong HC3N intensity in the present study can be qualitatively explained by such models.
Aladro et al. (2015) carried out line survey observations with the IRAM 30 m telescope toward eight galaxies with starbursts, AGNs, and/or ultra-luminous infrared emission (ULIRGs), and reported that the abundances of HC3N are enhanced in Arp 220 and Mrk 231 in their sample of galaxies. They mentioned that this could be related to larger amount of dense gas and warm dust. Costagliola et al. (2011) also discussed that the emission of HC3N would be coming from hot-core-like regions based on line intensities obtained from their line survey observations toward 23 galaxies. These conditions may be similar to those in the CND in NGC 1068. On the other hand, HC3N is relatively not abundant in NGC 1068 in the observations of Aladro et al. (2015). The different results between the IRAM 30 m and the NRO 45 m telescopes could be due to the relatively small beam size of the 45 m telescope, which observes the CND more selectively. Actually, the HC3N lines (J = 11–10 and 12–11) were found to be concentrated in the CND based on the ALMA observations (Takano et al. 2014). The concentration in the CND would support the HC3N formation in the mid-plane.
5.3 Characteristics of integrated intensity ratio
5.3.1 HCN (J = 1–0)/HCO+ (J = 1–0) intensity ratios
As explained in sub-subsection 4.3.1, the HCN/HCO+ integrated intensity ratios obtained in NGC 1068 are significantly higher than those in NGC 253 and IC 342. This tendency is consistent with the results toward the central regions observed with the Nobeyama Millimeter Array (NMA) (Kohno et al. 2001). Our result with the 1σ error in NGC 1068, 1.98 ± 0.11, is significantly higher than the ratio of 1.64 ± 0.03 obtained with the IRAM 30 m telescope (Aladro et al. 2015) (table 6), because the NRO 45 m telescope is probing more selectively the central region, where the ratio is high as described below. These ratios in the central region, obtained with interferometers, are ∼2.3 (NMA with the beam size of |${6^{\prime\prime}_{.}3}$| × |${4^{\prime\prime}_{.}9}$|, Kohno et al. 2001) and ∼2.5 (Plateau de Bure interferometer with the beam size of |${6^{\prime\prime}_{.}6}$| × |${5^{\prime\prime}_{.}1}$|, Viti et al. 2014).
Meijerink, Spaans, and Israel (2007) reported on detailed model calculations for photon-dominated region (PDR) and X-ray-dominated region (XDR). HCN (J = 1–0)/HCO+ (J = 1–0) intensity ratios are included in their results. The ratios depend on the density and the column density: In high-density (>105 cm−3) and high-column-density (>1023 cm−2) conditions the ratios for the XDR regions are smaller than unity, which is not consistent with our results, if the emission lines are mainly coming from the XDR regions. Considering the situations mentioned above, the mechanical heating discussed in sub-subsection 5.2.1 could be an efficient mechanism to enhance the HCN abundance.
In the starburst galaxy NGC 253, the HCN/HCO+ integrated intensity ratios obtained with the NRO 45 m and the IRAM 30 m telescopes are similar, 1.19 ± 0.03 and 1.18 ± 0.02 (Aladro et al. 2015), respectively (table 6). Therefore, the situation is different from that in NGC 1068, and the ratio seems to be spatially rather uniform in the dense gas in NGC 253. In such a case, the ratio is expected to be insensitive to the beam sizes. Actually, Meier et al. (2015) reported that the HCO+/HCN intensity ratios are ∼1 in the regions 4–10, which they defined in the central |${35^{\prime\prime}}$| in NGC 253.
Another factor that affects the HCN/HCO+ integrated intensity ratios is metallicity. In low-metallicity galaxies, such as IC 10, Large Magellanic Cloud, and M 33, the HCN/HCO+ integrated intensity ratios (mainly from the J = 1–0 transition) are smaller than unity (e.g., Chin et al. 1997; Paron et al. 2014; Nishimura et al. 2016a, 2016b; Braine et al. 2017).
In the cases of NGC 1068, NGC 253, and IC 342, their oxygen abundances relative to hydrogen, 12 + log(O/H), are 8.87 (Kraemer et al. 2015), ∼8.5–9.0, and ∼8.3–9.25 (Vila Costas & Edmunds 1993, from their figure 2), respectively, where the solar value (solar photosphere) is 8.66 (Asplund et al. 2006). The nitrogen abundances relative to hydrogen, 12 + log(N/H), for NGC 1068, NGC 253, and IC 342 are 8.64 (Kraemer et al. 2015), ∼7.25–8.0, and ∼7.05–9.0 (Vila Costas & Edmunds 1993, from their figure 2), respectively, where the solar value (solar photosphere) is 7.78 (Asplund et al. 2006). The values in Kraemer et al. (2015) are based on X-ray observations in the central region (∼100″), and those in Vila Costas and Edmunds (1993) are based on optical observations toward giant H ii regions. The values of the oxygen abundance in NGC 253 and IC 342 show some scatter, but the averaged values in NGC 253 and IC 342 and the value in NGC 1068 are similar to the solar value. Furthermore, the values of the nitrogen abundances in NGC 253 and IC 342 also show some scatter, but the averaged values are similar to the solar value. On the other hand, the nitrogen abundance in NGC 1068 is likely to be higher than the solar value. In general, each galaxy has a gradient and scatter of the metallicity. Therefore, the effect of metallicity viewed with the beam size of the NRO 45 m telescope may not be significant. Observations with high spatial resolution are necessary for a further study of the effect of metallicity. The details are discussed in Nakajima et al. (2018).
Watanabe et al. (2014) carried out spectral line surveys toward the two positions (called P1 and P2) in the spiral arm of M 51 in the 3 mm and 2 mm bands. Their results can be used as one of the references for studies of molecular abundances in CNDs and starburst galaxies. The HCN (J = 1–0)/HCO+ (J = 1–0) integrated intensity ratios calculated from their data are 1.34 ± 0.07 for the P1 position and 1.23 ± 0.11 for the P2 position, where the errors are 1σ. These ratios are similar to those of the starburst galaxies, 1.19 ± 0.03 for NGC 253 and 1.38 ± 0.02 for IC 342 (table 6). Thus, the ratios may not significantly depend on the scale of the star-formation activities (starburst or not) in the case where there is no significant effects of mechanical heating.
5.3.2 Integrated intensity ratios between isotopic species (J = 1–0)
The integrated intensity ratios between isotopic species are listed in table 6, and already introduced in sub-subsection 4.3.2. The different ratios in NGC 1068 obtained with the NRO 45 m telescope and IRAM 30 m telescope, for example, 17.4 ± 0.4 and 6.2 ± 0.1 for CO/13CO, where the errors are 1σ, indicate that the distributions of the intensities of the isotopic species are different from each other. Such different distributions are actually found with high spatial-resolution data obtained with interferometers, including ALMA. The CO emission is distributed in both the CND and the starburst ring (e.g., Schinnerer et al. 2000), but 13CO and C18O show weak emission lines in the CND, and are mainly distributed in the starburst ring (e.g., Helfer & Blitz 1995; Papadopoulos et al. 1996; Takano et al. 2014; Tosaki et al. 2017). Therefore, the ratios with the small beam of the 45 m telescope are higher than those with the 30 m telescope. This situation is contrary to that in the case of the ratio HCN/H13CN. The ratio obtained with the 45 m telescope is lower than that obtained with the 30 m telescope. These ratios indicate that the distribution of HCN is expected to have a more significant detectable fraction in the starburst ring than that of H13CN. Detailed distributions of HCN and H13CN are necessary for directly interpreting this case.
On the other hand, the similar values in NGC 253 obtained with the two telescopes indicate that the distributions of the emission lines of the species are similar to each other (CO and 13CO, CO and C18O, HCN and H13CN). Actually, similar distributions between HCN and H13CN are reported based on high spatial-resolution observations with ALMA (Meier et al. 2015). The difference in situation between NGC 1068 and NGC 253 shown above is probably due to the existence of the CND, which significantly affects the molecular abundance and excitation, in NGC 1068.
5.4 Integrated intensity ratios in NGC 1068 between NRO 45 m and IRAM 30 m telescopes
The integrated intensity ratios (NRO 45 m/IRAM 30 m) in NGC 1068 are compared in subsection 4.4. The molecules with the ratios larger than unity are expected to be concentrated mainly in the CND, because such molecules are observed with a relatively small beam dilution with the small beam of the NRO 45 m telescope. On the other hand, the molecules with the ratios smaller than unity are expected to be distributed significantly in the starburst ring. Expectations are now growing that it is possible to directly study with high spatial-resolution data obtained with sensitive interferometers including ALMA.
Molecules with the ratios larger than unity and with their interferometric data available are actually found to be significantly concentrated in the CND: HC3N (J = 11–10, 12–11), SO (JN = 32–21), CH3CN (JK = 6K–5K) (Takano et al. 2014), CS (J = 2–1) (Tacconi et al. 1997; Takano et al. 2014; Tosaki et al. 2017), SiO (J = 2–1) (García-Burillo et al. 2010), and HCN (J = 1–0) (e.g., Kohno et al. 2008). The concentration density in the CND depends on the ratio. For example, the ratio is about 1.4 in the case of CS. The emission of CS is significantly concentrated in the CND, and in addition the emission is also clear enough to trace the starburst ring.
On the other hand, the molecules with ratios smaller than unity and with their interferometric data available are found to be distributed mainly in the starburst ring: 12CO (J = 1–0) (e.g., Schinnerer et al. 2000) and 13CO (J = 1–0) and C18O (J = 1–0) (e.g., Takano et al. 2014; Tosaki et al. 2017). C2H (N = 1–0) and CH3OH (JK = 2K–1K) also show ratios smaller than unity, and these molecular lines are found to be distributed significantly in both the CND and the starburst ring (García-Burillo et al. 2017 for C2H; Takano et al. 2014 and Tosaki et al. 2017 for CH3OH).
Nakajima et al. (2011) has already suggested that C2H (N = 1–0) is insusceptible to AGN, or is tracing cold molecular gas, rather than the X-ray irradiated hot gas based on their observations toward NGC 1068 and NGC 253 in an early stage of this line survey. Their suggestion does not contradict the discussion above. Furthermore, Aladro et al. (2015) has also mentioned the possibility that significant emission of C2H (N = 1–0) arises from the star-forming ring in NGC 1068 and NGC 7469, similarly in the case of NGC 1097 (Martín et al. 2015).
In the case of C34S (J = 2–1) the upper limit of the ratio is much lower than unity, which is not consistent with the ratio (∼1.4) of CS (J = 2–1). Since the intensity of CS (J = 2–1) in NGC 1068 is much weaker than those in NGC 253 and IC 342, the detection of C34S (J = 2–1) in NGC 1068 is rather difficult: the detection of C34S (J = 2–1) is tentative with the 30 m telescope, and C34S is not detected with the 45 m telescope. Therefore, high-quality data are necessary for studying the integrated intensity ratio of C34S in detail.
Based on the above discussion about the interferometric data, we demonstrate that estimates of the distributions using data obtained with the single-dish telescopes are possible. In figure 13 the integrated intensity ratios in NGC 253 are overlaid for comparison. In contrast to the ratios in NGC 1068, the ratios in NGC 253 are at around unity, which means that the variation of the ratios in NGC 253 is significantly smaller than that in NGC 1068. These results in NGC 253 probably indicate that there is no distinct structure comparable to that in NGC 1068, resolved with the beams of the NRO 45 m and/or the IRAM 30 m telescopes.
5.5 General comments for IC 342
This article reports on the first high-quality results of line-survey observations toward IC 342 in the 3 mm wavelength region, as mentioned in section 1. Generally, the intensities of lines show the same trend as those of NGC 253, as shown in figures 11 and 12. This trend may originate from the fact that both NGC 253 and IC 342 are starburst galaxies with no significant indication of the AGN. Non-detection of recombination lines in IC 342 indicates a lower activity of star-formation than that in NGC 253, as mentioned in subsection 5.1. Actually, the star-formation rate in the central ∼|${10^{\prime\prime}}$| region in IC 342 is reported to be ∼0.15 M⊙ yr−1 (Balser et al. 2017). This rate is much smaller than 1.73 ± 0.12 M⊙ yr−1 in the central |${20^{\prime\prime}}$| × |${10^{\prime\prime}}$| region in NGC 253 (Bendo et al. 2015). The star-formation rates in these galaxies were obtained based on observations of recombination lines and continuum emission, which are not affected by dust extinction.
The linewidths of non-blended lines in IC 342 are 38–74 km s−1 which are significantly smaller than the corresponding widths of 123–218 km s−1 in NGC 253. Note that these widths are severely affected by the SN of the lines. As generally known, the important factor for the difference in the linewidths is the inclination angle: 31° ± 6° (Crosthwaite et al. 2000) for IC 342 (nearly face-on) and |${78{^{\circ}_{.}}5}$| (Pence 1980, 1981) for NGC 253 (nearly edge-on).
5.6 Future prospects
In the present line survey observations, data of molecular gas in NGC 1068, NGC 253, and IC 342 in the 3 mm wavelength region were obtained with rather higher spatial resolution for single-dish telescopes. Higher spatial-resolution images with interferometers are essential for any further study by directly resolving the central structure such as the CND and the starburst ring in the case of NGC 1068. We have already obtained the corresponding imaging line survey data of NGC 1068 with ALMA, and the results will be published in the near future.
6 Summary
In the present line survey observations, data of molecular gas in the Seyfert galaxy NGC 1068 and the prototypical starburst galaxies NGC 253 and IC 342 in the 3 mm wavelength region were obtained. The results and discussion are summarized as follows:
The observations were carried out with the Nobeyama 45 m radio telescope and by using the wide-band observing system, which became available during our project. The beam size was |${15{^{\prime\prime}_{.}}2}$|–|${19{^{\prime\prime}_{.}}1}$|, which is rather small among single-dish telescopes. This beam size can mainly probe the circumnuclear disk (CND) in NGC 1068 selectively.
The numbers of lines detected for NGC 1068, NGC 253, and IC 342 were 25, 34, and 31, respectively. The numbers of atomic and molecular species (distinguishing isotopologues) identified for NGC 1068, NGC 253, and IC 342 were 19, 24, and 22, respectively. The hydrogen recombination lines were detected only in NGC 253.
The integrated intensities, normalized by that of CS (J = 2–1) or 13CO (J = 1–0), were compared among the galaxies. As a result, the normalized intensities of HCN (and H13CN) (J = 1–0), CN (and 13CN) (N = 1–0), and HC3N (e.g., J = 11–10) in NGC 1068 were found to be stronger than those in NGC 253 and IC 342 with our beam. These results were discussed based on already reported mechanisms of mechanical heating for HCN, effect of X-rays on CN, and the high-temperature mid-plane shielded from X-rays for HC3N.
The HCN (J = 1–0)/HCO+ (J = 1–0) integrated intensity ratios were found to be higher in NGC 1068 than those in NGC 253 and IC 342. Mechanical heating can be an important factor affecting the ratio. Along with the non-detection of CH3CCH in NGC 1068, but detection in NGC 253 and IC 342, these molecules are confirmed with our small beam to be good tracers to distinguish the power source in galaxies.
The present integrated intensities in NGC 1068 and those obtained with the IRAM 30 m radio telescope by Aladro et al. (2013, 2015) in NGC 1068 were compared (Nobeyama 45 m/IRAM 30 m) to estimate the spatial distributions of molecules. As a result, we demonstrated that the above ratios are useful for estimating the distributions of molecules in the CND and/or the starburst ring.
The first high-quality results of line survey observations toward IC 342 in the 3 mm wavelength region were reported in this study. Cyclic-C3H2, SO, and C17O were detected for the first time. Generally the relative intensities of lines show the same trend as those in NGC 253.
Acknowledgments
We are grateful to the members of the line survey project, which is one of the legacy projects with the Nobeyama 45 m telescope. We thank the staff members of Nobeyama Radio Observatory for their support of observations and for the development of the new wide-band observing system, which enabled a rapid survey of lines. In particular, we thank Ryohei Kawabe for his encouragement to this project. We thank Hirofumi Inoue for his contribution to the initial stage of this project. We also thank Nanase Harada for useful comments concerning the initial stage of the manuscript. We also acknowledge Tomoka Tosaki for sending the original reduced data for figure 1. This study was supported by the MEXT Grant-in-Aid for Specially Promoted Research JP20001003. We used excellent databases of molecular spectroscopy: CDMS, JPL Catalog, NIST Recommended Rest Frequencies, and Splatalogue. Data analysis was in part carried out on the open-use computer system at the Astronomy Data Center of the National Astronomical Observatory of Japan.
Footnotes
Nobeyama Radio Observatory is a branch of the National Astronomical Observatory of Japan, National Institutes of Natural Sciences.
References
