


Abstract
We report on possible interaction between multiple supernova remnants (SNRs) and the Northern Coalsack (NCS), which is a massive clump (∼1 × 10³ M⊙) in the Cygnus OB 7 cloud complex and is forming a massive Class 0 object. We performed molecular observations of the 12CO(J = 1–0), 13CO(J = 1–0), and C18O(J = 1–0) emission lines using the 45 m telescope at the Nobeyama Radio Observatory, and we found that there are four main-velocity components at VLSR ≃ −20, −6, −4, and 10 km s−1. The −6 and −4 km s−1 components correspond to the systemic velocities of NCS and the Cyg OB 7 complex, respectively, and the other velocity components originate from distinct smaller clouds. Interestingly, there are apparent correlations and anticorrelations among the spatial distributions of the four components, suggesting that they are physically interacting with one another. On a larger scale, we find that a group of small clouds belonging to the −20 and 10 km s−1 components are located along two different arcs around some SNRs including HB 21, which has been suggested to be interacting with the Cyg OB 7 cloud complex, and we also find that NCS is located right at the interface of the arcs. The small clouds are likely to be the gas swept up by the stellar wind of the massive stars that created the SNRs. We suggest that the small clouds aligned along the two arcs recently encountered NCS, and the massive star formation in NCS was triggered by the strong interaction of the small clouds.
1 Introduction
The Northern Coalsack (NCS) is a well-known dark, opaque condensation in the Cygnus region. Radio observations in the 1990s have revealed that NCS is a massive clump and is forming a massive Class 0 object at the center: this Class 0 object is very bright in the millimeter/radio continuum (e.g., McCutcheon et al. 1991; Jennes et al. 1995), and is accompanied by an H2O maser (Miralles et al. 1994) whose coordinates were found to be αJ1950.0 = |${21^{\rm h}07^{\rm m}46{^{\rm s}_{.}}65}$|, δJ1950.0 = |$+52^{\circ }{10^{\prime }22{^{\prime \prime}_{.}}8}$| (corresponding to αJ2000.0 = |${21^{\rm h}09^{\rm m}21{^{\rm s}_{.}}63}$|, δJ2000.0 = |$+52^{\circ }{22^{\prime }37{^{\prime \prime}_{.}}5}$|, and |$l={92{^{\circ}_{.}}6710}$|, |$b= {3{^{\circ}_{.}}0714}$|) by VLA measurements (Jennes et al. 1995). Based on millimeter-wave interferometric observations, Bernard, Dobashi, and Momose (1999) discovered that the Class 0 object, named GH2O 092.67+07, is associated with an extremely young and compact molecular outflow with a dynamical age of only ∼3500 yr and a radius of ∼8000 au. They also found that the circumstellar disk around the Class 0 object shows a clear collapsing motion with rotation. In addition, there is another young massive star creating a compact H ii region (IRAS 21078+5211) in NCS in the vicinity of the Class 0 object.
As we found in this paper, NCS has a molecular mass of ∼1 × 10³ M⊙ in total, which is typical of clumps forming young clusters (e.g., Saito et al. 2007; Shimoikura et al. 2013). According to our recent statistical studies of cluster-forming clumps (Shimoikura et al. 2016, 2018), the clump-scale collapsing motion with rotation as found toward NCS is commonly observed in an early stage of cluster formation. NCS is apparently a massive clump just after the onset of such dynamical infall, and will eventually form a star cluster.
NCS is located in the direction of a giant molecular cloud (GMC) near the Cygnus OB 7 association (e.g., Dame & Thaddeus 1985; Falgarone & Perault 1987), which we refer to as the Cyg OB 7 cloud complex, or more simply the Cyg OB 7 cloud, in this paper. Though their definite association has not been established well, NCS is probably a part of the Cyg OB 7 cloud complex, and we assume that NCS is located at the same distance as the complex (800 pc; Humphreys 1987).
In figure 1, we show the global distribution of the Cyg OB 7 cloud complex revealed by large-scale 13CO(J = 1–0) observations (Dobashi et al. 1994, 1996, 2014). The total mass of the Cyg OB 7 cloud complex derived from the 13CO data is ∼1 × 10⁵ M⊙. Other than NCS, there are a few known star-forming sites in the complex
corresponding to opaque regions catalogued by Lynds (1962), e.g., LDN 988 (e.g., Herbig & Dahm 2006; Movsessian & Magakian 2014), LDN 1003 (e.g., Aspin et al. 2009), and LDN 1004 (Dobashi et al. 2014), which are indicated in figure 1. Compared to the Orion A cloud with a similar molecular mass (e.g., Nagahama et al. 1998; Shimajiri et al. 2014, 2015; Nishimura et al. 2015), the Cyg OB 7 cloud is much less active in terms of star formation and is more turbulent (e.g., Dobashi et al. 1994). As a GMC, the Cyg OB 7 cloud should be in an intermediate state between the Orion A and the Maddalena cloud, which is very turbulent and does not form young stars (e.g., Maddalena & Thaddeus 1985). The Cyg OB 7 cloud complex and NCS are therefore precious targets for studying how massive star formation is initiated in GMCs.
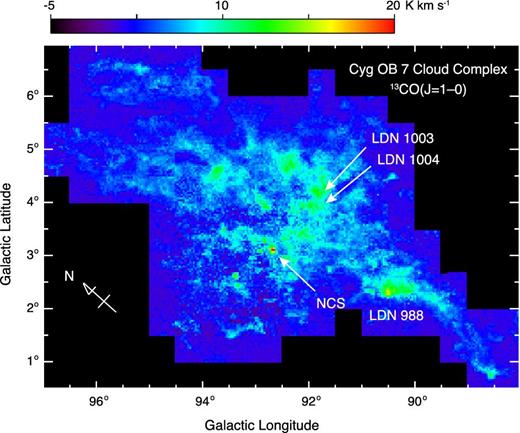
Integrated intensity map of the 13CO(J = 1–0) emission line revealing the entire extent of the Cyg OB 7 cloud complex. The map was obtained by the Nagoya 4 m telescope (Dobashi et al. 1994, 2014). The velocity range used for the integration is −25 < VLSR < 15 km s−1. The locations of NCS, LDN 988, LDN 1003, and LDN 1004 are indicated. (Color online)
The purpose of the present study is to reveal the mass distributions and velocity field in and around NCS, and to investigate what triggered the massive star formation in NCS. It is known that the typical radial velocity of NCS (VLSR = −6 km s−1; Bernard et al. 1999) is slightly different from that of the rest of the Cyg OB 7 cloud (−4 km s−1; Dobashi et al. 1994), and it is also known that there are some small clouds at very different velocities around NCS (Dobashi et al. 1994). These features in velocity may give us a hint to understand the origin and nature of NCS. It has been suggested by Tatematsu et al. (1990) that the Cyg OB 7 cloud could be interacting with the supernova remnant (SNR) HB 21. Their suggestion is very interesting, and the above features in velocities may have a relation with the possible interaction. However, firm and direct observational evidence is needed to confirm the possible influence of the SNR on the kinematics and star formation in NCS.
For the above purpose, we have carried out molecular observations with the 12CO(J = 1–0), 13CO(J = 1–0), and C18O(J = 1–0) emission lines using the 45 m telescope at the Nobeyama Radio Observatory (NRO). The observations were made as part of the “Star Formation Legacy Project” at the NRO (led by F. Nakamura) to observe star-forming regions such as Orion A, Aquila Rift, and M17. An overview of the project (Nakamura et al. 2019a) as well as detailed observational results for the individual regions are given in other articles (Orion A: Tanabe et al. 2019, Ishii et al. 2019, Nakamura et al. 2019b, H. Takemura et al. in preparation; Aquila Rift: Shimoikura et al. 2018, Kusune et al. 2019; M17: Shimoikura et al. 2019, Q. Nguyen Lu‘o’ng et al. in preparation, and Sugitani et al. 2019).
In this paper we report on the results of the observations toward NCS. We describe the observational procedures in section 2. We have revealed the velocity field around NCS, and also detected small clouds having distinct radial velocities. Interestingly, we found clear correlations and anticorrelations between their spatial distributions. We present these results in section 3. Based on the results, we discuss the origin of the small clouds as well as their influence on star formation in NCS in section 4. The main conclusions of this paper are summarized in section 5.
2 Observations
We performed molecular observations toward NCS with the 12CO(J = 1–0), 13CO(J = 1–0), and C18O(J = 1–0) emission lines using the 45 m telescope at the NRO during two periods: from 2013 March to May and from 2016 February to May. The receiver system named TZ (Nakajima et al. 2013) was used to obtain the spectral data during the first period, and another new receiver system named FOREST (Minamidani et al. 2016) was used during the second period. These receivers provided a total system noise temperature (Tsys) typically in the range 150–400 K at 110 GHz, depending on molecular lines and weather conditions. As a backend, we used Spectral Analysis Machine for the 45 m telescope (SAM45) digital spectrometers (Kamazaki et al. 2012) having 4096 channels and providing a velocity resolution of ∼0.02 km s−1 at 110 GHz.
Using the above systems, we performed mapping observations covering an area of ∼8′ × 8′ around NCS along the equatorial coordinates. The mapping observations were made using the on-the-fly (OTF) technique (Sawada et al. 2008). The obtained raw data were processed in a standard way using the software package NOSTAR available at the NRO. We resampled the data onto a 10′ grid using a Gaussian convolution function to produce a spectral data cube having an angular resolution of ∼23′ (FWHM) and a velocity resolution of 0.05 km s−1.
For the intensity calibration, we used the standard chopper-wheel method (Kutner & Ulich 1981) to scale our data in units of |$T_{\rm a}^*$|, and then further scaled the data in Tmb by applying the beam efficiency of the 45 m telescope at 110–115 GHz. The stability of the system was checked to be accurate to within 10% by observing a small region around GH2O 092.67+07 every day. The pointing accuracy was better than 5′, as checked by observing the SiO maser T-Cep every 2 hr during the observations.
The noise levels of the resultant spectral data are about ΔTrms = 1.3, 0.9, and 0.9 K for the 12CO, 13CO, and C18O emission lines, respectively, in units of Tmb for the velocity resolution of 0.05 km s−1.
3 Results
3.1 Molecular distributions and velocity components
We show the obtained intensity maps of the 12CO, 13CO, and C18O emission lines in figure 2. As seen in figure 3, the distribution of the optically thick 12CO emission line shows a round, cometary-shaped structure of NCS, whereas those of the optically thinner 13CO and C18O emission lines exhibit more filamentary structures. The signal-to-noise ratio is rather poor in the C18O map, but two main filaments extending northwestward can be clearly seen in the 13CO map.
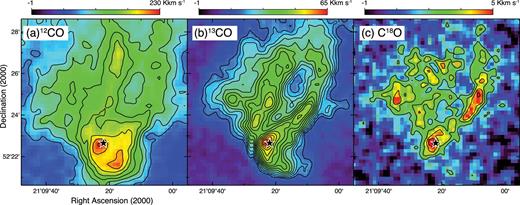
Integrated intensity maps of the (a) 12CO(J = 1–0), (b) 13CO(J = 1–0), and (c) C18O(J = 1–0) emission lines around NCS observed with the 45 m telescope. The velocity ranges used for integrations are −25 < VLSR < 15 km s−1, −11 < VLSR < 4 km s−1, and −10 < VLSR < −4 km s−1 for the 12CO, 13CO, and C18O emission lines, respectively. The star symbol denotes the position of the massive Class 0 object GH2O 092.67+03.07. The contours start from 80, 20, and 2 K km s−1 in steps of 20, 3, and 1 K km s−1 in panels (a), (b), and (c), respectively.
In the observed region, we detected five velocity components in the 12CO and 13CO emission lines. We refer to them as the −65, −20, −6, −4, and 10 km s−1 components, according to their typical LSR velocity (VLSR), in this paper. Figure 3 displays two examples of the observed spectra. According to the previous studies of the Cyg OB 7 cloud (Dobashi et al. 1994, 2014) and NCS (Bernard et al. 1999), the −4 km s−1 and −6 km s−1 components correspond to the characteristic velocities of the entire Cyg OB 7 cloud complex and the main body of NCS, respectively. The difference between the −6 km s−1 and −4 km s−1 components is rather small, and they are partially merged with each other, as seen in figure 3, suggesting a close connection between these two components. On the other hand, the −65, −20, and 10 km s−1 components are well separated in velocity. At a glance, these velocity components appear as if they are coming from more distant clouds unrelated to the Cyg OB 7 cloud complex, because the observed region is at low galactic latitudes (b ≃ 3°) and could be contaminated by many other clouds lying on the same line of sight. However, as we show in the next subsection, two of them (the −20 and 10 km s−1 components) are apparently interacting with NCS and the Cyg OB 7 cloud.
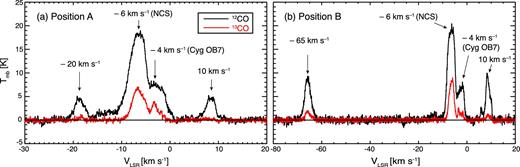
12CO (black lines) and 13CO (red lines) spectra observed at the positions A and B indicated in figures 4c and 4d. In the region observed with the 45 m telescope, we find five velocity components at VLSR ≃ −65, −20, −6, −4, and 10 km s−1. The emission lines at VLSR ≃ −6 km s−1 and −4 km s−1 originate from the main body of NCS and the Cygnus OB cloud complex, respectively.
We show the spatial distributions of the five velocity components in figure 4. In the figure, the −65, −6, and −4 km s−1 components are shown by the 13CO intensity, and the −20 and 10 km s−1 components are shown by the 12CO intensity because they are weak in 13CO.
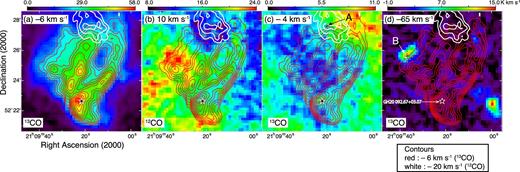
Distributions of the five velocity components identified in this study. The color scales in panels (a), (b), (c), and (d) show the intensities of the −6, 10, −4, and −65 km s−1 components, which are integrated in the velocity ranges −11 < VLSR < −4 km s−1, 7 < VLSR < 10 km s−1, −4 < VLSR < 1 km s−1, and −69 < VLSR < −62 km s−1, respectively. The common white contours represent the −20 km s−1 component integrated over the velocity range −20 < VLSR < −17 km s−1, and are drawn from 9 K km s−1 with a steps of 3 K km s−1. The red contours in panel (a), drawn from 21 K km s−1 in steps of 3 K km s−1, are also shown in the other panels for comparison. The 12CO data are used to create the maps for the −20 and 10 km s−1 components, and the 13CO data are used for the other components.
Under the assumption of local thermodynamic equilibrium (LTE), we estimated the molecular mass of each velocity component from the 12CO and 13CO data in a standard way (e.g., Shimoikura & Dobashi 2011; Shimoikura et al. 2018). We first fitted the observed 12CO and 13CO spectra with a single Gaussian function, and determined the excitation temperature Tex of the molecules from the fitted brightness temperature of the 12CO spectra assuming that the line is optically thick. We then estimated the optical depth of the 13CO emission line from the derived Tex and the fitted Gaussian parameters of the 13CO spectra to derive N(13CO), the column density of 13CO. We converted N(13CO) to N(H2), the column density of molecular hydrogen, using the empirical relation N(H2) =5 × 10⁵N(13CO) (Dickman 1985), and calculated the mass of the velocity components assuming that all of them are located at a distance of 800 pc. We repeated the above process in every pixel for every velocity component over the mapped region. For pixels where Tex estimated from the 12CO spectra is lower than 10 K, we assumed a flat excitation temperature of Tex = 10 K because the optically thick assumption for the 12CO line is not valid for such pixels. We note that the 13CO emission line for the −20 km s−1 component is too weak to perform a reliable mass estimate. For this velocity component, we therefore estimated N(H2) (and then the mass) from the 12CO intensity as N(H2) = XCOWCO, where WCO is the velocity-integrated intensity of the 12CO line in units of K km s−1 and XCO is a conversion factor taken to be 1.8 × 1020 cm−2 K−1 km−1 s (Dame et al. 2001).
We summarize the results of the above mass determination in table 1. Within the area shown in figure 4, NCS has a mass of ∼1 × 10³ M⊙, which is typical mass for dense massive clumps forming young clusters (e.g., Saito et al. 2007; Shimoikura et al. 2013, 2018). Except for the −4 km s−1 component originating from the Cyg OB 7 cloud, the other components at high velocities (−65, −20, and 10 km s−1) have much smaller masses, of the order of ∼10 M⊙, if they are located at the same distance as the Cyg OB 7 cloud complex. In the table, we also list the maximum values of Tex in each velocity component. A high value of Tex (≃ 50 K) is found for the −6 km s−1 component, which is due to the massive Class 0 object forming at the center of NCS and is consistent with the previous measurement (Bernard et al. 1999).
Masses of the velocity components.*
| Components | Max. Tex (K) | Mass (M⊙) |
|---|---|---|
| −65 km s−1 | 24 | 15 |
| −20 km s−1 | 10 | 17 |
| −6 km s−1 | 52 | 1022 |
| −4 km s−1 | 16 | 182 |
| 10 km s−1 | 16 | 34 |
| Components | Max. Tex (K) | Mass (M⊙) |
|---|---|---|
| −65 km s−1 | 24 | 15 |
| −20 km s−1 | 10 | 17 |
| −6 km s−1 | 52 | 1022 |
| −4 km s−1 | 16 | 182 |
| 10 km s−1 | 16 | 34 |
*The table lists the mass of each of the five components within the region displayed in figure 4. The mass of the −20 km s−1 component was calculated from the intensity of the 12CO emission line, and those of the other components were calculated from the column density of 13CO (see text). The second column lists the maximum value of the excitation temperature of each component estimated from the 12CO emission line.
3.2 Spatial correlations
Except for the −65 km s−1 component, we found that there are apparent spatial correlations and anticorrelations among the identified velocity components. As can be seen in figure 4, the anticorrelations are especially obvious. In panels (a)–(d) of figure 5, we indicate some of the correlations and anticorrelations we found by circles with white and pink broken lines, respectively, and describe them below.
The 10 and −6 km s−1 components (figure 5a)
The most intense bump of the −6 km s−1 component (red contours) coincides with a valley of the 10 km s−1 component (color scale), as denoted by the pink circle. In addition, one of the filaments of the −6 km s−1 component extending northwestward coincides with a ridge of the 10 km s−1 component around the white circle.
The 10 and the −20 km s−1 components (figure 5b)
The −20 km s−1 component (white contours) is detected in the northern part of the mapped region, and it clearly coincides with a hole of the 10 km s−1 component (color scale).
The −4 and 10 km s−1 components (figure 5c)
The 10 km s−1 component (orange contours) sits in a large valley of the −4 km s−1 component (color scale). The valley may also correspond to the intense region of the −6 km s−1 component [red contours in panels (a) and (d)].
The −6 and −20 km s−1 components (figure 5d)
The distributions of the −6 and −20 km s−1 components partially overlap, and a ridge of the −6 component (red contours) matches with a valley of the −20 km s−1 component (white contours).
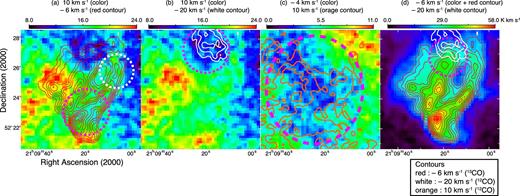
Circles with a thick pink broken line indicate apparent anticorrelations between (a) the 10 and −6 km s−1 components, (b) the 10 and −20 km s−1 components, (c) the −4 and 10 km s−1 components, and (d) the −6 and −20 km s−1 components. Circles with a thick white broken line in panel (a) indicate a correlation between the 10 and −6 km s−1 components. The red and white contours are the same as those in figure 4. The thick orange contours in panel (c) represent the 12CO intensity for the 10 km s−1 component integrated in the velocity range 7 < VLSR < 10 km s−1, and are drawn from 1 K km s−1 in steps of 5 K km s−1.
A clear anticorrelation of different velocity components was first detected in the Sgr B2 star-forming cloud complex by Hasegawa et al. (1994), which they interpreted as evidence of a cloud–cloud collision that induced the active star formation in the complex. Since then, cloud–cloud collisions have been found to be a common phenomenon that seems to significantly influence star formation in molecular clouds (e.g., Torii et al. 2011; Fukui et al. 2018; Nishimura et al. 2018).
Cloud–cloud collisions are often recognized through an anticorrelation between the intensity distributions of two velocity components, because one cloud penetrates the other making a “bump” and “hole” in their respective intensity maps. In addition to such anticorrelations, we propose that correlations like the one indicated in figure 5 a (by the circle with a white broken line) should be evidence of cloud–cloud collisions as well, because a diffuse cloud (e.g., an extended H i cloud with no or little CO) colliding with a compact molecular cloud should strip molecular gas from the compact cloud when they pass through each other, which we should see as correlation in the CO intensity maps. We suggest that the correlation in figure 5 a was created in this manner.
Numerical simulations of cloud–cloud collisions predict that there must be gas having intermediate velocities of the natal clouds around the interface (e.g., see figures 3 and 5 of Habe & Ohta 1992, illustrating a head-on collision of two clouds). We looked for such gas with intermediate velocities in the 12CO spectra around the region where we can recognize the correlations and anticorrelations, and found that there is 12CO emission with an intermediate velocity between the −20 and −6 km s−1 components. We display the spectrum in figure 3, and show the intensity distribution of the intermediate velocity component in figure 6a. We also show a position–velocity (PV) diagram in figure 6b taken across the intersection of the −20 and −6 km s−1 components. The 12CO emission with intermediate velocities bridging the two velocity components is obvious in the PV diagram. The existence of the intermediate velocity component lends support to our hypothesis of cloud–cloud collisions, at least between the −20 and −6 km s−1 components. However, we note that the intersection of the two components is the only place where we can see CO emission with this intermediate velocity. This may imply that the gas at intermediate velocity is not capable of emitting the CO lines in general, because the CO molecules are dissociated by the collision or because they cannot be excited due to the low gas densities.
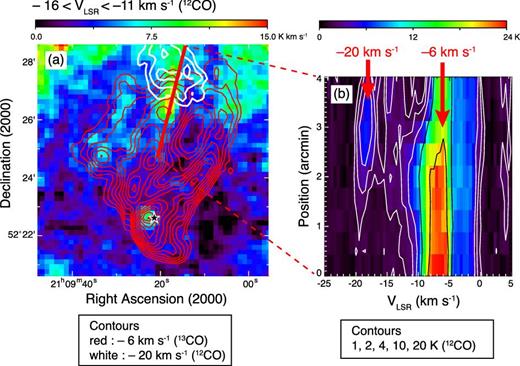
(a) Intensity distribution of the 12CO emission integrated over −16 < VLSR < −11 km s−1. The emission in this velocity range is evident around the position where the −6 km s−1 component (red contours) and −20 km s−1 component (white contours) show an anticorrelation. The red and white contours are the same as in figure 4. (b) Position–velocity diagram of the 12CO emission taken along the red cut in panel (a). The contours are drawn at 1, 2, 4, 10, and 20 K. A faint 12CO emission bridging the −20 and −6 km s−1 components is seen.
To summarize, we found correlations and anticorrelations among the spatial distributions of the −20, −6, −4, and 10 km s−1 components, which indicate that the four velocity components are interacting. We further found the CO emission with intermediate velocities located at the intersection between the −20 and −6 km−1 spatial distributions, which supports the idea of interactions between the two components.
On the other hand, the −65 km s−1 component is rather isolated, showing no clear correlations or anticorrelations with other components. We likely conclude that the −65 km s−1 component originates from a distant cloud unrelated to the Cyg OB 7 cloud complex.
4 Discussion
Among the four velocity components showing correlations and anticorrelations, the −6 km s−1 and −4 km s−1 components are known to originate from the massive NCS (∼1 × 10³ M⊙) and the Cyg OB 7 cloud (∼1 × 10⁵ M⊙), and thus the results in section 3 indicate that much smaller clouds at −20 km s−1 and 10 km s−1 are colliding with NCS and the Cyg OB 7 cloud. In the following, we investigate the nature and origin of these velocity components, as well as their influence on star formation in NCS and the Cyg OB 7 cloud.
Because the area observed with the 45 m telescope is quite limited, we first investigate the distributions of the −20 km s−1 and 10 km s−1 components on a larger scale using the 13CO data obtained with the Nagoya 4 m telescope (Dobashi et al. 1994, 2014). Figure 7 displays the locations of these components superposed on the intensity maps of the −4 km s−1 component tracing the Cyg OB 7 cloud and the −6 km s−1 component including NCS. For comparison, we show the locations of the SNRs catalogued by Green (2014).
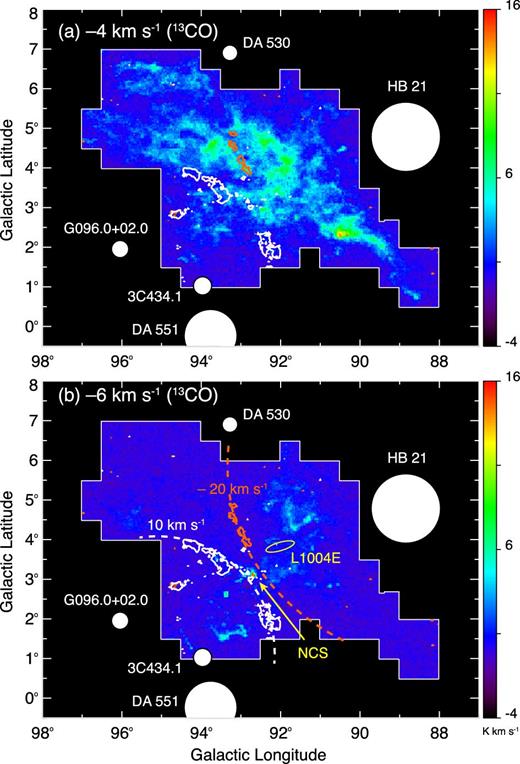
Distributions of the SNRs (Green 2014, white circles), the 10 km s−1 component (white contours), and the −20 km s−1 component (orange contours) shown on the large-scale 13CO maps of (a) the −4 km s−1 component tracing the Cyg OB 7 cloud complex, and (b) the −6 km s−1 component tracing NCS. The diameters of the white circles denote the catalogued sizes of the SNRs. The white and orange contours start from 1 K km s−1 in steps of 5 K km s−1. The velocity ranges used for the integration for the −20, −6, −4, and 10 km s−1 components are the same as those in figure 4. As shown in panel (b), the −20 and 10 km s−1 components are lying along the arcs denoted by the orange and white broken lines, and NCS is located at their interface. A yellow ellipse denotes the location of another dense clump in the Cyg OB 7 cloud complex (L1004E), which is inferred to be influenced by an external compressing force (Dobashi et al. 2014).
As can be seen in the figure, there are a number of small clouds belonging to the −20 km s−1 and 10 km s−1 components, and it is striking that the two components are apparently aligned along the arcs indicated by the orange and white broken lines, respectively. One of the arcs (for the −20 km s−1 component) is centered on HB 21, which has a diameter of ∼2° (Green 2014) and a dynamical age of ∼5 × 10³ yr (Lazendic & Slane 2006). This SNR has been suggested to be interacting with the Cyg OB 7 cloud (Tatematsu et al. 1990). Around the center of the other arc, there are also some SNRs such as DA 551, 3C 434.1, and G096.0+02.0.
If the small clouds are randomly distributed regardless of the SNRs in the area shown in figure 7, the probability of their aligning on the arcs centered on the SNRs by chance would be very small. We therefore interpret the coincidence between the arcs and the SNR locations as evidence of physical interaction. The small clouds along the arcs, however, are likely not influenced directly by the blast wave of the SNRs, because the sizes of the SNRs measured in the radio continuum (Green 2014) are much smaller than the radii of the arcs, and the small clouds along the arcs are well separated from the extents of the SNRs, which are expressed by the white circles in figure 7. We believe that the small clouds are the gas swept up and/or accelerated by the stellar wind of the massive stars that ultimately produced the SNRs. Note that a dynamical time scale of ∼4 Myr is obtained if we divide the apparent radii of the arcs (∼60 pc) by the velocity difference between the arcs and the Cyg OB 7 cloud (∼15 km s−1), which is compatible with the lifetime of O-type stars.
In addition, it is interesting to note that NCS is located at the interface of the two arcs. This suggests a likely scenario that the small clouds belonging to both of the −20 km s−1 and 10 km s−1 components recently encountered NCS, which should compress NCS sufficiently and trigger the gravitational collapse of the clump and then star formation therein. Such compression of molecular clouds by multiple shells or bubbles may be common on a galactic scale, and it must have a significant effect on star formation (e.g., Inutsuka et al. 2015).
The above scenario is favorable for finding a solution to the following two problems. One is the problem of “colliding filaments” in LDN 1004. In our earlier study, we identified a clump of ∼1 × 10⁴ M⊙ in LDN 1004 based on the near-infrared extinction maps (Dobashi 2011; Dobashi et al. 2013), and we named it “L1004E” (Dobashi et al. 2014; Matsumoto et al. 2015). Molecular observations with the C18O emission line revealed that the clump contains several massive filaments of a few times the mass of 100 M⊙ each, and that the filaments are colliding against one another. However, according to magnetohydrodynamic simulations we performed, massive filaments can form spontaneously in a collapsing clump, but collisions of the filaments scarcely happen, unless they are forced to collide by strong compression from the outside (see discussion in Dobashi et al. 2014). The question is: what is the compressing force? The clump L1004E is located just inside the arc for the −20 km s−1 component (see figure 7b), and the arc must have crossed L1004E recently, which is a likely answer to the problem of the unknown compressing force.
The other problem is the trigger for the onset of gravitational collapse of massive clumps to form star clusters. In our recent statistical study of cluster formation based on a sample of more than 20 massive clumps (Shimoikura et al. 2018), we found that, in terms of chemical compositions, the clumps forming only a few stars, which we classified as “Type 1” clumps, are significantly older than the other clumps already forming clusters, which we classified as “Type 2” and “Type 3” clumps (see figures 13 and 14 of their paper). At a glance, this finding is opposite to our expectation: we would expect that Type 1 clumps should be the youngest among the Type 1–Type 3 clumps and will eventually form clusters to turn into Type 2 clumps. We believe that the puzzling chemical compositions of the Type 1 clumps mean that most of the Type 1 clumps are actually old, being gravitationally stable for a long time (due to cloud-supporting force, e.g., by the magnetic field), and they can start collapsing when the equilibrium is broken by chance, e.g., by a sudden increment of the external pressure due to compression by SNRs or stellar wind from massive stars. In other words, such external triggers may be needed for contraction of massive clumps to form clusters. However, it should be very difficult to find a massive clump just after the onset of contraction because of their very short free-fall time (∼105 yr). NCS should be one of such rare examples, and we suggest that this kind of interaction between massive clumps and SNRs and/or stellar wind of massive stars may be one of the major sources to trigger the gravitational collapse of massive clumps to form star clusters.
5 Conclusions
We performed molecular observations of the Northern Coalsack (NCS) in the Cyg OB 7 cloud complex using the 45 m telescope at the Nobeyama Radio Observatory (NRO), and we investigated the global molecular distributions and velocity field of NCS. The main conclusions of this paper can be summarized in the following points.
We mapped an area of ∼8′ × 8′ around NCS with the 12CO(J = 1–0), 13CO(J = 1–0), and C18O(J = 1–0) emission lines. Based on the 12CO and 13CO data, we estimated the total molecular mass of NCS to be ∼1 × 10³ M⊙ within the mapped region shown in figure 4.
We found that there are five velocity components in the mapped region, which we named −65, −20, −6, −4, and 10 km s−1 components after their typical LSR velocities. The −6 and −4 km s−1 components correspond to the main body of NCS and the Cyg OB 7 cloud complex, respectively. The −20 and 10 km s−1 components trace small clouds around NCS, and we found that there are apparent correlations and anticorrelations among the distributions of the −20, −6, −4, and 10 km s−1 components, indicating that these clouds are interacting with one another. The origin of the −65 km s−1 component is unknown, and it may originate from a distant cloud unrelated to the Cyg OB 7 cloud complex.
We investigated the distributions of the −20 and −4 km s−1 components on a large scale, and found that clouds belonging to the velocity components are aligned along two arcs. Interestingly, around the center of the arcs there are supernova remnants (SNRs), including HB 21, which has been suggested to be interacting with the Cyg OB 7 cloud complex. We found that NCS is located right at the intersection of the arcs. We suggest the −20 and 10 km s−1 components are tracing small clouds swept up by the stellar wind of the massive stars that created the SNRs, and that they are currently crossing the NCS region, producing strong compression and triggering gravitational collapse and subsequent high-mass star formation.
Acknowledgments
This work was financially supported by JSPS KAKENHI grant numbers JP17H02863, JP17H01118, JP26287030, and JP17K00963. The 45 m radio telescope is operated by NRO, a branch of NAOJ. YS received support from the ANR (project NIKA2SKY, grant agreement ANR-15-CE31-0017).
